
A Simple Field Tapping Test for Evaluating Frequency Qualities of the Lower Limb Neuromuscular System in Soccer Players: A Validity and Reliability Study


 , and
, and 
Abstract
:1. Introduction
2. Materials and Methods
2.1. Experimental Approach to the Problem
2.1.1. Subjects
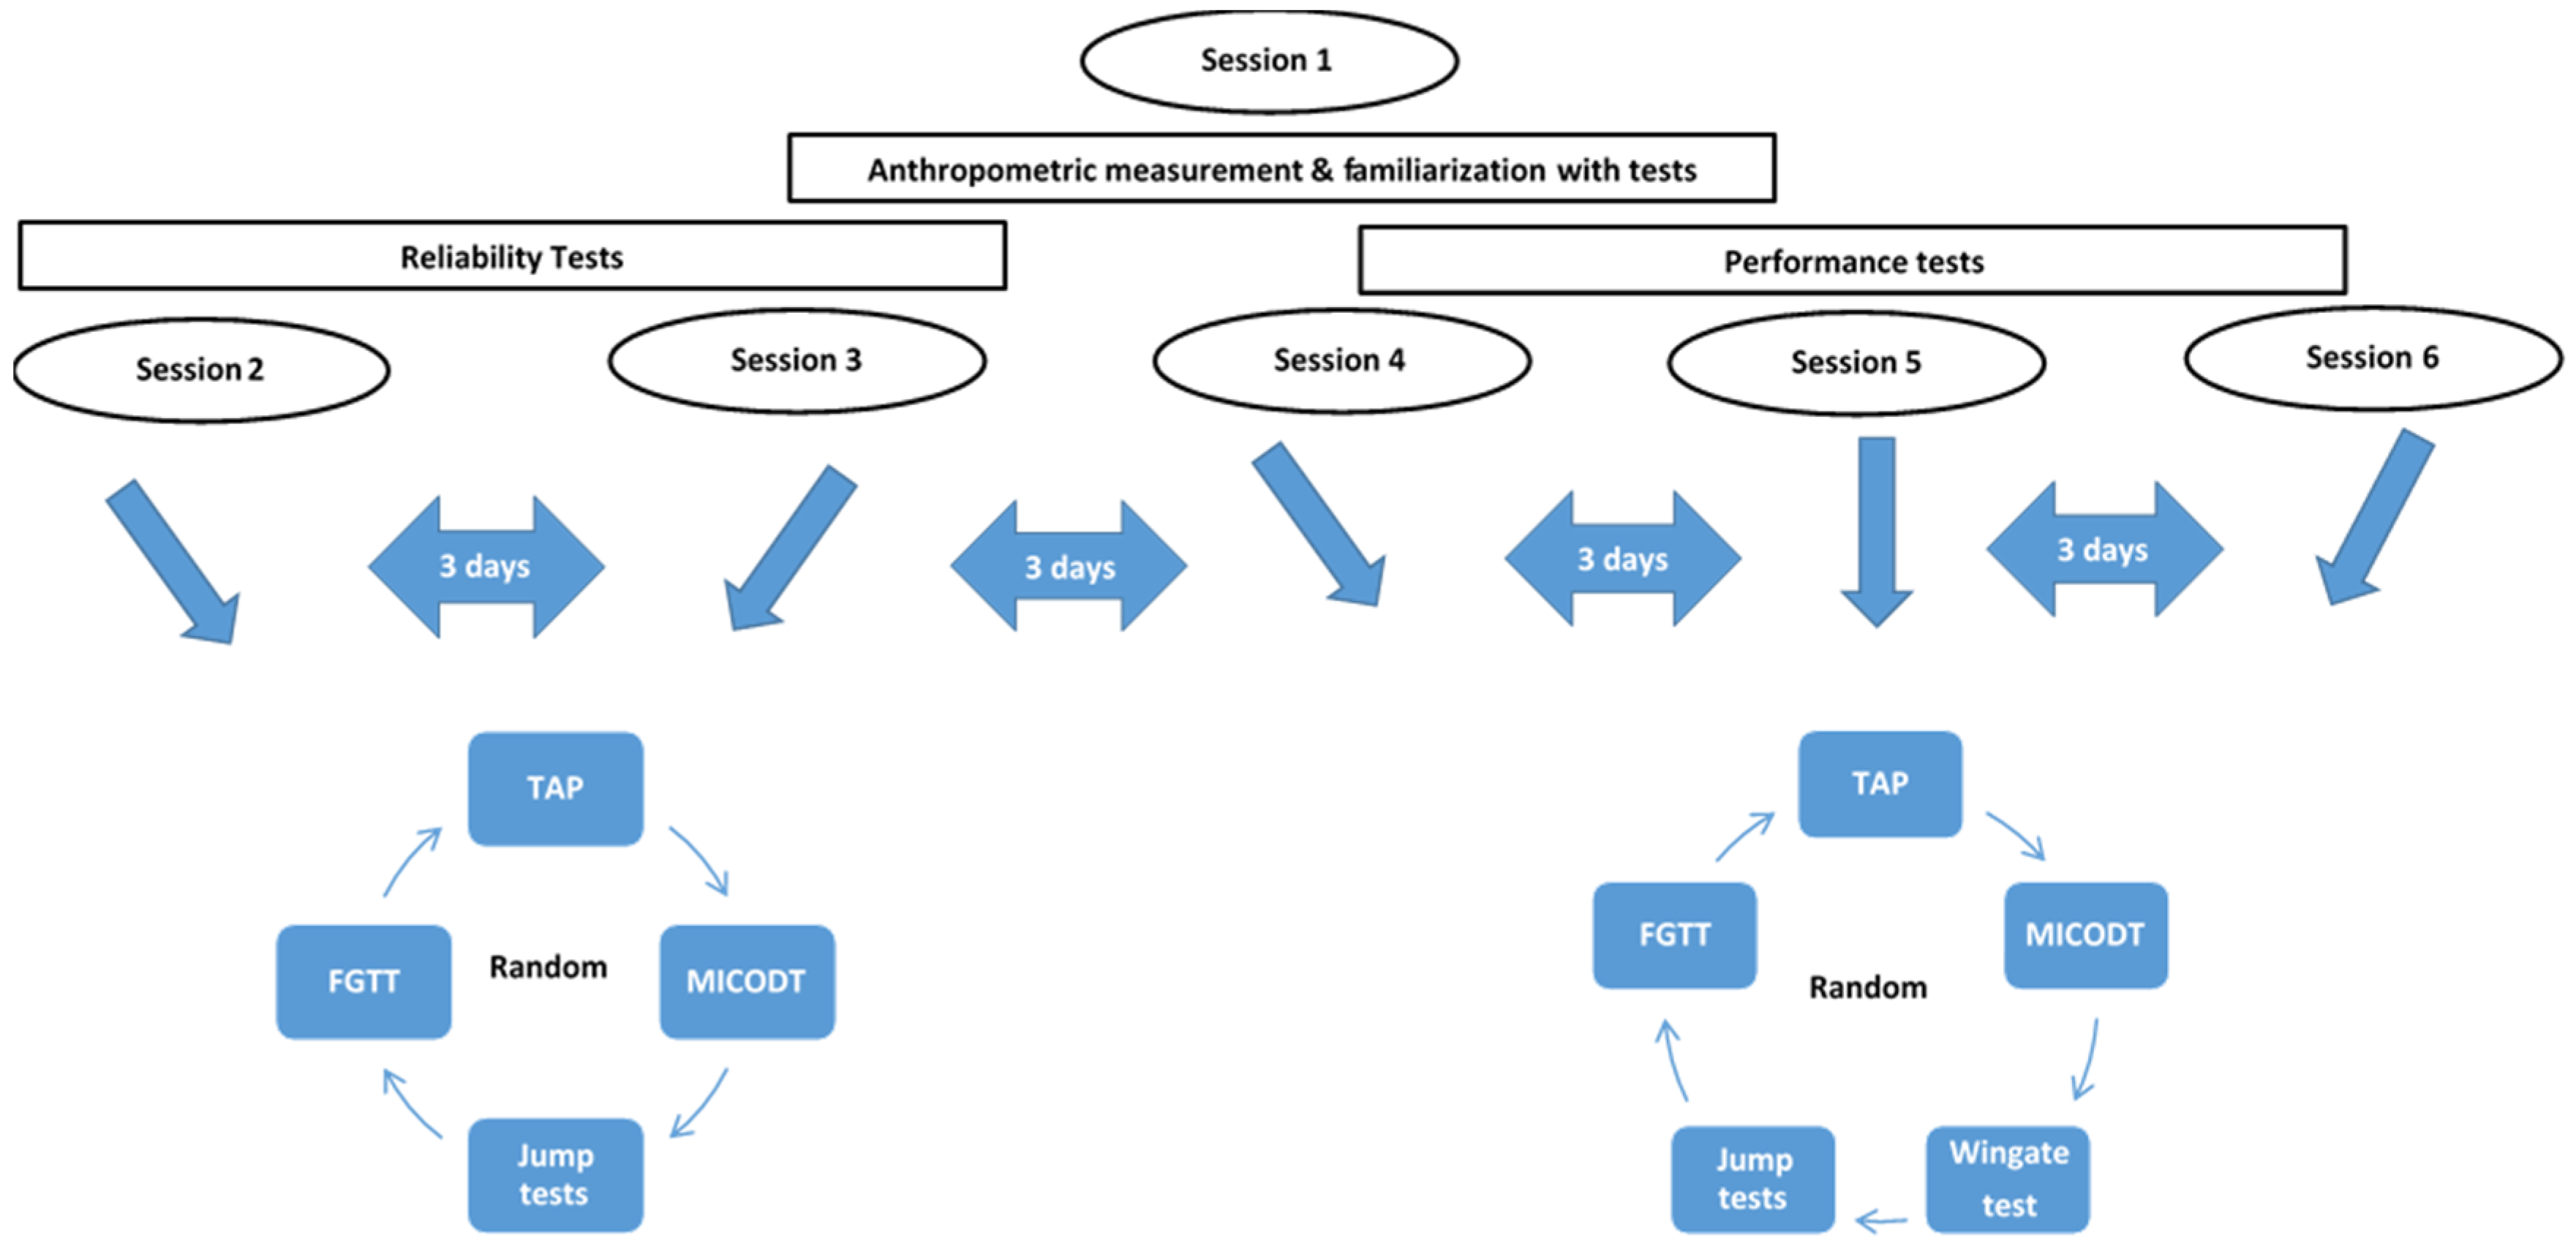
2.1.2. Procedures
- TAP test: The test was assessed with an Optojump Next (Microgate Next, Bolzano, Italy). It determines the frequency of foot tapping by calculating the time of flight/contact (one cycle) of the legs through infrared beams during 4 s (Figure 2, Supplementary Material: TAP test video). The acquisition bars were placed between the feet and connected to the Optojump Next software. The average frequency of each member was averaged on each successive right/left press to obtain the overall tapping frequency. To evaluate if TAP could cause any cardiovascular and metabolic stress, heart rate was measured twice: before and after the TAP test using (Polar V800, Finland). Blood lactate was also measured at rest before performing the TAP test and at the third minute following test using Lactate Pro Analyzer (Arkray, Tokyo, Japan).
- The finger tapping test: The FGTT procedure used in this study was the one described in the study of Austin et al. [13]. Three trials have been performed each for both the dominant and non-dominant hands and scores were measured with a smartphone application (HLTapper V.1.0), validated by Lee et al. [26]. This application is composed of two rectangles of 30 by 45 mm, separated by 15 mm. Smartphone timed tapping test subjects were asked to alternately tap each side of the rectangles using an index finger at their fastest speed for ten seconds without moving the rest of their hand or arm. The FGTT score is reported as the best number of taps recorded during the 6 trials (both dominant and non-dominant hand) then the tapping score was calculated as FGTT = Score/10 s.
- Sprint test: Sprint performance was evaluated at 5–20 and 30 m intervals through an electronic timing system (Brower timing system, CO, Draper, UT, USA). Players started in a standing start position 0.3 m just before the first photocells gate, placed at 0.75 m above the ground. The best time performance from 2 trials with a 3 min rest in-between was chosen for analysis.
- Agility test: The MICODT was used to evaluate the agility performance, where the protocol is the same as the Illinois CODS test with the only difference being in the total distance, inter-cones distance, and the number of the cones as described by Hachana et al. [27] and using an electronic timing system (Brower timing system, CO, Draper, UT, USA).
- Jump Tests: For SJ, players have started from a stationary semi-squatted position and performed a vertical jump at maximal effort. Then, players performed 2 types of CMJ, both where the jump starts in the standing position and the subject performs a downward countermovement (flexion of the lower limbs) immediately followed by a rapid full extension of the lower limbs. The difference between the 2 types of CMJ was that, in the first type, players should maintain their arms akimbo, but in the second type of CMJ, the players were asked to keep their arms in a neutral position (free hands). The jump height was recorded using an Optojump device (Microgate Next, Bolzano, Italy). The eccentric utilization ratio (EUR) has also been calculated, which is defined as the ratio of the CMJ (arms akimbo) to SJ performance [28].
- Anaerobic power: The Wingate anaerobic test (WAnT) was performed on a cycle ergometer Monark (Monark 894E, Stockhom, Sweden). The test was preceded by a warm-up of 5 min in approximately 100 rpm, with two sprints of approximately 6 s every minute, followed by a 2 min rest interval before the start of the test. Each participant had to exert maximal effort for 30 s against a braking force that was determined by the product of body mass in kg by 0.075 [30]. Two indices of the WAnT were measured and evaluated: (a) the peak power (Ppeak) and (b) the mean power (Pmean), both expressed in Watts per kilogram of body mass.
2.2. Statistical Analyses
3. Results
4. Discussion
5. Conclusions
Supplementary Materials
Author Contributions
Funding
Institutional Review Board Statement
Informed Consent Statement
Data Availability Statement
Acknowledgments
Conflicts of Interest
References
- Behrens, M.; Weippert, M.; Wassermann, F.; Bader, R.; Bruhn, S.; Mau-Moeller, A. Neuromuscular Function and Fatigue Resistance of the Plantar Flexors Following Short-Term Cycling Endurance Training. Front. Physiol. 2015, 6, 145. [Google Scholar] [CrossRef] [PubMed] [Green Version]
- Zemková, E.; Hamar, D. Sport-Specific Assessment of the Effectiveness of Neuromuscular Training in Young Athletes. Front. Physiol. 2018, 9, 264. [Google Scholar] [CrossRef] [PubMed] [Green Version]
- Abernethy, P.; Wilson, G.; Logan, P. Strength and Power Assessment—Issues, Controversies and Challenges. Sports Med. 1995, 19, 401–417. [Google Scholar] [CrossRef] [PubMed]
- Merrigan, J.J.; Stone, J.D.; Thompson, A.G.; Hornsby, W.G.; Hagen, J.A. Monitoring Neuromuscular Performance in Military Personnel. Int. J. Environ. Res. Public Health 2020, 17, 9147. [Google Scholar] [CrossRef] [PubMed]
- Read, P.J.; Oliver, J.L.; De Ste Croix, M.B.A.; Myer, G.D.; Lloyd, R.S. A Review of Field-Based Assessments of Neuromuscular Control and Their Utility in Male Youth Soccer Players. J. Strength Cond. Res. 2019, 33, 283–299. [Google Scholar] [CrossRef]
- Nakamura, R.; Nagasaki, H.; Narabayashi, H. Disturbances of Rhythm Formation in Patients with Parkinson’s Disease: Part I. Characteristics of Tapping Response to the Periodic Signals. Percept. Mot. Ski. 1978, 46, 63–75. [Google Scholar] [CrossRef]
- Şahin, Ş.; Birinci, Y.; Sağdilek, E.; Vatansever, S.; Pancar, S.; Şahin, E.; Kiziltan, E. A Comparative of Finger Tapping Test Scores Elite Athletes, Art, Foreign Languages and Computer-Instructional Technology Students. Int. J. Curric. Instr. 2020, 12, 379–386. [Google Scholar]
- Buchheit, M.; Lacome, M.; Cholley, Y.; Simpson, B.M. Neuromuscular Responses to Conditioned Soccer Sessions Assessed via GPS-Embedded Accelerometers: Insights into Tactical Periodization. Int. J. Sports Physiol. Perform. 2018, 13, 577–583. [Google Scholar] [CrossRef]
- Strauss, E.; Sherman, E.M.S.; Spreen, O. A Compendium of Neuropsychological Tests: Administration, Norms, and Commentary, 3rd ed.; A Review of: Applied Neuropsychology; Oxford University Press: New York, NY, USA, 2006; Volume 1, Available online: https://www.tandfonline.com/doi/abs/10.1080/09084280701280502 (accessed on 24 July 2020).
- Dragijsky, M.; Maly, T.; Zahalka, F.; Kunzmann, E.; Hank, M. Seasonal Variation of Agility, Speed and Endurance Performance in Young Elite Soccer Players. Sports 2017, 5, 12. [Google Scholar] [CrossRef] [Green Version]
- Cloak, R.; Nevill, A.; Smith, J.; Wyon, M. The Acute Effects of Vibration Stimulus Following FIFA 11+ on Agility and Reactive Strength in Collegiate Soccer Players. J. Sport Health Sci. 2014, 3, 293–298. [Google Scholar] [CrossRef] [Green Version]
- Sheppard, J.M.; Young, W.B. Agility Literature Review: Classifications, Training and Testing. J. Sports Sci. 2006, 24, 919–932. [Google Scholar] [CrossRef] [Green Version]
- Austin, D.; Jimison, H.; Hayes, T.; Mattek, N.; Kaye, J.; Pavel, M. Measuring Motor Speed through Typing: A Surrogate for the Finger Tapping Test. Behav. Res. Methods 2011, 43, 903–909. [Google Scholar] [CrossRef] [PubMed] [Green Version]
- Enoki, H.; Tani, T.; Ishida, K. Foot Tapping Test as Part of Routine Neurologic Examination in Degenerative Compression Myelopathies: A Significant Correlation between 10-Sec Foot-Tapping Speed and 30-m Walking Speed. Spine Surg. Relat. Res. 2019, 3, 207–213. [Google Scholar] [CrossRef] [PubMed]
- Hinman, M. Validity and Reliability of a 10-Second Foot-Tap Test in Older Adults. MOJ Gerontol. Geriatr. 2019, 4, 42–46. [Google Scholar]
- Numasawa, T.; Ono, A.; Wada, K.; Yamasaki, Y.; Yokoyama, T.; Aburakawa, S.; Takeuchi, K.; Kumagai, G.; Kudo, H.; Umeda, T.; et al. Simple Foot Tapping Test as a Quantitative Objective Assessment of Cervical Myelopathy. Spine 2012, 37, 108–113. [Google Scholar] [CrossRef] [PubMed] [Green Version]
- Raghavendran, R. Accuracy and Reliability of Babinski Sign versus Finger and Foot Tapping in the Diagnosis of Corticospinal Tract Lesions. Neurol. India 2018, 66, 1381. [Google Scholar] [CrossRef]
- Riley, M.A.; Santana, M.-V.; Turvey, M.T. Deterministic Variability and Stability in Detuned Bimanual Rhythmic Coordination. Hum. Mov. Sci. 2001, 20, 343–369. [Google Scholar] [CrossRef]
- Kent-Braun, J.A.; Walker, C.H.; Weiner, M.W.; Miller, R.G. Functional Significance of Upper and Lower Motor Neuron Impairment in Amyotrophic Lateral Sclerosis. Muscle Nerve 1998, 21, 762–768. [Google Scholar] [CrossRef]
- Kent-Braun, J.A.; Ng, A.V. Specific Strength and Voluntary Muscle Activation in Young and Elderly Women and Men. J. Appl. Physiol. 1999, 87, 22–29. [Google Scholar] [CrossRef] [Green Version]
- Arias, P.; Robles-García, V.; Espinosa, N.; Corral, Y.; Cudeiro, J. Validity of the Finger Tapping Test in Parkinson’s Disease, Elderly and Young Healthy Subjects: Is There a Role for Central Fatigue? Clin. Neurophysiol. 2012, 123, 2034–2041. [Google Scholar] [CrossRef] [Green Version]
- Comfort, P.; Jones, P.A.; McMahon, J.J.; Jones, P.A.; McMahon, J.J. Performance Assessment in Strength and Conditioning; Routledge: Abingdon-on-Thames, UK, 2018; ISBN 978-1-315-22281-3. [Google Scholar]
- Serdar, C.C.; Cihan, M.; Yücel, D.; Serdar, M.A. Sample Size, Power and Effect Size Revisited: Simplified and Practical Approaches in Pre-Clinical, Clinical and Laboratory Studies. Biochem. Med. 2021, 31, 010502. [Google Scholar] [CrossRef] [PubMed]
- Kuzmar, I.; Arroyo, J.R.M.; Villanueva, M.A.C.; Ortega, L.V.S.; Cortissoz, G.S.G.; Bandera, X.P.G.; Zalabata, E. Dataset for the Estimation of a New Body Fat Measurement Method. Data Brief 2021, 34, 106656. [Google Scholar] [CrossRef] [PubMed]
- Dello Iacono, A.; Martone, D.; Milic, M.; Padulo, J. Vertical- vs. Horizontal-Oriented Drop Jump Training: Chronic Effects on Explosive Performances of Elite Handball Players. J. Strength Cond. Res. 2017, 31, 921–931. [Google Scholar] [CrossRef] [PubMed]
- Lee, C.Y.; Kang, S.J.; Hong, S.-K.; Ma, H.-I.; Lee, U.; Kim, Y.J. A Validation Study of a Smartphone-Based Finger Tapping Application for Quantitative Assessment of Bradykinesia in Parkinson’s Disease. PLoS ONE 2016, 11, e0158852. [Google Scholar] [CrossRef] [PubMed] [Green Version]
- Hachana, Y.; Chaabène, H.; Ben Rajeb, G.; Khlifa, R.; Aouadi, R.; Chamari, K.; Gabbett, T.J. Validity and Reliability of New Agility Test among Elite and Subelite under 14-Soccer Players. PLoS ONE 2014, 9, e95773. [Google Scholar] [CrossRef]
- McGuigan, M.R.; Doyle, T.L.A.; Newton, M.; Edwards, D.J.; Nimphius, S.; Newton, R.U. Eccentric Utilization Ratio: Effect of Sport and Phase of Training. J. Strength Cond. Res. 2006, 20, 992–995. [Google Scholar] [CrossRef]
- Flanagan, E.P.; Ebben, W.P.; Jensen, R.L. Reliability of the Reactive Strength Index and Time to Stabilization during Depth Jumps. J. Strength Cond. Res. 2008, 22, 1677–1682. [Google Scholar] [CrossRef] [Green Version]
- Nikolaidis, P.T.; Matos, B.; Clemente, F.M.; Bezerra, P.; Camões, M.; Rosemann, T.; Knechtle, B. Normative Data of the Wingate Anaerobic Test in 1 Year Age Groups of Male Soccer Players. Front. Physiol. 2018, 9, 1619. [Google Scholar] [CrossRef] [Green Version]
- Bland, J.M.; Altman, D.G. Statistical Methods for Assessing Agreement between Two Methods of Clinical Measurement. Lancet 1986, 1, 307–310. [Google Scholar] [CrossRef]
- Hopkins, W.G. Measures of Reliability in Sports Medicine and Science. Sports Med. 2000, 30, 1–15. [Google Scholar] [CrossRef] [Green Version]
- Haley, S.M.; Fragala-Pinkham, M.A. Interpreting Change Scores of Tests and Measures Used in Physical Therapy. Phys. Ther. 2006, 86, 735–743. [Google Scholar] [CrossRef] [PubMed] [Green Version]
- Batterham, A.M.; Hopkins, W.G. Making Meaningful Inferences about Magnitudes. Int. J. Sports Physiol. Perform. 2006, 1, 50–57. [Google Scholar] [CrossRef] [PubMed]
- Cohen, J. Statistical Power Analysis for the Behavioral Sciences, 2nd ed.; L. Erlbaum Associates: Hillsdale, NJ, USA, 1988; ISBN 978-0-8058-0283-2. [Google Scholar]
- Delacour, H.; Servonnet, A.; Perrot, A.; Vigezzi, J.F.; Ramirez, J.M. La courbe ROC (receiver operating characteristic): Principes et principales applications en biologie clinique. Ann. Biol. Clin. 2005, 63, 11. [Google Scholar]
- Deyo, R.A.; Centor, R.M. Assessing the Responsiveness of Functional Scales to Clinical Change: An Analogy to Diagnostic Test Performance. J. Chronic Dis. 1986, 39, 897–906. [Google Scholar] [CrossRef]
- Pribble, B.; Larson, D.; Black, C.; Blackwood, D.; Rookard, J.; Larson, R. An Evaluation of the Foot Tapping Test (Ftt) in a Health Population: 2305 Board #141 June 1 11, 11:00 AM–12:30 Pm. Med. Sci. Sports Exerc. 2018, 50, 566. [Google Scholar] [CrossRef]
- Kurz, E.; Schwesig, R.; Pröger, S.; Delank, K.-S.; Bartels, T. Foot Tapping and Unilateral Vertical Jump Performance in Athletes after Knee Surgery: An Explorative Cross-Sectional Study. BMC Sports Sci. Med. Rehabil. 2022, 14, 34. [Google Scholar] [CrossRef]
- Voss, G.; Werthner, R.; Witt, M. Herausforderung Schnelligkeitstraining; Meyer & Meyer: Aachen, Germany, 2007; ISBN 978-3-89899-247-3. [Google Scholar]
- Tanigawa, M.; Stein, J.; Park, J.; Kosa, P.; Cortese, I.; Bielekova, B. Finger and Foot Tapping as Alternative Outcomes of Upper and Lower Extremity Function in Multiple Sclerosis. Mult. Scler. J.—Exp. Transl. Clin. 2017, 3, 2055217316688930. [Google Scholar] [CrossRef]


| Parameters | N | Age (Years) | Height (cm) | Body Mass (kg) | BMI (kg/m2) | Body Fat % | ΔHR (bpm) | Δ[Lac] (mmol/L) | TAP (tap·s−1) | TAP Dz |
|---|---|---|---|---|---|---|---|---|---|---|
| National level | 20 | 22.6 ± 2.5 | 172.9 ± 8.4 | 66.1 ± 8 | 22.05 ± 1.63 | 10.9 ± 1.2 | 36.2 ± 13.3 | 2.1 ± 1.8 | 9.68 ± 1.41 ** | 1.96 |
| Regional level | 20 | 25.1 ± 3.6 | 174.3 ± 3.3 | 65.9 ± 4.9 | 21.69 ± 1.58 | 11.3 ± 1.4 | 32.8 ± 11.3 | 2.5 ± 1.4 | 7.28 ± 1.01 |
| Parameters | Trial 1 | Trial 2 | p (t Test) | ICC (95% CI) | SEM (tap·s−1) | SEM (%) | SWC0.2 (tap·s−1) | SWC0.6 (tap·s−1) | MDC95% (tap·s−1) |
|---|---|---|---|---|---|---|---|---|---|
| TAP (tap·s−1) | 8.35 ± 1.74 | 8.33 ± 1.71 | 0.71 | 0.98 (0.97–0.99) | 0.28 | 3.52 | 0.34 | 1.03 | 0.8 |
| Test | Trial 1 (Mean ± SD) | Trial 2 (Mean ± SD) | ICC | Best Performance (Mean ± SD) | R (95%CI) | p |
|---|---|---|---|---|---|---|
| TAP (tap·s−1) | 8.35 ± 1.74 | 8.33 ± 1.71 | 0.98 | 8.48 ± 1.71 | - | - |
| FGTT (tap·s−1) | 7.77 ± 1.19 | 7.81 ± 1.07 | 0.96 | 7.95 ± 1.1 | 0.84 (0.77 to 0.89) | <0.001 |
| 5 m sprint(s) | 1.21 ± 0.12 | 1.22 ± 0.11 | 0.85 | 1.19 ± 0.17 | −0.16 (−0.44 to 0.14) | 0.32 |
| 20 m sprint(s) | 3.26 ± 0.14 | 3.24 ± 0.15 | 0.86 | 3.21 ± 0.15 | −0.17 (−0.45 to −0.12) | 0.28 |
| 30 m sprint(s) | 4.33 ± 0.19 | 4.30 ± 0.19 | 0.91 | 4.28 ± 0.19 | −0.12 (−0.42 to 0.25) | 0.44 |
| MICOD(s) | 10.66 ± 0.51 | 10.51 ± 0.45 | 0.93 | 10.48 ± 0.46 | −0.1 (−0.4 to 0.22) | 0.52 |
| SJ (cm) | 37.08 ± 4.53 | 35.44 ± 4.71 | 0.97 | 37.16 ± 4.62 | 0.02 (−0.31 to 0.35) | 0.85 |
| CMJ arms akimbo (cm) | 39.28 ± 5.35 | 39.19 ± 5.55 | 0.96 | 39.98 ± 5.45 | −0.04 (−0.32 to 0.19) | 0.78 |
| CMJ free arms (cm) | 44.82 ± 6.2 | 45.16 ± 6.71 | 0.95 | 45.98 ± 6.67 | 0.09 (−0.17 to 0.35) | 0.58 |
| SLJ (m) | 2.16 ± 0.21 | 2.17 ± 0.22 | 0.94 | 2.2 ± 0.21 | 0.05 (−0.33 to 0.42) | 0.75 |
| VDJ (cm) | 33.91 ± 4.9 | 34.75 ± 5.57 | 0.95 | 35.31 ± 5.43 | 0.24 (0.03 to 0.43) | 0.12 |
| RSI | 94.20 ± 26.29 | 97.07 ± 31.71 | 0.85 | 96.52 ± 32.2 | −0.12 (−0.35 to 0.1) | 0.45 |
| Ppeak (watts) | 821.62 ± 144.6 | - | - | 821.62 ± 144.6 | −0.15 (−0.46 to 0.2) | 0.34 |
| Pmean (watts) | 581.9 ± 99.4 | - | - | 581.9 ± 99.4 | −0.08 (−0.42 to 0.34) | 0.59 |
| RPpeak (watts/kg) | 12.19 ± 1.41 | - | - | 12.19 ± 1.41 | −0.04 (−0.34 to 0.25) | 0.79 |
| RPmean (watts/kg) | 8.62 ± 0.77 | - | - | 8.62 ± 0.77 | 0.08 (−0.24 to 0.39) | 0.62 |
| EUR | 1.08 ± 0.08 | - | - | 1.08 ± 0.08 | −0.12 (−0.38 to 015) | 0.45 |
Publisher’s Note: MDPI stays neutral with regard to jurisdictional claims in published maps and institutional affiliations. |
© 2022 by the authors. Licensee MDPI, Basel, Switzerland. This article is an open access article distributed under the terms and conditions of the Creative Commons Attribution (CC BY) license (https://creativecommons.org/licenses/by/4.0/).
Share and Cite
Chaabouni, S.; Methnani, R.; Al Hadabi, B.; Al Busafi, M.; Al Kitani, M.; Al Jadidi, K.; Samozino, P.; Moalla, W.; Gmada, N. A Simple Field Tapping Test for Evaluating Frequency Qualities of the Lower Limb Neuromuscular System in Soccer Players: A Validity and Reliability Study. Int. J. Environ. Res. Public Health 2022, 19, 3792. https://doi.org/10.3390/ijerph19073792
Chaabouni S, Methnani R, Al Hadabi B, Al Busafi M, Al Kitani M, Al Jadidi K, Samozino P, Moalla W, Gmada N. A Simple Field Tapping Test for Evaluating Frequency Qualities of the Lower Limb Neuromuscular System in Soccer Players: A Validity and Reliability Study. International Journal of Environmental Research and Public Health. 2022; 19(7):3792. https://doi.org/10.3390/ijerph19073792
Chicago/Turabian StyleChaabouni, Safouen, Rihab Methnani, Badria Al Hadabi, Majid Al Busafi, Mahfoodha Al Kitani, Khalifa Al Jadidi, Pierre Samozino, Wassim Moalla, and Nabil Gmada. 2022. "A Simple Field Tapping Test for Evaluating Frequency Qualities of the Lower Limb Neuromuscular System in Soccer Players: A Validity and Reliability Study" International Journal of Environmental Research and Public Health 19, no. 7: 3792. https://doi.org/10.3390/ijerph19073792