Abstract
Traditionally, opioid-related disease burden was primarily due to heroin use. However, increases in extra-medical (or non-medicinal use of prescription opioids; NMPOs) use has precipitated the current overdose epidemic in North America. We aim to examine the state-level prevalence of heroin and NMPO dependence and their associations with opioid-related mortality and state-level socio-demographic profiles. Data were pooled from the 2005–2014 National Survey on Drug Use and Health (NSDUH). We examine opioid-related mortality from CDC WONDER (Cause of Death database) by the past year prevalence of DSM-IV heroin and NMPO dependence, by age and sex, and their associations with state-level socio-demographic characteristics from census data. State-level rates of heroin dependence were associated with opioid-related death rates in young and mid-aged adults, while rates of NMPO dependence were associated with opioid-related death rates across all ages. The prevalence of heroin dependence was positively associated with state-level GDP/capita and urbanity. State-level NMPO dependence prevalence was associated with higher unemployment, lower GDP/capita, and a lower high-school completion rate. The prevalence of heroin and NMPO dependence are associated with a broad range of geographical and socio-demographic groups. Taking a wider view of populations affected by the opioid epidemic, inclusive interventions for all are needed to reduce opioid-related disease burden.
1. Introduction
Opioid dependence and related harms in the United States (U.S.) represents a substantial public health issue [1]. There has been a five-fold increase in opioid-associated deaths since 1999 [2], with opioids implicated in two-thirds of all drug-overdose fatalities [2]. A recent study estimated that opioid overdoses accounted for 1.7 million years of life lost in 2016 [3]. Key drivers of opioid burden are heroin use and the non-medical use (also referred to as extra-medical use) of prescription opioids (NMPOs) [4]. Throughout most of the 20th century, the population health burden caused by opioids was mainly driven by heroin, but over the past two decades, the use, misuse, and dependence of NMPOs have become major public health concerns.
In the late 1990s and early 2000s, NMPO-associated mortality rose with the wave of increased opioid prescribing [5]. Pharmaceutical pain relievers, such as OxyContin and methadone, have been described as “gateway drugs” [6,7], with documented transitions from medical to non-medical use [8,9]. In the early 2010s, NMPO-related mortality plateaued after the implementation of public health strategies to address overprescribing [4], including restrictive legislation [10] and treatment with abuse-deterrent formulations [11]. However, in what is commonly referred to as the “second wave” of the opioid epidemic, heroin-related mortality then rose sharply, reflecting a transitional period from NMPO to heroin use [12]. From the mid-2010s onwards, there has been a “third wave” caused by a rapid increase in opioid-related mortality driven by illicitly manufactured fentanyl, a highly potent synthetic opioid [13].
The rates of opioid mortality vary by location, with the Northeast and Appalachian regions being the most heavily impacted [14,15]. The variability has been attributed to state-level differences, such as in prescribing attitudes [16], opioid regulation (e.g., prescription monitoring programs) [4], and local drug availability [17]. Opioid use is also associated with several individual characteristics. It is more prevalent in younger adults [18], with accompanying consequences: 12.4% of deaths in the 15–24 years age group were opioid-related in 2016 [3]. Other factors linked to opioid use include male sex [4,19], fewer years of educational attainment [20], and rurality of residence [4]. There is a growing literature around the effect of unemployment, rurality, and macro-economic conditions on opioid-related mortality [21].
There has been a number of previous state-specific studies on the epidemiology of opioid use in the U.S., including studies in Ohio [22], Connecticut [23], and New York [24]. A gap in the literature is the limited research that includes data on all states to examine state-level factors associated with opioid-related harms. This study examines the prevalence of NMPO and heroin dependence by mortality and socio-demographic associates of the states to identify population risk factors on a state-level.
2. Materials and Methods
2.1. Study Design
This is a cross-sectional analysis of state-level prevalence, mortality, and socio-demographic variables between 2005–2014. Three data sources were used for this study with information presented in the corresponding sections below. The state-level prevalence estimates were sourced from the National Survey on Drug Use and Health (NSDUH; see Section 2.2), the mortality data were from the CDC Wonder Cause of Death database (see Section 2.3), and the socio-demographic variables were from U.S. Census (see Section 2.4).
2.2. State-Level Prevalence Estimates
The prevalence of opioid dependence in each state was based on estimates from adults in the National Survey on Drug Use and Health (NSDUH).
The NSDUH is a nationally representative study that collects data on substance use and dependence. The NSDUH interviews approximately 70,000 persons aged 12 years and above every year. This study used survey data available from 2004–2014 in the analysis. It samples residents of households, non-institutional group quarters, and civilians living on military bases. Respondents were selected through a stratified multistage area probability sample, representing each of the 50 states and the District of Columbia. Household addresses were randomly selected, then 1–2 members of the household may be selected to complete a full interview. Participation is voluntary and the participants are reimbursed with USD 30 for their contributions to the survey. The participants conduct the interviews in their own home. Participants answer the questions in private and the interview takes, on average, one hour to complete. All the information collected is confidential and used only for statistical purposes.
Statistical imputation is used to replace missing or ambiguous values after editing for key variables. The procedure applies probabilistic statistical methods to identify another similar respondent whose data were used to replace the missing values or ambiguous responses in the recipient record. Methodological documentations of the NSDUH are published online by SAMHSA. Analysis weights are created so that estimates are representative of the target population. Response rates for each year of the study were ranged from 82–91% (Appendix A, Table A1).
Geographic identifiers are collected in the NSDUH, but micro-data on opioid dependence by states are not distributed in the public domain. State-level data on past-year opioid dependence were obtained from the Substance Abuse and Mental Health Services Administration (SAMHSA) through a special data request that approved the use of and provided data from 2005–2014. Year-by-year data by state was not provided by SAMHSA due to small numbers after stratification by age and sex to protect the confidentiality of the participants. Therefore, the state-level was provided as the weighted mean of the 10-year sample. That is, analysis weights were applied to the estimates to be representative of the target population. Then, data over the 10 years were pooled by (by calculating the mean prevalence estimates) SAMHSA across the years, to provide state-level prevalence estimate for our state-level associates analyses.
Past-year opioid dependence, stratified by age, sex, and state, was defined according to the 4th edition of the Diagnostic and Statistical Manual of Mental Disorders (DSM-IV). Included in the interview were questions based on the six criteria in the DSM-IV for diagnosing substance-use dependence. For heroin and pain relievers, a seventh withdrawal criterion was added and was defined by a respondent reporting having experienced a number of withdrawal symptoms (e.g., having trouble sleeping, cramps, and hand tremble). A respondent was defined as having dependence if they met three or more of the seven dependence criteria for heroin or opioid use. Three categories of opioid dependence were examined: (1) heroin dependence, (2) NMPO dependence, and (3) any opioid dependence (including those who met either of the first two categories). Categories 1 and 2 are not mutually exclusive; they include people who met criteria for both heroin and NMPOs.
2.3. Opioid-Overdose Death Rates
Mortality caused by overdose (death codes: X40–X44, X60-64, X85, Y10-Y14) due to opioids (T40.0-T40.4, T40.6) was retrieved from the CDC Wonder Cause of Death database. These codes were selected because they represent opioid-related deaths. A description of the codes can be found in Appendix B (Table A2). Death rates by each of the U.S. states between 2005–2014 were extracted.
2.4. State-Level Socio-Demographic Characteristics
The state-level socio-demographic characteristics examined included: GDP/capita, mean personal income, high-school completion rate, rurality, and unemployment rate. GDP/capita was calculated as each state’s annual Gross Domestic Product divided by their resident population [18]. Personal income was defined as the annual sum of all employment-related or investment-related earnings received by an individual [18]. High-school completion rate was defined as the proportion of each state’s adult population with a high-school diploma or higher education level [19]. Rurality was defined as the proportion of each state’s population living in a community of under 2500 residents [20,25]. Unemployment rate was defined as the proportion of all individuals aged 16+ who were not employed at the time, despite actively searching for work [26]. As the U.S. Census is a decennial survey, rurality data were collected from 2010; all other characteristics were averaged over the years 2005–2014 to correspond with the state-level opioid dependence data.
2.5. Statistical Analysis
Firstly, we examined the state-level variations in opioid dependence by presenting the prevalence estimates by the states. All analyses were stratified by the three opioid dependence categories. We presented the weighted prevalence overall, and by age and sex (data available in Table S1). As mentioned in the data source section above, the prevalence estimates were calculated as the mean over the 10 years of our study period, due to lack of year-by-year data availability.
Second, we examined the correlation of opioid dependence with opioid-related death rates. Pearson’s correlations were used to examine the associations between state-level prevalence estimates with state-level opioid-related mortality. Analyses were stratified by the three opioid dependence categories, and by age and sex groups. The associations were presented in scatterplots.
Thirdly, Pearson’s correlations were conducted to examine the correlations between state-level socio-demographic factors and state-level prevalence of opioid dependence. Correlations were calculated separately for each of the three opioid dependence categories. Data visualizations were created in Tableau and correlation analyses were conducted in StatsNotebook 0.1.0, which is an open source statistical package built on R.
3. Results
3.1. State-Level Variations
The prevalence of heroin dependence ranged from <0.1% to 0.4% (mean = 0.1, SD = 0.1), and NMPO dependence ranged from 0.2–1.2% (mean = 0.6, SD = 0.2; see Table S4). Pooled state-level data across 2005–2014 showed that Connecticut, the District of Columbia, and New Jersey had the highest prevalence of heroin dependence, followed by Delaware, Oregon, Massachusetts, Pennsylvania, and Rhode Island (see Figure S1). The states with the highest rates of NMPO dependence were Kentucky (1.2%) and West Virginia (1.2%), followed by New Hampshire and Tennessee at 0.9% and Arizona, Louisiana, Ohio, and Oklahoma at 0.8%. These geographical variations were similar across age groups and sexes (see Tables S1–S3).
3.2. Correlation with Opioid-Related Death Rates
Across all the states, opioid-related death rates ranged from 3.2 to 31.6 per 100 thousand (mean = 10.4, SD = 5.7). The rates were lowest in Nebraska (3.2), Hawaii (3.9), and Mississippi (3.9), and highest in West Virginia (31.6), New Hampshire (23.4), and New Mexico (see Table S4).
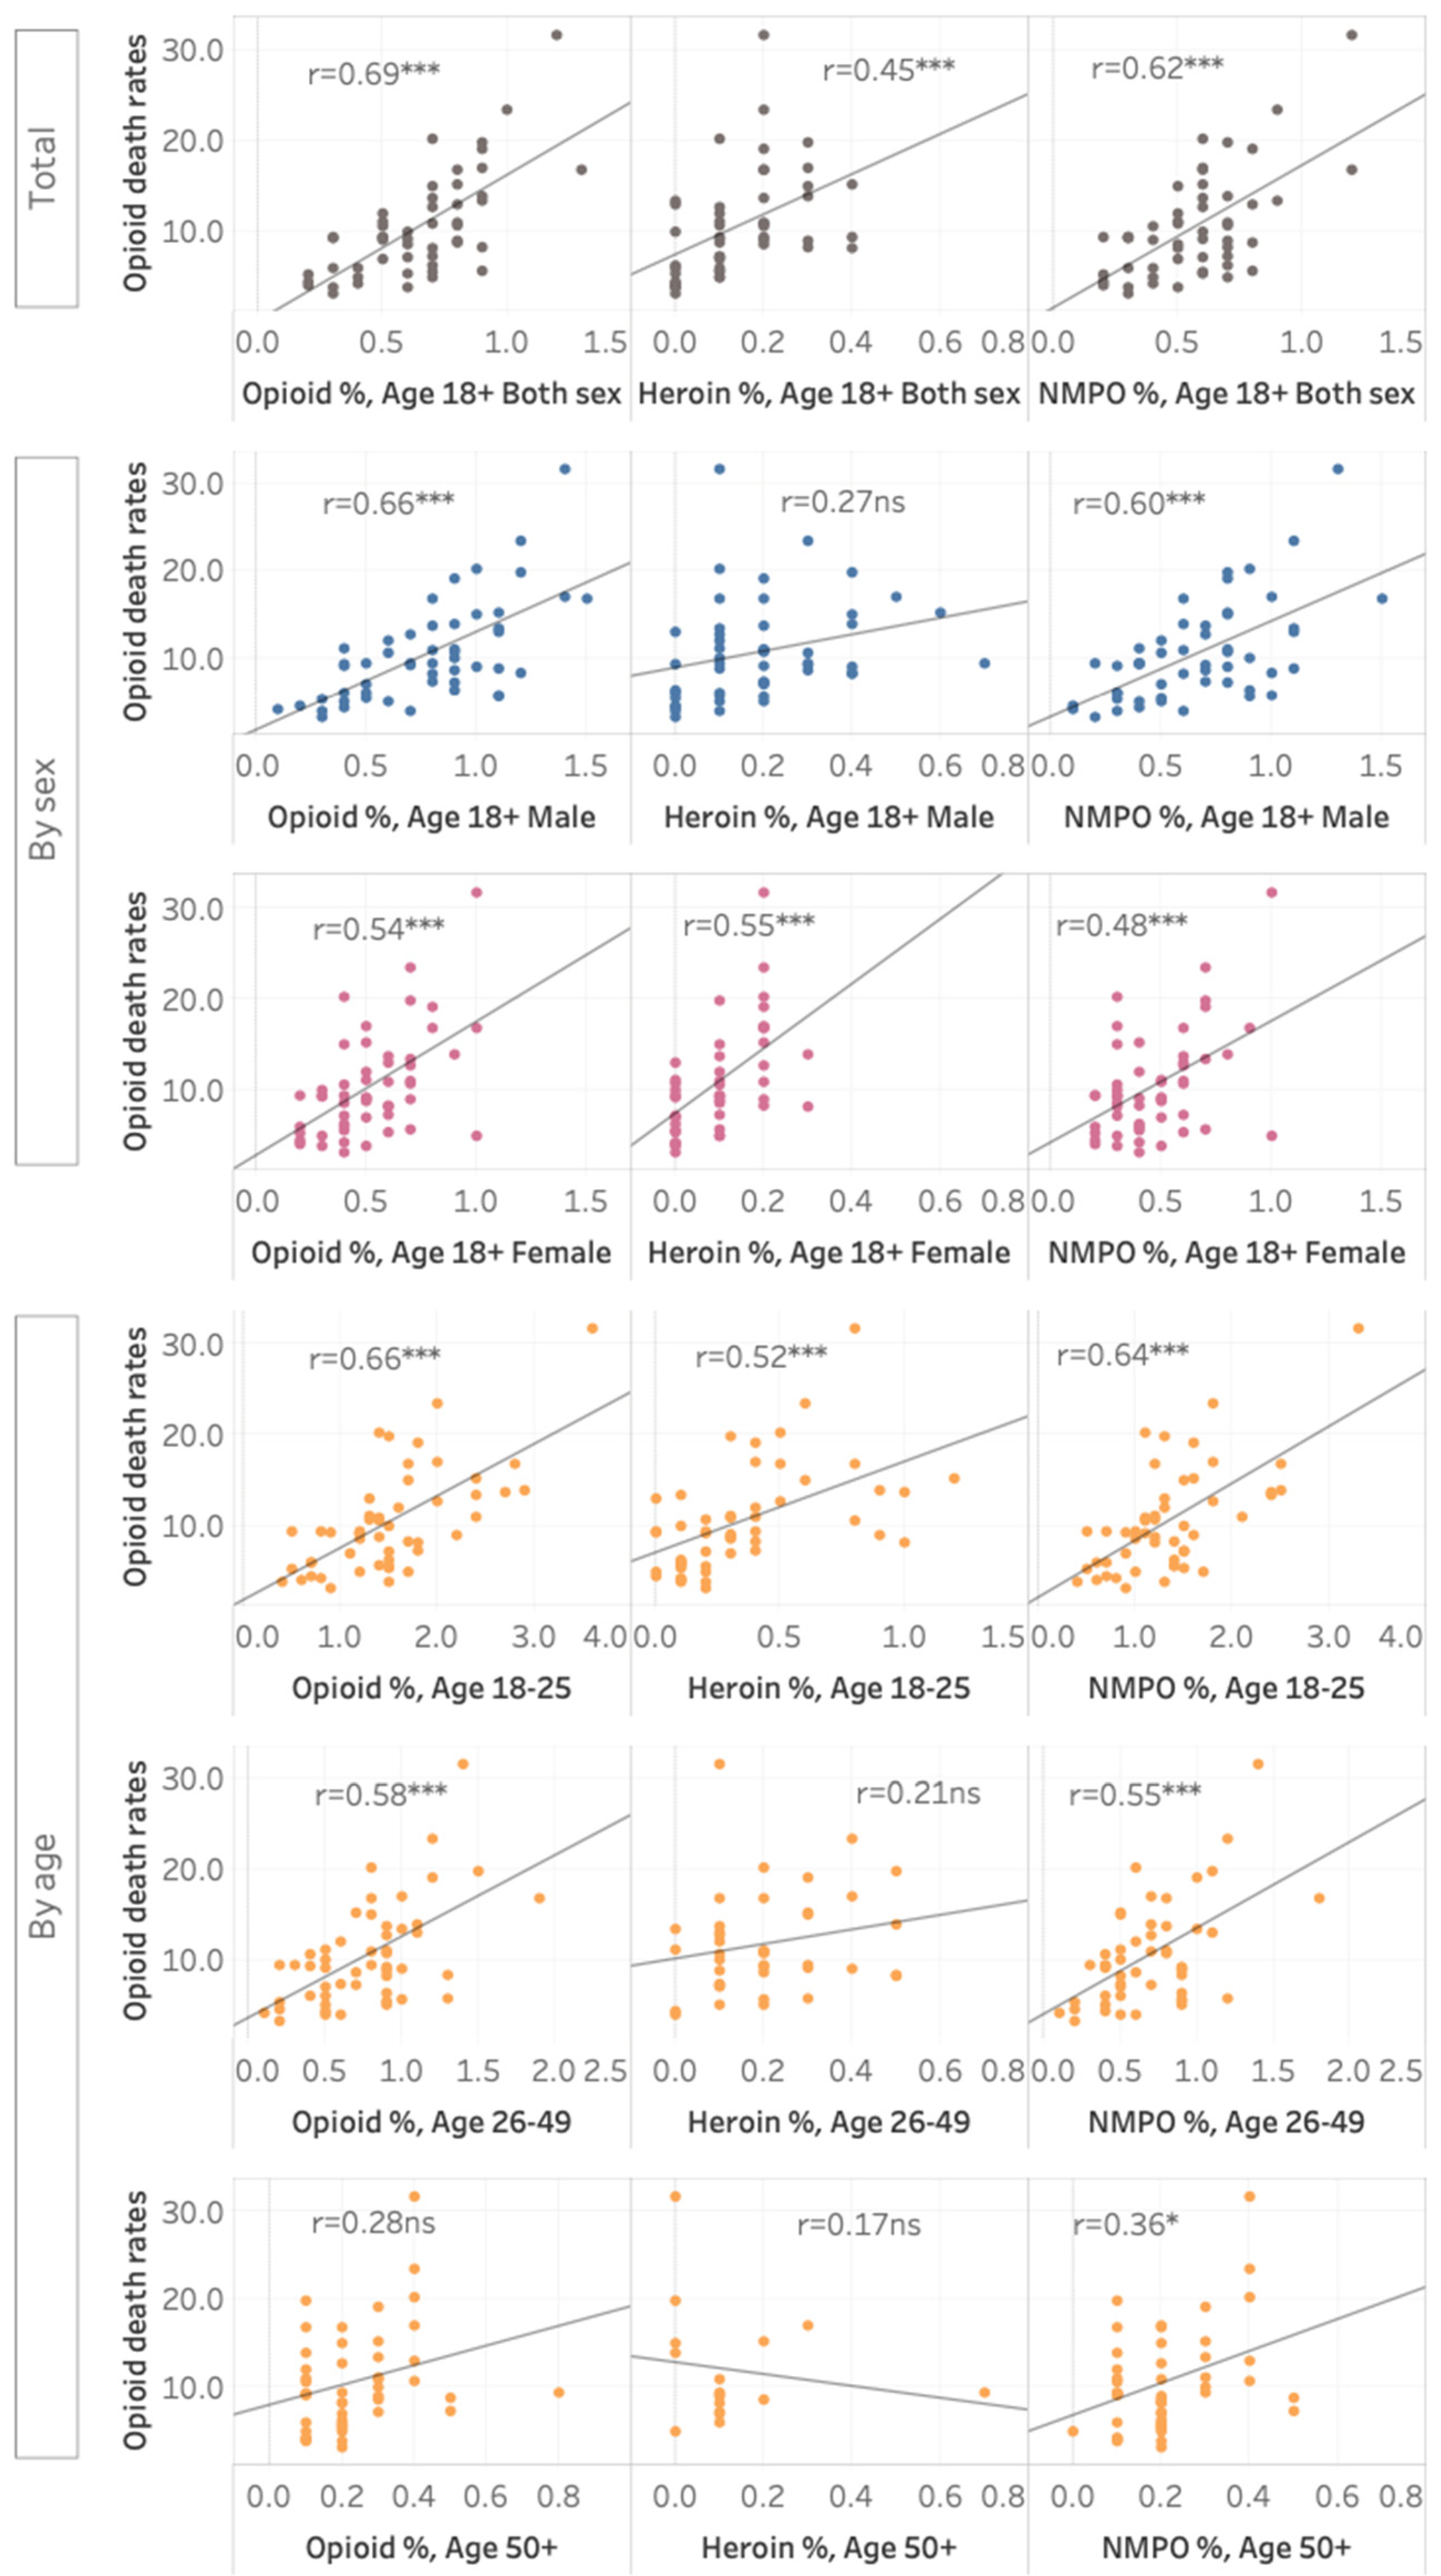
There was a positive association between state-level opioid dependence rates and state-level opioid-related death rates (r = 0.69, p < 0.001; see Figure 1). An interactive data visualization tool is available online (https://public.tableau.com/app/profile/janni.leung/viz/Opioid-relateddeathratesbystate-levelprevalenceofopioidheroinandnon-medicalprescriptionopioiddependenceintheUSA-LeungJ2022/Dashboard (accessed on 15 December 2021)). Opioid-related mortality was more strongly associated with NMPO (r = 0.62, p < 0.001) than with heroin dependence (r = 0.45, p = 0.001. Both heroin (r = 0.52, p < 0.001) and NMPO-dependence (r = 0.64, p < 0.001) rates were significantly correlated with opioid death rates in the 18–25 years age group. In the 26+ years age groups, NMUPO-dependence prevalence was significantly associated with opioid death rates, but heroin dependence was not.
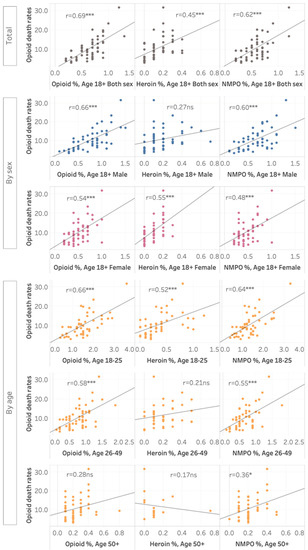
Figure 1.
State-level prevalence of opioids dependence, heroin dependence, and NMPO dependence. An interactive data visualization tool is available online (https://public.tableau.com/app/profile/janni.leung/viz/Opioid-relateddeathratesbystate-levelprevalenceofopioidheroinandnon-medicalprescriptionopioiddependenceintheUSA-LeungJ2022/Dashboard (accessed on 15 December 2021)). * p < 0.05, *** p < 0.001.
3.3. Socio-Demographic Correlates
Descriptive statistics for the socio-demographic factors across the states are available in Table S5. Higher unemployment (r = 0.38, p = 0.006) and lower high school completion (r = −0.33, p = 0.018) rates were significantly associated with a higher prevalence of state-level opioid dependence (see Table 1). At a state level, a lower GDP/capita (r = −0.39, p = 0.005), lower personal income (r = −0.42, p = 0.002), and lower high school completion rate (r = −0.28, p = 0.007) were associated with NMPO dependence prevalence. In contrast, higher GDP/capita (r = 0.48, p < 0.001), higher personal income (r = 0.59, p < 0.001), and lower proportion living in rural areas (r = −0.40, p = 0.004), were associated with a prevalence of heroin dependence in the states.

Table 1.
Correlations between state-level socio-demographic factors and state-level prevalence of dependence.
4. Discussion
This study examined the associations between NMPO and heroin dependence with state-level opioid-related deaths and socio-demographic characteristics in the United States. The prevalence of heroin dependence was associated with opioid-related deaths in young-to-middle-aged groups, possibly because of the low prevalence in adults over 50 years of age. Prevalence of NMPO dependence was correlated with opioid-related deaths in adults from all age groups. We found that indicators of higher socioeconomic advantage were associated with a higher prevalence of heroin dependence, but negatively associated with NMPO dependence. This finding may be explained by the greater accessibility of heroin in bigger cities, which are primarily located in higher-income states [17]. In contrast, the prevalence of NMPO dependence was highest in areas of lower educational and financial attainment, including the states of Kentucky, West Virginia, and New Hampshire. Given the descriptive nature of the study, no causal interpretation is possible.
The finding that the prevalence of opioid dependence was significantly correlated with opioid-related mortality, corroborated with the literature that determined that individuals with long-term opioid dependence are at a higher risk of overdose [3,14]. Our finding that heroin dependence was significantly associated with opioid-related deaths in the young-to-middle-aged groups imply that younger adults comprise the primary demographic for heroin use, so they may constitute a candidate for targeted awareness and intervention initiatives [27]. While heroin use had traditionally been a predominately male problem, we found that the prevalence of heroin and NMPO dependence were associated with opioid-related deaths in females. The needs of people who use drugs are likely to differ by sex. For example, females who use NMPOs are more likely to have comorbid depression [28]. Our findings provide further support for gender-appropriate strategies to reduce opioid-related harms.
The finding that NMPO dependence was correlated with opioid-related deaths in middle-aged and older adults (aged 26+ years) is relevant for public health strategies to address the opioid epidemic. Compared to younger people, middle-aged and older adults are more likely to develop dependence initiated by prescribed pain relievers [29], often on higher-potency analgesics [30]. Older patients experience greater levels of pain and polypharmacy due to other chronic conditions may be more vulnerable to opioid-drug (e.g., concomitant benzodiazepine use) and opioid-disease interactions (e.g., exacerbation of impaired respiratory or renal function) [31].
Previous studies observed that the factors that influence the association between opioid use and state-level socio-demographics include the relatively expensive (albeit decreasing) street price of heroin [17], as well as its greater accessibility in major cities [32]. In contrast, NMPO dependence is most prominent in less economically and educationally advantaged states, including Kentucky and New Hampshire, showing an association between NMPOs and lower education [33,34]. A recent study examined county-level labor market outcomes in ten states using the U.S.’s Prescription Drug Monitoring Programs and labor data from the Bureau of Labor Statistics [35]. It reported a negative effect on employment and labor force participation rates when measuring the number of opioids prescriptions written and the number of doses prescribed. However, the authors cautioned against restricting the supply of prescription opioids as a strategy to boost employment and labor force participation. Imposing barriers to access opioids could lead to unintentional consequences, including leaving those in need without effective pain management, and people who use pharmaceutical opioid switching to other forms of harmful opioids [4].
Our findings imply that public health interventions for the opioid epidemic need to consider the broad variety of socio-demographic groups affected. There is strong evidence that opioid agonist treatment (OAT), for which coverage is currently low, is highly effective in reducing opioid use and opioid-related deaths, including overdose, suicide, HIV, hepatitis C virus, and injuries [36]. A recent study demonstrated that scaling up the use of OATs has the potential to avert 7.7% of deaths in Kentucky [36]. Another intervention that could be effective to reduce opioid-related deaths would be to increase the provision of naloxone. By increasing the awareness of the co-prescription of naloxone with opioids, it might be a sensible intervention, as opioid dependence increases. Increased access to effective interventions for all affected by opioids is a clear public health priority in the U.S., and also countries in which an increase in opioid-related harms is emerging [37,38].
This study has a few limitations. The NSDUH findings cannot be generalized to special and high-risk populations, such as incarcerated individuals or intravenous drug users, among whom mortality risk due to overdose is much higher.
Another limitation is that our state-level measures were pooled across multiple years, precluding an analysis of temporal trends by state. We cannot assume that our variables have not changed across time, so our findings cannot be used to inform population-level changes over time. The validity of year-by-year variations in the prevalence of heroin use in general population surveys has been under debate [39]. Under-reporting is a major limitations of population surveys on substance use behaviors. The resulting low number of cases may lead to year-by-year variations that may not reflect the true prevalence and combining multiple years of data was proposed to provide a more stable population estimate. Further, the NSDUH made changes to items asking about opioid use since 2015, therefore data since then may not be directly comparable to the previous data. Our current analysis is reasonable because it used multiple years of data combined before the change of method of measuring opioid use. Future studies that are enabled when new data becomes available will provide epidemiological information on any changes in regional and socio-demographic groups affected.
We did not have data that explicitly distinguishes synthetic opioids, nor illicitly manufactured synthetic opioids, which drove opioid mortality in the U.S.A. [13]. An analysis on a sub-sample of young adults who reported past-month NMPO use from the Rhode Island Young Adult Prescription Drug Study found that 1 in 10 was exposed to fentanyl-contaminated heroin, with 60% reporting that they were unaware of the contamination before use [40]. Future epidemiological studies should consider the changing landscape of opioid use in the United States, with recent intentional and unintentional increased uptake in highly potent illicitly manufactured fentanyl and other novel psychoactive substances [41].
Future studies should examine the concurrent use of opioids with other substances to inform interventions, because there are differences in the use of other substances among people who use NMPOs [42]. A recent study of U.S. adults using prescription opioids found that those who misused both their own prescriptions and opioids prescribed to others were more likely to be co-using cannabis, benzodiazepine, and heroin, compared to those who were only misusing their own prescriptions [43]. They were also more likely to meet criteria for an opioid use disorder. In people engaging in NMPOs with a prescription, extending substance use beyond their own prescriptions puts them at higher risk of negative mental and physical consequences.
In addition to understanding the associates of an opioid-related burden, our findings have other public health implications, (e.g., elevated rates of hepatitis C have been observed in states with higher rates of intravenous OxyContin misuse) [44]. Future studies should examine the concurrent use of opioids with other substances. Looking at opioids alone provides an incomplete picture because concurrent use of respiratory depressants, such as alcohol and benzodiazepines, increases the risk of fatal overdoses. Although opioid dependence is mainly an adult disorder, we need evidence-based preventive strategies earlier in life, because NMPO use in late-childhood and adolescence is a strong risk factor for transitioning to heroin use in early adulthood [45]. We also need to consider the changing epidemiology of opioid use in the United States, with a recent uptake in the use of high-potency synthetic opioids [46].
5. Conclusions
The prevalence of opioid dependence was not only associated with mortality in young adults, but also associated with opioid-related mortality in older adults by extra-medical use of pharmaceutical opioids. Prevalence rates of opioid dependence were associated with a range of geographical and socio-demographic groups, including populations with high income and education levels. Public health interventions and public policies should take a broader view of the variety of populations affected by opioid misuse, inclusive of people affected by both heroin and prescription opioid use, the age ranges, and genders affected. We need to be increasing the access to effective interventions for all, to reduce opioid-related disease burden in the U.S.A.
Supplementary Materials
The following supporting information can be downloaded at: https://www.mdpi.com/article/10.3390/ijerph19073825/s1, Figure S1: State-level prevalence of opioids dependence, heroin dependence, and NMPO dependence; Table S1: State level prevalence of opioids (heroin or non-medicinal use of prescription opioids [NMPO] dependence in past year among persons ages 18 or older, by age group and sex: percentages, and 95% confidence intervals, averages based on 2005-2014; Table S2: State-level prevalence of past year heroin dependence among persons aged 18 or older, by age group and sex: averages based on 2005–2014; Table S3: Prevalence of non-medical prescription opioid (NMPO) dependence in past year among persons aged 18 or older, by age group and sex: averages based on 2005–2014; Table S4: Descriptive statistics across states for opioids variables; Table S5: Descriptive statistics across states for socio-demographic factors.
Author Contributions
Conception: W.H., J.L.; Design: J.L., G.C.K.C., W.H.; Acquisition of data: J.L., L.D.; Analysis: J.L., S.X.T., C.M.-T., G.C.K.C.; Interpretation of data: all authors; First draft: J.L., S.X.T., G.C.K.C.; Revised draft: all authors; Final approval and agreement to be accountable for the work: all authors. All authors have read and agreed to the published version of the manuscript.
Funding
NCYSUR and NDARC are supported by Commonwealth funding from the Australian Government provided under the Drug and Alcohol Program. J.L., G.C., and L.D. are supported by NHMRC fellowships. No specific funding was allocated to this study. The funders had no role in study design, data collection and analysis, decision to publish, or preparation of the manuscript.
Informed Consent Statement
The data used for this study was pre-existing and de-identifiable upon download. Although this study involves data of human subjects, the collection of the data happened previously through a national survey.
Data Availability Statement
The data presented in this study are available in the Supplementary Materials.
Acknowledgments
The authors would like to thank Brandon Marshall from Brown University for his review and comments on our draft manuscript.
Conflicts of Interest
The authors declare no conflict of interest.
Appendix A
Table A1.
Response rates and sample size of the NSDUH survey by year of collection.
Table A1.
Response rates and sample size of the NSDUH survey by year of collection.
| Year | Study Sample Size | Response Rate |
|---|---|---|
| 2005 | 55,905 | 91% |
| 2006 | 55,035 | 90% |
| 2007 | 55,049 | 89% |
| 2008 | 55,110 | 89% |
| 2009 | 55,234 | 88% |
| 2010 | 57,313 | 88% |
| 2011 | 58,397 | 87% |
| 2012 | 55,268 | 86% |
| 2013 | 55,160 | 84% |
| 2014 | 55,271 | 82% |
Appendix B
Table A2.
Description of opioid-related ICD-10 death codes.
Table A2.
Description of opioid-related ICD-10 death codes.
| Drug Poisoning Intent | ICD-10 Codes |
|---|---|
| Unintentional | X40-X44 |
| Suicide/self-harm | X60-X64 |
| Assault by drug poisoning | X85 |
| Undetermined drug poisoning intent | Y10-Y14 |
| Contributing Drug of Overdose | ICD-10 Codes |
| Opium | T40.0 |
| Heroin | T40.1 |
| Natural and semisynthetic opioids | T40.2 |
| Methadone | T40.3 |
| Synthetic opioids, other than methadone | T40.4 |
| Other unspecified narcotics | T40.6 |
References
- Rudd, R.A.; Aleshire, N.; Zibbell, J.E.; Gladden, R.M. Increases in Drug and Opioid Overdose Deaths—United States, 2000–2014. MMWR Morb. Mortal. Wkly. Rep. 2016, 64, 1378–1382. [Google Scholar] [CrossRef] [PubMed] [Green Version]
- Centers for Disease Control and Prevention. Opioid Overdose: Understanding the Epidemic. Available online: https://www.cdc.gov/drugoverdose/epidemic/index.html (accessed on 23 October 2018).
- Gomes, T.; Tadrous, M.; Mamdani, M.M.; Paterson, J.; Juurlink, D.N. The burden of opioid-related mortality in the united states. JAMA Netw. Open 2018, 1, e180217. [Google Scholar] [CrossRef] [PubMed]
- Compton, W.M.; Jones, C.M.; Baldwin, G.T. Relationship between Nonmedical Prescription-Opioid Use and Heroin Use. N. Engl. J. Med. 2016, 374, 154–163. [Google Scholar] [CrossRef] [PubMed]
- Maxwell, J.C. The prescription drug epidemic in the United States: A perfect storm. Drug Alcohol Rev. 2011, 30, 264–270. [Google Scholar] [CrossRef] [PubMed]
- Grau, L.E.; Dasgupta, N.; Harvey, A.P.; Irwin, K.; Givens, A.; Kinzly, M.L.; Heimer, R. Illicit Use of Opioids: Is OxyContin® a “Gateway Drug”? Am. J. Addict. 2007, 16, 166–173. [Google Scholar] [CrossRef]
- Barry, D.T.; Marshall, B.D.; Becker, W.C.; Gordon, A.J.; Crystal, S.; Kerns, R.D.; Gaither, J.R.; Gordon, K.S.; Justice, A.C.; Fiellin, D.A.; et al. Duration of opioid prescriptions predicts incident nonmedical use of prescription opioids among U.S. veterans receiving medical care. Drug Alcohol Depend. 2018, 191, 348–354. [Google Scholar] [CrossRef]
- Pollini, R.A.; Banta-Green, C.J.; Cuevas-Mota, J.; Metzner, M.; Teshale, E.; Garfein, R.S. Problematic use of prescription-type opioids prior to heroin use among young heroin injectors. Subst. Abus. Rehabil. 2011, 2, 173–180. [Google Scholar] [CrossRef] [Green Version]
- McCabe, S.E.; West, B.T.; Boyd, C.J. Medical use, medical misuse, and nonmedical use of prescription opioids: Results from a longitudinal study. Pain 2013, 154, 708–713. [Google Scholar] [CrossRef] [Green Version]
- Franklin, G.M.; Mai, J.; Turner, J.; Sullivan, M.; Wickizer, T.; Fulton-Kehoe, D. Bending the prescription opioid dosing and mortality curves: Impact of the Washington State opioid dosing guideline. Am. J. Ind. Med. 2012, 55, 325–331. [Google Scholar] [CrossRef]
- Sessler, N.E.; Downing, J.M.; Kale, H.; Chilcoat, H.D.; Baumgartner, T.F.; Coplan, P.M. Reductions in reported deaths following the introduction of extended-release oxycodone (OxyContin) with an abuse-deterrent formulation. Pharmacoepidemiol. Drug Saf. 2014, 23, 1238–1246. [Google Scholar] [CrossRef] [Green Version]
- Kelley-Quon, L.I.; Cho, J.; Strong, D.R.; Miech, R.A.; Barrington-Trimis, J.L.; Kechter, A.; Leventhal, A.M. Association of Nonmedical Prescription Opioid Use With Subsequent Heroin Use Initiation in Adolescents. JAMA Pediatr. 2019, 173, e191750. [Google Scholar] [CrossRef] [PubMed]
- Rubin, R. Illicit Fentanyl Driving Opioid Overdose Deaths. JAMA 2017, 318, 2174. [Google Scholar] [CrossRef] [PubMed]
- Johnson, H.; Paulozzi, L.; Porucznik, C.; Mack, K.; Herter, B. Decline in drug overdose deaths after state policy changes—Florida, 2010–2012. MMWR Morb. Mortal. Wkly. Rep. 2014, 63, 569–574. [Google Scholar] [PubMed]
- Paone, D.; Tuazon, E.; Kattan, J.; Nolan, M.L.; O’Brien, D.B.; Dowell, D.; Farley, T.A.; Kunins, H.V. Decrease in rate of opioid analgesic overdose deaths—Staten Island, New York City, 2011–2013. MMWR Morb. Mortal. Wkly. Rep. 2015, 64, 491–494. [Google Scholar]
- McDonald, D.C.; Carlson, K.; Izrael, D. Geographic variation in opioid prescribing in the U.S. J. Pain Off. J. Am. Pain Soc. 2012, 13, 988–996. [Google Scholar] [CrossRef] [Green Version]
- Unick, G.; Rosenblum, D.; Mars, S.; Ciccarone, D. The relationship between US heroin market dynamics and heroin-related overdose, 1992–2008. Addiction 2014, 109, 1889–1898. [Google Scholar] [CrossRef] [Green Version]
- United States Bureau of Economic Analysis. GDP & Personal Income. Available online: https://apps.bea.gov/itable/iTable.cfm?ReqID=70 (accessed on 1 November 2018).
- United States Census Bureau. American FactFinder: Educational Attainment. Available online: https://factfinder.census.gov/faces/tableservices/jsf/pages/productview.xhtml?pid=ACS_16_5YR_S1501 (accessed on 1 November 2018).
- United States Census Bureau. Urban and Rural. Available online: https://www.census.gov/geo/reference/urban-rural.html (accessed on 28 November 2018).
- Monnat, S. The Contributions of Socioeconomic and Opioid Supply Factors to Geographic Variation in US Drug Mortality Rates. Inst. New Econ. Think. Work. Pap. Ser. 2019, 68, 319–335. [Google Scholar]
- McKnight, E.R.; Bonny, A.E.; Lange, H.; Kline, D.M.; Abdel-Rasoul, M.; Gay, J.R.; Matson, S.C. Statewide opioid prescriptions and the prevalence of adolescent opioid misuse in Ohio. Am. J. Drug Alcohol Abus. 2017, 43, 299–305. [Google Scholar] [CrossRef] [Green Version]
- Green, T.C.; Grau, L.E.; Carver, H.W.; Kinzly, M.; Heimer, R. Epidemiologic trends and geographic patterns of fatal opioid intoxications in Connecticut, USA: 1997–2007. Drug Alcohol Depend. 2011, 115, 221–228. [Google Scholar] [CrossRef] [Green Version]
- Danovich, D.; Greenstein, J.; Chacko, J.; Hahn, B.; Ardolic, B.; Ilyaguyev, B.; Berwald, N. Effect of New York State Electronic Prescribing Mandate on Opioid Prescribing Patterns. J. Emerg. Med. 2019, 57, 156–161. [Google Scholar] [CrossRef]
- United States Census Bureau. American FactFinder: Urban and Rural. Available online: https://factfinder.census.gov/faces/tableservices/jsf/pages/productview.xhtml?pid=DEC_10_SF1_P2 (accessed on 1 November 2018).
- United States Bureau of Labor Statistics. Local Area Unemployment Statistics: Handbook of Methods. Available online: https://www.bls.gov/opub/hom/lau/pdf/lau.pdf (accessed on 28 November 2018).
- Pugatch, D.; Strong, L.L.; Has, P.; Patterson, D.; Combs, C.; Reinert, S.; Rich, J.D.; Flanigan, T.; Brown, L. Heroin use in adolescents and young adults admitted for drug detoxification. J. Subst. Abus. 2001, 13, 337–346. [Google Scholar]
- Fink, D.S.; Hu, R.; Cerdá, M.; Keyes, K.M.; Marshall, B.D.; Galea, S.; Martins, S.S. Patterns of major depression and nonmedical use of prescription opioids in the United States. Drug Alcohol Depend. 2015, 153, 258–264. [Google Scholar] [CrossRef] [PubMed] [Green Version]
- Brady, K.T.; McCauley, J.L.; Back, S.E. Prescription Opioid Misuse, Abuse, and Treatment in the United States: An Update. Am. J. Psychiatry 2015, 173, 18–26. [Google Scholar] [CrossRef] [PubMed] [Green Version]
- Dart, R.C.; Surratt, H.; Cicero, T.J.; Parrino, M.W.; Severtson, S.G.; Bucher-Bartelson, B.; Green, J.L. Trends in Opioid Analgesic Abuse and Mortality in the United States. N. Engl. J. Med. 2015, 372, 241–248. [Google Scholar] [CrossRef] [Green Version]
- Naples, J.G.; Gellad, W.F.; Hanlon, J.T. The Role of Opioid Analgesics in Geriatric Pain Management. Clin. Geriatr. Med. 2016, 32, 725–735. [Google Scholar] [CrossRef]
- Mars, S.G.; Fessel, J.N.; Bourgois, P.; Montero, F.; Karandinos, G.; Ciccarone, D. Heroin-related overdose: The unexplored influences of markets, marketing and source-types in the United States. Soc. Sci. Med. 2015, 140, 44–53. [Google Scholar] [CrossRef] [Green Version]
- McCabe, S.E.; Teter, C.J.; Boyd, C.J.; Wilens, T.E.; Schepis, T.S. Sources of Prescription Medication Misuse Among Young Adults in the United States: The Role of Educational Status. J. Clin. Psychiatry 2018, 79, 33–40. [Google Scholar] [CrossRef]
- Peck, K.R.; Parker, M.A.; Sigmon, S.C. Reasons for non-medical use of prescription opioids among young adults: Role of educational status. Prev. Med. 2019, 128, 105684. [Google Scholar] [CrossRef]
- Harris, M.C.; Kessler, L.M.; Murray, M.N.; Glenn, B. Prescription Opioids and Labor Market Pains: The Effect of Schedule II Opioids on Labor Force Participation and Unemployment. J. Hum. Resour. 2019, 55, 1017–9093R2. [Google Scholar]
- Degenhardt, L.; Grebely, J.; Stone, J.; Hickman, M.; Vickerman, P.; Marshall, B.D.L.; Bruneau, J.; Altice, F.L.; Henderson, G.; Rahimi-Movaghar, A.; et al. Global patterns of opioid use and dependence: Harms to populations, interventions, and future action. Lancet 2019, 394, 1560–1579. [Google Scholar] [CrossRef]
- Larance, B.; Degenhardt, L.; Peacock, A.; Gisev, N.; Mattick, R.; Colledge, S.; Campbell, G. Pharmaceutical opioid use and harm in Australia: The need for proactive and preventative responses. Drug Alcohol Rev. 2018, 37, S203–S205. [Google Scholar] [CrossRef]
- Fischer, B.; Patra, J.; Cruz, M.F.; Gittins, J.; Rehm, J. Comparing heroin users and prescription opioid users in a Canadian multi-site population of illicit opioid users. Drug Alcohol Rev. 2008, 27, 625–632. [Google Scholar] [CrossRef] [PubMed]
- Reuter, P.; Caulkins, J.P.; Midgette, G. Heroin use cannot be measured adequately with a general population survey. Addiction 2021, 116, 2600–2609. [Google Scholar] [CrossRef] [PubMed]
- Macmadu, A.; Carroll, J.J.; Hadland, S.E.; Green, T.C.; Marshall, B.D.L. Prevalence and correlates of fentanyl-contaminated heroin exposure among young adults who use prescription opioids non-medically. Addict. Behav. 2017, 68, 35–38. [Google Scholar] [CrossRef] [PubMed] [Green Version]
- Peacock, A.; Bruno, R.; Gisev, N.; Degenhardt, L.; Hall, W.; Sedefov, R.; White, J.; Thomas, K.V.; Farrell, M.; Griffiths, P. New psychoactive substances: Challenges for drug surveillance, control, and public health responses. Lancet 2019, 394, 1668–1684. [Google Scholar] [CrossRef]
- Grigsby, T.J.; Howard, J.T. Prescription opioid misuse and comorbid substance use: Past 30-day prevalence, correlates and co-occurring behavioral indicators in the 2016 National Survey on Drug Use and Health. Am. J. Addict. 2019, 28, 111–118. [Google Scholar] [CrossRef] [Green Version]
- Griesler, P.C.; Hu, M.-C.; Wall, M.M.; Kandel, D.B. Medical Use and Misuse of Prescription Opioids in the US Adult Population: 2016–2017. Am. J. Public Health 2019, 109, 1258–1265. [Google Scholar] [CrossRef]
- Powell, D.; Alpert, A.; Pacula, R.L. A Transitioning Epidemic: How The Opioid Crisis Is Driving The Rise In Hepatitis C. Health Aff. 2019, 38, 287–294. [Google Scholar] [CrossRef]
- Cerdá, M.; Santaella, J.; Marshall, B.D.L.; Kim, J.H.; Martins, S.S. Nonmedical Prescription Opioid Use in Childhood and Early Adolescence Predicts Transitions to Heroin Use in Young Adulthood: A National Study. J. Pediatr. 2015, 167, 605–612.e2. [Google Scholar] [CrossRef] [Green Version]
- Schatman, M.E.; Ziegler, S.J. Pain management, prescription opioid mortality, and the CDC: Is the devil in the data? J. Pain Res. 2017, 10, 2489–2495. [Google Scholar] [CrossRef] [Green Version]
Publisher’s Note: MDPI stays neutral with regard to jurisdictional claims in published maps and institutional affiliations. |
© 2022 by the authors. Licensee MDPI, Basel, Switzerland. This article is an open access article distributed under the terms and conditions of the Creative Commons Attribution (CC BY) license (https://creativecommons.org/licenses/by/4.0/).