
Biomechanical Performance Factors in the Track and Field Sprint Start: A Systematic Review

 ,
, 
Abstract
:1. Introduction
2. Materials and Methods
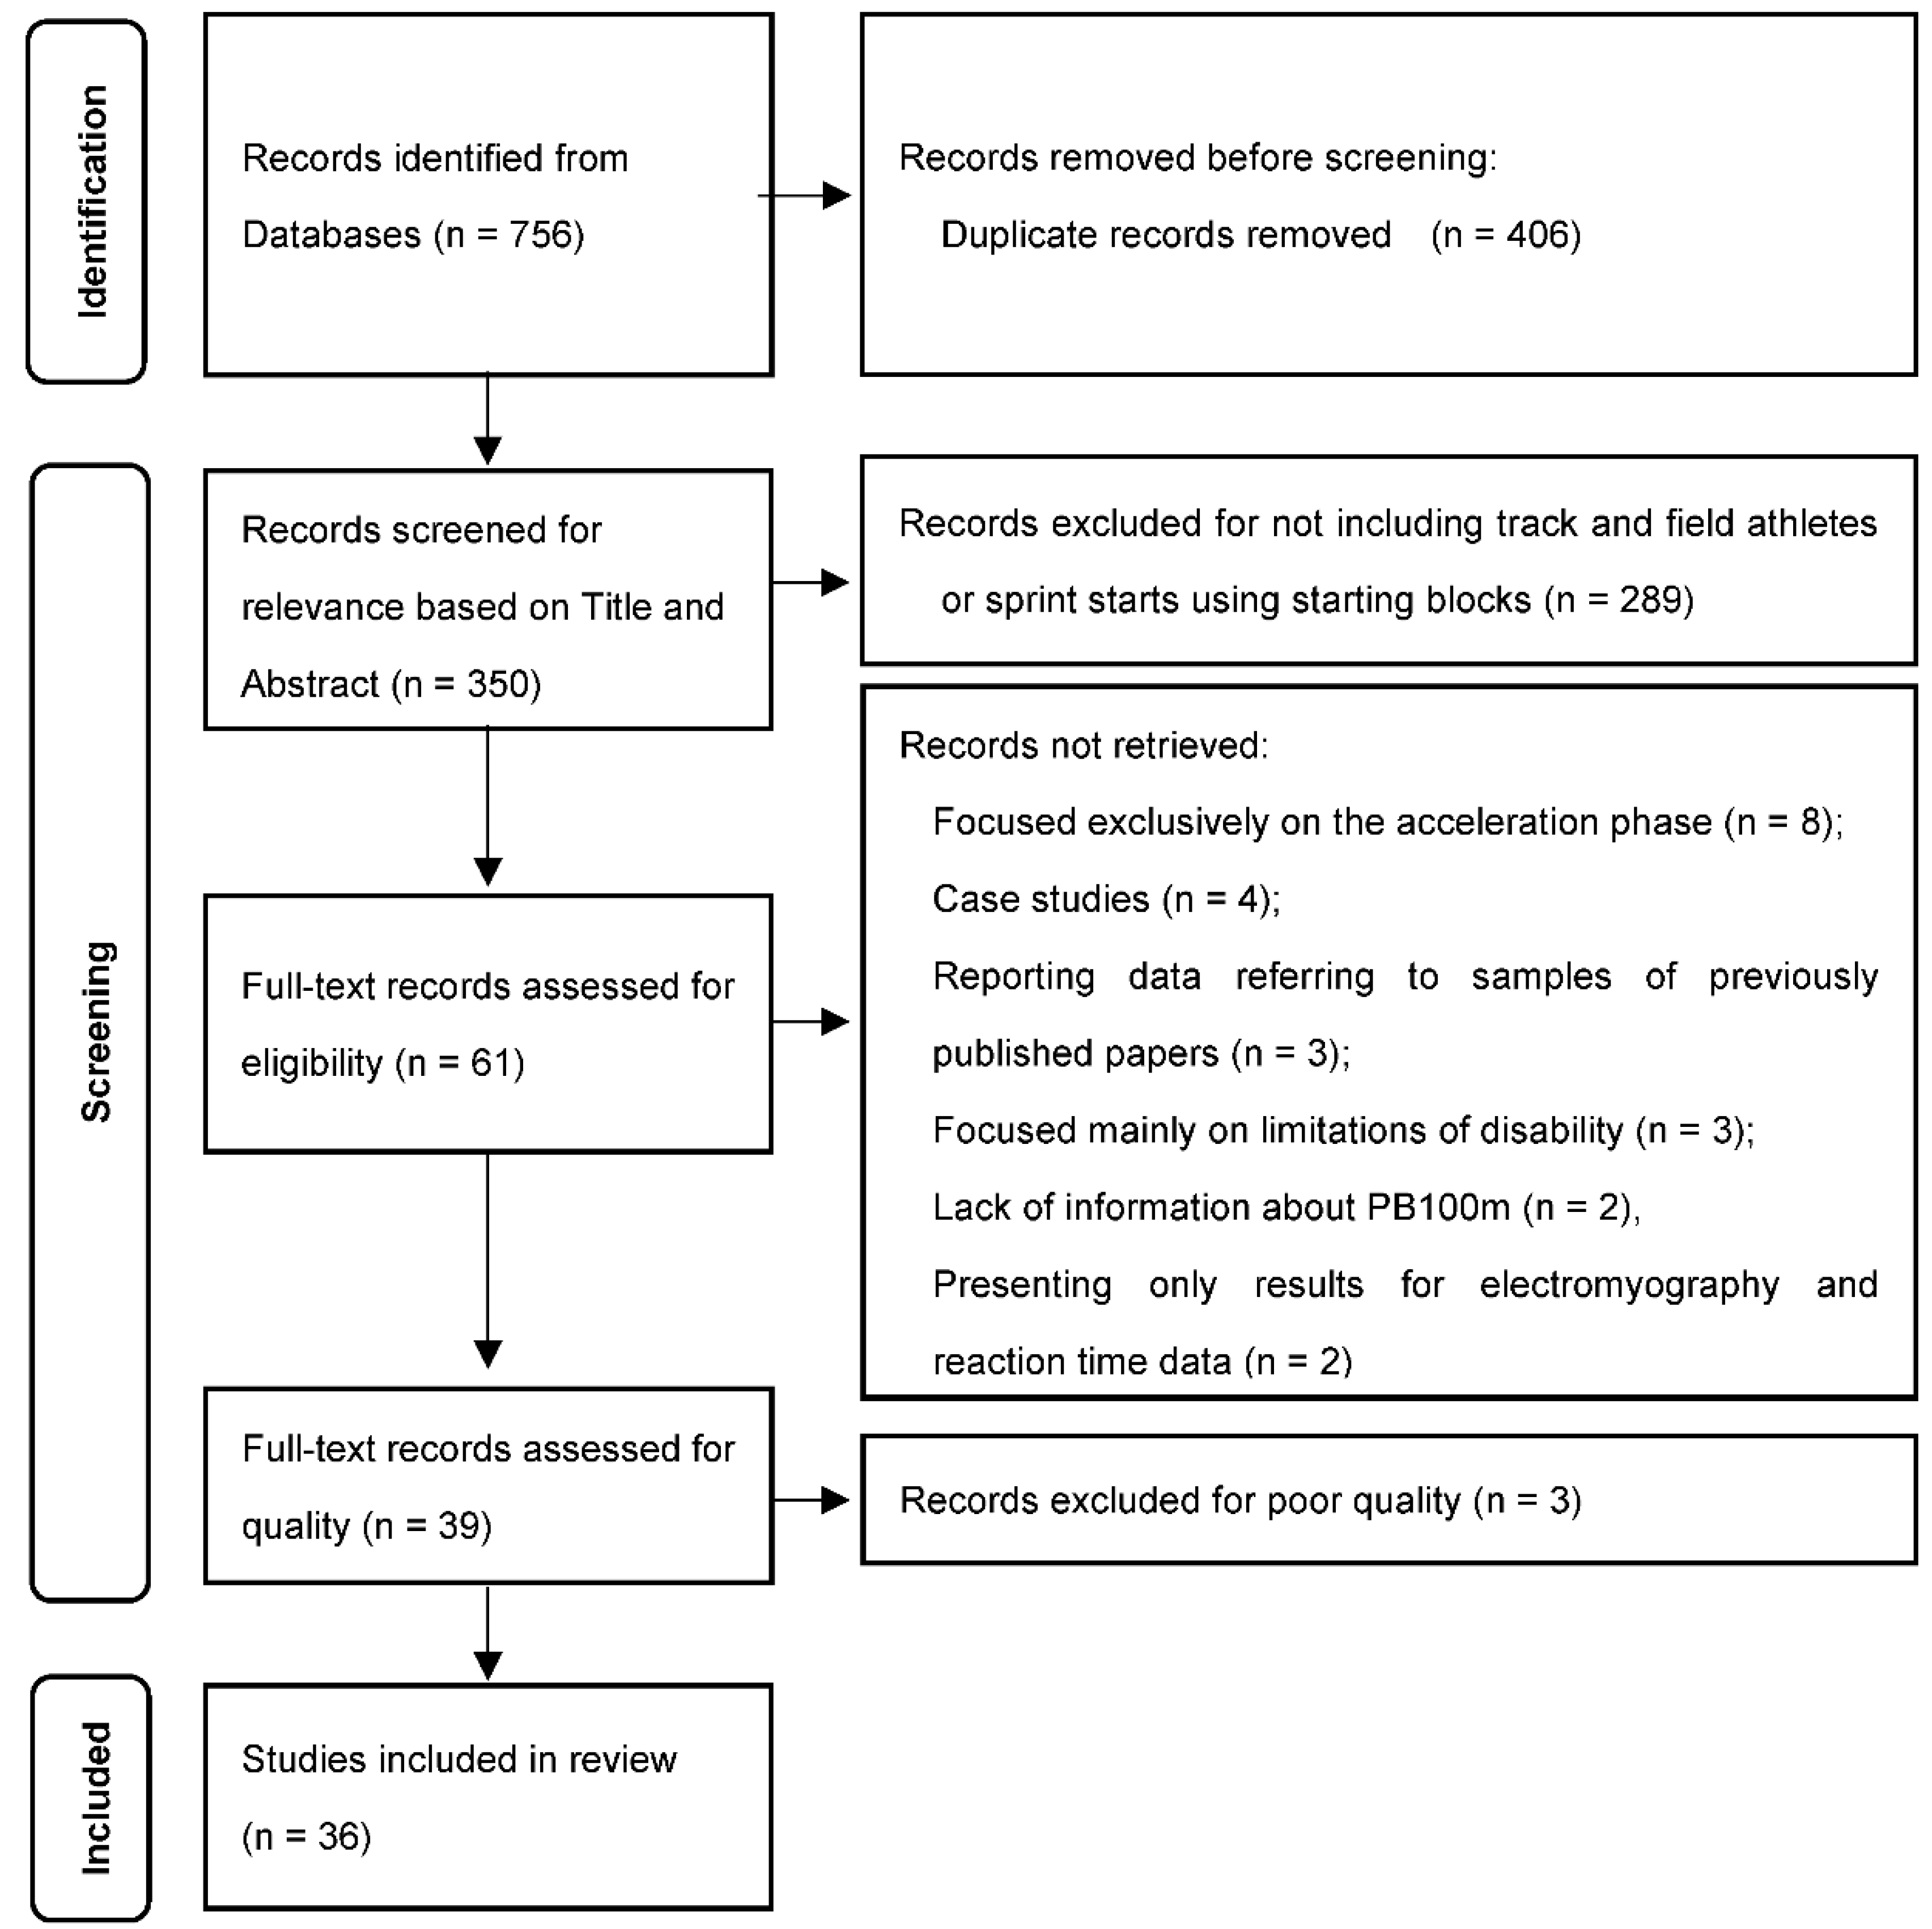
2.1. Article Search, Eligibility, Inclusion, and Exclusion Criteria
2.2. Quality of the Studies
2.3. Data Extraction
3. Results
3.1. Search Results
3.2. Quality of Studies
3.3. Basic Characteristics of Included Studies
3.4. Data Organization and Analysis
4. Discussion
4.1. The “Set” Position
4.1.1. Block Settings
4.1.2. Sprinter Body Posture
4.2. The Push-Off Phase
4.2.1. Push-Off Kinematics Analysis
4.2.2. Push-Off Kinetic Analysis
4.3. The First Two Steps
4.3.1. First Two Steps Kinematic Analysis
4.3.2. First Two Steps Kinetic Analysis
4.4. Strengths, Limitations, and Recommendations
5. Conclusions
Author Contributions
Funding
Institutional Review Board Statement
Informed Consent Statement
Data Availability Statement
Conflicts of Interest
Appendix A

| “Set” Position Kinematics | Study | Male | Female | Mixed | |||||||||||
|---|---|---|---|---|---|---|---|---|---|---|---|---|---|---|---|
| Inter-block spacing (cm) (m) | Cavedon, Sandri [12] | Usual condition 27.6 ± 2.4 cm | Anthropometric condition 36.8 ± 2.3 cm | ||||||||||||
| Čoh, Jost [13] | Slovene national sprinters 26.72 ± 2.33 cm | Slovene national sprinters 23.47 ± 1.88 cm *** | |||||||||||||
| Mero [18] | Trained sprinters 0.32 ± 0.05 m | ||||||||||||||
| Front block distance (to start line) (cm) (m) | Nagahara, Gleadhill [35] | National level sprinters 0.439 ± 0.045 m | |||||||||||||
| Cavedon, Sandri [12] | Usual condition 52.3 ± 4.8 cm | Anthropometric condition 49.1 ± 3.0 cm | |||||||||||||
| Coh, Peharec [5] | Faster sprinters 0.54 ± 0.05 m | Slower sprinters 0.51 ± 0.04 m | |||||||||||||
| Čoh, Jost [13] | Slovene national sprinters 55.15 ± 6.22 cm | Slovene national sprinters 45.49 ± 5.37 cm *** | |||||||||||||
| Mero [18] | Trained sprinters 0.51 ± 0.05 m | ||||||||||||||
| Rear block distance (to start line) (cm) (m) | Nagahara, Gleadhill [35] | National level sprinters 0.686 ± 0.049 m | |||||||||||||
| Coh, Peharec [5] | Faster sprinters 0.84 ± 0.09 m | Slower sprinters 0.79 ± 0.07 m | |||||||||||||
| Čoh, Jost [13] | Slovene national sprinters 81.88 ± 7.47 cm | Slovene national sprinters 68.96 ± 5.91 cm *** | |||||||||||||
| Mero [18] | Trained sprinters 0.83 ± 0.07 m | ||||||||||||||
| Horizontal projection of the CM to the starting line (cm) (m) | Ciacci, Merni [38] | World-class 0.199 ± 0.054 m | Elite 0.202 ± 0.066 m | World-class 0.162 ± 0.037 m | Elite 0.248 ± 0.056 m | ||||||||||
| Independent of category 0.201 ± 0.058 m | Independent of category 0.214 ± 0.066 m | ||||||||||||||
| Slawinski, Dumas [8] | Bunched start 21.7 ± 2.0 cm | Medium start 25.2 ± 1.9 cm | Elongated start 30.9 ± 3.0 cm | ||||||||||||
| Slawinski, Bonnefoy [7] | Elite 22.9 ± 1.5 cm | Well-trained 27.8 ± 2.8 cm * | |||||||||||||
| Gutierrez-Davilla, Dapena [17] | Normal start 0.310 ± 0.057 m | Pre-tensed start 0.346 ± 0.068 m *** | |||||||||||||
| Čoh, Jost [13] | Slovene national sprinters 18.77 ± 5.07 cm | Slovene national sprinters 15.03 ± 3.00 cm | |||||||||||||
| Mero [18] | Trained sprinters 0.29 ± 0.05 m | ||||||||||||||
| Vertical height of CM (cm) (m) | Ciacci, Merni [38] | World-class 0.643 ± 0.025 m | Elite 0.655 ± 0.038 m | World-class 0.533 ± 0.032 m | Elite 0.587 ± 0.037 m | ||||||||||
| Independent of category 0.650 ± 0.033 m | Independent of category 0.565 ± 0.044 m * | ||||||||||||||
| Chen, Wu [37] | Bunched start 0.57 ± 0.04 m | Medium start 0.56 ± 0.03 m | Elongated start 0.57 ± 0.03 m | ||||||||||||
| Slawinski, Dumas [8] | Bunched start 66.6 ± 2.4 cm | Medium start 66.5 ± 2.9 cm | Elongated start 65.5 ± 2.9 cm | ||||||||||||
| Slawinski, Bonnefoy [7] | Elite 65.7 ± 3.8 cm | Well-trained 62.6 ± 3.9 cm | |||||||||||||
| Čoh, Jost [13] | Slovene national sprinters 54.38 ± 4.81 cm | Slovene national sprinters 53.18 ± 2.04 cm | |||||||||||||
| Mero [18] | Trained sprinters 0.57 ± 0.04 m | ||||||||||||||
| Front leg hip angle (°) | Cavedon, Sandri [12] | Usual condition 47 ± 6 (a) | Anthropometric condition 43 ± 6 (a) | ||||||||||||
| Ciacci, Merni [38] | World-class 37.6 ± 0.6 (a) | Elite 44.9 ± 3.3 (a) | World-class 48.4 ± 14.6 (a) | Elite 46.7 ± 7.5 (a) | |||||||||||
| Independent of category 42.0 ± 4.5 (a) | Independent of category 47.4 ± 10.1 (a) | ||||||||||||||
| Bezodis, Salo [3] | World-class to university sprinters 47 ± 6 (a) | ||||||||||||||
| Debaere, Delecluse [6] | Elite sprinters 82.8 ± 10.1 (b) | ||||||||||||||
| Mero, Kuitunen [19] | Block angle 40° 52 ± 2 (a) | Block angle 60° 49 ± 2 (a) | |||||||||||||
| Čoh, Jost [13] | Slovene national sprinters 44.78 ± 6.15 (a) | Slovene national sprinters 42.36 ± 9.43 (a) | |||||||||||||
| Mero [18] | Trained sprinters 39 ± 7 (a) | ||||||||||||||
| Front leg knee angle (°) | Cavedon, Sandri [12] | Usual condition 92 ± 9 (c) | Anthropometric condition 98 ± 8 (c) | ||||||||||||
| Ciacci, Merni [38] | World-class 91.0 ± 9.8 (c) | Elite 99.3 ± 10.8 (c) | World-class 91.0 ± 10.1 (c) | Elite 100.1 ± 9.0 (c) | |||||||||||
| Independent of category 95.9 ± 10.7 (c) | Independent of category 96.4 ± 10.0 (c) | ||||||||||||||
| Bezodis, Salo [3] | World-class to university sprinters 86 ± 5 (c) | ||||||||||||||
| Debaere, Delecluse [6] | Elite sprinters 94.5 ± 11.2 (c) | ||||||||||||||
| Slawinski, Bonnefoy [7] | Elite 110.7 ± 9.3 (c) | Well-trained 106.1 ± 13.7 (c) | |||||||||||||
| Mero, Kuitunen [19] | Block angle 40° 103 ± 2 (c) | Block angle 60° 97 ± 2 (c) | |||||||||||||
| Čoh, Jost [13] | Slovene national sprinters 93.75 ± 8.26 (c) | Slovene national sprinters 103.38 ± 6.97 (c) * | |||||||||||||
| Mero [18] | Trained sprinters 96 ± 12 (c) | ||||||||||||||
| Front leg ankle angle (°) | Cavedon, Sandri [12] | Usual condition 92 ± 6 (d) | Anthropometric condition 93 ± 7 (d) | ||||||||||||
| Bezodis, Salo [3] | World-class to university sprinters 107 ± 2 (d) | ||||||||||||||
| Debaere, Delecluse [6] | Elite sprinters 82.3 ± 9.5 (d) | ||||||||||||||
| Mero, Kuitunen [19] | Block angle 40° 96 ± 2 (d) | Block angle 60° 111 ± 2 (d) | |||||||||||||
| Čoh, Jost [13] | Slovene national sprinters 97.55 ± 10.55 (d) | Slovene national sprinters 102.65 ± 6.58 (d) | |||||||||||||
| Mero [18] | Trained sprinters 94 ± 4 (d) | ||||||||||||||
| Rear leg hip angle (°) | Cavedon, Sandri [12] | Usual condition 77 ± 8 (a) | Anthropometric condition 84 ± 8 (a) | ||||||||||||
| Ciacci, Merni [38] | World-class 71.2 ± 5.6 (a) | Elite 62.6 ± 3.7 (a) | World-class 75.2 ± 14.2 (a) | Elite 69.5 ± 5.1 (a) | |||||||||||
| Independent of category 66.0 ± 6.2 (a) | Independent of category 71.8 ± 9.5 (a) | ||||||||||||||
| Bezodis, Salo [3] | World-class to university sprinters 77 ± 9 (a) | ||||||||||||||
| Debaere, Delecluse [6] | Elite sprinters 107.1 ± 9 (b) | ||||||||||||||
| Mero, Kuitunen [19] | Block angle 40° 83 ± 2 (a) | Block angle 60° 79 ± 2 (a) | |||||||||||||
| Čoh, Jost [13] | Slovene national sprinters 24.91 ± 4.27 (e) | Slovene national sprinters 19.25 ± 9.30 (e) | |||||||||||||
| Mero [18] | Trained sprinters 77 ± 9 (a) | ||||||||||||||
| Rear leg knee angle (°) | Cavedon, Sandri [12] | Usual condition 112 ± 11 (c) | Anthropometric condition 117 ± 11 (c) | ||||||||||||
| Ciacci, Merni [38] | World-class 120.7 ± 9.7 (c) | Elite 116.1 ± 7.6 (c) | World-class 113.6 ± 20.9 (c) | Elite 118.4 ± 6.6 (c) | |||||||||||
| Independent of category 118.0 ± 8.3 (c) | Independent of category 116.5 ± 13.3 (c) | ||||||||||||||
| Bezodis, Salo [3] | World-class to university sprinters 109 ± 9 (c) | ||||||||||||||
| Debaere, Delecluse [6] | Elite sprinters 112.8 ± 15.1 (c) | ||||||||||||||
| Slawinski, Bonnefoy [7] | Elite 135.5 ± 11.4 (c) | Well-trained 117.3 ± 10.1 (c) * | |||||||||||||
| Mero, Kuitunen [19] | Block angle 40° 131 ± 2 (c) | Block angle 60° 122 ± 2 (c) | |||||||||||||
| Čoh, Jost [13] | Slovene national sprinters 112.72 ± 13.31 (c) | Slovene national sprinters 115.59 ± 13.86 (c) | |||||||||||||
| Mero [18] | Trained sprinters 126 ± 16 (c) | ||||||||||||||
| Rear leg ankle angle (°) | Cavedon, Sandri [12] | Usual condition 87 ± 6 (d) | Anthropometric condition 85 ± 7 (d) | ||||||||||||
| Bezodis, Salo [3] | World-class to university sprinters 111 ± 12 (d) | ||||||||||||||
| Debaere, Delecluse [6] | Elite sprinters 82.5 ± 7.8 (d) | ||||||||||||||
| Mero, Kuitunen [19] | Block angle 40° 95 ± 3 (d) | Block angle 60° 109 ± 3 (d) | |||||||||||||
| Čoh, Jost [13] | Slovene national sprinters 97.45 ± 10.28 (d) | Slovene national sprinters 99.80 ± 6.44 (d) | |||||||||||||
| Mero [18] | Trained sprinters 96 ± 8 (d) | ||||||||||||||
| Trunk angle (°) | Chen, Wu [37] | Bunched start −20.4 ± 7.3 * | Medium start −14.9 ± 6.7 * | Elongated start −8.8 ± 10.8 (f) * | |||||||||||
Appendix B
| Block Phase Kinematics | Study | Male | Female | Mixed | |||||||||||
|---|---|---|---|---|---|---|---|---|---|---|---|---|---|---|---|
| Block time (ms) (s) | Graham-Smith, Colyer [39] | Seniors 365 ± 18 ms | Juniors 412 ± 49 ms | ||||||||||||
| Nagahara, Gleadhill [35] | National-level sprinters 0.369 s (a) | ||||||||||||||
| Sado, Yoshioka [23] | University-level sprinters 0.36 ± 0.03 s | ||||||||||||||
| Bezodis, Walton [10] | Sprint start-trained athletes 0.391 ± 0.038 s | ||||||||||||||
| Cavedon, Sandri [12] | Usual condition 0.421 ± 0.047 s | Anthropometric condition 0.427 ± 0.038 s | |||||||||||||
| Colyer, Graham-Smith [33] | Elite 0.360 ± 0.010 s (ƥ) | All sample 0.390 ± 0.039 s | |||||||||||||
| Sandamas, Gutierrez-Farewik [24] | Skating condition 0.37 ± 0.03 s | Narrow condition 0.38 ± 0.03 s | |||||||||||||
| Brazil, Exell [4] | Athletic sprinters 0.359 ± 0.014 s | ||||||||||||||
| Ciacci, Merni [38] | World-class 0.356 ± 0.011 s | Elite 0.323 ± 0.024 s | World-class 0.356 ± 0.018 s | Elite 0.323 ± 0.024 s | |||||||||||
| Independent of category 0.336 ± 0.025 s | Independent of category 0.336 ± 0.027 s | ||||||||||||||
| Coh, Peharec [5] | Faster sprinters 332 ± 28.73 ms | Slower sprinters 305 ± 24.35 ms | |||||||||||||
| Bezodis, Salo [3] | World-class to university sprinters 0.358 ± 0.022 s | ||||||||||||||
| Otsuka, Kurihara [21] | Normal condition 0.334 ± 0.031 s | Widened condition 0.330 ± 0.025 s | |||||||||||||
| Rabita, Dorel [22] | Elite 376 ± 24 ms | Sub-elite 394 ± 13 ms # | |||||||||||||
| Milanese, Bertucco [41] | Rear knee angle @ 90° 0.354 ± 0.015 s | @ 115° 0.348 ± 0.016 s | @ 135° 0.355 ± 0.014 s | ||||||||||||
| Otsuka, Shim [42] | Well-trained 0.349 ± 0.019 s | Trained 0.379 ± 0.022 s * | |||||||||||||
| Aerenhouts, Delecluse [1] | Elite Seniors 357 ± 29 ms | Elite Juniors 367 ± 28 ms | Elite Seniors 380 ± 16 ms | Elite Juniors 383 ± 19 ms | |||||||||||
| Slawinski, Dumas [8] | Bunched start 0.371 ± 0.016 s | Medium start 0.377 ± 0.017 s | Elongated start 0.427 ± 0.056 s | ||||||||||||
| Slawinski, Bonnefoy [7] | Elite 0.352 ± 0.018 s | Well-trained 0.351 ± 0.020 s | |||||||||||||
| Maulder, Bradshaw [40] | National and regional level sprinters 0.31 s (a) | ||||||||||||||
| Gutierrez-Davilla, Dapena [17] | Conventional start 0.375 ± 0.028 s | Pre-tensed start 0.386 ± 0.036 s * | |||||||||||||
| Mero, Kuitunen [19] | Block angle 40° 0.343 ± 0.036 s | Block angle 65° 0.333 ± 0.027 s | |||||||||||||
| Fortier, Basset [16] | Elite 399 ± 21 ms | Sub-elite 422 ± 33 ms * | |||||||||||||
| Čoh, Jost [13] | Slovene national sprinters 0.30 ± 0.03 s | Slovene national sprinters 0.34 ± 0.02 s | |||||||||||||
| Guissard, Duchateau [34] | Block angle 30° 0.321 ± 0.023 s | Block angle 50° 0.325 ± 0.035 s | Block angle 70° 0.317 ± 0.039 s | ||||||||||||
| Mero [18] | Trained sprinters 0.342 ± 0.022 s | ||||||||||||||
| Rear leg block time (ms) (s) | Nagahara, Gleadhill [35] | National-level sprinters 0.212 ± 0.029 s | |||||||||||||
| Sado, Yoshioka [23] | University-level sprinters 0.18 ± 0.02 s | ||||||||||||||
| Cavedon, Sandri [12] | Usual condition 0.211 ± 0.041 s | Anthropometric condition 0.212 ± 0.041 s | |||||||||||||
| Brazil, Exell [4] | Athletic sprinters 0.193 ± 0.012 s | ||||||||||||||
| Coh, Peharec [5] | Faster sprinters 162 ± 9.47 ms | Slower sprinters 149 ± 12.40 ms * | |||||||||||||
| Otsuka, Kurihara [21] | Normal Condition 0.175 ± 0.034 s | Widened condition 0.180 ± 0.023 s | |||||||||||||
| Milanese, Bertucco [41] | Rear knee angle @ 90° 0.12 ± 0.01 s | @115° 0.11 ± 0.01 s | @ 135° 0.09 ± 0.02 s | ||||||||||||
| Otsuka, Shim [42] | Well-trained 0.188 ± 0.022 s | Trained 0.187 ± 0.029 s | |||||||||||||
| Slawinski, Bonnefoy [7] | Elite 0.154 ± 0.017 s | Well-trained 0.140 ± 0.026 s | |||||||||||||
| Mero, Kuitunen [19] | Block angle 40° 0.188 ± 0.008 s | Block angle 65° 0.172 ± 0.015 s | |||||||||||||
| Fortier, Basset [16] | Elite 370 ± 18 ms (b) | Sub-elite 268 ± 58 ms | |||||||||||||
| Čoh, Jost [13] | Slovene national sprinters 0.20 ± 0.02 s | Slovene national sprinters 0.18 ± 0.03 s | |||||||||||||
| Ratio rear leg time/block time (%) | Sado, Yoshioka [23] | University-level sprinters 49.7 ± 5.1 | |||||||||||||
| Bezodis, Salo [3] | World-class to university sprinters 53 ± 5 | ||||||||||||||
| Milanese, Bertucco [41] | Rear knee angle @ 90° 34.62 ± 3.60 | @115° 31.30 ± 3.52 | @135° 28.65 ± 3.57 | ||||||||||||
| Slawinski, Bonnefoy [7] | Elite 43.5 ± 3.8 | Well-trained 39.8 ± 8.1 | |||||||||||||
| Block resultant velocity (m·s−1) | Chen, Wu [37] | Bunched start 3.32 ± 0.14 | Medium start 3.36 ± 0.15 | Elongated start 3.45 ± 0.22 | |||||||||||
| Slawinski, Dumas [8] | Bunched start 2.76 ± 0.11 | Medium start 2.84 ± 0.14 ¥ | Elongated start 2.89 ± 0.13 ¥ | ||||||||||||
| Slawinski, Bonnefoy [7] | Elite 3.48 ± 0.05 | Well-trained 3.24 ± 0.18 * | |||||||||||||
| Fortier, Basset [16] | Elite 3.28 ± 0.19 | Sub-elite 3.12 ± 0.30 | |||||||||||||
| Čoh, Jost [13] | Slovene national sprinters 3.37 ± 0.35 | Slovene national sprinters 3.09 ± 0.21 * | |||||||||||||
| Mero [18] | Trained sprinters 3.46 ± 0.32 | ||||||||||||||
| Block horizontal velocity (m·s−1) | Graham-Smith, Colyer [39] | Seniors 3.36 ± 0.15 | Juniors 3.16 ± 0.18 §§ | ||||||||||||
| Sado, Yoshioka [23] | University-level sprinters 3.31 ± 0.13 | ||||||||||||||
| Bezodis, Walton [10] | Sprint start-trained athletes 3.12 ± 0.21 | ||||||||||||||
| Cavedon, Sandri [12] | Usual condition 3.36 ± 0.35 | Anthropometric condition 3.50 ± 0.39 | |||||||||||||
| Colyer, Graham-Smith [33] | Elite 3.36 ± 0.13 (ƥ) | All sample 3.30 ± 0.20 | |||||||||||||
| Ciacci, Merni [38] | World-class 4.16 ± 0.39 | Elite 4.08 ± 0.08 | World-class 3.11 ± 0.39 | Elite 3.48 ± 0.23 | |||||||||||
| Independent of category 4.11 ± 0.24 | Independent of category 3.33 ± 0.34 * | ||||||||||||||
| Coh, Peharec [5] | Faster sprinters 3.38 ± 0.10 | Slower sprinters 3.19 ± 0.19 * | |||||||||||||
| Rabita, Dorel [22] | Elite 3.61 ± 0.08 | Sub-elite 3.17 ± 0.19 # | |||||||||||||
| Milanese, Bertucco [41] | Rear knee angle @ 90° 2.67 ± 0.26 | @ 115° 2.62 ± 0.23 | @ 135° 2.56 ± 0.24 | ||||||||||||
| Debaere, Delecluse [6] | Elite Sprinters 3.10 ± 0.25 | ||||||||||||||
| Aerenhouts, Delecluse [1] | Elite Seniors 2.9 ± 0.3 | Elite Juniors 2.9 ± 0.3 | Elite Seniors 2.8 ± 0.2 | Elite Juniors 2.7 ± 0.3 | |||||||||||
| Bezodis, Salo [2] | University-level sprinters 3.28 ± 0.24 | ||||||||||||||
| Maulder, Bradshaw [40] | National and regional level sprinters 3.40 ± 0.20 | ||||||||||||||
| Gutierrez-Davilla, Dapena [17] | Conventional start 3.21 ± 0.22 | Pre-tensed start 3.22 ± 0.24 | |||||||||||||
| Mero, Kuitunen [19] | Block angle 40° 3.39 ± 0.23 | Block angle 65° 3.30 ± 0.21 ** | |||||||||||||
| Čoh, Jost [13] | Slovene national sprinters 3.20 ± 0.19 | Slovene national sprinters 2.99 ± 0.23 * | |||||||||||||
| Guissard, Duchateau [34] | Block angle 30° 2.94 ± 0.20 | Block angle 50° 2.80 ± 0.23 | Block angle 70° 2.37 ± 0.31 | ||||||||||||
| Block vertical velocity (m·s−1) | Graham-Smith, Colyer [39] | Seniors 0.60 ± 0.12 | Juniors 0.61 ± 0.13 | ||||||||||||
| Sado, Yoshioka [23] | University-level sprinters 0.58 ± 0.08 | ||||||||||||||
| Colyer, Graham-Smith [33] | Elite 0.58 ± 0.06 | All sample 0.60 ± 0.11 | |||||||||||||
| Ciacci, Merni [38] | World-class −0.21 ± 0.27 (c) | Elite 0.59 ± 0.32 | World-class 0.38 ± 0.06 | Elite 0.52 ± 0.30 | |||||||||||
| Independent of category 0.27 ± 0.50 | Independent of category 0.47 ± 0.24 | ||||||||||||||
| Chen, Wu [37] | Bunched start 0.49 ± 0.19 | Medium start 0.40 ± 0.15 | Elongated start 0.42 ± 0.33 | ||||||||||||
| Debaere, Delecluse [6] | Elite sprinters 0.84 ± 0.13 | ||||||||||||||
| Slawinski, Bonnefoy [7] | Elite 0.52 ± 0.06 | Well-trained 0.51 ± 0.14 | |||||||||||||
| Čoh, Jost [13] | Slovene national sprinters 0.69 ± 0.21 | Slovene national sprinters 0.76 ± 0.19 | |||||||||||||
| Block acceleration (m·s−2) | Coh, Peharec [5] | Faster sprinters 7.47 ± 1.34 | Slower sprinters 7.35 ± 0.90 | ||||||||||||
| Otsuka, Kurihara [21] | Normal condition 9.65 ± 0.72 | Widened condition 9.73 ± 0.59 | |||||||||||||
| Otsuka, Shim [42] | Well-trained 9.72 ± 0.36 | Trained 8.41 ± 0.49 * | |||||||||||||
| Aerenhouts, Delecluse [1] | Elite Seniors 8.2 ± 0.9 | Elite Juniors 7.9 ±0.7 | Elite Seniors 7.3 ± 0.7 | Elite Juniors 7.0 ± 0.8 | |||||||||||
| Bezodis, Salo [2] | University-level sprinters 9.14 ± 0.99 | ||||||||||||||
| Slawinski, Bonnefoy [7] | Elite 9.5 ± 0.4 | Well-trained 8.8 ± 0.8 | |||||||||||||
| Maulder, Bradshaw [40] | National and regional level sprinters 8.00 ± 0.80 | ||||||||||||||
| Guissard, Duchateau [34] | Block angle 30° 9.03 ± 0.91 | Block angle 50° 8.36 ± 1.17 | Block angle 70° 7.46 ± 1.42 | ||||||||||||
| Take-off angle (°) (d) | Milanese, Bertucco [41] | Rear knee angle @ 90° 40.42 ± 2.74 | @ 115° 40.23 ± 2.13 | @ 135° 39.77 ± 2.50 | |||||||||||
| Slawinski, Bonnefoy [7] | Elite 34.7 ± 1.4 | Well-trained 34.3 ± 2.0 | |||||||||||||
| Maulder, Bradshaw [40] | National and regional level sprinters 42 ± 4 | ||||||||||||||
| Čoh, Jost [13] | Slovene national sprinters 49.54 ± 2.91 | Slovene national sprinters 53.20 ± 3.20 * | |||||||||||||
| CM projection angle (°) (e) | Graham-Smith, Colyer [39] | Seniors 10.2 ± 2.0 | Juniors 11.0 ± 2.1 § | ||||||||||||
| Colyer, Graham-Smith [33] | Elite 9.8 ± 0.8 (h) | All sample 10.3 ± 2.0 | |||||||||||||
| Horizontal CM ROM (m) | Gutierrez-Davilla, Dapena [17] | Conventional start 0.600 ± 0.046 | Pre-tensed start 0.619 ± 0.059 * | ||||||||||||
| Angular displacement (°) | |||||||||||||||
| Trunk | Bezodis, Salo [3] | World-class to university sprinters 46 ± 8 | |||||||||||||
| Front hip | World-class to university sprinters 113 ± 9 | ||||||||||||||
| Front knee | World-class to university sprinters 73 ± 7 | ||||||||||||||
| Front ankle | World-class to university sprinters 36 ± 10 | ||||||||||||||
| Rear hip | World-class to university sprinters 31 ± 13 (f) | ||||||||||||||
| Rear knee | World-class to university sprinters 18 ± 6 (f) | ||||||||||||||
| Rear ankle | World-class to university sprinters 19 ± 9 (f) | ||||||||||||||
| Ankle joint dorsiflexion (°) | Schrodter, Bruggemann [25] | Front block (g) 15.8 ± 7.4 | Rear block (g) 8.0 ± 5.7 *** | ||||||||||||
| Trunk angle at takeoff (°) (h) | Chen, Wu [37] | Bunched start 25.7 ± 6.1 | Medium start 29.1 ± 4.5 * | Elongated start 28.9 ± 4.5 | |||||||||||
| Maulder, Bradshaw [40] | National and regional level sprinters 22 ± 7 | ||||||||||||||
| Hip angle at takeoff (°) | Debaere, Delecluse [6] | Elite sprinters—Rear block 146.8 ± 9.4 (i) | Elite sprinters—Front block 183.2 ± 6.8 (i) | ||||||||||||
| Knee angle at takeoff (°) | Elite sprinters—Rear block 134.9 ± 11.2 (j) | Elite sprinters—Front block 177.4 ± 5.2 * (j) | |||||||||||||
| Ankle angle at takeoff (°) | Elite sprinters—Rear block 139.2 ±7.0 (k) | Elite sprinters—Front block 133.1 ± 6.7 (k) | |||||||||||||
| Joint angular velocity (°.s−1) | |||||||||||||||
| Trunk | Slawinski, Bonnefoy [36] | Elite sprinters 220.2 ± 57.5 | |||||||||||||
| Front hip | Elite sprinters 456.3 ± 17.7 | ||||||||||||||
| Front knee | Elite sprinters 660.2 ± 40.5 | ||||||||||||||
| Front ankle | Elite sprinters 641.5 ± 44.9 | ||||||||||||||
| Rear hip | Elite sprinters 425.7 ± 61.0 | ||||||||||||||
| Rear knee | Elite sprinters 651.4 ± 112.3 | ||||||||||||||
| Rear ankle | Elite sprinters 462.9 ± 74.7 | ||||||||||||||
| Block Phase Kinetics | Male | Mixed | ||||||||||||
|---|---|---|---|---|---|---|---|---|---|---|---|---|---|---|
| Block force | Initial force on blocks—“Set” position (N.N−1) | Gutierrez-Davilla, Dapena [17] | Normal start 0.113 ± 0.04 | Pre-tensed start 0.186 ± 0.053 *** | ||||||||||
| Relative average total force (NAF) (N·kg−1) | Sandamas, Gutierrez-Farewik [24] | Skating conditions 1.44 ± 0.07 BW (a) | Narrow condition 1.44 ± 0.07 BW (a) | |||||||||||
| Cavedon, Sandri [12] | Usual condition 11.37 ± 1.19 | Anthropometric condition 11.55 ± 1.12 | ||||||||||||
| Otsuka, Shim [42] | Well-trained sprinters 15.03 ± 0.32 | Trained sprinters 13.99 ± 0.65 | ||||||||||||
| Average horizontal force (AHF) (N) | Rabita, Dorel [22] | Elite sprinters 783 ± 59 | Sub-elite sprinters 596 ± 47 # | |||||||||||
| Mero [18] | Trained sprinters 655 ± 76 | |||||||||||||
| Relative average horizontal force (NAHF) (N·kg−1) (BW) | Colyer, Graham-Smith [33] | Elite sprinters 9.4 ± 0.1 N·kg−1 (ƥ) | All sample 8.7 ± 1.1 N·kg−1 | |||||||||||
| Sandamas, Gutierrez-Farewik [24] | Skating condition 0.87 ± 0.10 BW (a) (b) | Narrow condition 0.86 ± 0.10 BW (a) (b) | ||||||||||||
| Rabita, Dorel [22] | Elite sprinters 9.59 ± 0.53 N·kg−1 | Sub-elite sprinters 7.74 ± 0.82 N·kg−1 # | ||||||||||||
| Otsuka, Shim [42] | Well-trained sprinters 9.72 ± 0.36 N·kg−1 | Trained sprinters 8.41 ± 0.49 N·kg−1 * | ||||||||||||
| Peak-to-minimum horizontal force average change (N·kg−1) (transition from bilateral to unilateral pushing) | Colyer, Graham-Smith [33] | Elite sprinters −10.3 ± 3.1 (ƥ) | All sample −10.6 ± 2.5 | |||||||||||
| Resultant force front block resultant force (N) | Coh, Peharec [5] | Faster sprinters 1104 ± 82.53 | Slower sprinters 1073 ± 56.21 | |||||||||||
| Relative front block resultant mean force (N·kg−1) | Nagahara, Gleadhill [35] | Normal condition 9.25 ± 0.39 | Anterior condition 9.03 ± 0.63 | Posterior condition 9.44 ± 0.84 | ||||||||||
| Otsuka, Shim [42] | Well-trained sprinters 10.03 ± 1.07 | Trained sprinters 9.62 ± 0.94 | ||||||||||||
| Rear block resultant force (N) | Coh, Peharec [5] | Faster sprinters 913 ± 89.23 | Slower sprinters 771 ± 55.09 ** | |||||||||||
| Relative rear block resultant mean force (N·kg−1) | Nagahara, Gleadhill [35] | Normal condition 7.20 ± 0.52 | Anterior condition 6.05 ± 1.55 | Posterior condition 8.23 ± 1.13 * (c) | ||||||||||
| Otsuka, Shim [42] | Well-trained sprinters 7.71 ± 1.24 | Trained sprinters 7.46 ± 1.04 | ||||||||||||
| Horizontal force | ||||||||||||||
| Front block horizontal maximal force (N) | Coh, Peharec [5] | Faster sprinters 461 ± 51.05 | Slower sprinters 398 ± 56.73 | |||||||||||
| Aerenhouts, Delecluse [1] | Elite Seniors 686 ± 110 | Elite Juniors 623 ± 105 | Elite Seniors (d) 482 ± 98 | Elite Juniors (d) 454 ± 65 | ||||||||||
| Relative front block horizontal maximal force (N·kg−1) | Cavedon, Sandri [12] | Usual condition 6.02 ± 0.71 | Anthropometric condition 5.91 ± 0.65 | |||||||||||
| Relative front block horizontal mean force (N·kg−1) | Nagahara, Gleadhill [35] | Normal condition 5.87 ± 0.38 | Anterior condition 5.93 ± 0.56 | Posterior condition 6.25 ± 0.64 | ||||||||||
| Otsuka, Shim [42] | Well-trained sprinters 6.70 ± 0.58 | Trained sprinters 5.99 ± 0.67 | ||||||||||||
| Rear block horizontal maximal force (N) | Coh, Peharec [5] | Faster sprinters 460 ± 58.12 | Slower sprinters 423 ± 45.50 | |||||||||||
| Aerenhouts, Delecluse [1] | Elite Seniors 785 ± 220 | Elite Juniors 697 ± 143 | Elite Seniors (d) 485 ± 986 | Elite Juniors (d) 435 ± 115 | ||||||||||
| Relative rear block horizontal maximal force (N·kg−1) | Cavedon, Sandri [12] | Usual condition 4.52 ± 1.09 | Anthropometric condition 4.95 ± 1.34 * | |||||||||||
| Relative rear block horizontal mean force (N·kg−1) | Nagahara, Gleadhill [35] | Normal condition 5.18 ± 0.38 | Anterior condition 3.97 ± 1.17 | Posterior condition 6.14 ± 0.86 ** (c) | ||||||||||
| Otsuka, Shim [42] | Well-trained sprinters 5.82 ± 0.71 | Trained sprinters 5.41 ± 0.88 | ||||||||||||
| Vertical force | ||||||||||||||
| Front block vertical maximal force (N) | Coh, Peharec [5] | Faster sprinters 1019 ± 69.99 | Slower sprinters 978 ± 43.12 | |||||||||||
| Relative front block vertical maximal force (N·kg−1) | Cavedon, Sandri [12] | Usual condition 6.13 ± 0.92 | Anthropometric condition 6.12 ± 0.90 | |||||||||||
| Relative front block vertical mean force (N·kg−1) | Nagahara, Gleadhill [35] | Normal condition 7.15 ± 0.29 | Anterior condition 6.81 ± 0.40 | Posterior condition 7.07 ± 0.64 | ||||||||||
| Otsuka, Shim [42] | Well-trained sprinters 7.43 ± 1.01 | Trained sprinters 7.50 ± 0.78 | ||||||||||||
| Rear block vertical maximal force (N) | Coh, Peharec [5] | Faster sprinters 795 ± 91.29 | Slower sprinters 645 ± 41.55 ** | |||||||||||
| Relative rear block vertical maximal force (N·kg−1) | Cavedon, Sandri [12] | Usual condition 3.78 ± 1.12 | Anthropometric condition 3.96 ± 1.20 | |||||||||||
| Relative rear block vertical mean force (N·kg−1) | Nagahara, Gleadhill [35] | Normal condition 4.99 ± 0.57 | Anterior condition 4.53 ± 1.17 | Posterior condition 5.47 ± 0.83 | ||||||||||
| Otsuka, Shim [42] | Well-trained sprinters 5.03 ± 1.15 | Trained sprinters 5.12 ± 0.68 | ||||||||||||
| Maximal rate of force development (N·s−1) (N·kg−1·s−1) | Schrodter, Bruggemann [25] | World-class sprinters 259 ± 79 N·kg−1.s−1 | Well-trained sprinters 175 ± 86 N·kg−1.s−1 ** | |||||||||||
| Slawinski, Bonnefoy [7] | Elite 15505 ± 5397 N·s−1 | Well-trained 8459 ± 3811 N·s−1 * | ||||||||||||
| Block power | Average horizontal block power (W) (e) | Bezodis, Walton [10] | Sprint start-trained athletes 832 ± 113 | |||||||||||
| Bezodis, Salo [3] (f) | World-class to university sprinters 1171 ± 268 | |||||||||||||
| Rabita, Dorel [22] | Elite sprinters 1415 ± 118 | Sub-elite sprinters 949 ± 124 # | ||||||||||||
| Bezodis, Salo [2] (f) | University-level sprinters 1094 ± 264 | |||||||||||||
| Relative average horizontal external power (W·kg−1) | Graham-Smith, Colyer [39] | Seniors sprinters 15.5 ± 1.5 | Juniors sprinters 12.4 ± 2.2 §§§ | |||||||||||
| Nagahara, Gleadhill [35] | Normal condition 14.8 ± 1.0 | Anterior condition 13.2 ± 1.3 | Posterior condition 16.2 ± 2.1 ** (c) | |||||||||||
| Colyer, Graham-Smith [33] | Mix of elite, senior and junior sprinters 14.3 ± 2.3 | |||||||||||||
| Nagahara and Ohshima [20] | Sprinters 14.7 ± 1.4 | |||||||||||||
| Rabita, Dorel [22] | Elite sprinters 17.3 ± 1.3 | Sub-elite sprinters 12.3 ± 1.9 # | ||||||||||||
| Normalized average horizontal external power (g) | Sado, Yoshioka [23] | University-level sprinters 0.55 ± 0.05 | ||||||||||||
| Bezodis, Walton [10] | Sprint start-trained athletes 0.43 ± 0.06 (associated with block velocity) | |||||||||||||
| Cavedon, Sandri [12] | Usual condition 0.47 ± 0.90 | Anthropometric condition 0.50 ± 0.10 * | ||||||||||||
| Sandamas, Gutierrez-Farewik [24] | Skating condition 0.46 ± 0.07 | Narrow condition 0.45 ± 0.07 | ||||||||||||
| Schrodter, Bruggemann [25] | World-class sprinters 0.360 ± 0.098 | Well-trained sprinters 0.305 ± 0.056 ** (h) | ||||||||||||
| Bezodis, Salo [3] | World-class to university sprinters 0.53 ± 0.08 (associated with PB100m) | |||||||||||||
| Otsuka, Kurihara [21] | Normal condition 0.539 ± 0.053 | Widened condition 0.543 ± 0.051 | ||||||||||||
| Bezodis, Salo [2] | University-level sprinters 0.51 ± 0.09 (associated with block velocity and acceleration data) | |||||||||||||
| Force impulse | Absolute force impulse (N·s) | Coh, Peharec [5] | Faster sprinters 294.3 ± 21.1 | Slower sprinters 269.5 ± 17.9 * | ||||||||||
| Milanese, Bertucco [41] | Rear knee angle @ 90° 175.00 ± 26.49 | @ 115° 172.00 ± 25.49 | @ 135° 168.35 ± 25.61 | |||||||||||
| Slawinski, Bonnefoy [7] | Elite sprinters 276.2 ± 36.0 | Well-trained sprinters 215.4 ± 28.5 * | ||||||||||||
| Mero, Kuitunen [19] | Block angle 40° 249.0 ± 21.5 | Block angle 65° 240.3 ± 22.9 | ||||||||||||
| Relative force impulse (N·s·kg−1) (m·s−1) | Cavedon, Sandri [12] | Usual condition 4.76 ± 0.55 N·s·kg−1 | Anthropometric condition 4.93 ± 0.56 N·s·kg−1 | |||||||||||
| Sandamas, Gutierrez-Farewik [24] | Skating conditions 3.27 ± 0.15 m·s−1 | Narrow conditions 3.25 ± 0.16 m·s−1 | ||||||||||||
| Horizontal force impulse (N·s) | Coh, Peharec [5] | Faster sprinters 140.7 ± 11.5 | Slower sprinters 112.8 ± 10.4 *** | |||||||||||
| Mero [18] | Trained sprinters 223 ± 18 | |||||||||||||
| Relative horizontal force impulse (m·s−1) (N·s·kg−1) | Sandamas, Gutierrez-Farewik [24] | Skating condition 3.21 ± 0.16 m·s−1 | Narrow condition 3.19 ± 0.16 m·s−1 | |||||||||||
| Otsuka, Kurihara [21] | Normal condition 3.20 ± 0.18 N·s·kg−1 | Widened condition 3.20 ± 0.20 N·s·kg−1 | ||||||||||||
| Otsuka, Shim [42] | Well-trained sprinters 3.407 ± 0.149 N·s·kg−1 | Trained sprinters 3.179 ± 0.163 N·s·kg−1 | ||||||||||||
| Vertical force impulse (N·s) | Coh, Peharec [5] | Faster sprinters 256.1± 9.7 | Slower sprinters 209.8 ± 8.9 *** | |||||||||||
| Mero [18] | Trained sprinters 173 ± 30 | |||||||||||||
| Normalized vertical force impulse (m·s−1) | Sandamas, Gutierrez-Farewik [24] | Skating condition 0.54 ± 0.07 | Narrow condition 0.59 ± 0.08 * | |||||||||||
| Normalized me-diolateral force impulse (m·s−1) | Sandamas, Gutierrez-Farewik [24] | Skating conditions 0.23 ± 0.10 | Narrow condition 0.08 ± 0.05 * | |||||||||||
| Force impulse of front block (N·s) | Coh, Peharec [5] | Faster sprinters 221.3 ± 15.8 | Slower sprinters 178.3 ± 13.1 *** | |||||||||||
| Force impulse of rear block (N·s) | Coh, Peharec [5] | Faster sprinters 76.7 ± 8.8 | Slower sprinters 71.1 ± 6.7 | |||||||||||
| COP location (m) | Front block anteroposterior location | Nagahara and Ohshima [20] | Sprinters −0.080 ± 0.024 (ƥƥ) | |||||||||||
| Front block vertical location | Sprinters 0.061 ± 0.022 (ƥ) | |||||||||||||
| Rear block anteroposterior location | Sprinters −0.082 ± 0.018 | |||||||||||||
| Rear block vertical location | Sprinters 0.064 ± 0.018 (ƥ) | |||||||||||||
| Front block location | Sprinters −0.45 ± 0.05 (ƥƥ) | |||||||||||||
| Rear block location | Sprinters −0.69 ± 0.06 | |||||||||||||
| Peak joint moments | Peak ankle ex-tension moment | Brazil, Exell [4] | Rear block 0.236 ± 0.044 (i) | Front block 0.172 ± 0.032 (i) * | ||||||||||
| Peak knee exten-sion moment | Rear block 0.054 ± 0.020 (i) | Front block 0.199 ± 0.067 (i) * | ||||||||||||
| Peak hip exten-sion moment | Rear block 0.315 ± 0.086 (i) | Front block 0.349 ± 0.035 (i) | ||||||||||||
| Peak lumbosa-cral extension moment (N·s−1) | Sado, Yoshioka [23] | University-level sprinters 3.64 ± 0.39 (j) (ƥ) | ||||||||||||
| Peak joint powers | Peak positive ankle power | Brazil, Exell [4] | Rear block 0.236 ± 0.066 (i) | Front block 0.388 ± 0.084 (i) * | ||||||||||
| Peak positive knee power | Rear block 0.047 ± 0.026 (i) | Front block 0.440 ± 0.177 (i) * | ||||||||||||
| Peak positive hip power | Rear block 0.408 ± 0.152 (i) | Front block 0.576 ± 0.071 (i) * | ||||||||||||
Appendix C
| First and Second Steps Kinematics | Study | Male | Female | Mixed | |||||||||||
|---|---|---|---|---|---|---|---|---|---|---|---|---|---|---|---|
| First Step | |||||||||||||||
| First step length (m) (cm) | Cavedon, Sandri [12] | Usual condition 1.09 ± 0.11 nor. to leg length | Anthropometric condition 1.12 ± 0.12 nor. to leg length | ||||||||||||
| Ciacci, Merni [38] | World-class 1.135 ± 0.025 m | Elite 0.968 ± 0.162 m | World-class 1.068 ± 0.032 m | Elite 0.950 ± 0.099 m | |||||||||||
| Independent of category 1.035 ± 0.149 m | Independent of category 0.997 ± 0.097 m | ||||||||||||||
| Coh, Peharec [5] | Faster sprinters 1.30 ± 0.51 m | Slower sprinters 1.06 ± 0.60 m § | |||||||||||||
| Debaere, Vanwanseele [15] | Adult sprinters 1.00 ± 0.07 m | U18 sprinters 0.94 ± 0.11 m | U16 sprinters 0.94 ± 0.10 m | ||||||||||||
| Chen, Wu [37] | Bunched start 0.97 ± 0.10 m | Medium start 1.00 ± 0.12 m * | Elongated start 1.03 ± 0.10 m * | ||||||||||||
| Bezodis, Salo [3] | World-class to university sprinters 1.10 ± 0.07 normalized to step length | ||||||||||||||
| Rabita, Dorel [22] | Elite 0.96 ± 0.16 m | Sub-elite 1.01 ± 0.06 m | |||||||||||||
| Milanese, Bertucco [41] | Rear knee angle @ 90° 1.23 ± 0.12 m | @ 115° 1.22 ± 0.11 m | @ 135° 1.21 ± 0.13 m | ||||||||||||
| Aerenhouts, Delecluse [1] | Elite Seniors 85 ± 33 cm | Elite Juniors 63 ±27 cm * | Elite Seniors 82 ± 19 cm | Elite Juniors 61 ± 20 cm * | |||||||||||
| Slawinski, Bonnefoy [7] | Elite 137.1 ± 9.0 cm | Well-trained 120.8 ± 8.7 cm * | |||||||||||||
| Maulder, Bradshaw [40] | National and regional level sprinters 1.04 ± 0.03 m | ||||||||||||||
| Mero, Kuitunen [19] | Block angle 40° 1.09 ± 0.06 m | Block angle 65° 1.06 ± 0.06 m | |||||||||||||
| Čoh, Jost [13] | Slovene national sprinters 100.85 ± 9.79 cm | Slovene national sprinters 98.64 ± 6.74 cm | |||||||||||||
| First step contact time (ms) (s) | Werkhausen, Willwacher [43] | Germany national sprinters 0.20 ± 0.02 s | |||||||||||||
| Graham-Smith, Colyer [39] | Seniors 0.195 ± 0.022 s | Juniors 0.202 ± 0.024 s | |||||||||||||
| Sandamas, Gutierrez-Farewik [24] | Skating condition 0.21 ± 0.01 s | Narrow condition 0.20 ± 0.01 s | |||||||||||||
| Aeles, Jonkers [9] | Adult sprinters 0.191 ± 0.024 s | Young sprinters 0.199 ± 0.023 s | |||||||||||||
| Ciacci, Merni [38] | World-class 0.210 ± 0.035 s | Elite 0.176 ± 0.008 s | World-class 0.225 ± 0.034 s | Elite 0.166 ± 0.017 s | |||||||||||
| Independent of category 0.189 ± 0.027 s | Independent of category 0.190 ± 0.038 s | ||||||||||||||
| Coh, Peharec [5] | Faster sprinters 170 ± 18.17 ms | Slower sprinters 174 ± 16.94 ms | |||||||||||||
| Aerenhouts, Delecluse [1] | Elite Seniors 173 ± 67 ms | Elite Juniors 199 ± 24 ms | Elite Seniors 196 ± 62 ms | Elite Juniors 210 ± 17 ms | |||||||||||
| Slawinski, Bonnefoy [7] | Elite 0.173 ± 0.010 s | Well-trained 0.167 ± 0.011 s | |||||||||||||
| Maulder, Bradshaw [40] | National and regional level sprinters 0.20 ± 0.02 s | ||||||||||||||
| Mero, Kuitunen [19] | Block angle 40° 0.185 ± 0.020 s | Block angle 65° 0.197 ± 0.019 s | |||||||||||||
| First flight time (ms) (s) | Ciacci, Merni [38] | World-class 0.045 ± 0.025 s | Elite 0.064 ± 0.009 s | World-class 0.045 ± 0.025 s | Elite 0.085 ± 0.011 s | ||||||||||
| Independent of category 0.056 ± 0.019 s | Independent of category 0.069 ± 0.027 s | ||||||||||||||
| Bezodis, Salo [3] | World-class to university sprinters 0.073 ± 0.022 s | ||||||||||||||
| Rabita, Dorel [22] | Elite 81 ± 13 ms | Sub-elite 70 ± 25 ms | |||||||||||||
| Slawinski, Bonnefoy [7] | Elite 0.093 ± 0.009 s | Well-trained 0.087 ± 0.021 s | |||||||||||||
| Maulder, Bradshaw [40] | National and regional level sprinters 0.07 ± 0.01 s | ||||||||||||||
| Horizontal CM position—first step touchdown (cm) (a) | Slawinski, Bonnefoy [7] | Elite 68.5 ± 4.7 | Well-trained 58.0 ± 8.1 * | ||||||||||||
| Normalized first step touchdown distance (b) | Bezodis, Salo [3] | World-class to university sprinters −0.20 ± 0.07 | |||||||||||||
| Horizontal CM position—first step takeoff (cm) (a) | Slawinski, Bonnefoy [7] | Elite 137.1 ± 9.0 | Well-trained 120.8 ± 8.7 * | ||||||||||||
| First step resultant velocity (m·s−1) | Debaere, Vanwanseele [15] | Adult sprinters 4.34 ± 0.25 | U18 sprinters 4.06 ± 0.24 # | U16 sprinters 4.01 ± 0.25 # | |||||||||||
| Slawinski, Dumas [8] | Bunched start 3.81 ± 0.18 | Medium start 3.85 ± 0.16 | Elongated start 3.90 ± 0.15 | ||||||||||||
| Slawinski, Bonnefoy [7] | Elite 4.69 ± 0.15 | Well-trained 4.42 ± 0.11 * | |||||||||||||
| Čoh, Jost [13] | Slovene national sprinters 4.48 ± 0.29 | Slovene national sprinters 4.29 ± 0.18 | |||||||||||||
| Mero [18] | Trained sprinters 4.65 ± 0.28 | ||||||||||||||
| First step horizontal velocity (touchdown) (m·s−1) | Sandamas, Gutierrez-Farewik [24] | Skating condition 3.10 ± 0.16 | Narrow condition 3.08 ± 0.16 | ||||||||||||
| First step horizontal velocity (takeoff) (m·s−1) | Graham-Smith, Colyer [39] | Seniors 4.60 ± 0.23 | Juniors 4.39 ± 0.21 | ||||||||||||
| Sandamas, Gutierrez-Farewik [24] | Skating condition 4.37 ± 0.18 | Narrow condition 4.32 ± 0.15 * | |||||||||||||
| Debaere, Delecluse [6] | Elite sprinters 4.28 ± 0.27 | ||||||||||||||
| Čoh, Jost [13] | Slovene national sprinters 4.47 ± 0.29 | Slovene national sprinters 4.25 ± 0.18 * | |||||||||||||
| First step change in horizontal velocity (m·s−1) | Werkhausen, Willwacher [43] | Germany national sprinters 1.09 ± 0.06 | |||||||||||||
| Aeles, Jonkers [9] | Adult sprinters 0.82 ± 0.39 | Young sprinters 1.09 ± 0.25 * | |||||||||||||
| First step vertical velocity (m·s−1) | Graham-Smith, Colyer [39] | Seniors 0.46 ± 0.15 | Juniors 0.54 ± 0.10 | ||||||||||||
| Chen, Wu [37] | Bunched start 0.27 ± 0.12 | Medium start 0.28 ± 0.10 | Elongated start 0.39 ± 0.13 * | ||||||||||||
| Debaere, Delecluse [6] | Elite sprinters 0.67 ± 0.12 | ||||||||||||||
| Slawinski, Bonnefoy [7] | Elite 0.35 ± 0.03 | Well-trained 0.42 ± 0.09 | |||||||||||||
| Čoh, Jost [13] | Slovene national sprinters 0.37 ± 0.19 * | Slovene national sprinters 0.52 ± 0.10 * | |||||||||||||
| First step CM projection angle (°) (c) | Graham-Smith, Colyer [39] | Seniors 5.7 ± 1.9 | Juniors 7.1 ± 1.4 §§ | ||||||||||||
| First step takeoff angle (°) (d) | Maulder, Bradshaw [40] | National and regional level sprinters 43 ± 2 | |||||||||||||
| Trunk angle at touchdown—first step (°) (e) | Chen, Wu [37] | Bunched start 27.2 ± 5.4 | Medium start 30.9 ± 4.1 * | Elongated start 29.9 ± 4.7 | |||||||||||
| Maulder, Bradshaw [40] | National and regional level sprinters 32 ± 8 | ||||||||||||||
| Hip angle at touchdown—first step (°) | Bezodis, Salo [3] | World-class to university sprinters 95 ± 9 (f) | |||||||||||||
| Debaere, Delecluse [6] | Elite sprinters 121.2 ± 11.3 (g) | ||||||||||||||
| Knee angle at touchdown—first step (°) | Bezodis, Salo [3] | World-class to university sprinters 101 ± 7 (h) | |||||||||||||
| Debaere, Delecluse [6] | Elite sprinters 111.6 ± 9.1 (h) | ||||||||||||||
| Ankle angle at touchdown—first step (°) | Bezodis, Salo [3] | World-class to university sprinters 96 ± 7 (i) | |||||||||||||
| Debaere, Delecluse [6] | Elite sprinters 70.6 ± 5.8 (i) | ||||||||||||||
| Maximal plantar-flexion—first step (°) | Elite sprinters 111.3 ± 11.2 (i) | ||||||||||||||
| Knee angle at takeoff—first step (°) | Elite sprinters 165.2 ± 20.6 (h) | ||||||||||||||
| Hip angle at takeoff—first step (°) | Elite sprinters 180.6 ± 20.9 (g) | ||||||||||||||
| Trunk angle at takeoff—first step (°) (c) | Chen, Wu [37] | Bunched start 30.5 ± 6.9 | Medium start 31.9 ± 6.2 | Elongated start 32.5 ± 6.0 | |||||||||||
| Maulder, Bradshaw [40] | National and regional level sprinters 32 ± 8 | ||||||||||||||
| Hip ROM extension—first step (°) | Aeles, Jonkers [9] | Adult sprinters 64.50 ± 13.08 | Young sprinters 69.45 ± 9.53 | ||||||||||||
| Knee ROM extension—first step (°) | Adult sprinters 60.09 ± 7.24 | Young sprinters 58.24 ± 6.10 | |||||||||||||
| Ankle ROM dorsiflexion—first step (°) | Werkhausen, Willwacher [43] | Germany national sprinters 17 ± 3 | |||||||||||||
| Ankle ROM plantar flexion—first step (°) | Germany national sprinters 45 ± 6 | ||||||||||||||
| Aeles, Jonkers [9] | Adult sprinters 59.05 ± 7.40 | Young sprinters 50.96 ± 9.39 * | |||||||||||||
| Peak foot linear velocity (from the start to the first step) (m·s−1) | Chen, Wu [37] | Bunched start 6.31 ± 0.48 | Medium start 6.66 ± 0.55 * | Elongated start 6.79 ± 0.99 | |||||||||||
| Second Step | |||||||||||||||
| Second step length (m) (cm) | Cavedon, Sandri [12] | Usual condition 1.15 ± 0.14 nor. to leg length | Anthropometric condition 1.19 ± 0.12 nor. to leg length | ||||||||||||
| Ciacci, Merni [38] | World-class 1.143 ± 0.105 m | Elite 1.057 ± 0.150 m | World-class 1.098 ± 0.104 m | Elite 1.078 ± 0.181 m | |||||||||||
| Independent of category 1.091 ± 0.135 m | Independent of category 1.086 ± 0.148 m | ||||||||||||||
| Coh, Peharec [5] | Faster sprinters 1.03 ± 0.12 m | Slower sprinters 0.98 ± 0.33 m | |||||||||||||
| Debaere, Vanwanseele [15] | Adult sprinters 1.09 ± 0.06 m | U18 sprinters 1.01 ± 0.08 m # | U16 sprinters 1.02 ± 0.08 m # | ||||||||||||
| Chen, Wu [37] | Bunched start 2.02 ± 0.18 m | Medium start 2.08 ± 0.18 m | Elongated start 2.10 ± 0.19 m | ||||||||||||
| Milanese, Bertucco [41] | Rear knee angle @ 90° 1.96 ± 0.17 m | @ 115° 1.94 ± 0.12 m | @ 135° 1.93 ± 0.17 m | ||||||||||||
| Aerenhouts, Delecluse [1] | Elite Seniors 148 ± 25 cm | Elite Juniors 130 ± 20 cm | Elite Seniors 130 ± 14 cm | Elite Juniors 127 ± 11 cm | |||||||||||
| Slawinski, Bonnefoy [7] | Elite 106.6 ± 5.9 cm | Well-trained 105.3 ± 6.3 cm | |||||||||||||
| Maulder, Bradshaw [40] | National and regional level sprinters 1.08 ± 0.13 m | ||||||||||||||
| Čoh, Jost [13] | Slovene national sprinters 1.30 ± 0.51 m | Slovene national sprinters 1.06 ± 0.60 m | |||||||||||||
| Second step contact time (ms) (s) | Werkhausen, Willwacher [43] | Germany national sprinters 0.17 ±0.02 s | |||||||||||||
| Graham-Smith, Colyer [39] | Seniors 0.173 ± 0.018 s | Juniors 0.173 ± 0.020 s | |||||||||||||
| Ciacci, Merni [38] | World-class 0.170 ± 0.026 s | Elite 0.148 ± 0.008 s | World-class 0.180 ± 0.016 s | Elite 0.148 ± 0.013 s | |||||||||||
| Independent of category 0.157 ± 0.020 s | Independent of category 0.161 ± 0.021 s | ||||||||||||||
| Coh, Peharec [5] | Faster sprinters 157 ± 15.42 ms | Slower sprinters 149 ± 18.87 ms | |||||||||||||
| Aerenhouts, Delecluse [1] | Elite Seniors 173 ± 28 ms | Elite Juniors 169 ± 20 ms | Elite Seniors 173 ± 19 ms | Elite Juniors 283 ± 23 ms | |||||||||||
| Slawinski, Bonnefoy [7] | Elite 0.138 ± 0.031 s | Well-trained 0.145 ± 0.016 s | |||||||||||||
| Maulder, Bradshaw [40] | National and regional level sprinters 0.18 ± 0.03 s | ||||||||||||||
| Horizontal CM position—second step touchdown (cm) (a) | Slawinski, Bonnefoy [7] | Elite 168.2 ± 11.3 | Well-trained 156.9 ± 12.4 | ||||||||||||
| Horizontal CM position—second step takeoff (cm) (a) | Elite 243.6 ± 13.9 | Well-trained 224.9 ± 12.0 * | |||||||||||||
| Second step velocity (m·s−1) | Elite 5.50 ± 0.26 | Well-trained 5.25 ± 0.13 * | |||||||||||||
| Čoh, Jost [13] | Slovene national sprinters 5.40 ± 0.24 | Slovene national sprinters 5.01 ± 0.29 ** | |||||||||||||
| Second step horizontal velocity (m·s−1) | Graham-Smith, Colyer [39] | Seniors 5.48 ± 0.26 | Juniors 5.27 ± 0.26 | ||||||||||||
| Debaere, Delecluse [6] | Elite sprinters 5.19 ± 0.30 | ||||||||||||||
| Čoh, Jost [13] | Slovene national sprinters 5.38 ± 0.24 | Slovene national sprinters 4.99 ± 0.29 ** | |||||||||||||
| Second step change in horizontal velocity (m·s−1) | Werkhausen, Willwacher [43] | Germany national sprinters 1.12 ± 0.07 | |||||||||||||
| Second step vertical velocity (m·s−1) | Graham-Smith, Colyer [39] | Seniors 0.54 ± 0.10 | Juniors 0.62 ± 0.12 | ||||||||||||
| Debaere, Delecluse [6] | Elite sprinters 0.70 ± 0.17 | ||||||||||||||
| Slawinski, Bonnefoy [7] | Elite 0.35 ± 0.05 | Well-trained 0.45 ± 0.07 * | |||||||||||||
| Čoh, Jost [13] | Slovene national sprinters 0.45 ± 0.18 | Slovene national sprinters 0.50 ± 0.10 | |||||||||||||
| Second step CM projection angle (°) (a) | Graham-Smith, Colyer [39] | Seniors 4.9 ± 1.3 | Juniors 6.8 ± 1.4 §§ | ||||||||||||
| Second step take off angle (°) (b) | Maulder, Bradshaw [40] | National and regional level sprinters 46 ± 2 | |||||||||||||
| Ankle angle at touch-down—second step (°) | Debaere, Delecluse [6] | Elite sprinters 72.4 ± 7.1 (i) | |||||||||||||
| Ankle ROM dorsiflexion—second step (°) | Werkhausen, Willwacher [43] | Germany national sprinters 18 ± 3 | |||||||||||||
| Ankle ROM plantarflexion—second step (°) | Germany national sprinters 44 ± 5 | ||||||||||||||
| Maximal plantarflexion—second step (°) | Debaere, Delecluse [6] | Elite sprinters 107.1 ± 15.0 (i) | |||||||||||||
| Knee angle at touch-down—second step (°) | Elite sprinters 115.6 ± 6.2 (h) | ||||||||||||||
| Knee angle at takeoff—second step (°) | Elite sprinters 163.6 ± 17.7 (h) | ||||||||||||||
| Hip angle at touch-down—second step (°) | Elite sprinters 124.48 ± 11.3 (g) | ||||||||||||||
| Hip angle at takeoff—second step (°) | Elite sprinters 181.1 + 20.0 (g) | ||||||||||||||
| Trunk angle at touch-down—second step (°) (c) | Chen, Wu [37] | Bunched start 33.4 ± 7.0 | Medium start 34.9 ± 5.9 | Elongated start 36.7 ± 5.9 * | |||||||||||
| Maulder, Bradshaw [40] | National and regional level sprinters 44 ± 8 | ||||||||||||||
| Peak foot linear velocity (from start to second step) (m·s−1) | Chen, Wu [37] | Bunched start 8.51 ± 0.58 | Medium start 8.72 ± 0.40 | Elongated start 8.68 ± 0.61 * | |||||||||||
| First and Second Steps | |||||||||||||||
| Step frequency First to second step (Hz) | Maulder, Bradshaw [40] | National and regional level sprinters 4.2 ± 0.3 | |||||||||||||
| Minimal step frequency (Hz) (j) | Rabita, Dorel [22] | Elite 3.94 ± 0.44 | Sub-elite 3.90 ± 0.44 | ||||||||||||
| Maximal step frequency (Hz) (j) | Elite 4.95 ± 0.12 | Sub-elite 4.80 ± 0.30 §§ | |||||||||||||
| Maximal CM horizontal acceleration (m·s−2) | Debaere, Delecluse [14] | First stance 0.36 ± 0.05 | Second stance 0.23 ± 0.04 *** | ||||||||||||
| Maximal CM vertical acceleration (m·s−2) | First stance 0.28 ± 0.08 | Second stance 0.25 ± 0.05 * | |||||||||||||
| Net induced acceleration (m·s−2) | First stance 501.4 ± 164.4 (33.2% horizontal/66.8% vertical) | Second stance 367.7 ± 36.7 *** (36.3% horizontal/63.7% vertical) | |||||||||||||
| First and Second Steps Kinetics | Male | Mixed | ||||||||
|---|---|---|---|---|---|---|---|---|---|---|
| First Step | ||||||||||
| GRFs | Relative resultant GRF (N·kg–1) | Sandamas, Gutierrez-Farewik [24] | Skating condition 1.51 ± 0.10 BW (a) | Narrow condition 1.49 ± 0.12 BW (a) | ||||||
| Otsuka, Shim [42] | Well-trained sprinters 14.93 ± 0.79 | Trained sprinters 14.62 ± 1.44 | ||||||||
| Maximal horizontal force (N) | Aeles, Jonkers [9] | Adult sprinters 488.47 ± 268.16 | Young sprinters 552.91 ± 147.40 | |||||||
| Average horizontal force (N) | Adult sprinters 289.63 ± 163.32 | Young sprinters 333.15 ± 94.26 | ||||||||
| Relative maximal horizontal force (N·kg−1) | Adult sprinters 7.09 ± 3.28 | Young sprinters 9.02 ± 2.00 * | ||||||||
| Relative average horizontal force (N·kg−1) | Sandamas, Gutierrez-Farewik [24] | Skating condition 0.64 ± 0.06 BW (a) | Narrow condition 0.63 ± 0.04 BW (a) | |||||||
| Aeles, Jonkers [9] | Adult sprinters 4.21 ± 2.04 | Young sprinters 5.43 ± 1.28 * | ||||||||
| Otsuka, Shim [42] | Well-trained sprinters 5.87 ± 0.35 | Trained sprinters 5.48 ± 0.77 | ||||||||
| Maximal ratio of hori-zontal to total GRF (%) | Aeles, Jonkers [9] | Adult sprinters 61.31 ± 20.75 | Young sprinters 78.00 ± 12.37 * | |||||||
| Mean ratio of horizontal force to total GRF (%) | Adult sprinters 28.49 ± 12.16 | Young sprinters 37.04 ± 6.37 * | ||||||||
| Relative average vertical force (N·kg−1) | Otsuka, Shim [42] | Well-trained sprinters 13.59 ± 0.82 | Trained sprinters 13.43 ± 1.35 | |||||||
| Power | Relative average hori-zontal external power—first step (W·kg−1) | Graham-Smith, Colyer [39] | Seniors 25.1 ± 3.6 | Juniors 23.1 ± 6 § | ||||||
| Impulses | Absolute Impulse (N·s) | Slawinski, Bonnefoy [7] | Elite 104.8 ± 16.5 | Well-trained 78.6 ± 6.3 * | ||||||
| Net normalized horizontal impulse (m·s−1) | Sandamas, Gutierrez-Farewik [24] | Skating condition 1.29 ± 0.06 | Narrow condition 1.26 ± 0.04 | |||||||
| Normalized horizontal braking impulse (m·s−1) | Skating condition 0.04 ± 0.04 | Narrow condition 0.03 ± 0.02 | ||||||||
| Normalized horizontal propulsive impulse (m·s−1) | Skating condition 1.33 ± 0.06 | Narrow condition 1.29 ± 0.05 * | ||||||||
| Normalized vertical impulse (m·s−1) | Skating condition 0.71 ± 0.18 | Narrow condition 0.71 ± 0.28 | ||||||||
| Normalized mediolateral impulse (m·s−1) | Skating condition 0.33 ± 0.10 | Narrow condition 0.17 ± 0.10 * | ||||||||
| Joint moments | Relative ankle joint moment (Plantar Flexion) (N·m·kg−1) | Aeles, Jonkers [9] | Adult sprinters 0.19 ± 0.05 | Young sprinters 0.22 ± 0.07 | ||||||
| Debaere, Vanwanseele [15] | Adult sprinters 0.19 ± 0.07 | U18 sprinters 0.24 ± 0.06 | U16 sprinters 0.21 ± 0.12 | |||||||
| Debaere, Delecluse [6] | Elite sprinters 0.20 ± 0.03 N·m·N−1 | |||||||||
| Relative knee joint moment (extension) (N·m·kg−1) | Aeles, Jonkers [9] | Adult sprinters 0.29 ± 0.10 | Young sprinters 0.21 ± 0.09 * | |||||||
| Debaere, Vanwanseele [15] | Adult sprinters 0.30 ± 0.11 | U18 sprinters 0.18 ± 0.08 # | U16 sprinters 0.18 ± 0.09 # | |||||||
| Debaere, Delecluse [6] | Elite sprinters 0.20 ± 0.04 N·m·N−1 | |||||||||
| Relative hip joint moment (extension) (N·m·kg−1) | Aeles, Jonkers [9] | Adult sprinters 0.24 ± 0.08 | Young sprinters 0.22 ± 0.07 | |||||||
| Debaere, Vanwanseele [15] | Adult sprinters 0.50 ± 0.22 | U18 sprinters 0.34 ± 0.10 # | U16 sprinters 0.42 ± 0.09 | |||||||
| Debaere, Delecluse [6] | Elite sprinters 0.33 ± 0.15 N·m·N−1 | |||||||||
| Relative hip joint moment (flexion) (N·m·kg−1) | Aeles, Jonkers [9] | Adult sprinters 0.41 ± 0.22 | Young sprinters 0.26 ± 0.12 * | |||||||
| Debaere, Delecluse [6] | Elite sprinters 0.42 ± 0.16 N·m·N−1 | |||||||||
| Normalized peak ankle joint moment (extension) | Brazil, Exell [4] | Athletic sprinters 0.388 ± 0.035 (b) Ϯ | ||||||||
| Normalized peak knee joint moment (extension) | Athletic sprinters 0.242 ± 0.068 (b) | |||||||||
| Normalized peak hip joint moment (extension) | Athletic sprinters 0.330 ± 0.071 (b) | |||||||||
| Joint moments contributi-on to body propulsion (%) | Debaere, Delecluse [14] | Hip joint 10.3 | Knee joint 9.6 | Ankle joint 67.1 *** | ||||||
| Joint moments contribu—tion to body lift (%) | Hip joint 12.3 | Knee joint 38.1 | Ankle joint 49.6 | |||||||
| Ankle joint stiffness as—cending phase (N·m/°) (c) | Aeles, Jonkers [9] | Adult sprinters 6.64 ± 2.01 | Young sprinters 7.35 ± 3.12 ƥ | |||||||
| Ankle joint stiffness des— cending phase (N·m/°) (d) | Adult sprinters 2.27 ± 0.62 | Young sprinters 2.85 ± 1.23 ƥ | ||||||||
| Joint powers | Relative ankle peak power (W·N−1) | Brazil, Exell [4] | Athletic sprinters 1.093 ± 0.069 (b) Ϯ | |||||||
| Debaere, Vanwanseele [15] | Adult sprinters 1.79 ± 0.96 | U18 sprinters 2.30 ± 1.02 | U16 sprinters 2.19 ± 1.46 | |||||||
| Relative knee peak power (W·N−1) | Brazil, Exell [4] | Athletic sprinters 0.468 ± 0.145 (b) | ||||||||
| Debaere, Vanwanseele [15] | Adult sprinters 3.03 ± 1.24 | U18 sprinters 1.31 ± 0.66 # | U16 sprinters 1.12 ± 1.2 # | |||||||
| Relative hip peak power (W·N−1) | Brazil, Exell [4] | Athletic sprinters 0.908 ± 0.185 (b) Ϯ | ||||||||
| Debaere, Vanwanseele [15] | Adult sprinters 3.79 ± 0.95 | U18 sprinters 4.56 ± 1.42 | U16 sprinters 4.33 ± 0.96 | |||||||
| Relative average hori-zontal external power (W·kg−1) | Graham-Smith, Colyer [39] | Seniors 25.1 ± 3.6 | Juniors 23.1 ± 6 § | |||||||
| Joint moments contributi-on to body propulsion (%) | Debaere, Delecluse [14] | Hip joint 10.3 | Knee joint 9.6 | Ankle joint 67.1 *** | ||||||
| Joint moments contributi-on to body lift (%) | Hip joint 12.3 | Knee joint 38.1 | Ankle joint 49.6 *** | |||||||
| Joint work | Ankle negative work (J·kg−1) | Werkhausen, Willwacher [43] | Germany national sprinters −0.32 ± 0.14 (e) | |||||||
| Ankle positive work (J·kg−1) | Germany national sprinters 1.58 ± 0.17 (e) | |||||||||
| Second Step | ||||||||||
| GRFs | Relative resultant GRF (N·kg−1) | Otsuka, Shim [42] | Well-trained sprinters 14.93 ± 0.79 | Trained sprinters 14.62 ± 1.44 | ||||||
| Relative average horizontal force (N·kg−1) | Well-trained sprinters 4.83 ± 0.70 | Trained sprinters 4.79 ± 0.47 | ||||||||
| Relative average vertical force (N·kg−1) | Well-trained sprinters 13.22 ± 1.15 | Trained sprinters 13.72 ± 1.18 | ||||||||
| Power | Relative average horizontal external power—second step (W·kg−1) | Graham-Smith, Colyer [39] | Seniors 26.7 ± 3.6 | Juniors 24.9 ± 4.5 § | ||||||
| Impulses | Absolute impulse (N·s) | Slawinski, Bonnefoy [7] | Elite 75.0 ± 15.8 | Well-trained 55.9 ± 9.4 * | ||||||
| Joint moments | Relative ankle joint moment (plantar flexion) (N·m·N−1) | Debaere, Delecluse [6] | Elite sprinters 0.23 ± 0.05 | |||||||
| Relative knee joint moment (extension)(N·m·N−1) | Elite sprinters 0.10 ± 0.04 | |||||||||
| Relative hip joint moment (extension) (N·m·N−1) | Elite sprinters 0.43 ± 0.01 | |||||||||
| Relative hip joint moment (flexion) (N·m·N−1) | Elite sprinters 0.20 ± 0.06 | |||||||||
| Joint moments contributi-on to body propulsion (%) | Debaere, Delecluse [14] | Hip joint 0 | Knee joint 7.1 | Ankle joint 92.9 *** | ||||||
| Joint moments contributi-on to body lift (%) | Hip joint 0 | Knee joint 23.8 | Ankle joint 72.6 *** | |||||||
References
- Aerenhouts, D.; Delecluse, C.; Hagman, F.; Taeymans, J.; Debaere, S.; Van Gheluwe, B.; Clarys, P. Comparison of anthropometric characteristics and sprint start performance between elite adolescent and adult sprint athletes. Eur. J. Sport Sci. 2012, 12, 9–15. [Google Scholar] [CrossRef]
- Bezodis, N.E.; Salo, A.I.; Trewartha, G. Choice of sprint start performance measure affects the performance-based ranking within a group of sprinters: Which is the most appropriate measure? Sports Biomech. 2010, 9, 258–269. [Google Scholar] [CrossRef] [Green Version]
- Bezodis, N.E.; Salo, A.I.; Trewartha, G. Relationships between lower-limb kinematics and block phase performance in a cross section of sprinters. Eur. J. Sport Sci. 2015, 15, 118–124. [Google Scholar] [CrossRef] [Green Version]
- Brazil, A.; Exell, T.; Wilson, C.; Willwacher, S.; Bezodis, I.; Irwin, G. Lower limb joint kinetics in the starting blocks and first stance in athletic sprinting. J. Sports Sci. 2017, 35, 1629–1635. [Google Scholar] [CrossRef] [PubMed] [Green Version]
- Coh, M.; Peharec, S.; Bacic, P.; Mackala, K. Biomechanical Differences in the Sprint Start Between Faster and Slower High-Level Sprinters. J. Hum. Kinet. 2017, 56, 29–38. [Google Scholar] [CrossRef] [PubMed] [Green Version]
- Debaere, S.; Delecluse, C.; Aerenhouts, D.; Hagman, F.; Jonkers, I. From block clearance to sprint running: Characteristics underlying an effective transition. J. Sports Sci. 2013, 31, 137–149. [Google Scholar] [CrossRef] [PubMed]
- Slawinski, J.; Bonnefoy, A.; Leveque, J.M.; Ontanon, G.; Riquet, A.; Dumas, R.; Chèze, L. Kinematic and kinetic comparisons of elite and well-trained sprinters during sprint start. J. Strength Cond. Res. 2010, 24, 896–905. [Google Scholar] [CrossRef] [Green Version]
- Slawinski, J.; Dumas, R.; Cheze, L.; Ontanon, G.; Miller, C.; Mazure-Bonnefoy, A. 3D kinematic of bunched, medium and elongated sprint start. Int. J. Sports Med. 2012, 33, 555–560. [Google Scholar] [CrossRef] [PubMed]
- Aeles, J.; Jonkers, I.; Debaere, S.; Delecluse, C.; Vanwanseele, B. Muscle-tendon unit length changes differ between young and adult sprinters in the first stance phase of sprint running. R. Soc. Open Sci. 2018, 5, 180332. [Google Scholar] [CrossRef] [PubMed] [Green Version]
- Bezodis, N.; Walton, S.; Nagahara, R. Understanding the track and field sprint start through a functional analysis of the external force features which contribute to higher levels of block phase performance. J. Sports Sci. 2019, 37, 560–567. [Google Scholar] [CrossRef] [Green Version]
- Brazil, A.; Exell, T.; Wilson, C.; Willwacher, S.; Bezodis, I.N.; Irwin, G. Joint kinetic determinants of starting block performance in athletic sprinting. J. Sports Sci. 2018, 36, 1656–1662. [Google Scholar] [CrossRef] [PubMed] [Green Version]
- Cavedon, V.; Sandri, M.; Pirlo, M.; Petrone, N.; Zancanaro, C.; Milanese, C. Anthropometry-driven block setting improves starting block performance in sprinters. PLoS ONE 2019, 14, e0213979. [Google Scholar] [CrossRef] [PubMed] [Green Version]
- Čoh, M.; Jost, B.; Škof, B.; Tomazin, K.; Dolenec, A. Kinematic and kinetic parameters of the sprint start and start acceleration model of top sprinters. Gymnica 1998, 28, 33–42. [Google Scholar]
- Debaere, S.; Delecluse, C.; Aerenhouts, D.; Hagman, F.; Jonkers, I. Control of propulsion and body lift during the first two stances of sprint running: A simulation study. J. Sports Sci. 2015, 33, 2016–2024. [Google Scholar] [CrossRef] [PubMed]
- Debaere, S.; Vanwanseele, B.; Delecluse, C.; Aerenhouts, D.; Hagman, F.; Jonkers, I. Joint power generation differentiates young and adult sprinters during the transition from block start into acceleration: A cross-sectional study. Sports Biomech. 2017, 16, 452–462. [Google Scholar] [CrossRef] [PubMed]
- Fortier, S.; Basset, F.A.; Mbourou, G.A.; Faverial, J.; Teasdale, N. Starting Block Performance in Sprinters: A Statistical Method for Identifying Discriminative Parameters of the Performance and an Analysis of the Effect of Providing Feedback over a 6-Week Period. J. Sports Sci. Med. 2005, 4, 134–143. [Google Scholar] [PubMed]
- Gutierrez-Davilla, M.; Dapena, J.; Campos, J. The effect of muscular pre-tensing on the sprint start. J. Appl. Biomech. 2006, 22, 194–201. [Google Scholar] [CrossRef] [PubMed]
- Mero, A. Force-Time Characteristics and Running Velocity of Male Sprinters during the Acceleration Phase of Sprinting. Res. Q. Exerc. Sport 1988, 59, 94–98. [Google Scholar] [CrossRef]
- Mero, A.; Kuitunen, S.; Harland, M.; Kyrolainen, H.; Komi, P.V. Effects of muscle-tendon length on joint moment and power during sprint starts. J. Sports Sci. 2006, 24, 165–173. [Google Scholar] [CrossRef] [PubMed]
- Nagahara, R.; Ohshima, Y. The Location of the Center of Pressure on the Starting Block Is Related to Sprint Start Performance. Front. Sports Act Living 2019, 1, 21. [Google Scholar] [CrossRef] [PubMed] [Green Version]
- Otsuka, M.; Kurihara, T.; Isaka, T. Effect of a Wide Stance on Block Start Performance in Sprint Running. PLoS ONE 2015, 10, e0142230. [Google Scholar] [CrossRef] [PubMed]
- Rabita, G.; Dorel, S.; Slawinski, J.; Saez-de-Villarreal, E.; Couturier, A.; Samozino, P.; Morin, J.-B. Sprint mechanics in world-class athletes: A new insight into the limits of human locomotion. Scand. J. Med. Sci. Sports 2015, 25, 583–594. [Google Scholar] [CrossRef] [PubMed]
- Sado, N.; Yoshioka, S.; Fukashiro, S. Three-dimensional kinetic function of the lumbo-pelvic-hip complex during block start. PLoS ONE 2020, 15, e0230145. [Google Scholar] [CrossRef] [PubMed]
- Sandamas, P.; Gutierrez-Farewik, E.M.; Arndt, A. The effect of a reduced first step width on starting block and first stance power and impulses during an athletic sprint start. J. Sports Sci. 2019, 37, 1046–1054. [Google Scholar] [CrossRef]
- Schrodter, E.; Bruggemann, G.P.; Willwacher, S. Is Soleus Muscle-Tendon-Unit Behavior Related to Ground-Force Application During the Sprint Start? Int. J. Sports Physiol. Perform. 2017, 12, 448–454. [Google Scholar] [CrossRef]
- Bezodis, N.E.; Willwacher, S.; Salo, A.I.T. The Biomechanics of the Track and Field Sprint Start: A Narrative Review. Sports Med. 2019, 49, 1345–1364. [Google Scholar] [CrossRef] [Green Version]
- Harland, M.J.; Steele, J.R. Biomechanics of the sprint start. Sports Med. 1997, 23, 11–20. [Google Scholar] [CrossRef]
- Page, M.J.; McKenzie, J.E.; Bossuyt, P.M.; Boutron, I.; Hoffmann, T.C.; Mulrow, C.D.; Shamseer, L.; Tetzlaff, J.M.; Akl, E.A.; Brennan, S.E.; et al. The PRISMA 2020 statement: An updated guideline for reporting systematic reviews. BMJ 2021, 372, 105906. [Google Scholar] [CrossRef]
- Von Elm, E.; Altman, D.G.; Egger, M.; Pocock, S.J.; Gotzsche, P.C.; Vandenbroucke, J.P.; STROBE Initiative. The Strengthening the Reporting of Observational Studies in Epidemiology (STROBE) Statement: Guidelines for reporting observational studies. Int. J. Surg. 2014, 12, 1495–1499. [Google Scholar] [CrossRef] [Green Version]
- Da Costa, B.R.; Cevallos, M.; Altman, D.G.; Rutjes, A.W.; Egger, M. Uses and misuses of the STROBE statement: Bibliographic study. BMJ Open 2011, 1, e000048. [Google Scholar] [CrossRef] [Green Version]
- Sim, J.; Wright, C.C. The kappa statistic in reliability studies: Use, interpretation, and sample size requirements. Phys. Ther. 2005, 85, 257–268. [Google Scholar] [CrossRef] [PubMed] [Green Version]
- Landis, J.R.; Koch, G.G. The measurement of observer agreement for categorical data. Biometrics 1977, 33, 159–174. [Google Scholar] [CrossRef] [Green Version]
- Colyer, S.; Graham-Smith, P.; Salo, A. Associations between ground reaction force waveforms and sprint start performance. Int. J. Sports Sci. Coach. 2019, 14, 658–666. [Google Scholar] [CrossRef]
- Guissard, N.; Duchateau, J.; Hainaut, K. EMG and mechanical changes during sprint starts at different front block obliquities. Med. Sci. Sports Exerc. 1992, 24, 1257–1263. [Google Scholar] [CrossRef] [PubMed]
- Nagahara, R.; Gleadhill, S.; Ohshima, Y. Improvement in sprint start performance by modulating an initial loading location on the starting blocks. J. Sports Sci. 2020, 38, 2437–2445. [Google Scholar] [CrossRef] [PubMed]
- Slawinski, J.; Bonnefoy, A.; Ontanon, G.; Leveque, J.M.; Miller, C.; Riquet, A.; Chèze, L.; Dumas, R. Segment-interaction in sprint start: Analysis of 3D angular velocity and kinetic energy in elite sprinters. J. Biomech. 2010, 43, 1494–1502. [Google Scholar] [CrossRef] [PubMed]
- Chen, Y.; Wu, K.Y.; Tsai, Y.J.; Yang, W.T.; Chang, J.H. The kinematic differences of three types of crouched positions during a sprint start. J. Mech. Med. Biol. 2016, 16, 1650099. [Google Scholar] [CrossRef]
- Ciacci, S.; Merni, F.; Bartolomei, S.; Di Michele, R. Sprint start kinematics during competition in elite and world-class male and female sprinters. J. Sports Sci. 2017, 35, 1270–1278. [Google Scholar] [CrossRef] [PubMed]
- Graham-Smith, P.; Colyer, S.L.; Salo, A. Differences in ground reaction waveforms between elite senior and junior academy sprinters during the block phase and first two steps. Int. J. Sports Sci. Coach. 2020, 15, 418–427. [Google Scholar] [CrossRef]
- Maulder, P.S.; Bradshaw, E.J.; Keogh, J.W. Kinematic alterations due to different loading schemes in early acceleration sprint performance from starting blocks. J. Strength Cond. Res. 2008, 22, 1992–2002. [Google Scholar] [CrossRef]
- Milanese, C.; Bertucco, M.; Zancanaro, C. The effects of three different rear knee angles on kinematics in the sprint start. Biol. Sport 2014, 31, 209–215. [Google Scholar] [CrossRef] [PubMed]
- Otsuka, M.; Shim, J.K.; Kurihara, T.; Yoshioka, S.; Nokata, M.; Isaka, T. Effect of expertise on 3D force application during the starting block phase and subsequent steps in sprint running. J. Appl. Biomech. 2014, 30, 390–400. [Google Scholar] [CrossRef]
- Werkhausen, A.; Willwacher, S.; Albracht, K. Medial gastrocnemius muscle fascicles shorten throughout stance during sprint acceleration. Scand. J. Med. Sci. Sports 2021, 31, 1471–1480. [Google Scholar] [CrossRef] [PubMed]
- Nagahara, R.; Kanehisa, H.; Fukunaga, T. Ground reaction force across the transition during sprint acceleration. Scand. J. Med. Sci. Sports 2020, 30, 450–461. [Google Scholar] [CrossRef] [PubMed]
- Mero, A.; Komi, P.V.; Gregor, R.J. Biomechanics of sprint running. A review. Sports Med. 1992, 13, 376–392. [Google Scholar] [CrossRef] [PubMed]
- Milloz, M.; Hayes, K.; Harrison, A.J. Sprint Start Regulation in Athletics: A Critical Review. Sports Med. 2021, 51, 21–31. [Google Scholar] [CrossRef] [PubMed]
- Bezodis, N.E.; Trewartha, G.; Salo, A.I. Understanding the effect of touchdown distance and ankle joint kinematics on sprint acceleration performance through computer simulation. Sports Biomech. 2015, 14, 232–245. [Google Scholar] [CrossRef] [PubMed] [Green Version]
- Colyer, S.L.; Nagahara, R.; Salo, A.I.T. Kinetic demands of sprinting shift across the acceleration phase: Novel analysis of entire force waveforms. Scand. J. Med. Sci. Sports 2018, 28, 1784–1792. [Google Scholar] [CrossRef]
- Charalambous, L.; Irwin, G.; Bezodis, I.N.; Kerwin, D. Lower limb joint kinetics and ankle joint stiffness in the sprint start push-off. J. Sports Sci. 2012, 30, 1–9. [Google Scholar] [CrossRef]
- McKay, A.K.A.; Stellingwerff, T.; Smith, E.S.; Martin, D.T.; Mujika, I.; Goosey-Tolfrey, V.L.; Sheppard, J.; Burke, L.M. Defining Training and Performance Caliber: A Participant Classification Framework. Int. J. Sports Physiol. Perform. 2022, 17, 317–331. [Google Scholar] [CrossRef] [PubMed]
- Bissas, A.; Walker, J.; Paradisis, G.P.; Hanley, B.; Tucker, C.B.; Jongerius, N.; Thomas, A.; Merlino, S.; Vazel, P.; Girard, O. Asymmetry in sprinting: An insight into sub-10 and sub-11 s men and women sprinters. Scand. J. Med. Sci. Sports 2022, 32, 69–82. [Google Scholar] [CrossRef] [PubMed]
- Nagahara, R.; Gleadhill, S. Catapult start likely improves sprint start performance. Int. J. Sports Sci. Coach. 2022, 17, 114–122. [Google Scholar] [CrossRef]
- Robertson, D.G.E.; Caldwell, G.E.; Hamill, J.; Kamen, G.; Whittlesey, S.N. Research Methods in Biomechanics; Human Kinetics: Champaign, IL, USA, 2014. [Google Scholar]

| Study Details | Sample | Main Findings | Quality | ||||||
|---|---|---|---|---|---|---|---|---|---|
| Reference | Primary Focus of the Study | Main Purpose | Biomechanics Analysis | Sex | n | Level | PB100m (s) | Mean Score (%) | |
| Werkhausen, Willwacher [43] | First 2 steps. Two force platforms for the GRFs of the first 2 steps. Three-dimensional kinematic model (pelvis and lower limbs) | Investigate how plantar flexor muscle-tendon behavior is modulated during the first 2 steps | 3D GRF of the first 2 steps | F | 11 | Germany national level | 12.66 ± 0.49 | Ankle and knee joint angles revealed no statistical differences at any time of both steps. Ankle joint power was negative after touchdown and positive during the rest of the stance phase, whereas net ankle joint work was positive during both steps. Knee joint power was positive during most of the stance phase. | 67.78 |
| Graham-Smith, Colyer [39] | Block phase and first 2 steps. An array of 6 force platforms. | Compare force production between elite senior and junior academy sprinters | 3D block and first 2 steps GRF, and spatiotemporal data | M M | 17 20 | Elite Senior Junior Academy | 8.2% worse than senior WR (a) 12.2% worse than junior WR (b) | Senior sprinters presented higher relative anteroposterior force and power during the initial block phase, higher forces during the transition from bilateral to unilateral pushing and lower (more horizontal) projection angle across the initial 2 steps of the sprint compared with junior athletes. | 76.82 |
| Nagahara, Gleadhill [35] | Block phase. Two force platforms with a coordinate transformation matrix to the coordinate block system. | Examine whether modulation of COP location on the starting block improves sprint start performance | 3D GRF under each block and spatiotemporal data | M | 20 | National level | 11.22 ± 0.41 | The modulation of COP location did not show an effect on AHEP and 10 m time. However, instructing to push the calcaneus onto the block (posterior location) may improve the 10 m time and/or AHEP for some individuals and may be accomplished through a shorter reaction time. | 82.50 |
| Sado, Yoshioka [23] | Block phase. Separated starting blocks secured onto separate force plates. | Examine the 3D lumbo-pelvic-hip kinetics during block start | 3D GRF under each block | M | 12 | University of Tokyo team | 10.78 ± 0.19 | The peak lumbosacral extension torque was larger than any other peak torque. | 66.36 |
| Bezodis, Walton [10] | Block phase. Four synchronized force platforms under each block and each hand. | Identify the continuous GRF features which contribute to blocking phase performance | 3D GRF under each block and each hand | M | 23 | Trained | 11.37 ± 0.37 | The resultant magnitude of the GRFs on the rear block is the most important predictor of block phase performance, followed in importance by front block force magnitude features. Features related to the direction of application of these forces are not relevant predictors of performance | 87.50 |
| Cavedon, Sandri [12] | Block phase. Instrumented starting blocks and 2 high-speed video cameras. | Analyze the effect of 2 block setting conditions on block start performance | 2D kinematic, horizontal, and vertical forces components, and spatiotemporal data | M (c) F | 22 20 | Regional and National | 10.45–11.30 11.45–12.68 | An anthropometry-driven block setting condition based on the sprinter’s leg length was associated with several significant changes in postural parameters at the “set” position, as well as in kinetic and kinematic variables at the pushing and acceleration phases in comparison with the sprinter’s usual block setting, leading to improved performance | 88.64 |
| Colyer, Graham-Smith [33] | Block phase. Four force platforms under each of the legs and arms separately. | Analyze the associations between block reaction forces and average horizontal external power | 2D anteroposterior and vertical block reaction forces, and spatiotemporal data | M | 5 32 20 | Elite National (d) Academy | <10.15 --- --- | Both higher magnitudes of force and more horizontally orientated force vectors were associated with higher performance levels. The ability to sustain high forces during the transition from bilateral to unilateral pushing was a performance-differentiating factor. Faster sprinters produced less negative horizontal impulses under hands compared with their slower counterparts | 78.60 |
| Nagahara and Ohshima [20] | Block phase. Two force platforms under each block. | Examine the association of block clearance performance with COP location on the starting block surface | 3D GRF under each block | M | 21 | Sprinters | 11.24 ± 0.41 | The COP location was related to sprint start performance (AHEP). Better sprint start performance was achieved with a higher and more to the rear COP on the starting block surface during the force production phase | 75.45 |
| Sandamas, Gutierrez-Farewik [24] | Block phase and 1st stance. Three-dimensional kinematic full-body model. Instrumented blocks and a force platform. Natural technique (Skating); 1st step inside a 0.3 m lane (Narrow). | Analyze the block reaction forces when 1st step width is manipulated | 3D kinematic data and external block and 1st step reaction forces | M F (e) | 8 2 | Competitive, Including international championships finalists | 11.03 ± 0.36 11.60 ± 0.45 | The mediolateral impulses decreased with reduced step width; The propulsive component of the net anteroposterior impulse is significantly smaller for the narrow step width in the 1st stance; restricting step width, vertical block impulses increased while the mediolateral motion of the CM from Start to 1st stance toe-off decreased; reducing step width does not lead to any immediate improvement in performance. On the contrary, the skating style has a greater propulsive impulse during the 1st stance | 79.77 |
| Aeles, Jonkers [9] | First stance phase. 3D kinematic full-body model. Force platform to measure the GRFs of the 1st step. | Compare young and adult sprinters in kinematic and kinetic parameters during the 1st stance phase | 3D kinematics and 3D GRF of 1st step | M F (f) M F | 7 9 11 10 | Adult Well-trained Young Well-trained | 10.67 ± 0.14 12.12 ± 0.41 11.47 ± 0.34 12.75 ± 0.36 | Well-trained young and adult sprinters have no differences in ankle joint stiffness, range of dorsiflexion or plantar flexor moment. Surprisingly, the young sprinters show a greater maximal and mean ratio of horizontal to total GRF. Adult sprinters have more MTU shortening and higher maximal MTU shortening velocities in all plantar flexors and in the rectus femoris. | 80.68 |
| Brazil, Exell [11] | Block phase. Force instrumented starting blocks. Three-dimensional kinematic lower limb model. | Explore the relationships between lower limb joint kinetics, external force production and starting block performance | 3D block reaction forces and 3D kinematics | M | 17 | Sprinters | 10.67 ± 0.32 | 86% of the variation in block performance is explained by the horizontal force applied to the front and rear blocks, and at the joint level 55% of the variation in block performance is explained by average rear ankle extensor moment, front hip extensor moment and front knee positive extensor power. | 87.73 |
| Brazil, Exell [4] | Block phase and 1st stance. Three-dimensional kinematic lower limb model. Force platform to the GRFs—1st step. | Examine lower limb joint kinetics during the block and 1st stance phases | 3D kinematics and 3D block and 1st step reaction forces | M | 10 | Sprinters | 10.50 ± 0.27 | The asymmetrical nature of the block phase is most pertinent at the knee joint, and the leg extensor energy is predominantly generated at the hip joint in both the front and the rear block whereas during 1st stance, energy generation favors the ankle joint as a result of a significant reduction in relative hip work. | 83.18 |
| Ciacci, Merni [38] | Block phase and first 2 steps. 3D kinematic full-body model. | Compare kinematic differences between sexes | 3D kinematic data | M F M F | 6 6 4 4 | Elite World-Class | 10.74 ± 0.21 11.95 ± 0.24 10.03 ± 0.14 11.10 ± 0.17 | The start kinematics is only partially affected by sex (men have shorter pushing phase, higher block horizontal velocity, and shorter contact times of first 2 steps), whereas a bigger role is played by the performance level (faster sprinters have CM closer to the ground and a more flexed front knee in the “set” position, longer pushing phase, lower block vertical velocity, and shorter contact times/longer flight times in first 2 steps. | 85.23 |
| Coh, Peharec [5] | Block phase and first 2 steps. Two independent force platforms for 2 independent starting block pads. 3D kinematic full-body model. | Compare the kinematic and kinetic factors between faster and slower high-level sprinters | 3D GRF under each block and spatiotemporal data | M | 6 6 | Faster Slower | 10.66 ± 0.18 11.00 ± 0.06 | Faster sprinters show motor patterns of greater force development (rear block total force, rear block vertical maximal force, and the rate of force development) than their slower counterparts; The importance of other indicators as block clearance time, block velocity, and block acceleration was not confirmed in this study. | 78.41 |
| Debaere, Vanwanseele [15] | Block phase through until the start of 2nd touchdown. 3D kinematic full-body model and 2 force platforms for the first 2 steps. | Compare joint power generation between well-trained adult and young sprinters | 3D Kinematics and 3D GRF of the first 2 steps | M F M F M F | 8 6 8 10 5 6 | Well-Trained Adult Under 18 Under 16 | 10.65 ± 0.07 11.87 ± 0.14 11.21 ± 0.11 12.42 ± 0.25 11.56 ± 0.08 12.86 ± 0.30 | Adult sprinters generated more joint power at the knee during the 1st step compared to young sprinters, inducing longer step length and therefore higher velocity. Younger athletes employed a different technique: the hip contributes more to total power generation, whereas the contribution of the knee is far less. | 82.95 |
| Schrodter, Bruggemann [25] | Block phase. 2D ankle kinematic data and 3D block reaction force from instrumented blocks. | Describe the stretch-shortening behavior of ankle plantarflexion MTU during the push-off phase | 2D kinematics and 3D block GRF | M (e) F | 54 30 | World-class National | 10.98 ± 0.58 12.12 ± 0.68 | This study provided the 1st systematic observation of ankle joint stretch-shortening behavior during sprint start for sprinters of a wide range of performance levels. It showed clear signs of a dorsi-flexion in the front and rear ankle joints preceding plantarflexion, seeming that the stretch-shortening cycle like the motion of the soleus muscle-tendon unit has an enhancing influence on push-off force generation. | 68.86 |
| Chen, Wu [37] | Block phase. Two-dimensional kinematic full-body model (15 segmented model). | Identifies optimal crouched position (bunched, medium, or elongated) from push-off through the first 2 steps | 2D kinematic data—sagittal plane and spatiotemporal data | M | 7 | Skilled sprinters | 10.94 ± 0.20 | The medium starting position was the ideal starting position. | 60.19 |
| Bezodis, Salo [3] | Block phase. Two-dimensional kinematic full-body model and kinetic data calculated from consequent data procedures. | Identify the key characteristics of the lower-limb kinematic patterns during the block phase | 2D kinematic data—(kinetic energy calculated from CM horizontal velocity) | M | 16 | World-class to university level | 10.95 ± 0.51 | Describes the lower limb joint kinematics patterns explicative of high levels of sprint start performance. The rear hip angle at block exit was highly related to block power, and there were moderate positive relationships between block power and rear hip ROM and peak angular velocity. | 80.68 |
| Debaere, Delecluse [14] | Block phase and first 2 steps. Three-dimensional kinematic full-body model and 2 force platforms for first 2 steps for inverse dynamics analysis. | Analyze the contribution of joint moments and muscle forces to the CM acceleration | 3D kinematics and two 1st steps GRF | M (e) F | 2 5 | Well-Trained | 11.10 to 11.77 12.05 to 12.36 | Relates the specific joint and muscle contribution to the horizontal acceleration (propulsion) and vertical acceleration (body lift) of the CM during the initial two steps after block clearance. Torque-driven simulations identify the ankle joint as the major contributor to propulsion and body lift. | 68.41 |
| Otsuka, Kurihara [21] | Block phase. Separated starting blocks secured onto separate force platforms. Three-dimensional kinematic 7-segment model of the lower limb. | Clarify the effect of widened stance width at the “set” position during the block start phase | 3D kinematic data and 2D GRF under each block | M | 14 | 3 international 11 national | 10.99 ± 0.40 | A widened stance width at the “set” position affects the hip-joint kinematics in both legs and enhanced the hip power generation in the rear leg during the block start phase. However, when considering sprinting performance during the whole block start phase, there was no significant effect of the widened stance width on block-induced power and the subsequent sprint time. | 68.86 |
| Rabita, Dorel [22] | Initial sprint acceleration. Six individual force platforms connected in series. | Describe the sprint acceleration mechanics in elite and sub-elite sprinters | 3D GRF of initial steps and spatiotemporal data | M | 4 5 | Elite Sub-Elite | 9.95 to 10.29 10.40 to 10.60 | Describes for the 1st time the mechanical characteristics of the acceleration phase in elite and sub-elite sprinters: (i) while step length increases regularly during the acceleration phase, step frequency is almost instantaneously leveled at the maximal possibility of elite athletes; (ii) F-V and P-V relationships during sprints were well described by linear and quadratic models, respectively; and (iii) the effectiveness of force application greatly accounts for the differences in performance among highly trained athletes. | 74.31 |
| Milanese, Bertucco [41] | Block phase and first 2 stance phases. 3D kinematic full-body model. | Investigate the rear knee angle associated with the impulse and the horizontal velocity in the starting block and acceleration phases | 3D kinematics | M (e) F | 6 5 | University sprinters | 12.0 ± 0.1 13.1 ± 0.9 | Horizontal CM velocity increased significantly at the block clearance and along the first 2 strides when witching from 135° to 115° and then to 90° the rear knee angle. The horizontal velocity was directly determined by force impulse which tended to be greater at 90° rear knee angle. | 79.55 |
| Otsuka, Shim [42] | Block phase and first 2 steps. Ten individual force platforms connected in series. | Compare 3D force application in the blocks between 3 sprinting groups | 3D GRF under each block and first 2 steps | M | 9 9 11 | Well-Trained Trained Non-Trained | 10.87 ± 0.41 11.31 ± 0.42 -------- | The greater anterior acceleration of well-trained sprinters during the starting block phase may be accompanied, not by a greater GRF magnitude, but by a more forward-leaning sagittal GRF vector. | 72.50 |
| Debaere, Delecluse [6] | Block phase and first 2 steps. Three-dimensional kinema-tic full-body model. Two force platforms for first 2 steps. | Characterize the sprint technique during the transition from start block into sprint running | 3D kinematics and 3D GRF of the first 2 steps | M (e) F | 11 10 | Elite/Well-Trained | 10.62 + 0.18 11.89 + 0.30 | During the 1st step, maximal power was predominately generated by the hip (54%) followed by the knee (31%) and the ankle (15%). The importance of power generation at the knee decreased at second stance since it only accounted for 9% of total power generation and the importance of the ankle increased up to 38%. | 64.77 |
| Aerenhouts, Delecluse [1] | Block phase and initial acceleration (first 5 steps). Instrumented start blocks and a universal laser velocity sensor. | Compare starting performance between adults and juniors sprinters having reached their adult height | Horizontal block forces and spatiotemporal data | M F (g) M F | 16 9 23 19 | Elite Adult Elite Junior | 10.81 ± 0.40 11.29 ± 0.29 11.85 ± 0.24 12.54 ± 0.26 | The higher muscularity of senior athletes did not result in significantly higher forces against the starting blocks nor block velocity compared with the junior athletes. The more muscular senior athletes had a better running acceleration than the junior athletes. In female athletes, a higher body fat percentage negatively correlated with 1st step length. | 79.32 |
| Slawinski, Dumas [8] | Block phase and 1st step. Three-dimensional kinematic full-body model. | Compare the influence of bunched, medium, and elongated start on start performance | 3D kinematics and spatiotemporal data | M (e) F | 6 3 | National sprinters | 10.58 ± 0.27 11.61 ± 0.42 | Head and trunk limb movements were important to create a high CM velocity during the starting block phase. The elongated start, compared to the bunched or medium start, induced an increase in block velocity and a decrease in the time at 5 and 10 m. | 72.73 |
| Bezodis, Salo [2] | Block Phase. High-speed camera and a laser distance measurement device. | Choose the measure that best describes sprint start performance | Spatiotemporal data and horizontal block forces derivations | M | 12 | University sprinters | 11.30 ± 0.42 | For the 1st time, normalized average horizontal external power was identified as the most appropriate measure of performance. One single measure reflects how much a sprinter is able to increase velocity and the time taken to achieve this, whilst accounting for variations in morphologies between sprinters. | 79.55 |
| Slawinski, Bonnefoy [7] | Block phase and first 2 steps. Three-dimensional kinematic full-body model. | Identify the most relevant kinematic and kinetic parameters differentiators of elite and well-trained sprinters | 3D kinematics and spatiotemporal data | M | 6 6 | Elite Well-Trained | 10.27 ± 0.14 11.31 ± 0.28 | Anterior and vertical components of CM, rate of force development and force impulse were significantly greater in elite sprinters. The muscular strength and arm coordination appear to characterize the efficiency of the sprint start. | 67.73 |
| Slawinski, Bonnefoy [36] | Block phase. Three-dimensional kinematic full-body model. | Measure the joint angular velocity and the kinetic energy of the different segments in elite sprinters | 3D kinematics and 3D Euler angular velocities | M | 8 | Elite | 10.30 ± 0.14 | Highlights the importance of a 3D analysis of a sprint start. Joints such as shoulders, thoracic, or hips did not reach their maximal angular velocity with a movement of flexion-extension, but with a combination of flexion–extension, abduction–adduction and internal–external rotation. | 67.73 |
| Maulder, Bradshaw [40] | Block phase and first 3 steps. Two-dimensional kinematic full-body model. | Examine the changes in block start and early sprint acceleration kinematics with resisted sled loading | 2D kinematics—Sagittal plane | M | 10 | National and Regional | 10.87 ± 0.36 | A load of approximately 10% BM had no ‘‘negative’’ effect on sprint start technique or step kinematic variables. The kinematic changes produced by the 10% BM load may be more beneficial than those of the 20% BM load. | 76.14 |
| Gutierrez-Davilla, Dapena [17] | Block phase. Two synchronized force platforms under blocks (1) and hands (2) | Compare the CM velocities and positions between pre-tensed and conventional starts | Horizontal forces and spatiotemporal data | M | 19 | Experienced competitive sprinters | 11.09 ± 0.30 | The pre-tensed and conventional starts produced similar performance. The increased propulsive force exerted through the legs in the early part of the block acceleration phase in the pre-tensed starts was counteracted by an increased backward force exerted through the hands during the same period. | 72.95 |
| Mero, Kuitunen [19] | “Set” position (block phase and 1st step). Sixteen individual force platforms connected in series. | Examine the effects of muscle-tendon length on joint moment and power | 2D kinematics and horizontal and vertical GRF under blocks, hands and 1st step | M | 9 | Sprinters | 10.86 + 0.34 | Lower block angles (40° vs. 65°) were associated with enhanced starting performance by increasing the final block velocity. The inverse association between block angles and muscle-tendon lengths of the gastrocnemius and soleus in both legs, which may generate higher peak joint moments and powers, especially in the ankle joint, may explain this result. | 68.86 |
| Fortier, Basset [16] | Block phase and first 2 steps. Three-dimensional full-body kinematic model. Instrumented blocks. | Examine if kinetic and kinematic parameters could differentiate elite from sub-elite sprinters | 3D kinematics and horizontal block forces | M M | 6 6 | Elite Sub-Elite | <10.70 10.70 to 11.40 | Four kinetic parameters differentiating elite from sub-elite sprinters: delay between the end of rear and front force offset, rear peak force, total block time, and time to rear peak force. | 72.73 |
| Čoh, Jost [13] | Block phase and first 2 steps. Two-dimensional kinematic full-body model. Instrumented blocks. | Determine the most important kinematic and kinetic parameters of the “set” position and push-off | Horizontal block forces, 2D kinematic and spatiotemporal data | M F | 13 11 | Slovene national team | 10.73 ± 0.2 11.97 ± 2.6 | Identification of three parameters that best define an efficient start for both male and female sprinters: horizontal start velocity, start reaction time and impulse of push-off force from the front starting block. | 65.22 |
| Guissard, Duchateau [34] | Block phase. Strain gauges mounted on each footplate and behind the starting block. Two-dimensional kinematic front leg model. | Analyze the mechanical parameters about EMG activity at different front block inclinations | EMG, 2D kinematics and horizontal GRF behind blocks | M F | 14 3 | Trained | 10.4 to 11.9 | Decreasing front block obliquity induced neural and mechanical modifications that contribute to increasing the block start velocity without any increase in the duration of the push-off phase. | 76.36 |
| Mero [18] | Block phase and 1st stance. Starting blocks over a force platform. Two-dimensional kinematic full-body model (14 points). | Analyze the force-time characteristics during the 1st stance and the relationships between force and run velocity | 2D kinematics and horizontal and vertical GRF under blocks and 1st step | M | 8 | Trained | 10.79 ± 0.21 | In the 1st contact after leaving the blocks there was a significant braking phase and the force produced in the propulsion phase was associated with running velocity; Muscle strength strongly affected running velocity in sprint start. | 57.27 |
Publisher’s Note: MDPI stays neutral with regard to jurisdictional claims in published maps and institutional affiliations. |
© 2022 by the authors. Licensee MDPI, Basel, Switzerland. This article is an open access article distributed under the terms and conditions of the Creative Commons Attribution (CC BY) license (https://creativecommons.org/licenses/by/4.0/).
Share and Cite
Valamatos, M.J.; Abrantes, J.M.; Carnide, F.; Valamatos, M.-J.; Monteiro, C.P. Biomechanical Performance Factors in the Track and Field Sprint Start: A Systematic Review. Int. J. Environ. Res. Public Health 2022, 19, 4074. https://doi.org/10.3390/ijerph19074074
Valamatos MJ, Abrantes JM, Carnide F, Valamatos M-J, Monteiro CP. Biomechanical Performance Factors in the Track and Field Sprint Start: A Systematic Review. International Journal of Environmental Research and Public Health. 2022; 19(7):4074. https://doi.org/10.3390/ijerph19074074
Chicago/Turabian StyleValamatos, Maria João, João M. Abrantes, Filomena Carnide, Maria-José Valamatos, and Cristina P. Monteiro. 2022. "Biomechanical Performance Factors in the Track and Field Sprint Start: A Systematic Review" International Journal of Environmental Research and Public Health 19, no. 7: 4074. https://doi.org/10.3390/ijerph19074074