
Relationship between Eye Blink Frequency and Incremental Exercise among Young Healthy Men


Abstract
:1. Introduction
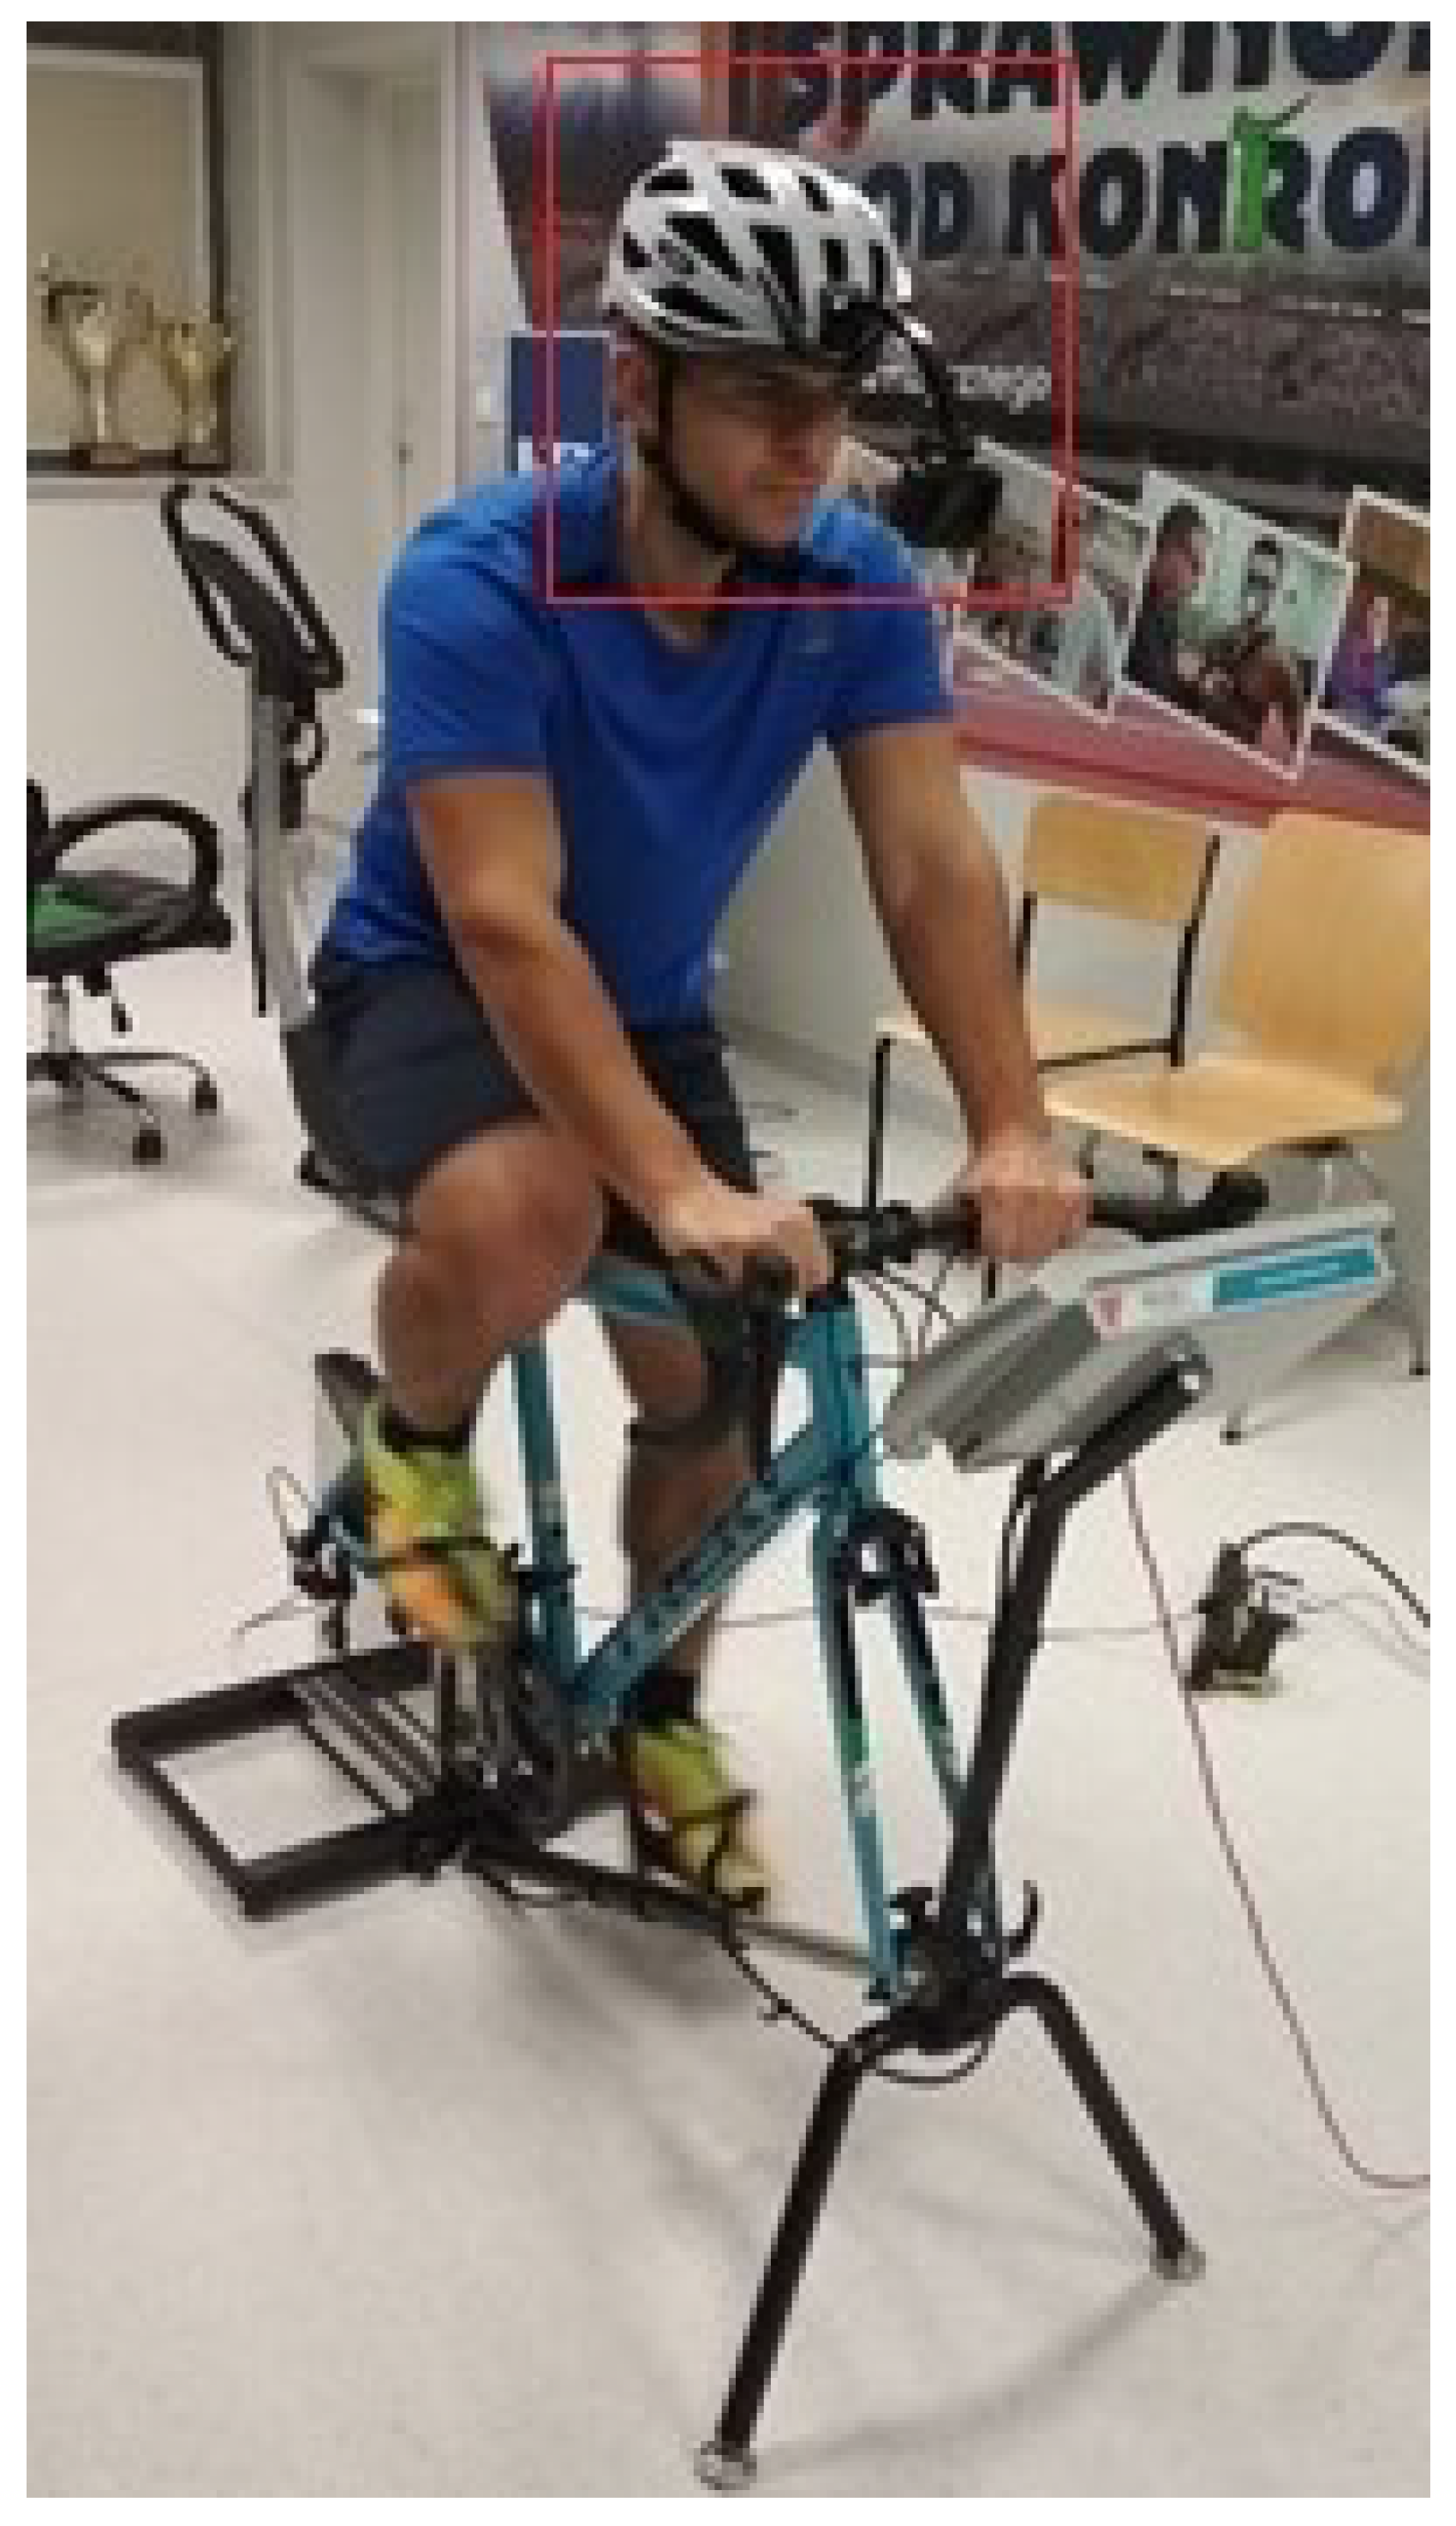
2. Materials
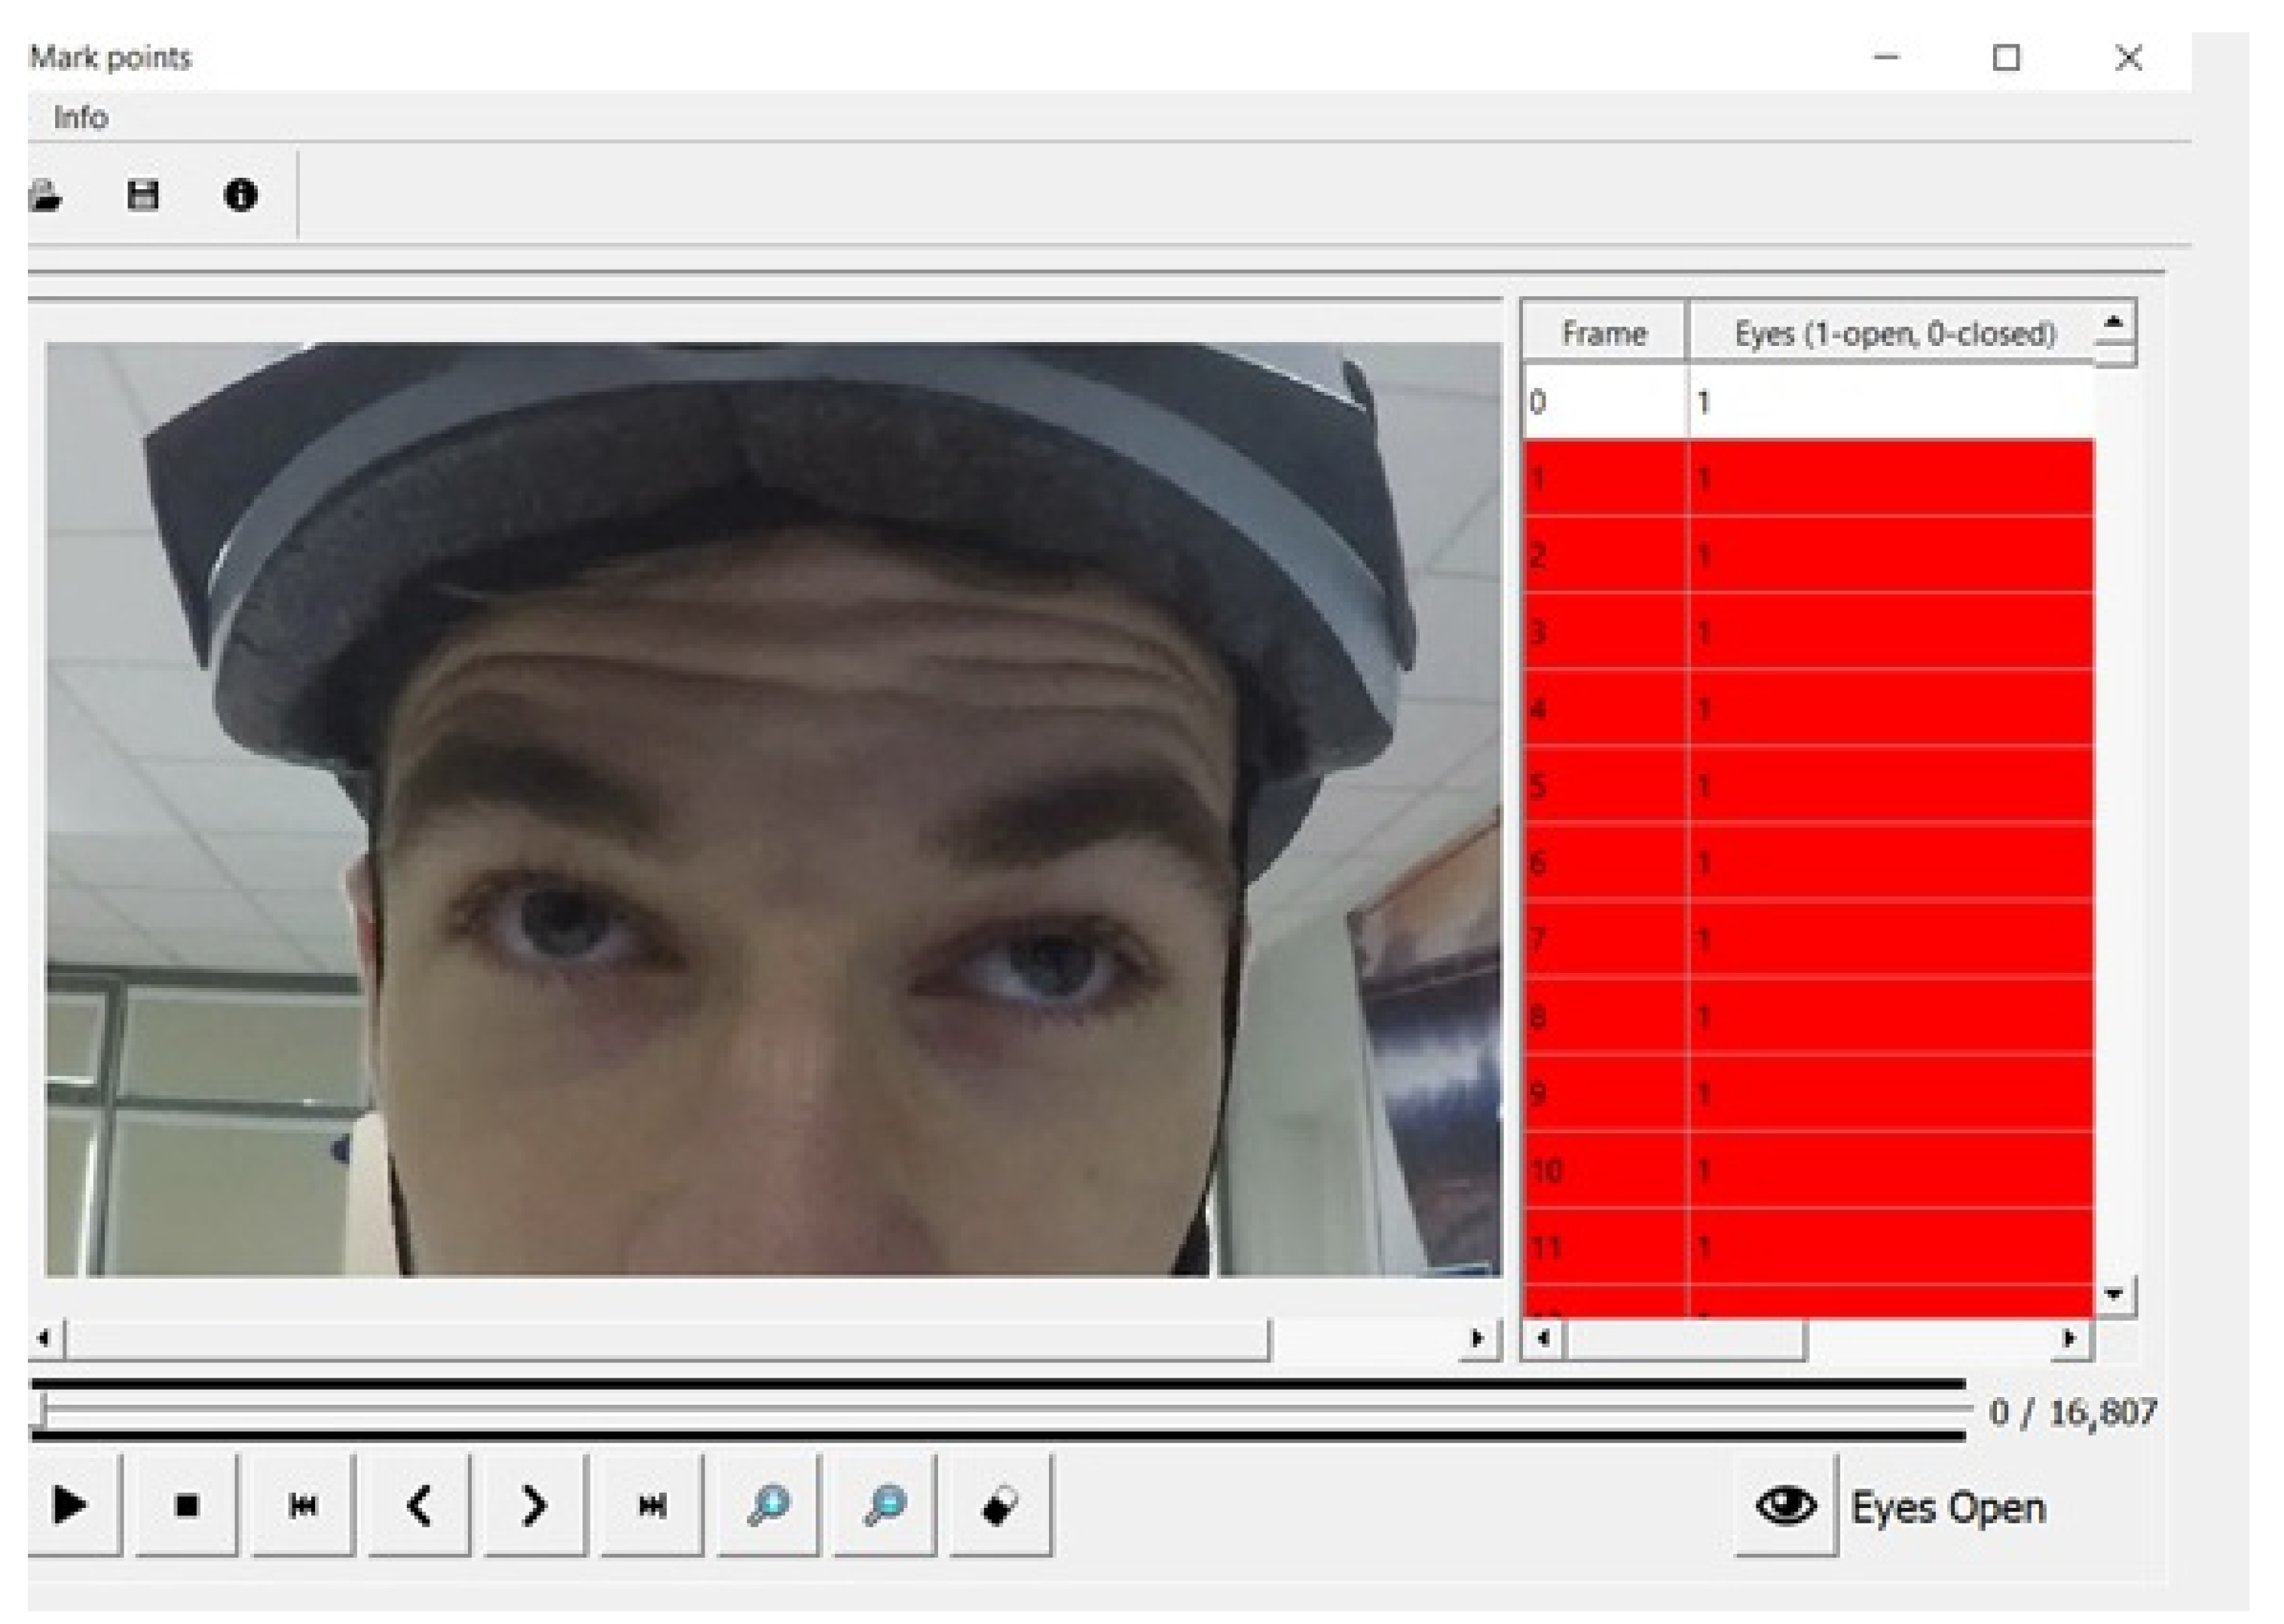
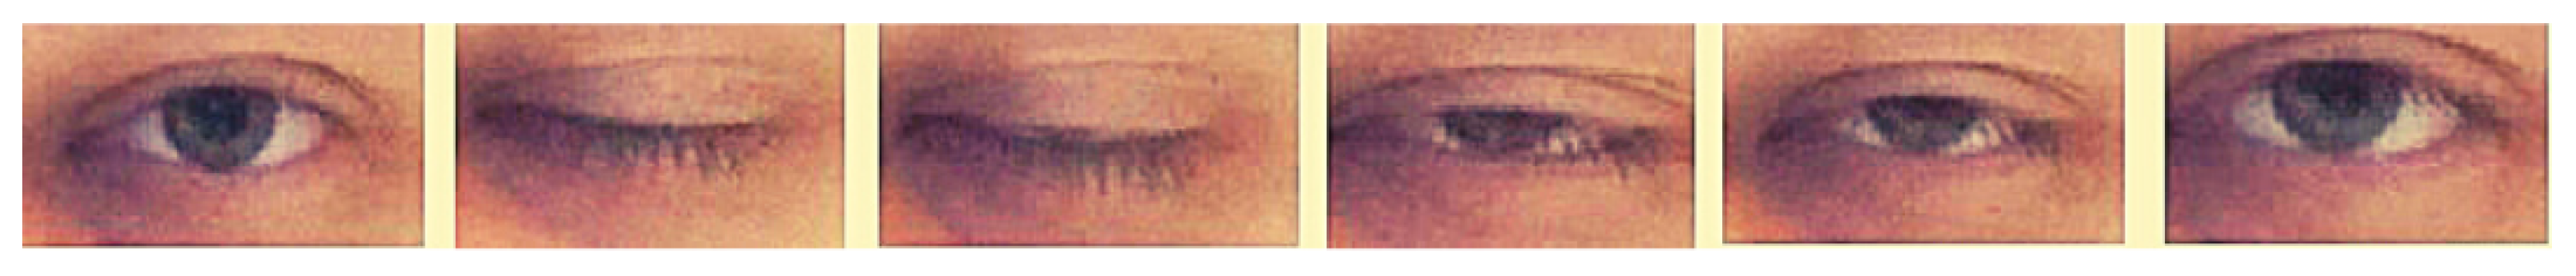
3. Methods
Statistical Method
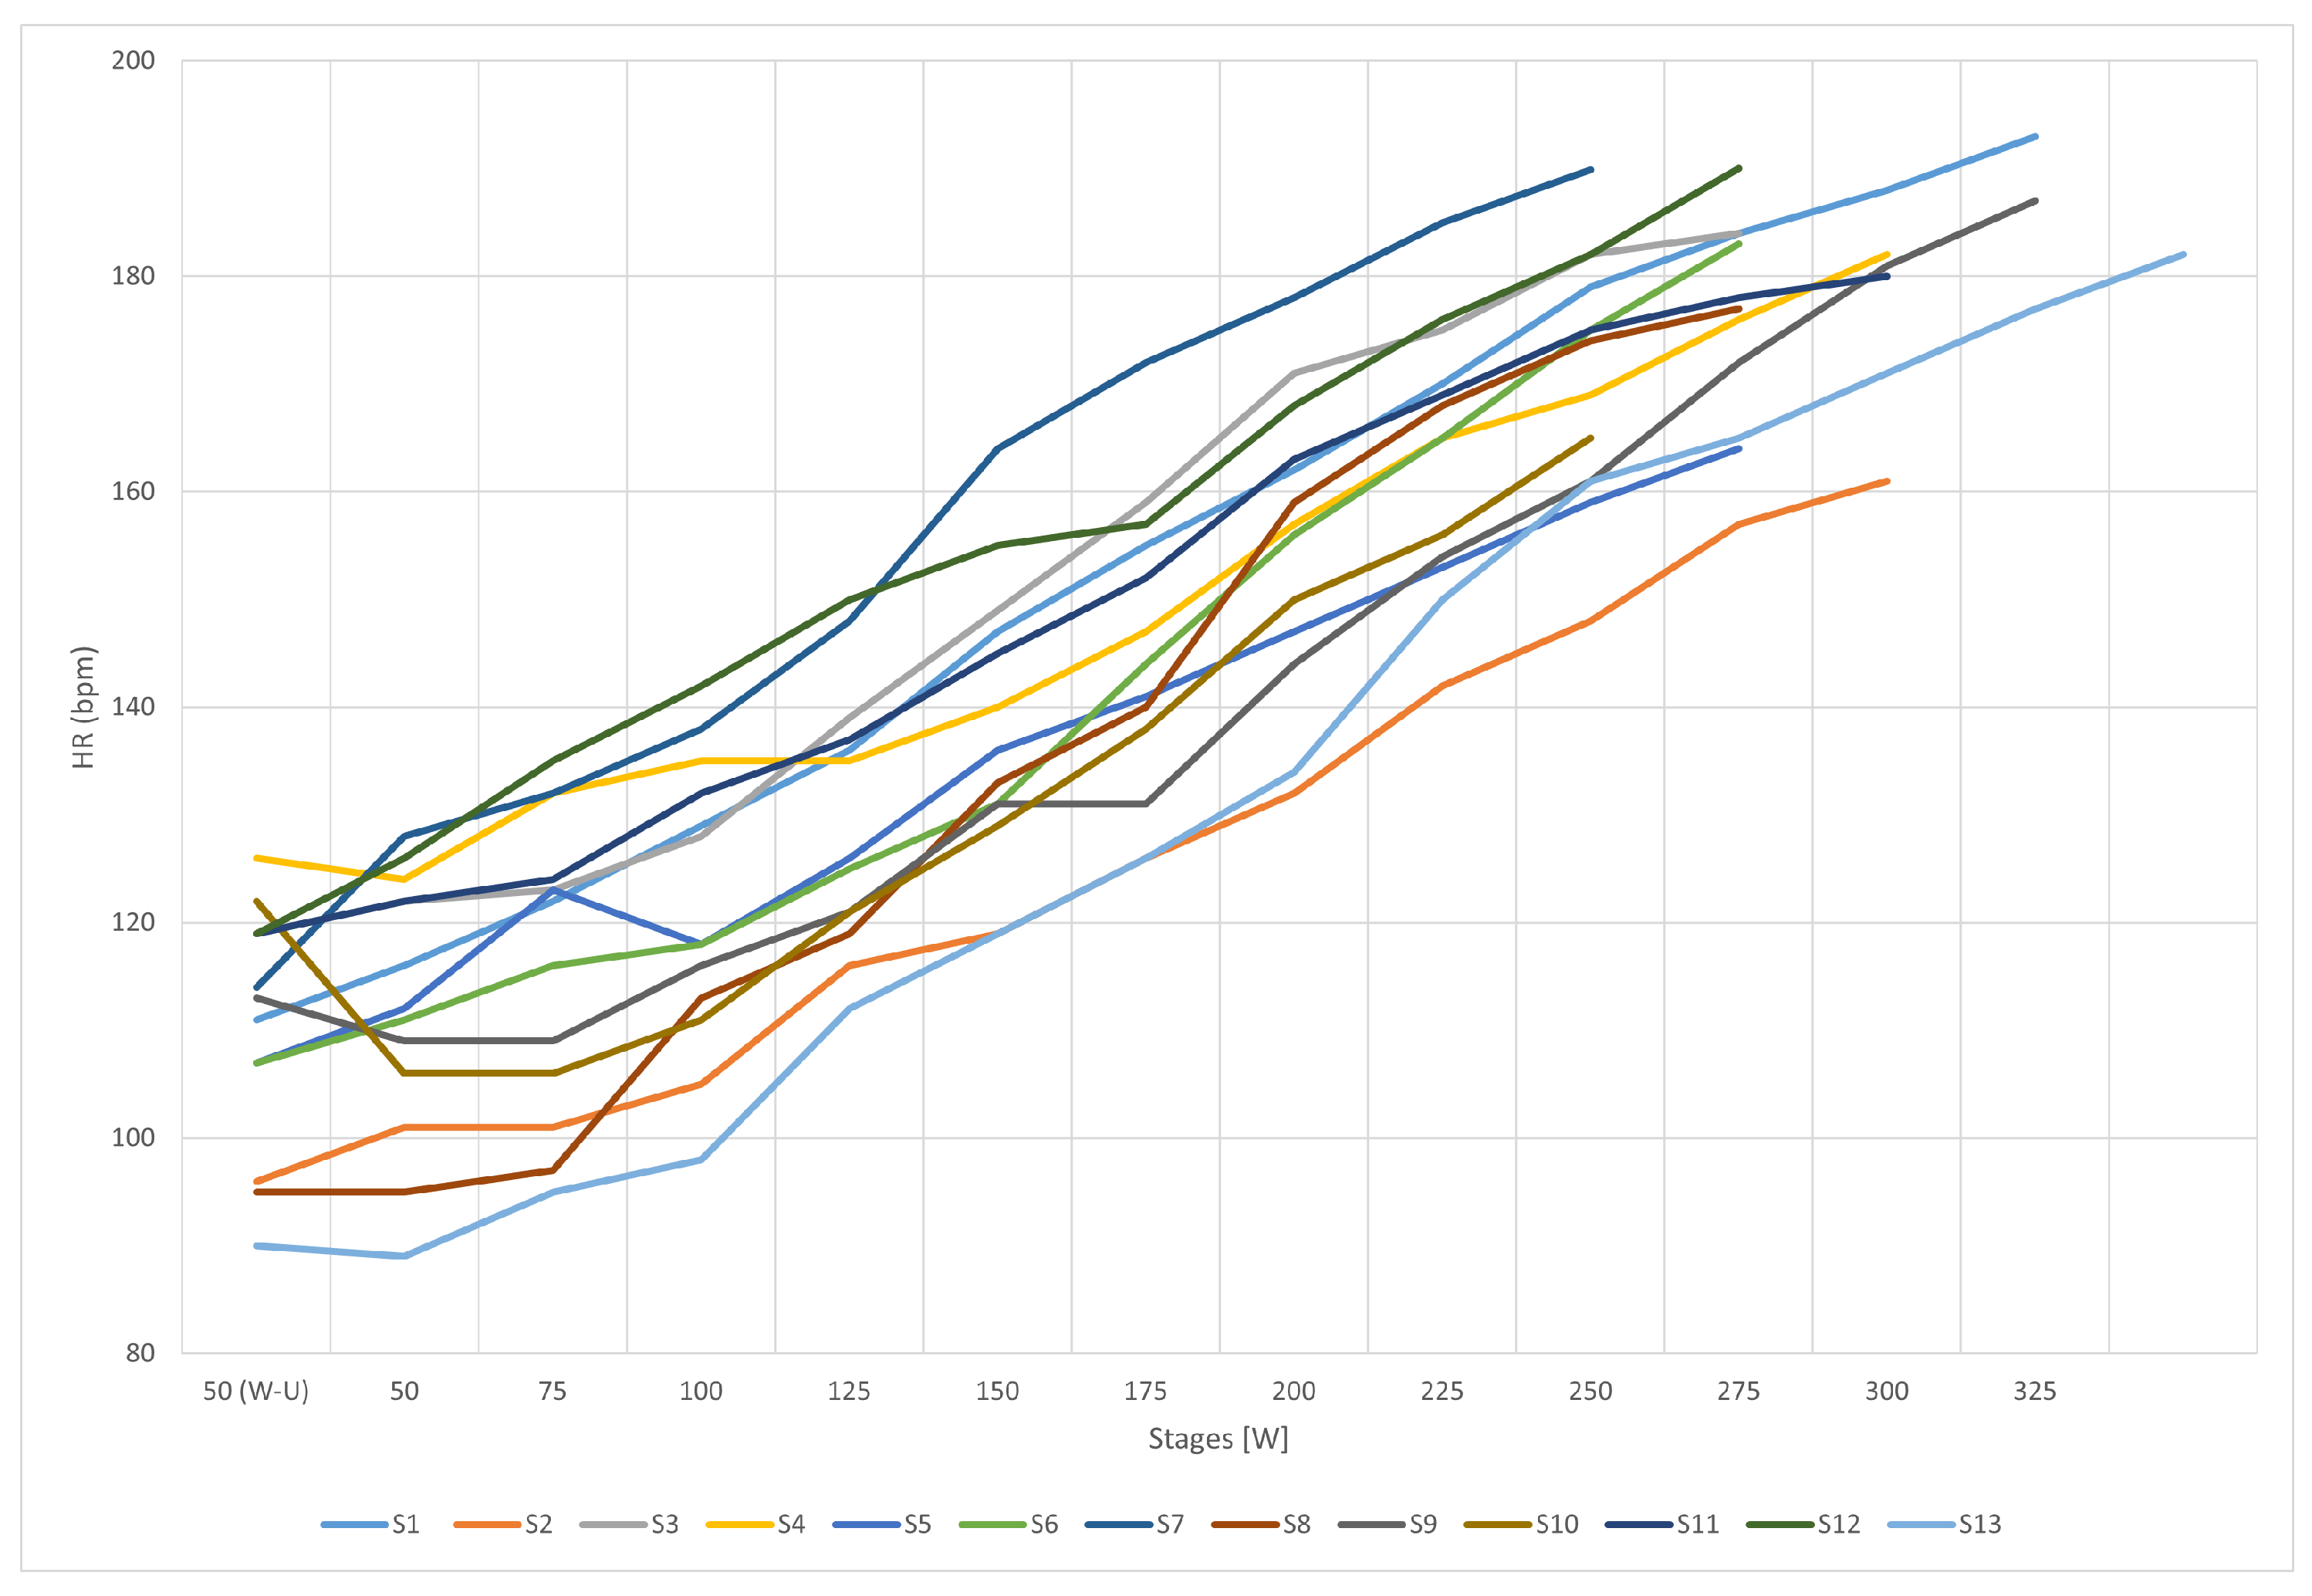
4. Results
5. Discussion
6. Conclusions
- (1)
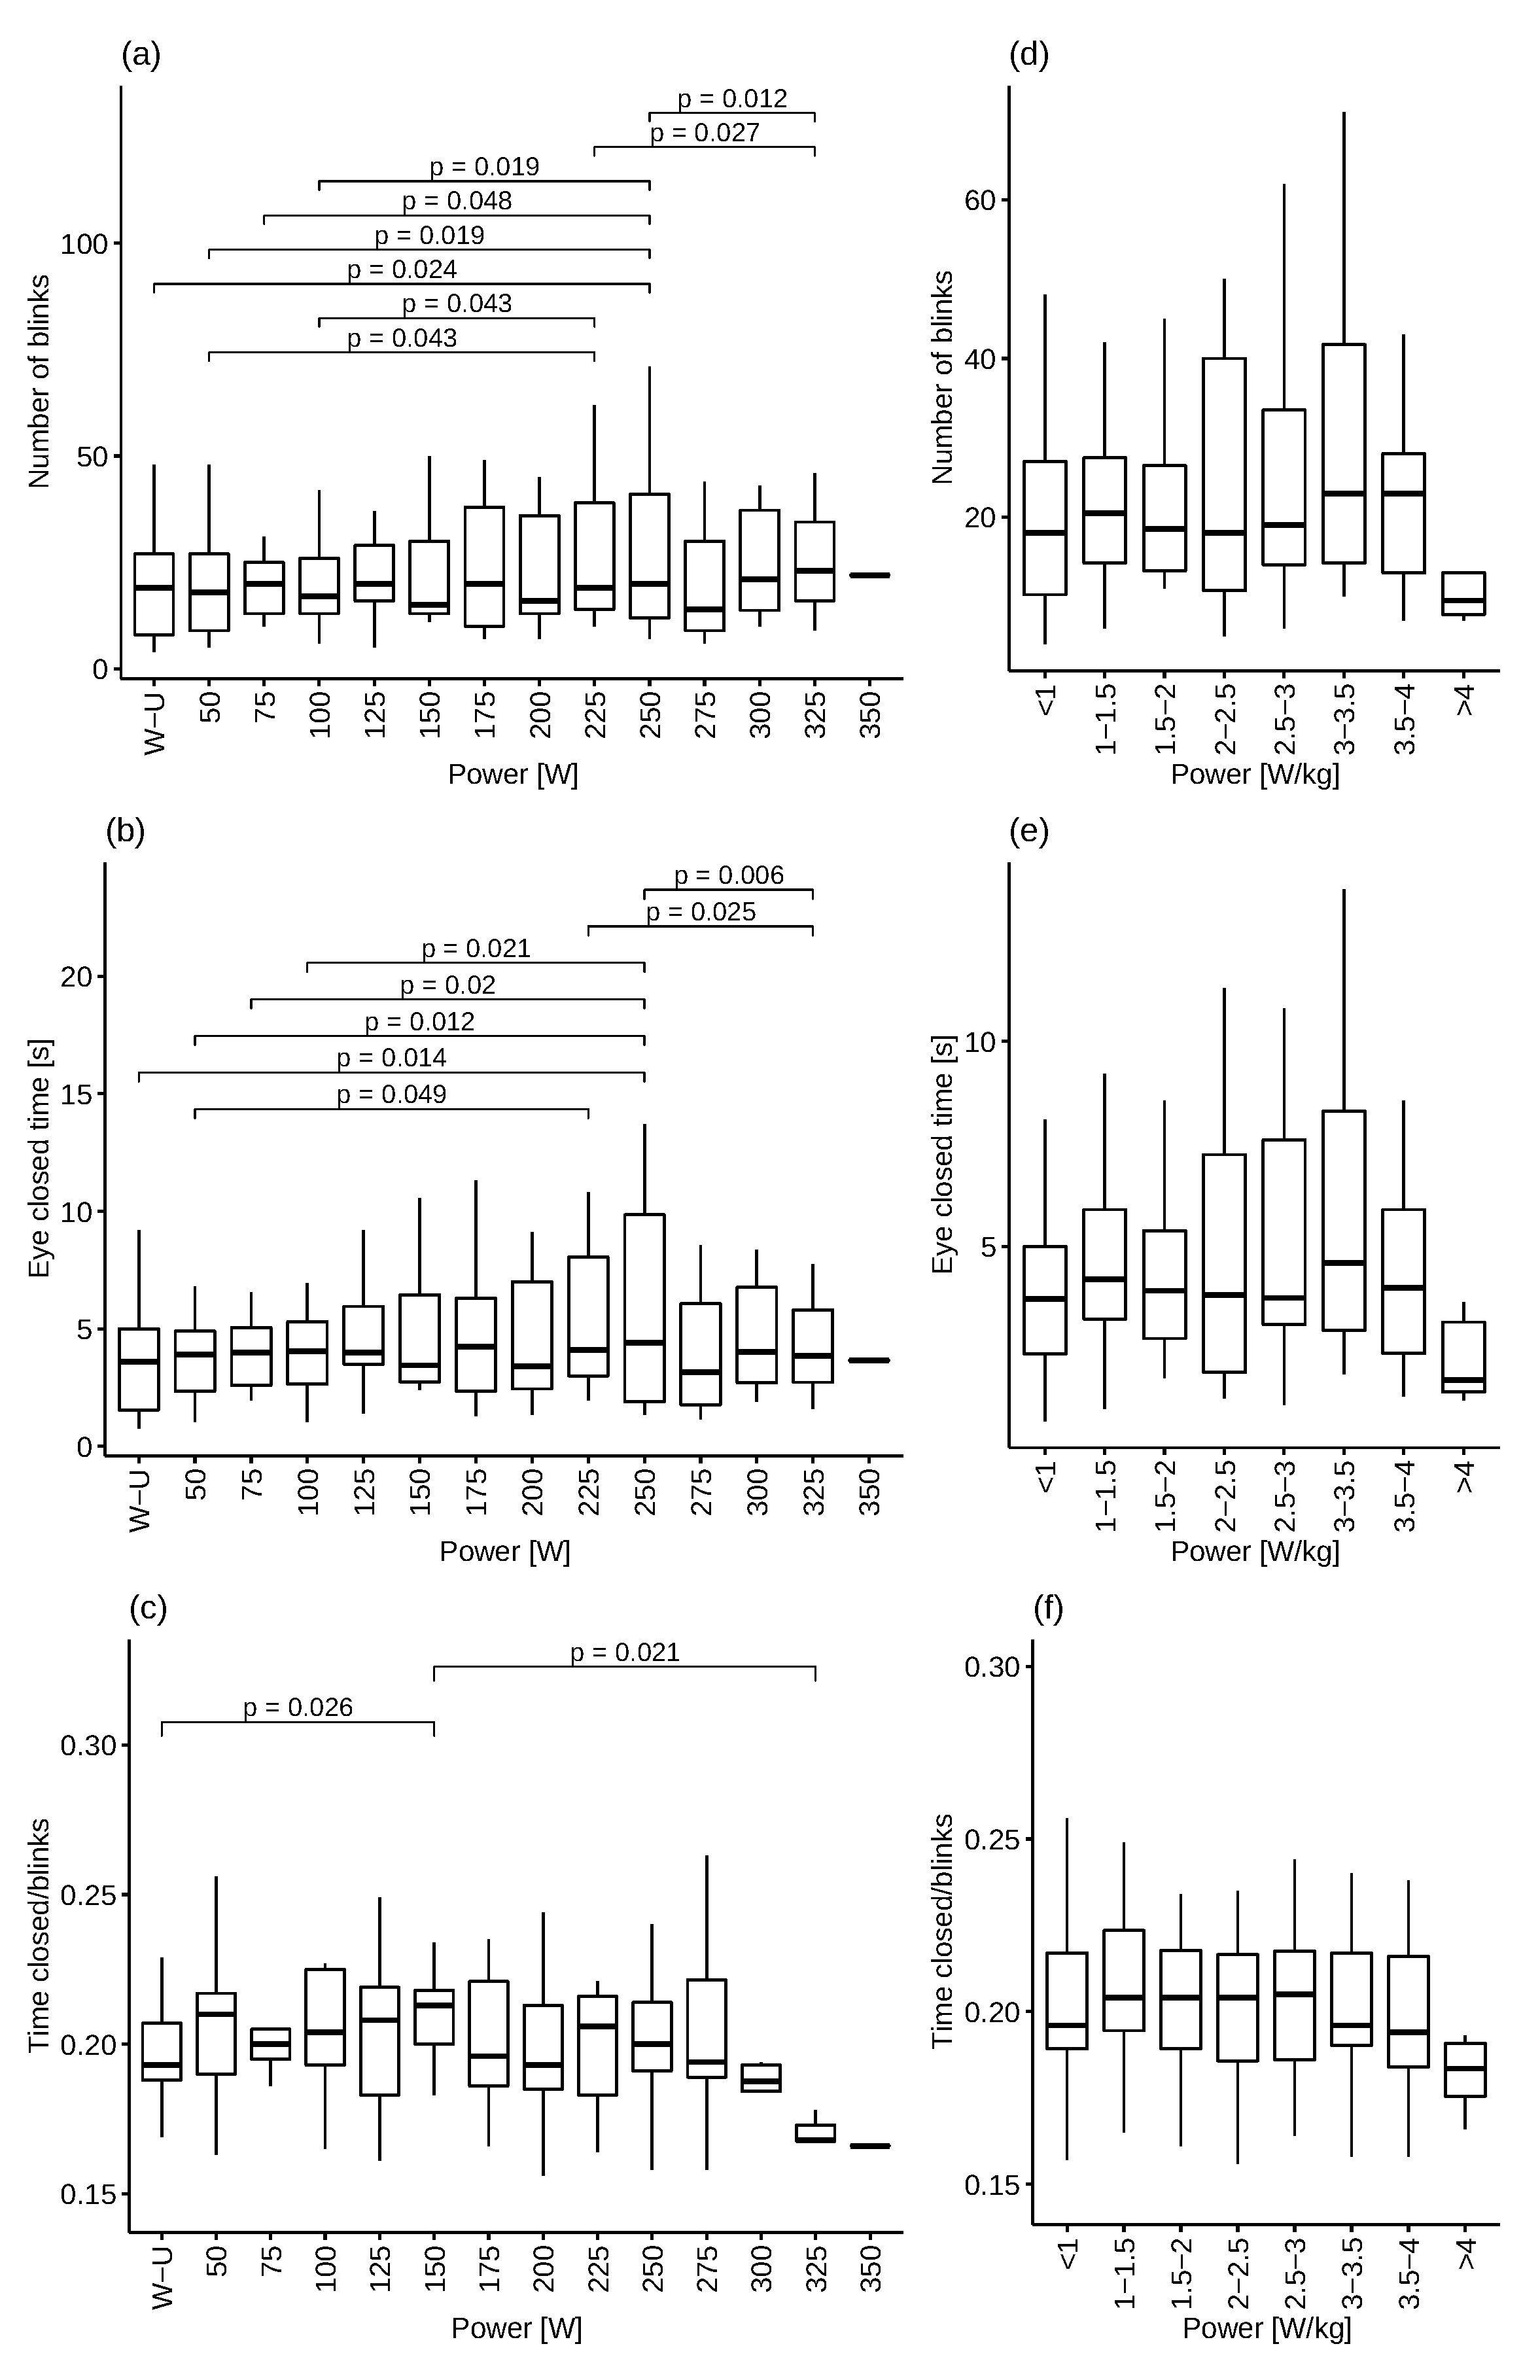
- The highest number of statistically significant differences in the blink rate and eye closure time was observed at the 250 W stage. At the same time, no statistically significant differences in relation to the load calculated in Watts per kilogram of body weight were observed.
- (2)
- The analysis showed no significant differences in blink rate, eye closure time, and single blink time in terms of heart rate ranges, during the experiment on a cycle ergometer.
- (3)
- The analysis of regression models revealed that the blink rate and eye closure time were determined by a group of factors. For the blink rate and eye closure time, the following factors were important: the value of cycle ergometer load power, heart rate, body weight, adipose tissue mass, fat-free mass, and total body water and body surface ratio, while for a single blink time factors such as cycle ergometer load power, adipose tissue mass and body weight ratio were important.
Author Contributions
Funding
Institutional Review Board Statement
Informed Consent Statement
Data Availability Statement
Conflicts of Interest
References
- Schellini, S.A.; Sampaio, A.A., Jr.; Hoyama, E.; Cruz, A.A.; Padovani, C.R. Spontaneous eye blink analysis in the normal individual. Orbit 2005, 24, 239–242. [Google Scholar] [CrossRef] [PubMed]
- Monster, A.; Chan, H.; O’Connor, D. Long-term trends in human eye blink rate. Biotelemetry Patient Monit. 1978, 5, 206–222. [Google Scholar]
- Bentivoglio, A.R.; Bressman, S.B.; Cassetta, E.; Carretta, D.; Tonali, P.; Albanese, A. Analysis of blink rate patterns in normal subjects. Mov. Disord. 1997, 12, 1028–1034. [Google Scholar] [CrossRef] [PubMed]
- Holland, M.K.; Tarlow, G. Blinking and thinking. PErceptual Mot. Ski. 1975, 41, 403–406. [Google Scholar] [CrossRef]
- Moraleda, S.; de Lope Asiain, J.; Graña, M. Recognizing cognitive activities through eye tracking. In Proceedings of the International Work-Conference on the Interplay Between Natural and Artificial Computation, Almería, Spain, 3–7 June 2019; Springer: Berlin, Germany, 2019; pp. 291–300. [Google Scholar]
- Maffei, A.; Angrilli, A. Spontaneous eye blink rate: An index of dopaminergic component of sustained attention and fatigue. Int. J. Psychophysiol. 2018, 123, 58–63. [Google Scholar] [CrossRef]
- Nakamori, K.; Odawara, M.; Nakajima, T.; Mizutani, T.; Tsubota, K. Blinking is controlled primarily by ocular surface conditions. Am. J. Ophthalmol. 1997, 124, 24–30. [Google Scholar] [CrossRef]
- Zametkin, A.J.; Stevens, J.R.; Pittman, R. Ontogeny of spontaneous blinking and of habituation of the blink reflex. Ann. Neurol. Off. J. Am. Neurol. Assoc. Child Neurol. Soc. 1979, 5, 453–457. [Google Scholar] [CrossRef]
- Garner, D.; Goodwin, J.; Tsai, N.; Kothera, R.; Semler, M.; Wolf, B. Blink reflex parameters in baseline, active, and head-impact Division I athletes. Cogent Eng. 2018, 5, 1429110. [Google Scholar] [CrossRef]
- Wylegala, A. The effects of physical exercises on ocular physiology: A review. J. Glaucoma 2016, 25, e843–e849. [Google Scholar] [CrossRef]
- Gawron, V.J.; French, J.; Funke, D. An overview of fatigue. In Stress, Workload, and Fatigue (Human Factors in Transportation); Lawrence Erlbaum Associates Publishers: Mahwah, NJ, USA, 2001; pp. 581–595. [Google Scholar]
- Borg, E.; Borg, G.; Larsson, K.; Letzter, M.; Sundblad, B.M. An index for breathlessness and leg fatigue. Scand. J. Med. Sci. Sports 2010, 20, 644–650. [Google Scholar] [CrossRef]
- Bentley, D.J.; Newell, J.; Bishop, D. Incremental exercise test design and analysis. Sports Med. 2007, 37, 575–586. [Google Scholar] [PubMed]
- Huang, D.H.; Chou, S.W.; Chen, Y.L.; Chiou, W.K. Frowning and jaw clenching muscle activity reflects the perception of effort during incremental workload cycling. J. Sports Sci. Med. 2014, 13, 921. [Google Scholar] [PubMed]
- de Morree, H.M.; Marcora, S.M. The face of effort: Frowning muscle activity reflects effort during a physical task. Biol. Psychol. 2010, 85, 377–382. [Google Scholar] [CrossRef] [PubMed]
- Haq, Z.A.; Hasan, Z. Eye-blink rate detection for fatigue determination. In Proceedings of the 2016 IEEE 1st India International Conference on Information Processing (IICIP), Delhi, India, 12–14 August 2016; pp. 1–5. [Google Scholar]
- Zhang, C.; Wu, X.; Zhang, L.; He, X.; Lv, Z. Simultaneous detection of blink and heart rate using multi-channel ICA from smart phone videos. Biomed. Signal Process. Control 2017, 33, 189–200. [Google Scholar] [CrossRef]
- Baccour, M.H.; Driewer, F.; Kasneci, E.; Rosenstiel, W. Camera-based eye blink detection algorithm for assessing driver drowsiness. In Proceedings of the 2019 IEEE Intelligent Vehicles Symposium (IV), Paris, France, 9–12 June 2019; pp. 987–993. [Google Scholar]
- Islam, A.; Rahaman, N.; Ahad, M.A.R. A study on tiredness assessment by using eye blink detection. Jurnal Kejuruteraan 2019, 31, 209–214. [Google Scholar]
- Wylęgała, A.; Sędziak-Marcinek, B.; Pilch, J.; Wylęgała, E. Alteration of Blinking and Sex Differences During Physical Exercise Affect Tear Osmolarity. J. Hum. Kinet. 2019, 67, 143–151. [Google Scholar] [CrossRef] [Green Version]
- Chiviacowsky, S.; Harter, N.; Del Vecchio, F.; Abdollahipour, R. Relatedness affects eye blink rate and movement form learning. J. Phys. Educ. Sport 2019, 19, 859–866. [Google Scholar]
- Rasyad, M.; Muslim, E.; Pradana, A.A. Measurement of fatigue eye on computer users with method of eye tracking. AIP Conf. Proc. 2020, 2227, 040026. [Google Scholar]
- Kuwamizu, R.; Suwabe, K.; Damrongthai, C.; Fukuie, T.; Ochi, G.; Hyodo, K.; Hiraga, T.; Nagano-Saito, A.; Soya, H. Spontaneous Eye Blink Rate Connects Missing Link between Aerobic Fitness and Cognition. Med. Sci. Sports Exerc. 2021, 53, 1425–1433. [Google Scholar]
- Huang, D.H.; Chiou, W.K. Validation of a facial pictorial rating of perceived exertion scale for evaluating physical tasks. J. Ind. Prod. Eng. 2013, 30, 125–131. [Google Scholar] [CrossRef]
- Irani, R.; Nasrollahi, K.; Moeslund, T.B. Contactless measurement of muscles fatigue by tracking facial feature points in a video. In Proceedings of the 2014 IEEE International Conference on Image Processing (ICIP), Paris, France, 27–30 October 2014; pp. 4181–4185. [Google Scholar]
- Miles, K.H.; Clark, B.; Périard, J.D.; Goecke, R.; Thompson, K.G. Facial feature tracking: A psychophysiological measure to assess exercise intensity? J. Sports Sci. 2018, 36, 934–941. [Google Scholar] [CrossRef] [PubMed]
- Khanal, S.R.; Barroso, J.; Sampaio, J.; Filipe, V. Classification of physical exercise intensity by using facial expression analysis. In Proceedings of the 2018 IEEE Second International Conference on Computing Methodologies and Communication (ICCMC), Erode, India, 15–16 February 2018; pp. 765–770. [Google Scholar]
- Khanal, S.R.; Fonseca, A.; Marques, A.; Barroso, J.; Filipe, V. Physical exercise intensity monitoring through eye-blink and mouth’s shape analysis. In Proceedings of the 2018 IEEE 2nd International Conference on Technology and Innovation in Sports, Health and Wellbeing (TISHW), Thessaloniki, Greece, 20–22 June 2018; pp. 1–5. [Google Scholar]
- Khanal, S.R.; Sampaio, J.; Barroso, J.; Filipe, V. Classification of physical exercise intensity based on facial expression using deep neural network. In Proceedings of the International Conference on Human-Computer Interaction, Orlando, FL, USA, 26–31 July 2019; Springer: Berlin, Germany, 2019; pp. 455–467. [Google Scholar]
- Khanal, S.R.; Sampaio, J.; Barroso, J.; Filipe, V. Individual’s Neutral Emotional Expression Tracking for Physical Exercise Monitoring. In Proceedings of the International Conference on Human-Computer Interaction, Copenhagen, Denmark, 19–24 July 2020; Springer: Berlin, Germany, 2020; pp. 145–155. [Google Scholar]
- Zwierko, T.; Glowacki, T. The Influence of Incremental Exercise on Reaction Time in Physical Active Women. Zeszyty Naukowe. Prace Instytutu Kultury Fizycznej. Uniwersytet Szczeciński 2008, 25, 49–57. [Google Scholar]
- Brooks, G.; Fahey, T.; Baldwin, K. Exercise Physiology: Human Bioenergetics and Its Application; McGraw-Hill: New York, NY, USA, 2005. [Google Scholar]
- Chmura, J.; Nazar, K. Parallel changes in the onset of blood lactate accumulation (OBLA) and threshold of psychomotor performance deterioration during incremental exercise after training in athletes. Int. J. Psychophysiol. 2010, 75, 287–290. [Google Scholar] [CrossRef] [PubMed]
- Magliacano, A.; Fiorenza, S.; Estraneo, A.; Trojano, L. Eye blink rate increases as a function of cognitive load during an auditory oddball paradigm. Neurosci. Lett. 2020, 736, 135293. [Google Scholar] [CrossRef] [PubMed]
- Cardona, G.; García, C.; Serés, C.; Vilaseca, M.; Gispets, J. Blink rate, blink amplitude, and tear film integrity during dynamic visual display terminal tasks. Curr. Eye Res. 2011, 36, 190–197. [Google Scholar] [CrossRef] [PubMed]
- Lenskiy, A.; Paprocki, R. Blink rate variability during resting and reading sessions. In Proceedings of the 2016 IEEE Conference on Norbert Wiener in the 21st Century (21CW), Melbourne, VIC, Australia, 13–16 July 2016; pp. 1–6. [Google Scholar]
- Kim, D.; Choi, S.; Choi, J.; Shin, H.; Sohn, K. Visual fatigue monitoring system based on eye-movement and eye-blink detection. In Stereoscopic Displays and Applications XXII; International Society for Optics and Photonics: San Diego, CA, USA, 2011; Volume 7863, p. 786303. [Google Scholar]
- Raha, M.; Roy, A. Fatigue estimation through face monitoring and eye blinking. In Proceedings of the International Conference on Mechanical, Industrial and Energy Engineering, Khulna, Bangladesh, 25–26 December 2014; pp. 1–5. [Google Scholar]
- Sigari, M.H.; Pourshahabi, M.R.; Soryani, M.; Fathy, M. A review on driver face monitoring systems for fatigue and distraction detection. Int. J. Adv. Sci. Technol. 2014, 64, 73–100. [Google Scholar] [CrossRef]
- Benedetto, S.; Pedrotti, M.; Minin, L.; Baccino, T.; Re, A.; Montanari, R. Driver workload and eye blink duration. Transp. Res. Part F Traffic Psychol. Behav. 2011, 14, 199–208. [Google Scholar] [CrossRef]
- Marandi, R.Z.; Madeleine, P.; Omland, Ø.; Vuillerme, N.; Samani, A. Eye movement characteristics reflected fatigue development in both young and elderly individuals. Sci. Rep. 2018, 8, 13148. [Google Scholar] [CrossRef]

| sd | min | max | ||
|---|---|---|---|---|
| Body weight [kg] | 75.9 | 10.1 | 54.8 | 91.8 |
| Body height [cm] | 176.8 | 6.4 | 167 | 186 |
| BMI [kg/m] | 24 | 3.6 | 17.1 | 29.7 |
| FAT [%] | 13 | 5.8 | 3.2 | 20.6 |
| FFM [kg] | 65.6 | 6.3 | 53 | 76.1 |
| TBW [kg] | 44.6 | 3.7 | 37.1 | 50.2 |
| HR [bpm] | 182.2 | 10 | 161 | 193 |
| HR [bpm] | 87.8 | 9.9 | 76 | 106 |
| Power [W/kg] | 2.3 | 1.2 | 0.5 | 5.5 |
| Power [W/kg] | 3.9 | 0.6 | 3.1 | 5.5 |
| BSA [m] | 1.92 | 0.13 | 1.62 | 2.1 |
| Power [W] | N | Blinks Eye [n] | Time of Closed Eye [s] | Time/Closed [s/n] | |||
|---|---|---|---|---|---|---|---|
| Me | Me | Me | |||||
| Warm up | 13 | 20.5 ± 14.6 | 19.0 | 4.0 ± 2.6 | 3.6 | 0.2 ± 0.03 | 0.19 |
| 50 | 13 | 20.5 ± 12.8 | 18.0 | 4.1 ± 2.5 | 3.9 | 0.21 ± 0.03 | 0.21 |
| 75 | 13 | 22.5 ± 13.4 | 20.0 | 4.5 ± 2.4 | 4.0 | 0.2 ± 0.03 | 0.2 |
| 100 | 13 | 21.3 ± 13.1 | 17.0 | 4.4 ± 2.5 | 4.1 | 0.21 ± 0.03 | 0.2 |
| 125 | 13 | 25.2 ± 16.2 | 20.0 | 5.1 ± 2.9 | 4.0 | 0.21 ± 0.03 | 0.21 |
| 150 | 13 | 23.2 ± 13.5 | 15.0 | 4.9 ± 2.9 | 3.5 | 0.21 ± 0.02 | 0.21 |
| 175 | 13 | 23.2 ± 14.7 | 20.0 | 4.7 ± 3.1 | 4.3 | 0.2 ± 0.02 | 0.2 |
| 200 | 13 | 22.5 ± 13.8 | 16.0 | 4.5 ± 2.8 | 3.4 | 0.2 ± 0.03 | 0.19 |
| 225 | 13 | 26.4 ± 17.4 | 19.0 | 5.3 ± 3.2 | 4.1 | 0.21 ± 0.03 | 0.21 |
| 250 | 13 | 27.3 ± 20.0 | 20.0 | 5.6 ± 4.1 | 4.4 | 0.2 ± 0.02 | 0.2 |
| 275 | 11 | 19.8 ± 14.4 | 14.0 | 4.1 ± 2.9 | 3.2 | 0.21 ± 0.04 | 0.19 |
| 300 | 6 | 24.8 ± 14.4 | 21.0 | 4.7 ± 2.7 | 4.0 | 0.19 ± 0.02 | 0.19 |
| 325 | 3 | 26.0 ± 18.7 | 23.0 | 4.4 ± 3.1 | 3.9 | 0.17 ± 0.01 | 0.17 |
| 350 | 1 | 22.0 | 22.0 | 3.7 | 3.7 | 0.17 | 0.17 |
| % HR | Blinks Eye | Time of Closed Eye | Time/Closed | |||
|---|---|---|---|---|---|---|
| Me | Me | Me | ||||
| R1—≤75% | 22.3 ± 14.4 | 18.0 | 4.5 ± 2.8 | 3.9 | 0.21 ± 0.03 | 0.20 |
| R2—75–90% | 25.1 ± 14.4 | 21.0 | 5.0 ± 2.8 | 4.0 | 0.20 ± 0.03 | 0.20 |
| R3—≥90% | 22.6 ± 15.3 | 19.0 | 4.5 ± 3.0 | 3.8 | 0.20 ± 0.2 | 0.19 |
| Variable | R1 vs. R2 | R1 vs. R3 | R2 vs. R3 |
|---|---|---|---|
| p | p | p | |
| Blinks Eye | 0.9166 | 0.8489 | 0.9497 |
| Time of closed eye | 0.9280 | 0.9961 | 0.9713 |
| Time/closed | 0.6721 | 03612 | 0.2877 |
Publisher’s Note: MDPI stays neutral with regard to jurisdictional claims in published maps and institutional affiliations. |
© 2022 by the authors. Licensee MDPI, Basel, Switzerland. This article is an open access article distributed under the terms and conditions of the Creative Commons Attribution (CC BY) license (https://creativecommons.org/licenses/by/4.0/).
Share and Cite
Paśko, W.; Zadarko, E.; Krzeszowski, T.; Przednowek, K. Relationship between Eye Blink Frequency and Incremental Exercise among Young Healthy Men. Int. J. Environ. Res. Public Health 2022, 19, 4362. https://doi.org/10.3390/ijerph19074362
Paśko W, Zadarko E, Krzeszowski T, Przednowek K. Relationship between Eye Blink Frequency and Incremental Exercise among Young Healthy Men. International Journal of Environmental Research and Public Health. 2022; 19(7):4362. https://doi.org/10.3390/ijerph19074362
Chicago/Turabian StylePaśko, Wojciech, Emilian Zadarko, Tomasz Krzeszowski, and Krzysztof Przednowek. 2022. "Relationship between Eye Blink Frequency and Incremental Exercise among Young Healthy Men" International Journal of Environmental Research and Public Health 19, no. 7: 4362. https://doi.org/10.3390/ijerph19074362
APA StylePaśko, W., Zadarko, E., Krzeszowski, T., & Przednowek, K. (2022). Relationship between Eye Blink Frequency and Incremental Exercise among Young Healthy Men. International Journal of Environmental Research and Public Health, 19(7), 4362. https://doi.org/10.3390/ijerph19074362