
The Future of Climate-Resilient and Climate-Neutral City in the Temperate Climate Zone


Abstract
:1. Introduction
1.1. The Urban Heat Island (UHI) Effect–Causes, Effects, and Countermeasure
1.2. Countermeasure Strategies
2. Materials and Methods
2.1. Selection Criteria for Papers
2.2. The Systematizing Elements Structure
2.3. Statistical Analysis of the Results
- (a)
- Elements of the built environment: neighborhood cluster, street canyon, and building;
- (b)
- Parameter family: geometric, morphological, and topographic parameters;
- (c)
- Country where the research was conducted.
3. Results
Statistical Analysis Results
4. Discussion and Urban Design Strategy Recommendations
4.1. Out-of-Scale Parameters
4.2. Material Properties
Material Albedo
4.3. Building Scale Design Parameters
4.3.1. Envelope Geometry
4.3.2. Anthropogenic Emission
4.4. Street Canyon Scale Design Parameters
4.4.1. Surface Geometry
4.4.2. Street Orientation
4.4.3. Canopy Properties
4.5. Design Parameters of Neighborhood Cluster Scale
4.5.1. Coverage Area
4.5.2. Elements’ Density
4.5.3. Spatial Pattern
5. Conclusions and Recommendations for Future Research
5.1. Guidelines for Microclimatic City Design
5.1.1. Material
5.1.2. Building
5.1.3. Street Canyon
5.1.4. Neighborhood
5.2. Vision of Climate-Resilient and Climate-Neutral Cities
5.3. Future Research Direction
- Reviews of the UE parameters relevant to the UHI propagation for different climate zones are necessary to develop homogeneous guidelines for every climate zone separately. Only then would it be possible to compare the microclimatic design policies and learn about the diversity of the individual parameter impact in different climate zones. The model of this publication can be used to create a normative series of reviews.
- The introduction of changes to the urban environment to modify the microclimate is already taking place. Microclimate modeling programs (such as the ENVI-met) implemented geometry changes and UE morphology solutions. BGI implementation is carried out as well. Although these programs are based on many years of research, it is impossible to generate solutions depending on the preferred temperature change automatically. The research on an automated algorithm able to model a city’s thermal solutions will be the area of the next stage of research of the presented paper’s authors.
- Another research area worth undertaking is underground building development. Models should be made based on the theoretical knowledge obtained from this review, creating prototype constructions and analyzing their performance. Solutions should be designed to enable the entire urban unit’s autonomy in energy and a closed cycle of matter and raw materials. The review authors plan to research these solutions in the future.
- The necessary gap to fill is the development of a clear range of techniques and materials desirable for microclimatic reasons, which can be used in local interventions and in creating a new urban environment. A good solution would be to construct specialized tables for both BGI elements and UE facilities listing possible techniques, solutions, and plant and building material pallets. Material pallets should define their averaged quantitative impact on the microclimate and the urban environment quality, including carbon dioxide, oxygen, temperature, humidity, dust, wind, and shade. Full parameterization of the solutions range should form the basis for further research into microclimatic design automation.
Author Contributions
Funding
Institutional Review Board Statement
Informed Consent Statement
Data Availability Statement
Conflicts of Interest
Appendix A

| Element/Urban Matter Scale | Parameter Family | Parameter | Subparameter | Description | Author |
|---|---|---|---|---|---|
| Neighborhood cluster | Geometrical | Plot area | - | - | [150] |
| Plot type | (Semi-enclosed, interspersed, long-linear) | [150] | |||
| Parcel density (PD) | - | - | [189] | ||
| Urbanization ratio | - | The total artificial area to plot area ratio. Synonyms: artificial area ratio Acronyms: (AAR) | [124,182,187,242,334,335] | ||
| Building intensity (BI) | - | The ratio of building volume and area/plot/total block area. Synonyms: building volume, number of building volumes within the area, the territorial utilization index, three-dimensional volume index Acronyms: (CI), (NOB), (cum/sqm), (3DVI) | [118,234,278,297,336,337] | ||
| Building complexity (Cex) | - | The ratio of the vertical surface area (walls) to the site area Synonyms: facade-to-site ratio Acronyms: (VH urb) | [174,278,338] | ||
| Building edge density (EDBuild) | - | The density of wall facets within a site | [190] | ||
| Mean area covered by buildings (BF) | - | Synonym: mean architecture projection area Acronym: (MAPA) | [297,299] | ||
| Building density (BD) | - | The building base footprint area to plot area ratio describes the proportion of built ground in an area Synonyms: building surface fraction, building area, built-up ratio, built-up footprint, build up density, built-up index, housing density, urban density, aggregation of buildings, building coverage, site coverage ratio, building footprint ratio, building planar area index, building coverage ratio, gross space index, building site coverage, two-dimensional area Index Acronyms: (BUILT), (SvW), (BSF%), (ba), (B), (B0), (HD), (BA), (SCo), (ρ urb), (Bfr), (BCR), (GSI), (BSC), (2DAI) | [97,118,121,123,125,126,128,137,138,139,142,146,149,152,153,155,157,166,168,172,174,175,178,179,184,186,189,191,204,207,234,235,236,238,240,241,243,244,249,278,291,294,296,297,299,301,302,303,306,308,313,326,337,338,339,340,341,342,343,344,345,346,347,348,349,350,351,352,353,354,355] | ||
| Building density at the height of 10 m (DENSITYbot_St) | - | [240] | |||
| Building density at the height of 30 m (DENSITYmid_St) | - | [240] | |||
| Building density at the height of 60 m (DENSITYtop_St) | - | [240] | |||
| The gross floor area (GFA) of residential and commercial buildings | - | [176] | |||
| Block shape configuration | - | Spatial distribution of the buildings on plot/site, without consideration of orientation distribution | [274] | ||
| Urban structure | - | The spatial configuration of the buildings within the site considered orientation distribution Synonyms: street/block structure | [218,356] | ||
| Block layout | - | The layout of buildings within the plot | [157,202] | ||
| Orientation variance (OV) | - | Variation of the buildings’ orientations on site | [122] | ||
| The coverage ratio of the mid-to-high-rise building (CRMB) | - | - | [357] | ||
| Block length | - | - | [121,137,138,154,168,179,186,189,235,238,240,297,307,309,340,341,356,358] | ||
| Building floor area ratio (FAR) | - | Total building floor area to the site area/plot ratio Sum of gross floor area and total block area ratio The floor area ratio of all the buildings FAR_St | |||
| Floor area ratio of the towers (FARtow_St) | - | [240] | |||
| Floor area ratio of the podiums (FARpod_St) | - | [240] | |||
| Building surface area/site area (SAR_St) | - | The sum of exterior building surface area to total site area ratio. Acronyms: (COMP_St) | [240] | ||
| Wall facet area index (F) | - | The ratio of the wall facet area to the building footprint area (which contains the building and the road around it). | [355] | ||
| The standard deviation of building footprint area (StF) | - | - | [278] | ||
| Building mean shape index | - | - | [190] | ||
| Frontal area index (FAI) | - | The total area of wind exposition calculated on buildings and trees. | [123,359] | ||
| Compactness (Com) | - | Total building surface-to-volume ratio. | [278] | ||
| Mean volume of buildings (BV) | - | - | [297] | ||
| Mean volume of buildings per floor (BV/F) | - | - | [297] | ||
| The ratio of tree volume and building volume (VV2BV) | - | - | [297] | ||
| Perimeter–area ratio (FD) | - | Mean complexity of buildings. | [297] | ||
| Mean distance between buildings and their nearest neighbor (D2B) | - | - | [297] | ||
| Mean ratio of length and width of buildings LW (B) | - | - | [297] | ||
| Most extensive patch index for building (LPIBuild) | - | - | [190] | ||
| Mean outdoor distance (MOD) | - | Mean distance of outdoor space from the nearest building façade. | [278] | ||
| Building spacing | - | Distance between buildings. | [155] | ||
| Mean sky view factor (SVF) | - | Mean sky view factor for entire plot described as solar admittance factor (integrated measured). Synonyms: total site factor, tree view factor, terrain view factor, visible sky. Acronyms: (TSF), (TVF), (VS) | [146,150] | ||
| Enclosure degree (Ed) | - | The ratio of the sum of lengths of buildings’ facade in a plan to the perimeter of the enclosed block | [186] | ||
| Mean building height (BH) | - | Mean building height in a block, which represents the 3D roughness. Synonyms: average building height. Acronyms: (MH), (H), (m H_St), (Hbld), (Mbh), (MAH) | [97,122,124,138,184,186,234,236,238,240,256,257,263,297,298,299,338,345] | ||
| Urban surface roughness (USR) | - | Height variation of buildings within a block. The relative height difference of urban surface within a specific region. Building height variance (HV) | [122,126,137,240] | ||
| Height of roughness elements (HRE), | - | Height of buildings and trees | [346,347] | ||
| Average height to floor area ratio (HA) | - | Mean building height weighted by footprint area Synonyms: mean building height Acronyms: (MeH), (H/FA_St) | [151,240,278] | ||
| Average height to total floor area ratio of the street block | - | Mean building height weighted by total site area | [356] | ||
| Average height to the depth of the street block | - | - | [356] | ||
| The standard deviation of building height (StH) | - | Synonyms: mean architecture height standard deviation Acronyms: (AHSD) | [299,360] | ||
| Normalized height variance (NHV) | - | The ratio between the standard deviation of building height and the mean building height. It measures the relative height variance | [122] | ||
| Number of stories (L) | - | Indicates the average number of floors in an area | [125] | ||
| Elevation factor (EF) | - | Overall height of the elevation feature (building and trees) | [266] | ||
| Building average width (W) | - | - | [263] | ||
| Normalized number of buildings per block area (#B/A) | - | - | [297] | ||
| Open public space plot ratio | - | - | [255] | ||
| Road density (RD) | The ratio of traffic road surface area to a plot area Synonyms: road surface area density, road cover, road and parking aggregation, street network intensity, traffic space density, road area Acronyms: (RDS), (RND), (RSD), (ROAD%) | [54,137,143,161,176,189,255,311,312,361,362] | |||
| The average width of streets | - | - | [362] | ||
| Pavement area (pA) | - | - | [204] | ||
| Pavement mean shape index | - | - | [190] | ||
| Pavement patch density | - | - | [190] | ||
| Pavement edge density | - | - | [190] | ||
| Asphalt space ratio (Asr) | - | - | [186] | ||
| Impervious surfaces area (ISA) | - | The area covered by buildings/impervious surfaces and total block area ratio Synonyms: impermeable rate, Impervious surface fraction, impervious ground surface fraction Acronyms: (I), (ISF%), (IR) | [128,171,180,185,186,235,291,292,293,294,297,342,345,346,347,363,364,365,366,367] | ||
| Pervious surface fraction (ISC) | - | The permeable surface on the territorial surface ratio. Synonyms: the permeability ratio Acronyms: (NHRLC) | [128,234,345,346] | ||
| Size of the urban park or another heat sink | - | - | [356] | ||
| Waterbody ratio (W) | - | The ratio of water body area to total site/block area Synonyms: water surface ratio, water body percentage, water cover. Acronyms: (WBP), (Wr) | [133,146,186,237,294,306,349,350,353,368] | ||
| Bare soil cover ratio (S) | - | The area covered by bare soil and a total block area ratio. | [297] | ||
| Green cover ratio (GCR) | - | The designed area of all vegetation types and site area ratio or the vegetation leaf density to site area ratio. Synonyms: green plot ratio, greening rate, green cover ratio, greenspace ratio, green plot ratio, urban greenery plot ratio, planting rate, plant fraction, residential area green ratio, green area ratio, urban greenery ratio, vegetation fraction, vegetation coverage Acronyms: (Gcr), (Gsr), (GnPR), (GR), (PR), (GPR), (Pv), (GAR), (Fv) | [133,150,171,184,186,187,235,236,243,255,260,267,273,294,297,302,312,325,340,341,342,361,362,363,369] | ||
| Tree cover ratio (TCR) | Tree shading percentage to total site area Synonyms: canopy cover percentage, shade coverage, tree shade coverage | [133,184,260,267,340,363] | |||
| Grass cover ratio | - | [133] | |||
| Tree volume | - | - | [334] | ||
| Vegetation height (m) | - | - | [243] | ||
| The density of vegetation (LAI) | - | - | [356] | ||
| Morphological | Normalized difference vegetation index (NDVI) | - | Synonyms: transformed normalized difference vegetation index Acronyms: (TNDVI) | [142,149,161,170,237,293,343,370,371,372,373,374,375] | |
| Enhanced vegetation index (EVI), | - | - | [182] | ||
| Normalized difference water index (NDWI) | - | - | [170] | ||
| Normalized difference bare land index (NDBLI) | - | - | [170] | ||
| Soil humidity | - | Moisture availability | [133,376] | ||
| Imperviousness of material | - | - | [161] | ||
| Mean value of impervious surfaces (imp) | - | - | [289] | ||
| Surface evapotranspiration intensity | - | - | [195] | ||
| Material surface roughness | - | - | [176] | ||
| Urban porosity | - | - | [176] | ||
| Land cover | - | - | [364] | ||
| Land use | - | - | [290,340,347,361] | ||
| Function of space | - | - | [339] | ||
| Global urban albedo | - | Mean albedo of all surfaces within the site Synonyms: average urban albedo, urban equivalent albedo | [161,176,212,217,218,224,234] | ||
| Urban surface albedo (WAS) | - | The albedo of urban surface (road, pavement, building wall, building roof) Synonyms: reflectivity Acronyms: (SAL) | [124,153,180,182,186,214,215,220,221,229,233,247,335,346,362,363,377,378,379,380,381] | ||
| Horizontal surface albedo | Hemispherically and wavelength-integrated reflectivity of ground surfaces Synonyms: ground surface albedo Acronyms: (GSA) | [150,380,381] | |||
| Urban surface emissivity | - | - | [124,209,214,335] | ||
| Material heat capacity | - | - | [335] | ||
| Thermal effusivity of soil | - | - | [376] | ||
| Material thermal conductivity | - | - | [335] | ||
| Surface admittance (SAD) | - | [346] | |||
| Anthropogenic heat output (AHO) | - | - | [174,184,260,346] | ||
| Anthropogenic heat from traffic (w/m2) | - | [184,260] | |||
| Anthropogenic heat flux density | - | - | [347] | ||
| Population density (PD) | - | Synonyms: urban population Acronyms: (p), (POP) | [128,182,187,361,362,363,375] | ||
| Topographical | City radius | - | - | [184] | |
| Form and geometry of the city | - | Synonyms: city shape | [118,352] | ||
| Irregularity of the city | - | - | [362] | ||
| Building block orientation | - | - | [203,309] | ||
| Street grid orientation | - | - | [298] | ||
| Distance from the city center (CBD) | - | Distance between the center of districts and site Synonyms: distance to downtown Acronyms: (Dtd) | [186,189,336,350,351,382] | ||
| Distance from the city boundary (D) | - | - | [375] | ||
| Distance to a water body | - | - | [176,180] | ||
| Distance to green space | - | - | [176] | ||
| Distance to sea | - | - | [161] | ||
| Distance to industrials (Dti) | - | - | [186] | ||
| Distance to the major road | - | - | [192] | ||
| Location of the green open spaces | - | Within the city | [383] | ||
| Wind exposition | - | Amount of wind reaching building block (dependent of surroundings) Synonyms: wind velocity, ventilation rate | [203,260,342] | ||
| Street canyon | Geometrical | Canyon width (W) | - | Distance between neighboring building plots or between adjacent buildings (street width + building setback) | [119,120,124,136,170,242,250,251,252,256,270,335,348,384,385,386] |
| Canyon length (L) | - | - | [170,257,262] | ||
| Width to length ratio | - | - | [284] | ||
| Canyon height (H) | - | - | [251,252,384] | ||
| Length to height ratio | - | - | [277] | ||
| Aspect ratio | - | The ratio between the building height and the width of the distance between buildings Synonyms: canyon geometry factor, H/W aspect ratio, Height/width, canyon geometry, Acronyms: (cgf), (h/d) | [42,97,119,120,127,128,132,133,135,136,139,141,142,147,155,160,163,169,181,183,186,201,203,207,208,213,222,226,227,232,239,248,251,254,256,257,258,259,260,261,262,264,269,270,271,272,273,277,279,282,283,284,285,286,287,288,300,309,310,315,319,322,324,335,345,346,347,384,386,387,388,389,390,391,392,393,394,395,396,397,398,399] | ||
| The aspect ratio of square | - | [133] | |||
| The aspect ratio of the courtyard | - | [133] | |||
| Canyon asymmetricity (H1/H2) | - | Reflects whether the street is symmetrical concerning the central axis Synonyms: symmetry ratio, asymmetry ratio Acronyms: (Rsy), (Ra) | [131,276] | ||
| Opening ratio (Ro) | - | Represents the proportion of street opening length to the total length | [131] | ||
| Closing ratio (Rc) | - | Represents the proportion of the length of a street without openings to the total length | [131] | ||
| Smoothness ratio (Rs) | - | Represents the proportion of perimeter of the study area to the total line length of a street contour | [131] | ||
| Road and parking area | - | - | [311] | ||
| Road and parking shape | - | - | [311] | ||
| Building ratio | - | Building density along the canyon | [131,300] | ||
| Green ratio | - | Vegetation percentage | [269,288,300] | ||
| Trees’ canopy coverage area ratio | - | [288] | |||
| Street planting pattern | - | - | [254] | ||
| Street trees’ dimensions | - | - | [254] | ||
| Street plant canopy height | - | Synonyms: mean height of trees, vegetation height Acronyms: (TH), (VH) | [236,287,297] | ||
| Mean volume of trees (TV) | - | - | [297] | ||
| Sky view factor (SVF) | - | Fraction of the sky hemisphere which can be seen from a certain point in the urban model (on the ground or building facade) | [42,97,120,122,123,126,127,128,129,130,131,134,137,138,140,141,142,143,144,145,149,150,152,153,154,157,158,159,161,162,165,166,167,168,169,176,182,188,191,217,235,237,240,244,253,256,258,262,269,272,273,281,282,297,307,308,310,314,316,323,325,334,342,345,346,347,348,349,351,353,356,359,368,383,384,386,387,389,396,400,401,402,403,404,405,406,407,408,409,410,411,412] | ||
| Regular sky fraction (SVFall_Pt) | - | [240] | |||
| Sky fraction that is formed only by the surrounding buildings (SVFbld_Pt) | - | [240] | |||
| Morphological | Surface emissivity | - | - | [133,147,199,213,226,260,355] | |
| The material emissivity of road | - | [355] | |||
| Pavement surface emissivity | - | [133,199,213,260] | |||
| Material volumetric heat capacity | - | - | [133,147,199,226,260] | ||
| Pavement thermal capacity | Synonyms: pavement heat capacity | [133,147,199,226] | |||
| Material thermal conductivity | - | - | [147,198,199,226,260,413,414] | ||
| Pavement thermal conductivity | - | [147,198,199,226,413,414] | |||
| Pavement heat absorption | - | - | [199,413] | ||
| Material thermal diffusivity | - | - | [147] | ||
| Material thermal emittance | - | - | [148] | ||
| Retro-reflectivity of material | - | - | [319] | ||
| Material solar reflectance | - | - | [148,398] | ||
| Canyon albedo | - | Synonyms: street albedo, street surface albedo, net street albedo | [147,196,213,221,224,226,260,286,310,317,398] | ||
| Ground surface albedo | - | Synonyms: horizontal surface albedo | [132,133,166,183,184,188,193,219,222,223,224,227,228,233,318,359,377,378,379,405,415,416,417,418] | ||
| Pavement albedo | Synonyms: pavement reflectivity, pavement albedo | [133,183,193,194,219,224,228,415,416,417,418] | |||
| Road albedo | - | [184,318,377,378,379,405] | |||
| Parking lot albedo | - | [223] | |||
| Pavement Material color | - | - | [198] | ||
| Surface material type | - | Type of pavement materials, type of ground surface | [127,254,268,282,352] | ||
| Pavement material density | - | - | [206] | ||
| Material porosity | - | - | [206] | ||
| Pavement Permeability | - | - | [194] | ||
| Pavement water contain | - | - | [292] | ||
| Pavement Evaporation | - | - | [193] | ||
| Underlaying material diffusivity | - | - | [193] | ||
| Underlaying material effusivity | - | - | [193] | ||
| Type of heat transfer in material | - | (Unidirectional heat-transfer UHT) | [414] | ||
| Quantity of vegetation | - | - | [268] | ||
| Topographical | Street orientation | - | Synonyms: canyon axis orientation, alley orientation Acronyms: (Ao) | [119,120,127,132,166,169,186,196,202,203,218,222,225,250,251,252,253,254,257,259,261,262,269,271,272,276,279,281,282,283,284,285,319,322,324,348,362,386,389,390,393,394,404,408,415,418,419,420] | |
| Shadow factor | - | Related to street orientation Synonyms: shading percentage, sun exposure, solar exposure, solar access | [156,166,207,279,404] | ||
| Windexposure | - | Related to street orientation Synonyms and related parameters: wind speed, wind speed over a street | [227,276] | ||
| Building | Geometrical | Building area | - | - | [170] |
| Buildingheight (BH) | - | - | [119,120,121,123,126,128,129,130,134,136,139,152,157,164,166,170,171,172,178,188,191,217,242,243,244,245,248,263,265,267,268,270,275,276,283,287,301,302,303,306,308,326,339,340,349,351,353,362,385,387,394,404,421] | ||
| Building width | - | - | [335] | ||
| Buildinglength | - | Synonyms: facade length | [54,274] | ||
| Building depth | - | - | [242] | ||
| Building depth ratio | - | The ratio of building depth to frontal length Synonyms: horizontal building aspect ratio | [271,275] | ||
| Building roof-top area (BGFA) | - | Synonyms: building ground floor area | [237] | ||
| Total floor area | - | - | [150] | ||
| Mean area of all floors of a building (GFA) | - | Synonyms: gross floor area | [153,297] | ||
| Number of the floors | - | Synonyms: number of stories | [309,382] | ||
| Average floor height | - | - | [260] | ||
| Building setback | - | - | [358] | ||
| Roof widths | - | - | [422] | ||
| Building weighted volumetric compactness (Cv) | - | - | [146] | ||
| Mean compactness of the building (Cm) | - | The ratio of the building surface (Sb)and the cube surface (Sc) | [146] | ||
| Shape coefficient (SC) | - | The ratio between the external surfaces and the volume of the building Synonyms: surface/volume ratio, surface to volume ratio, shape factor, building facade Acronyms: (SVR), (SV) | [97,122,142,161,246,397] | ||
| Building perimeter to area ratio (PA) | - | - | [397] | ||
| Morphological | Building Material emissivity | - | Synonyms: surface emissivity | [147,167,232,260,355] | |
| The material emissivity of the rooftop | Synonyms: roof emissivity/insulation | [232,355] | |||
| The material emissivity of wall facet | Synonyms: the material emissivity of walls | [355] | |||
| Material Thermal diffusivity | - | - | [147] | ||
| Material thermal insulation (D) | - | - | [163,232] | ||
| Roof absorbance/insulation | - | [232] | |||
| Material thermal conductivity | - | - | [180,184,197,200,260] | ||
| Roof material thermal conductivity | - | [197] | |||
| Wall material thermal conductivity | - | [180,184] | |||
| Material volumetric heat capacity | - | Synonyms: material heat capacity/thermal storage | [147,180,184,200,207,226,260] | ||
| Wall volumetric heat capacity | Synonyms: wall material heat capacity | [180,184,226] | |||
| Thermal effusivity | - | - | [163] | ||
| Material Albedo | - | Material reflectance | [147,174,184,205,211,216,221,224,230,231,233,260,306,317,359,369,378,379,405,409,410] | ||
| Roof material albedo | Synonyms: roof solar reflectance | [174,184,197,211,216,224,230,231,232,233,306,359,369,378,379,405,422] | |||
| Wall material albedo | Synonyms: albedo of the facades | [184,197,205,210,216,225,228,233,288,318,359,377,378,405,423] | |||
| Roof Material phase | - | (Phase-change material PCM) | [173] | ||
| Construction types | - | - | [260] | ||
| Type of Surface material | - | - | [180,184,282,318,352] | ||
| Type of materials used on the facade of the buildings | (brick/veneer, frame/concrete Block, open steel skeleton, and wood frame, stucco, masonry bearing, brick masonry) Synonyms: building wall material type, wall layers material | [180,184,318,352] | |||
| Wall thickness | - | - | [184,260,424] | ||
| Façade glazing ratio | - | The ratio of glass area and external wall area, describing heat loss from a building | [163,260,356] | ||
| HVAC system presence | - | - | [177] | ||
| Type of HVAC system | - | [177] | |||
| The heat released to the canyon from the HVAC system | - | - | [184] | ||
| The efficiency of HVAC systems | - | - | [260] | ||
| Building cooling set point | - | The agreed temperature that the building will meet | [184] | ||
| Infiltration rates | - | The number of interior volume air changes that occur per hour | [260] | ||
| Internal heat gains | - | generated by the activity of occupants as metabolic heat, by utilization of electrical devices, or other thermal emissions | [260] | ||
| Topographical | Building orientation (O) | - | Variation between the primary longitudinal angle of a building footprint and the north Acronyms: (BO) | [54,97,155,205,226,246,280,383,397,425] | |
| Facade orientation | - | [205,280,425] | |||
| Building shadow area ratio (BS) | - | The ratio of the building shadow area to the unit horizontal area, dependent on surroundings Synonyms: building shadow, solar exposure, area of the shadow cast on building surfaces, Percentage of shade on building Acronyms: (BS), (ASV) | [123,156,166,397] | ||
| Obstruction angle (θ) | - | The obstruction angle parameters reflect the urban canyon geometry surrounding the corresponding building, and they were calculated using the obstruction height and street width | [246] | ||
| Obstruction angle on the facade (θf) | [246] | ||||
| Obstruction angle on the roof (θr) | [246] |
References
- Gonzalez-Trevizo, M.E.; Martinez-Torres, K.E.; Armendariz-Lopez, J.F.; Santamouris, M.; Bojorquez-Morales, G.; Luna-Leon, A. Research Trends on Environmental, Energy and Vulnerability Impacts of Urban Heat Islands: An Overview. Energy Build. 2021, 246, 111051. [Google Scholar] [CrossRef]
- Martin, P.; Baudouin, Y.; Gachon, P. An Alternative Method to Characterize the Surface Urban Heat Island. Int. J. Biometeorol. 2015, 59, 849–861. [Google Scholar] [CrossRef] [PubMed]
- Lontorfos, V.; Efthymiou, C.; Santamouris, M. On the Time Varying Mitigation Performance of Reflective Geoengineering Technologies in Cities. Renew. Energy 2018, 115, 926–930. [Google Scholar] [CrossRef]
- Oke, T.R.; Johnson, G.T.; Steyn, D.G.; Watson, I.D. Simulation of Surface Urban Heat Islands under ‘Ideal’ Conditions at Night Part 2: Diagnosis of Causation. Bound. Layer Meteorol. 1991, 56, 339–358. [Google Scholar] [CrossRef]
- Parsaee, M.; Joybari, M.M.; Mirzaei, P.A.; Haghighat, F. Urban Heat Island, Urban Climate Maps and Urban Development Policies and Action Plans. Environ. Technol. Innov. 2019, 14, 100341. [Google Scholar] [CrossRef]
- Sachindra, D.A.; Ng, A.W.M.; Muthukumaran, S.; Perera, B.J.C. Impact of Climate Change on Urban Heat Island Effect and Extreme Temperatures: A Case-Study. Q. J. R. Meteorol. Soc. 2016, 142, 172–186. [Google Scholar] [CrossRef]
- Sharifi, E.; Sivam, A.; Boland, J. Resilience to Heat in Public Space: A Case Study of Adelaide, South Australia. J. Environ. Plan. Manag. 2016, 59, 1833–1854. [Google Scholar] [CrossRef]
- Zhao, L.; Lee, X.; Smith, R.B.; Oleson, K. Strong Contributions of Local Background Climate to Urban Heat Islands. Nature 2014, 511, 216–219. [Google Scholar] [CrossRef]
- Oke, T.R. The Energetic Basis of the Urban Heat Island. Q. J. R. Meteorol. Soc. 1982, 108, 1–24. [Google Scholar] [CrossRef]
- Oke, T.R.; Maxwell, G.B. Urban Heat Island Dynamics in Montreal and Vancouver. Atmos. Environ. 1975, 9, 191–200. [Google Scholar] [CrossRef]
- Easterling, D.; Horton, B.; Jones, P.; Peterson, T.; Karl, T.R.; Parker, D.; Salinger, M.; Razuvayev, V.; Plummer, N.; Jamason, P.; et al. Maximum and Minimum Temperature Trends for the Globe. Science 1997, 277, 364–367. [Google Scholar] [CrossRef] [Green Version]
- Karl, T.R.; Jones, P.D.; Knight, R.W.; Kukla, G.; Plummer, N.; Razuvayev, V.; Gallo, K.P.; Lindseay, J.; Charlson, R.J.; Peterson, T.C. A New Perspective on Recent Global Warming: Asymmetric Trends of Daily Maximum and Minimum Temperature. Bull. Am. Meteorol. Soc. 1993, 74, 1007–1024. [Google Scholar] [CrossRef] [Green Version]
- Kwak, Y.; Park, C.; Deal, B. Discerning the Success of Sustainable Planning: A Comparative Analysis of Urban Heat Island Dynamics in Korean New Towns. Sustain. Cities Soc. 2020, 61, 102341. [Google Scholar] [CrossRef]
- Grimmond, C.S.B.; Oke, T.R. An Evapotranspiration-Interception Model for Urban Areas. Water Resour. Res. 1991, 27, 1739–1755. [Google Scholar] [CrossRef]
- Taha, H. Urban Climates and Heat Islands: Albedo, Evapotranspiration, and Anthropogenic Heat. Energy Build. 1997, 25, 99–103. [Google Scholar] [CrossRef] [Green Version]
- Mitchell, V.G.; Mein, R.G.; McMahon, T.A. Modelling the Urban Water Cycle. Environ. Model. Softw. 2001, 16, 615–629. [Google Scholar] [CrossRef]
- Peron, F.; Maria, M.M.D.; Spinazzè, F.; Mazzali, U. An Analysis of the Urban Heat Island of Venice Mainland. Sustain. Cities Soc. 2015, 19, 300–309. [Google Scholar] [CrossRef]
- Kolokotroni, M.; Ren, X.; Davies, M.; Mavrogianni, A. London’s Urban Heat Island: Impact on Current and Future Energy Consumption in Office Buildings. Energy Build. 2012, 47, 302–311. [Google Scholar] [CrossRef] [Green Version]
- Santamouris, M. Cooling the Buildings—Past, Present and Future. Energy Build. 2016, 128, 617–638. [Google Scholar] [CrossRef]
- Salazar, A.; Baldi, G.; Hirota, M.; Syktus, J.; McAlpine, C. Land Use and Land Cover Change Impacts on the Regional Climate of Non-Amazonian South America: A Review. Glob. Planet. Change 2015, 128, 103–119. [Google Scholar] [CrossRef]
- Shiflett, S.A.; Liang, L.L.; Crum, S.M.; Feyisa, G.L.; Wang, J.; Jenerette, G.D. Variation in the Urban Vegetation, Surface Temperature, Air Temperature Nexus. Sci. Total Environ. 2017, 579, 495–505. [Google Scholar] [CrossRef] [PubMed]
- Norton, B.A.; Coutts, A.M.; Livesley, S.J.; Harris, R.J.; Hunter, A.M.; Williams, N.S.G. Planning for Cooler Cities: A Framework to Prioritise Green Infrastructure to Mitigate High Temperatures in Urban Landscapes. Landsc. Urban Plan. 2015, 134, 127–138. [Google Scholar] [CrossRef]
- Santamouris, M. Analyzing the Heat Island Magnitude and Characteristics in One Hundred Asian and Australian Cities and Regions. Sci. Total Environ. 2015, 512–513, 582–598. [Google Scholar] [CrossRef] [PubMed]
- Santamouris, M. Innovating to Zero the Building Sector in Europe: Minimising the Energy Consumption, Eradication of the Energy Poverty and Mitigating the Local Climate Change. Sol. Energy 2016, 128, 61–94. [Google Scholar] [CrossRef]
- Taleb, D.; Abu-Hijleh, B. Urban Heat Islands: Potential Effect of Organic and Structured Urban Configurations on Temperature Variations in Dubai, UAE. Renew. Energy 2013, 50, 747–762. [Google Scholar] [CrossRef]
- Shahrestani, M.; Yao, R.; Luo, Z.; Turkbeyler, E.; Davies, H. A Field Study of Urban Microclimates in London. Renew. Energy 2015, 73, 3–9. [Google Scholar] [CrossRef] [Green Version]
- Arnfield, A.J. Two Decades of Urban Climate Research: A Review of Turbulence, Exchanges of Energy and Water, and the Urban Heat Island. Int. J. Climatol. 2003, 23, 1–26. [Google Scholar] [CrossRef]
- Mirzaei, P.A.; Haghighat, F. Approaches to Study Urban Heat Island – Abilities and Limitations. Build. Environ. 2010, 45, 2192–2201. [Google Scholar] [CrossRef]
- Oke, T.R. Boundary Layer Climates, 2nd ed.; Routledge: London, UK, 1987; ISBN 978-0-203-40721-9. [Google Scholar]
- Wong, K.V.; Paddon, A.; Jimenez, A. Review of World Urban Heat Islands: Many Linked to Increased Mortality. J. Energy Resour. Technol. 2013, 135, 022101. [Google Scholar] [CrossRef]
- Rizwan, A.M.; Dennis, L.Y.C.; Liu, C. A Review on the Generation, Determination and Mitigation of Urban Heat Island. J. Environ. Sci. 2008, 20, 120–128. [Google Scholar] [CrossRef]
- Santamouris, M.; Mihalakakou, G.; Papanikolaou, N.; Asimakopoulos, D.N. A Neural Network Approach for Modeling the Heat Island Phenomenon in Urban Areas during the Summer Period. Geophys. Res. Lett. 1999, 26, 337–340. [Google Scholar] [CrossRef]
- Santamouris, M.; Kolokotsa, D. Urban Climate Mitigation Techniques; Routledge: London, UK, 2016; ISBN 978-1-315-76583-9. [Google Scholar]
- Santamouris, M. Cooling the Cities—A Review of Reflective and Green Roof Mitigation Technologies to Fight Heat Island and Improve Comfort in Urban Environments. Sol. Energy 2014, 103, 682–703. [Google Scholar] [CrossRef]
- Rajagopalan, P.; Lim, K.C.; Jamei, E. Urban Heat Island and Wind Flow Characteristics of a Tropical City. Sol. Energy 2014, 107, 159–170. [Google Scholar] [CrossRef]
- Lauwaet, D.; De Ridder, K.; Saeed, S.; Brisson, E.; Chatterjee, F.; van Lipzig, N.P.M.; Maiheu, B.; Hooyberghs, H. Assessing the Current and Future Urban Heat Island of Brussels. Urban Clim. 2016, 15, 1–15. [Google Scholar] [CrossRef] [Green Version]
- Lehmann, S. Low Carbon Districts: Mitigating the Urban Heat Island with Green Roof Infrastructure. City Cult. Soc. 2014, 5, 1–8. [Google Scholar] [CrossRef]
- Coseo, P.; Larsen, L. How Factors of Land Use/Land Cover, Building Configuration, and Adjacent Heat Sources and Sinks Explain Urban Heat Islands in Chicago. Landsc. Plan. 2014, 125, 117–129. [Google Scholar] [CrossRef]
- Nakata-Osaki, C.M.; Souza, L.C.L.; Rodrigues, D.S. THIS—Tool for Heat Island Simulation: A GIS Extension Model to Calculate Urban Heat Island Intensity Based on Urban Geometry. Comput. Environ. Urban Syst. 2018, 67, 157–168. [Google Scholar] [CrossRef]
- Santamouris, M. Minimizing Energy Consumption, Energy Poverty and Global and Local Climate Change in the Built Environment: Innovating to Zero. Causalities and Impacts in a Zero Concept World; Elsevier: Amsterdam, The Netherlands, 2019; ISBN 978-0-12-811417-9. [Google Scholar] [CrossRef]
- Erell, E.; Pearlmutter, D.; Boneh, D.; Kutiel, P.B. Effect of High-Albedo Materials on Pedestrian Heat Stress in Urban Street Canyons. Urban Clim. 2014, 10, 367–386. [Google Scholar] [CrossRef]
- Zakhour, S. The Impact of Urban Geometry on Outdoor Thermal Comfort Conditions in Hot-Arid Region. J. Civ. Eng. Archit. Res. 2015, 2, 862–875. [Google Scholar]
- Oke, T.R. Street Design and Urban Canopy Layer Climate. Energy Build. 1988, 11, 103–113. [Google Scholar] [CrossRef]
- Wang, Y.; Li, Y.; Xue, Y.; Martilli, A.; Shen, J.; Chan, P.W. City-Scale Morphological Influence on Diurnal Urban Air Temperature. Build. Environ. 2020, 169, 106527. [Google Scholar] [CrossRef]
- Papadopoulos, A.M. The Influence of Street Canyons on the Cooling Loads of Buildings and the Performance of Air Conditioning Systems. Energy Build. 2001, 33, 601–607. [Google Scholar] [CrossRef]
- Britter, R.E.; Hanna, S.R. Flow and Dispersion in Urban Areas. Annu. Rev. Fluid Mech. 2003, 35, 469–496. [Google Scholar] [CrossRef]
- Muniz-Gäal, L.P.; Pezzuto, C.C.; Carvalho, M.F.H.; de Mota, L.T.M. Urban Geometry and the Microclimate of Street Canyons in Tropical Climate. Build. Environ. 2020, 169, 106547. [Google Scholar] [CrossRef]
- Kantzioura, A.; Kosmopoulos, P.; Zoras, S. Urban Surface Temperature and Microclimate Measurements in Thessaloniki. Energy Build. 2012, 44, 63–72. [Google Scholar] [CrossRef]
- Terjung, W.H.; Louie, S.S.-F. Solar Radiation and Urban Heat Islands. Ann. Assoc. Am. Geogr. 1973, 63, 181–207. [Google Scholar] [CrossRef]
- Jamei, E.; Rajagopalan, P.; Seyedmahmoudian, M.; Jamei, Y. Review on the Impact of Urban Geometry and Pedestrian Level Greening on Outdoor Thermal Comfort. Renew. Sustain. Energy Rev. 2016, 54, 1002–1017. [Google Scholar] [CrossRef]
- Oke, T.R. Canyon Geometry and the Nocturnal Urban Heat Island: Comparison of Scale Model and Field Observations. J. Climatol. 1981, 1, 237–254. [Google Scholar] [CrossRef]
- Yang, X.; Li, Y.; Luo, Z.; Chan, P.W. The Urban Cool Island Phenomenon in a High-Rise High-Density City and Its Mechanisms. Int. J. Climatol. 2017, 37, 890–904. [Google Scholar] [CrossRef]
- Masson, V. A Physically-Based Scheme For The Urban Energy Budget In Atmospheric Models. Bound. Layer Meteorol. 2000, 94, 357–397. [Google Scholar] [CrossRef]
- Yang, S.; Zhou, D.; Wang, Y.; Li, P. Comparing Impact of Multi-Factor Planning Layouts in Residential Areas on Summer Thermal Comfort Based on Orthogonal Design of Experiments (ODOE). Build. Environ. 2020, 182, 107145. [Google Scholar] [CrossRef]
- Lee, D.O. Urban—Rural Humidity Differences in London. Int. J. Climatol. 1991, 11, 577–582. [Google Scholar] [CrossRef]
- Livesley, S.J.; McPherson, E.G.; Calfapietra, C. The Urban Forest and Ecosystem Services: Impacts on Urban Water, Heat, and Pollution Cycles at the Tree, Street, and City Scale. J. Environ. Qual. 2016, 45, 119–124. [Google Scholar] [CrossRef]
- Sailor, D.J.; Fan, H. Modeling the Diurnal Variability of Effective Albedo for Cities. Atmos. Environ. 2002, 36, 713–725. [Google Scholar] [CrossRef]
- Santamouris, M. Regulating the Damaged Thermostat of the Cities—Status, Impacts and Mitigation Challenges. Energy Build. 2015, 91, 43–56. [Google Scholar] [CrossRef]
- Sarrat, C.; Lemonsu, A.; Masson, V.; Guedalia, D. Impact of Urban Heat Island on Regional Atmospheric Pollution. Atmos. Environ. 2006, 40, 1743–1758. [Google Scholar] [CrossRef]
- Agarwal, M.; Tandon, A. Modeling of the Urban Heat Island in the Form of Mesoscale Wind and of Its Effect on Air Pollution Dispersal. Appl. Math. Model. 2010, 34, 2520–2530. [Google Scholar] [CrossRef]
- Krüger, E.L.; Minella, F.O.; Rasia, F. Impact of Urban Geometry on Outdoor Thermal Comfort and Air Quality from Field Measurements in Curitiba, Brazil. Build. Environ. 2011, 46, 621–634. [Google Scholar] [CrossRef]
- Fahed, J.; Kinab, E.; Ginestet, S.; Adolphe, L. Impact of Urban Heat Island Mitigation Measures on Microclimate and Pedestrian Comfort in a Dense Urban District of Lebanon. Sustain. Cities Soc. 2020, 61, 102375. [Google Scholar] [CrossRef]
- Rosso, F.; Pisello, A.L.; Cotana, F.; Ferrero, M. On the Thermal and Visual Pedestrians’ Perception about Cool Natural Stones for Urban Paving: A Field Survey in Summer Conditions. Build. Environ. 2016, 107, 198–214. [Google Scholar] [CrossRef]
- Taleghani, M. Outdoor Thermal Comfort by Different Heat Mitigation Strategies—A Review. Renew. Sustain. Energy Rev. 2018, 81, 2011–2018. [Google Scholar] [CrossRef]
- Iping, A.; Kidston-Lattari, J.; Simpson-Young, A.; Duncan, E.; McManus, P. (Re)Presenting Urban Heat Islands in Australian Cities: A Study of Media Reporting and Implications for Urban Heat and Climate Change Debates. Urban Clim. 2019, 27, 420–429. [Google Scholar] [CrossRef]
- O’Malley, C.; Piroozfar, P.; Farr, E.R.P.; Pomponi, F. Urban Heat Island (UHI) Mitigating Strategies: A Case-Based Comparative Analysis. Sustain. Cities Soc. 2015, 19, 222–235. [Google Scholar] [CrossRef] [Green Version]
- Gabriel, K.M.A.; Endlicher, W.R. Urban and Rural Mortality Rates during Heat Waves in Berlin and Brandenburg, Germany. Environ. Pollut. 2011, 159, 2044–2050. [Google Scholar] [CrossRef] [PubMed]
- Rydin, Y.; Bleahu, A.; Davies, M.; Dávila, J.D.; Friel, S.; De Grandis, G.; Groce, N.; Hallal, P.C.; Hamilton, I.; Howden-Chapman, P.; et al. Shaping Cities for Health: Complexity and the Planning of Urban Environments in the 21st Century. Lancet 2012, 379, 2079–2108. [Google Scholar] [CrossRef] [Green Version]
- McMichael, A.J.; Haines, J.A.; Slooff, R.; Sari Kovats, R.; World Health Organization. Climate Change and Human Health: An Assessment; World Health Organization: Geneva, Switzerland, 1996. [Google Scholar]
- Meehl, G.A.; Tebaldi, C. More Intense, More Frequent, and Longer Lasting Heat Waves in the 21st Century. Science 2004, 305, 994–997. [Google Scholar] [CrossRef] [Green Version]
- Pascal, M.; Laaidi, K.; Ledrans, M.; Baffert, E.; Caserio-Schönemann, C.; Le Tertre, A.; Manach, J.; Medina, S.; Rudant, J.; Empereur-Bissonnet, P. France’s Heat Health Watch Warning System. Int. J. Biometeorol. 2006, 50, 144–153. [Google Scholar] [CrossRef]
- Augusto, B.; Roebeling, P.; Rafael, S.; Ferreira, J.; Ascenso, A.; Bodilis, C. Short and Medium- to Long-Term Impacts of Nature-Based Solutions on Urban Heat. Sustain. Cities Soc. 2020, 57, 102122. [Google Scholar] [CrossRef]
- Founda, D.; Santamouris, M. Synergies between Urban Heat Island and Heat Waves in Athens (Greece), during an Extremely Hot Summer (2012). Sci. Rep. 2017, 7, 10973. [Google Scholar] [CrossRef] [Green Version]
- Boyko, C.T.; Cooper, R. Clarifying and Re-Conceptualising Density. Prog. Plan. 2011, 76, 1–61. [Google Scholar] [CrossRef]
- Chokhachian, A.; Perini, K.; Giulini, S.; Auer, T. Urban Performance and Density: Generative Study on Interdependencies of Urban Form and Environmental Measures. Sustain. Cities Soc. 2020, 53, 101952. [Google Scholar] [CrossRef]
- Aflaki, A.; Mirnezhad, M.; Ghaffarianhoseini, A.; Ghaffarianhoseini, A.; Omrany, H.; Wang, Z.-H.; Akbari, H. Urban Heat Island Mitigation Strategies: A State-of-the-Art Review on Kuala Lumpur, Singapore and Hong Kong. Cities 2017, 62, 131–145. [Google Scholar] [CrossRef] [Green Version]
- Akbari, H.; Cartalis, C.; Kolokotsa, D.; Muscio, A.; Pisello, A.L.; Rossi, F.; Santamouris, M.; Synnefa, A.; Wong, N.H.; Zinzi, M. Local Climate Change and Urban Heat Island Mitigation Techniques—The State of the Art. J. Civ. Eng. Manag. 2016, 22, 1–16. [Google Scholar] [CrossRef] [Green Version]
- Alchapar, N.L.; Correa, E.N. The Use of Reflective Materials as a Strategy for Urban Cooling in an Arid “OASIS” City. Sustain. Cities Soc. 2016, 27, 1–14. [Google Scholar] [CrossRef]
- Barakat, A.; Ayad, H.; El-Sayed, Z. Urban Design in Favor of Human Thermal Comfort for Hot Arid Climate Using Advanced Simulation Methods. Alex. Eng. J. 2017, 56, 533–543. [Google Scholar] [CrossRef]
- Huang, Q.; Meng, X.; Yang, X.; Jin, L.; Liu, X.; Hu, W. The Ecological City: Considering Outdoor Thermal Environment. Energy Procedia 2016, 104, 177–182. [Google Scholar] [CrossRef]
- Stone, B., Jr.; Vargo, J.; Liu, P.; Habeeb, D.; DeLucia, A.; Trail, M.; Hu, Y.; Russell, A. Avoided Heat-Related Mortality through Climate Adaptation Strategies in Three US Cities. PLoS ONE 2014, 9, e100852. [Google Scholar] [CrossRef] [Green Version]
- Leal Filho, W.; Echevarria Icaza, L.; Emanche, V.O.; Quasem Al-Amin, A. An Evidence-Based Review of Impacts, Strategies and Tools to Mitigate Urban Heat Islands. Int. J. Environ. Res. Public Health 2017, 14, 1600. [Google Scholar] [CrossRef] [Green Version]
- Morakinyo, T.E.; Dahanayake, K.W.D.K.C.; Ng, E.; Chow, C.L. Temperature and Cooling Demand Reduction by Green-Roof Types in Different Climates and Urban Densities: A Co-Simulation Parametric Study. Energy Build. 2017, 145, 226–237. [Google Scholar] [CrossRef]
- Paramita, B.; Fukuda, H. Study on the Affect of Aspect Building Form and Layout Case Study: Honjo Nishi Danchi, Yahatanishi, Kitakyushu-Fukuoka. Procedia Environ. Sci. 2013, 17, 767–774. [Google Scholar] [CrossRef] [Green Version]
- Phelan, P.E.; Kaloush, K.; Miner, M.; Golden, J.; Phelan, B.; Silva, H.; Taylor, R.A. Urban Heat Island: Mechanisms, Implications, and Possible Remedies. Annu. Rev. Environ. Resour. 2015, 40, 285–307. [Google Scholar] [CrossRef]
- Salata, F.; Golasi, I.; de Lieto Vollaro, R.; de Lieto Vollaro, A. Urban Microclimate and Outdoor Thermal Comfort. A Proper Procedure to Fit ENVI-Met Simulation Outputs to Experimental Data. Sustain. Cities Soc. 2016, 26, 318–343. [Google Scholar] [CrossRef]
- Tsilini, V.; Papantoniou, S.; Kolokotsa, D.-D.; Maria, E.-A. Urban Gardens as a Solution to Energy Poverty and Urban Heat Island. Sustain. Cities Soc. 2015, 14, 323–333. [Google Scholar] [CrossRef]
- Yin, S.; Xiao, Y. Scale Study of Traditional Shophouse Street in South of China Based on Outdoor Thermal Comfort. Procedia Eng. 2016, 169, 232–239. [Google Scholar] [CrossRef]
- Cole, R.J. Regenerative Design and Development: Current Theory and Practice. Build. Res. Inf. 2012, 40, 1–6. [Google Scholar] [CrossRef]
- Sadri, H.; Zeybekoglu, S. Deurbanization and the Right to the Deurbanized City. ANDULI Rev. Andal. Cienc. Soc. 2018, 17, 205–219. [Google Scholar] [CrossRef]
- Lin, B.B.; Meyers, J.; Beaty, R.M.; Barnett, G.B. Urban Green Infrastructure Impacts on Climate Regulation Services in Sydney, Australia. Sustainability 2016, 8, 788. [Google Scholar] [CrossRef] [Green Version]
- Antoszewski, P.; Świerk, D.; Krzyżaniak, M. Statistical Review of Quality Parameters of Blue-Green Infrastructure Elements Important in Mitigating the Effect of the Urban Heat Island in the Temperate Climate (C) Zone. Int. J. Environ. Res. Public Health 2020, 17, 7093. [Google Scholar] [CrossRef]
- Shafaghat, A.; Manteghi, G.; Keyvanfar, A.; Lamit, H.; Saito, K.; Ossen, D. Street Geometry Factors Influence Urban Microclimate in Tropical Coastal Cities: A Review. Environ. Clim. Technol. 2016, 17, 61–75. [Google Scholar] [CrossRef] [Green Version]
- Jamei, E.; Ossen, D.R.; Seyedmahmoudian, M.; Sandanayake, M.; Stojcevski, A.; Horan, B. Urban Design Parameters for Heat Mitigation in Tropics. Renew. Sustain. Energy Rev. 2020, 134, 110362. [Google Scholar] [CrossRef]
- Shishegar, N. Street Design and Urban Microclimate: Analyzing the Effects of Street Geometry and Orientation on Airflow and Solar Access in Urban Canyons. J. Clean Energy Technol. 2013, 1, 52. [Google Scholar] [CrossRef]
- Lin, P.; Gou, Z.; Lau, S.S.-Y.; Qin, H. The Impact of Urban Design Descriptors on Outdoor Thermal Environment: A Literature Review. Energies 2017, 10, 2151. [Google Scholar] [CrossRef] [Green Version]
- Natanian, J.; Aleksandrowicz, O.; Auer, T. A Parametric Approach to Optimizing Urban Form, Energy Balance and Environmental Quality: The Case of Mediterranean Districts. Appl. Energy 2019, 254, 113637. [Google Scholar] [CrossRef]
- Sanaieian, H.; Tenpierik, M.; Linden, K.; van den Mehdizadeh Seraj, F.; Mofidi Shemrani, S.M. Review of the Impact of Urban Block Form on Thermal Performance, Solar Access and Ventilation. Renew. Sustain. Energy Rev. 2014, 38, 551–560. [Google Scholar] [CrossRef]
- Lee, Y.; Kelundapyan, R.; Hanipah, H.; Abdullah, A.H. A Review on Outdoor Thermal Comfort Evaluation for Building Arrangement Parameters. In Sustainable Construction and Building Technology: Total Quality Management (TQM) in Industrialized Building System (IBS); Nor, H.A., Nur, N.A.S., Shahiron, S., Eds.; Penerbit UTHM: Parit Raja, Malaysia, 2017; pp. 1–14. ISBN 978-967-0764-86-3. [Google Scholar]
- Lee, Y.; Fadhil, M.; Mohanadoss, P.; Zainon Noor, Z.; Iwao, K.; Chelliapan, S. Overview of urban heat island (UHI) phenomenon towards human thermal comfort. Environ. Eng. Manag. J. 2014, 16, 2097–2111. [Google Scholar] [CrossRef]
- Li, J.; Donn, M. The Influence of Building Height Variability on Natural Ventilation and Neighbor Buildings in Dense Urban Areas. In Proceedings of the Building Simulation; Barnaby, C.S., Wetter, M., Eds.; International Building Performance Simulation Association: Shanghai, China, 2017; pp. 2805–2813. ISBN 978-1-7750520-0-5. [Google Scholar]
- Shahmohamadi, P.; Che-Ani, A.I.; Ramly, A.; Maulud, K.N.A.; Mohd-Nor, M.F.I. Reducing Urban Heat Island Effects: A Systematic Review to Achieve Energy Consumption Balance. Int. J. Phys. Sci. 2010, 5, 626–636. [Google Scholar] [CrossRef]
- Cheela, V.R.S.; John, M.; Biswas, W.; Sarker, P. Combating Urban Heat Island Effect—A Review of Reflective Pavements and Tree Shading Strategies. Buildings 2021, 11, 93. [Google Scholar] [CrossRef]
- Aletba, S.R.O.; Abdul Hassan, N.; Putra Jaya, R.; Aminudin, E.; Mahmud, M.Z.H.; Mohamed, A.; Hussein, A.A. Thermal Performance of Cooling Strategies for Asphalt Pavement: A State-of-the-Art Review. J. Traffic Transp. Eng. 2021, 8, 356–373. [Google Scholar] [CrossRef]
- Vujovic, S.; Haddad, B.; Karaky, H.; Sebaibi, N.; Boutouil, M. Urban Heat Island: Causes, Consequences, and Mitigation Measures with Emphasis on Reflective and Permeable Pavements. CivilEng 2021, 2, 26. [Google Scholar] [CrossRef]
- Wang, C.; Wang, Z.-H.; Kaloush, K.E.; Shacat, J. Cool Pavements for Urban Heat Island Mitigation: A Synthetic Review. Renew. Sustain. Energy Rev. 2021, 146, 111171. [Google Scholar] [CrossRef]
- Al-Humairi, S.F.I.; Alias, A.H.; Haron, N.A.; Hassim, S.; Jakarni, F.M. Sustainable Pavement: A Review on the Usage of Pavement as a Mitigation Strategy for UHI. IOP Conf. Ser. Mater. Sci. Eng. 2021, 1075, 012010. [Google Scholar] [CrossRef]
- Baruti, M.M.; Johansson, E.; Åstrand, J. Review of Studies on Outdoor Thermal Comfort in Warm Humid Climates: Challenges of Informal Urban Fabric. Int. J. Biometeorol. 2019, 63, 1449–1462. [Google Scholar] [CrossRef] [Green Version]
- Kolokotsa, D.; Santamouris, M.; Zerefos, S.C. Green and Cool Roofs’ Urban Heat Island Mitigation Potential in European Climates for Office Buildings under Free Floating Conditions. Sol. Energy 2013, 95, 118–130. [Google Scholar] [CrossRef]
- Yu, Z.; Yang, G.; Zuo, S.; Jørgensen, G.; Koga, M.; Vejre, H. Critical Review on the Cooling Effect of Urban Blue-Green Space: A Threshold-Size Perspective. Urban For. Urban Green. 2020, 49, 126630. [Google Scholar] [CrossRef]
- Pérez, G.; Coma, J.; Martorell, I.; Cabeza, L.F. Vertical Greenery Systems (VGS) for Energy Saving in Buildings: A Review. Renew. Sustain. Energy Rev. 2014, 39, 139–165. [Google Scholar] [CrossRef] [Green Version]
- Manoli, G.; Fatichi, S.; Schläpfer, M.; Yu, K.; Crowther, T.W.; Meili, N.; Burlando, P.; Katul, G.G.; Bou-Zeid, E. Magnitude of Urban Heat Islands Largely Explained by Climate and Population. Nature 2019, 573, 55–60. [Google Scholar] [CrossRef]
- World Development Indicators. Data Catalog. Available online: https://datacatalog.worldbank.org/search/dataset/0037712 (accessed on 19 February 2022).
- VISAT (Urban TEP). Available online: https://urban-tep.eu/puma/tool/?id=567873922 (accessed on 19 February 2022).
- Pullin, A.S.; Stewart, G.B. Guidelines for Systematic Review in Conservation and Environmental Management. Conserv. Biol. 2006, 20, 1647–1656. [Google Scholar] [CrossRef]
- Stewart, I.D. A Systematic Review and Scientific Critique of Methodology in Modern Urban Heat Island Literature. Int. J. Climatol. 2011, 31, 200–217. [Google Scholar] [CrossRef]
- Rubel, F.; Brugger, K.; Haslinger, K.; Auer, I. The Climate of the European Alps: Shift of Very High Resolution Köppen-Geiger Climate Zones 1800–2100. Metz 2017, 26, 115–125. [Google Scholar] [CrossRef]
- Li, Y.; Schubert, S.; Kropp, J.P.; Rybski, D. On the Influence of Density and Morphology on the Urban Heat Island Intensity. Nat. Commun. 2020, 11, 2647. [Google Scholar] [CrossRef]
- Lau, K.K.-L.; Lindberg, F.; Rayner, D.; Thorsson, S. The Effect of Urban Geometry on Mean Radiant Temperature under Future Climate Change: A Study of Three European Cities. Int. J. Biometeorol. 2015, 59, 799–814. [Google Scholar] [CrossRef] [PubMed]
- Carrasco, C.; Palme, M. Urban Form and Urban Materials as Controller of Urban Climate in Valparaiso, Chile. IOP Conf. Ser. Earth Environ. Sci. 2020, 503, 012049. [Google Scholar] [CrossRef]
- Lan, Y.; Zhan, Q. How Do Urban Buildings Impact Summer Air Temperature? The Effects of Building Configurations in Space and Time. Build. Environ. 2017, 125, 88–98. [Google Scholar] [CrossRef]
- Huang, X.; Wang, Y. Investigating the Effects of 3D Urban Morphology on the Surface Urban Heat Island Effect in Urban Functional Zones by Using High-Resolution Remote Sensing Data: A Case Study of Wuhan, Central China. ISPRS J. Photogramm. Remote Sens. 2019, 152, 119–131. [Google Scholar] [CrossRef]
- Li, H.; Li, Y.; Wang, T.; Wang, Z.; Gao, M.; Shen, H. Quantifying 3D Building Form Effects on Urban Land Surface Temperature and Modeling Seasonal Correlation Patterns. Build. Environ. 2021, 204, 108132. [Google Scholar] [CrossRef]
- Giannaros, C.; Nenes, A.; Giannaros, T.M.; Kourtidis, K.; Melas, D. A Comprehensive Approach for the Simulation of the Urban Heat Island Effect with the WRF/SLUCM Modeling System: The Case of Athens (Greece). Atmos. Res. 2018, 201, 86–101. [Google Scholar] [CrossRef]
- Wei, R.; Song, D.; Wong, N.H.; Martin, M. Impact of Urban Morphology Parameters on Microclimate. Procedia Eng. 2016, 169, 142–149. [Google Scholar] [CrossRef]
- Yang, J.; Menenti, M.; Wu, Z.; Wong, M.S.; Abbas, S.; Xu, Y.; Shi, Q. Assessing the Impact of Urban Geometry on Surface Urban Heat Island Using Complete and Nadir Temperatures. Int. J. Climatol. 2021, 41, E3219–E3238. [Google Scholar] [CrossRef]
- Thorsson, S.; Lindberg, F.; Björklund, J.; Holmer, B.; Rayner, D. Potential Changes in Outdoor Thermal Comfort Conditions in Gothenburg, Sweden Due to Climate Change: The Influence of Urban Geometry. Int. J. Climatol. 2011, 31, 324–335. [Google Scholar] [CrossRef]
- Ramírez-Aguilar, E.A.; Lucas Souza, L.C. Urban Form and Population Density: Influences on Urban Heat Island Intensities in Bogotá, Colombia. Urban Clim. 2019, 29, 100497. [Google Scholar] [CrossRef]
- Yuan, C.; Chen, L. Mitigating Urban Heat Island Effects in High-Density Cities Based on Sky View Factor and Urban Morphological Understanding: A Study of Hong Kong. Archit. Sci. Rev. 2011, 54, 305–315. [Google Scholar] [CrossRef]
- Chen, L.; Ng, E.; An, X.; Ren, C.; Lee, M.; Wang, U.; He, Z. Sky View Factor Analysis of Street Canyons and Its Implications for Daytime Intra-Urban Air Temperature Differentials in High-Rise, High-Density Urban Areas of Hong Kong: A GIS-Based Simulation Approach. Int. J. Climatol. 2012, 32, 121–136. [Google Scholar] [CrossRef]
- Guo, C.; Buccolieri, R.; Gao, Z. Characterizing the Morphology of Real Street Models and Modeling Its Effect on Thermal Environment. Energy Build. 2019, 203, 109433. [Google Scholar] [CrossRef]
- Andreou, E.; Axarli, K. Investigation of Urban Canyon Microclimate in Traditional and Contemporary Environment. Experimental Investigation and Parametric Analysis. Renew. Energy 2012, 43, 354–363. [Google Scholar] [CrossRef]
- Chatzidimitriou, A.; Yannas, S. Microclimate Design for Open Spaces: Ranking Urban Design Effects on Pedestrian Thermal Comfort in Summer. Sustain. Cities Soc. 2016, 26, 27–47. [Google Scholar] [CrossRef]
- Ali, J.M.; Marsh, S.H.; Smith, M.J. Modelling the Spatiotemporal Change of Canopy Urban Heat Islands. Build. Environ. 2016, 107, 64–78. [Google Scholar] [CrossRef] [Green Version]
- Huang, X.; Song, J.; Wang, C.; Chui, T.F.M.; Chan, P.W. The Synergistic Effect of Urban Heat and Moisture Islands in a Compact High-Rise City. Build. Environ. 2021, 205, 108274. [Google Scholar] [CrossRef]
- Noro, M.; Busato, F.; Lazzarin, R. UHI Effect in the City of Padua: Simulations and Mitigation Strategies Using the Rayman and Envimet Model. Geogr. Pol. 2014, 87, 517–530. [Google Scholar] [CrossRef]
- Guo, J.; Han, G.; Xie, Y.; Cai, Z.; Zhao, Y. Exploring the Relationships between Urban Spatial Form Factors and Land Surface Temperature in Mountainous Area: A Case Study in Chongqing City, China. Sustain. Cities Soc. 2020, 61, 102286. [Google Scholar] [CrossRef]
- Cai, Z.; Han, G.; Chen, M. Do Water Bodies Play an Important Role in the Relationship between Urban Form and Land Surface Temperature? Sustain. Cities Soc. 2018, 39, 487–498. [Google Scholar] [CrossRef]
- Duan, S.; Luo, Z.; Yang, X.; Li, Y. The Impact of Building Operations on Urban Heat/Cool Islands under Urban Densification: A Comparison between Naturally-Ventilated and Air-Conditioned Buildings. Appl. Energy 2019, 235, 129–138. [Google Scholar] [CrossRef]
- Gál, T.; Lindberg, F.; Unger, J. Computing Continuous Sky View Factors Using 3D Urban Raster and Vector Databases: Comparison and Application to Urban Climate. Theor. Appl. Climatol. 2009, 95, 111–123. [Google Scholar] [CrossRef]
- Bourbia, F.; Boucheriba, F. Impact of Street Design on Urban Microclimate for Semi Arid Climate (Constantine). Renew. Energy 2010, 35, 343–347. [Google Scholar] [CrossRef]
- Erdem Okumus, D.; Terzi, F. Evaluating the Role of Urban Fabric on Surface Urban Heat Island: The Case of Istanbul. Sustain. Cities Soc. 2021, 73, 103128. [Google Scholar] [CrossRef]
- Cheung, P.K.; Jim, C.Y. Effects of Urban and Landscape Elements on Air Temperature in a High-Density Subtropical City. Build. Environ. 2019, 164, 106362. [Google Scholar] [CrossRef]
- Unger, J. Intra-Urban Relationship between Surface Geometry and Urban Heat Island: Review and New Approach. Clim. Res. 2004, 27, 253–264. [Google Scholar] [CrossRef] [Green Version]
- Drach, P.; Krüger, E.L.; Emmanuel, R. Effects of Atmospheric Stability and Urban Morphology on Daytime Intra-Urban Temperature Variability for Glasgow, UK. Sci. Total Environ. 2018, 627, 782–791. [Google Scholar] [CrossRef] [Green Version]
- Unger, J. Modelling of the Annual Mean Maximum Urban Heat Island Using 2D and 3D Surface Parameters. Clim. Res. 2006, 30, 215–226. [Google Scholar] [CrossRef] [Green Version]
- Hamdi, R.; Schayes, G. Sensitivity Study of the Urban Heat Island Intensity to Urban Characteristics. Int. J. Climatol. 2008, 28, 973–982. [Google Scholar] [CrossRef]
- Castaldo, V.L.; Rosso, F.; Golasi, I.; Piselli, C.; Salata, F.; Pisello, A.L.; Ferrero, M.; Cotana, F.; de Lieto Vollaro, A. Thermal Comfort in the Historical Urban Canyon: The Effect of Innovative Materials. Energy Procedia 2017, 134, 151–160. [Google Scholar] [CrossRef]
- Dobrovolný, P.; Šezníčková, L.; Krahula, L. Spatial and Temporal Variability of Urban Heat Island Intensity in Brno (Czech Republic). Geophys. Res. Abstr. 2012, 14, 4165. [Google Scholar]
- Yang, F.; Lau, S.S.Y.; Qian, F. Summertime Heat Island Intensities in Three High-Rise Housing Quarters in Inner-City Shanghai China: Building Layout, Density and Greenery. Build. Environ. 2010, 45, 115–134. [Google Scholar] [CrossRef]
- Giridharan, R.; Lau, S.S.Y.; Ganesan, S.; Givoni, B. Urban Design Factors Influencing Heat Island Intensity in High-Rise High-Density Environments of Hong Kong. Build. Environ. 2007, 42, 3669–3684. [Google Scholar] [CrossRef]
- Yang, J.; Shi, Q.; Menenti, M.; Wong, M.S.; Wu, Z.; Zhao, Q.; Abbas, S.; Xu, Y. Observing the Impact of Urban Morphology and Building Geometry on Thermal Environment by High Spatial Resolution Thermal Images. Urban Clim. 2021, 39, 100937. [Google Scholar] [CrossRef]
- Sugie, L.; Jaehyun, H.; Hyemin, C. Spatial and Temporal Effects of Built Environment on Urban Air Temperature in Seoul City, Korea: An Application of Spatial Regression Models. J. Asian Archit. Build. Eng. 2017, 16, 123–130. [Google Scholar] [CrossRef] [Green Version]
- Ha, J.; Lee, S.; Park, C. Temporal Effects of Environmental Characteristics on Urban Air Temperature: The Influence of the Sky View Factor. Sustainability 2016, 8, 895. [Google Scholar] [CrossRef] [Green Version]
- Elnahas, M.M. The Effects of Urban Configuration on Urban Air Temperatures. Archit. Sci. Rev. 2003, 46, 135–138. [Google Scholar] [CrossRef]
- Kottmeier, C.; Biegert, C.; Corsmeier, U. Effects of Urban Land Use on Surface Temperature in Berlin: Case Study. J. Urban Plan. Dev. 2007, 133, 128–137. [Google Scholar] [CrossRef]
- Lyu, T.; Buccolieri, R.; Gao, Z. A Numerical Study on the Correlation between Sky View Factor and Summer Microclimate of Local Climate Zones. Atmosphere 2019, 10, 438. [Google Scholar] [CrossRef] [Green Version]
- Holmer, B.; Thorsson, S.; Eliasson, I. Cooling Rates, Sky View Factors and the Development of Intra-urban Air Temperature Differences. Geogr. Ann. Ser. A Phys. Geogr. 2007, 89, 237–248. [Google Scholar] [CrossRef]
- Scarano, M.; Sobrino, J.A. On the Relationship between the Sky View Factor and the Land Surface Temperature Derived by Landsat-8 Images in Bari, Italy. Int. J. Remote Sens. 2015, 36, 4820–4835. [Google Scholar] [CrossRef]
- Theeuwes, N.E.; Steeneveld, G.J.; Ronda, R.J.; Heusinkveld, B.G.; van Hove, L.W.A.; Holtslag, A.A.M. Seasonal Dependence of the Urban Heat Island on the Street Canyon Aspect Ratio. Q. J. R. Meteorol. Soc. 2014, 140, 2197–2210. [Google Scholar] [CrossRef]
- Gerçek, D.; Güven, İ.T.; Oktay, İ.Ç. Analysis of the Intra-City Variation of Urban Heat Island and Its Relation to Land Surface/Cover Parameters. ISPRS Ann. Photogramm. Remote Sens. Spat. Inf. Sci. 2016, 3, 123. [Google Scholar] [CrossRef] [Green Version]
- Shaker, R.R.; Altman, Y.; Deng, C.; Vaz, E.; Forsythe, K.W. Investigating Urban Heat Island through Spatial Analysis of New York City Streetscapes. J. Clean. Prod. 2019, 233, 972–992. [Google Scholar] [CrossRef]
- Ali-Toudert, F. Exploration of the Thermal Behaviour and Energy Balance of Urban Canyons in Relation to Their Geometrical and Constructive Properties. Build. Environ. 2021, 188, 107466. [Google Scholar] [CrossRef]
- Bennet, M.; Ewenz, C. Increased Urban Heat Island Effect Due to Building Height Increase. In MODSIM2013, Proceedings of the 20th International Congress on Modelling and Simulation. Modelling and Simulation Society of Australia and New Zealand, Adelaide, Australia, 1–6 December 2013; Piantadosi, J., Anderssen, R.S., Boland, J., Eds.; Modelling and Simulation Society of Australia and New Zealand Inc.: Canberra, Australia, 2013; pp. 2242–2247. [Google Scholar] [CrossRef]
- Lin, T.-P.; Matzarakis, A.; Hwang, R.-L. Shading Effect on Long-Term Outdoor Thermal Comfort. Build. Environ. 2010, 45, 213–221. [Google Scholar] [CrossRef]
- Yang, F.; Lau, S.S.Y.; Qian, F. Urban Design to Lower Summertime Outdoor Temperatures: An Empirical Study on High-Rise Housing in Shanghai. Build. Environ. 2011, 46, 769–785. [Google Scholar] [CrossRef]
- Yang, J.; Wong, M.S.; Menenti, M.; Nichol, J. Study of the Geometry Effect on Land Surface Temperature Retrieval in Urban Environment. ISPRS J. Photogramm. Remote Sens. 2015, 109, 77–87. [Google Scholar] [CrossRef]
- Yang, F.; Qian, F.; Lau, S.S.Y. Urban Form and Density as Indicators for Summertime Outdoor Ventilation Potential: A Case Study on High-Rise Housing in Shanghai. Build. Environ. 2013, 70, 122–137. [Google Scholar] [CrossRef]
- Shashua-Bar, L.; Hoffman, M.E. Geometry and Orientation Aspects in Passive Cooling of Canyon Streets with Trees. Energy Build. 2003, 35, 61–68. [Google Scholar] [CrossRef]
- Erdem, U.; Cubukcu, K.M.; Sharifi, A. An Analysis of Urban Form Factors Driving Urban Heat Island: The Case of Izmir. Environ. Dev. Sustain. 2021, 23, 7835–7859. [Google Scholar] [CrossRef]
- Li, J.; Song, C.; Cao, L.; Zhu, F.; Meng, X.; Wu, J. Impacts of Landscape Structure on Surface Urban Heat Islands: A Case Study of Shanghai, China. Remote Sens. Environ. 2011, 115, 3249–3263. [Google Scholar] [CrossRef]
- Yang, J.; Zhan, Y.; Xiao, X.; Xia, J.C.; Sun, W.; Li, X. Investigating the Diversity of Land Surface Temperature Characteristics in Different Scale Cities Based on Local Climate Zones. Urban Clim. 2020, 34, 100700. [Google Scholar] [CrossRef]
- Yang, Y.K.; Kang, I.S.; Chung, M.H.; Kim, S.; Park, J.C. Effect of PCM Cool Roof System on the Reduction in Urban Heat Island Phenomenon. Build. Environ. 2017, 122, 411–421. [Google Scholar] [CrossRef]
- Nakano, A.; Bueno, B.; Norford, L.; Reinhart, C.F. Urban Weather Generator—A Novel Workflow for Integrating Urban Heat Island Effect within Urban Design Process. In Proceedings of the BS2015: 14th Conference of International Building Performance Simulation Association, Hyderabad, India, 7–9 December 2015; pp. 1901–1908. [Google Scholar]
- Henits, L.; Mucsi, L.; Liska, C.M. Monitoring the Changes in Impervious Surface Ratio and Urban Heat Island Intensity between 1987 and 2011 in Szeged, Hungary. Environ. Monit. Assess. 2017, 189, 86. [Google Scholar] [CrossRef] [PubMed]
- Choi, Y.; Lee, S.; Moon, H. Urban Physical Environments and the Duration of High Air Temperature: Focusing on Solar Radiation Trapping Effects. Sustainability 2018, 10, 4837. [Google Scholar] [CrossRef] [Green Version]
- Tremeac, B.; Bousquet, P.; de Munck, C.; Pigeon, G.; Masson, V.; Marchadier, C.; Merchat, M.; Poeuf, P.; Meunier, F. Influence of Air Conditioning Management on Heat Island in Paris Air Street Temperatures. Appl. Energy 2012, 95, 102–110. [Google Scholar] [CrossRef]
- Perini, K.; Magliocco, A. Effects of Vegetation, Urban Density, Building Height, and Atmospheric Conditions on Local Temperatures and Thermal Comfort. Urban For. Urban Green. 2014, 13, 495–506. [Google Scholar] [CrossRef]
- Sun, Y.; Gao, C.; Li, J.; Wang, R.; Liu, J. Quantifying the Effects of Urban Form on Land Surface Temperature in Subtropical High-Density Urban Areas Using Machine Learning. Remote Sens. 2019, 11, 959. [Google Scholar] [CrossRef] [Green Version]
- Liu, W.; Feddema, J.; Hu, L.; Zung, A.; Brunsell, N. Seasonal and Diurnal Characteristics of Land Surface Temperature and Major Explanatory Factors in Harris County, Texas. Sustainability 2017, 9, 2324. [Google Scholar] [CrossRef] [Green Version]
- Montávez, J.P.; Rodríguez, A.; Jiménez, J.I. A Study of the Urban Heat Island of Granada. Int. J. Climatol. 2000, 20, 899–911. [Google Scholar] [CrossRef]
- Jia, J.; Liu, S.; Zhao, S.; Li, Y.; Zhang, Q.; Tang, W. Influences of Landscape Composition and Configuration on Land Surface Temperature in Wuhan, a “Furnace” City in China. In AGU Fall Meeting Abstracts; American Geophysical Union: Washington, DC, USA, 2020; #GC006-0001. [Google Scholar]
- Pigliautile, I.; Chàfer, M.; Pisello, A.L.; Pérez, G.; Cabeza, L.F. Inter-Building Assessment of Urban Heat Island Mitigation Strategies: Field Tests and Numerical Modelling in a Simplified-Geometry Experimental Set-Up. Renew. Energy 2020, 147, 1663–1675. [Google Scholar] [CrossRef]
- Salvati, A.; Palme, M.; Inostroza, L. Key Parameters for Urban Heat Island Assessment in A Mediterranean Context: A Sensitivity Analysis Using the Urban Weather Generator Model. IOP Conf. Ser. Mater. Sci. Eng. 2017, 245, 082055. [Google Scholar] [CrossRef] [Green Version]
- Mathew, A.; Khandelwal, S.; Kaul, N. Spatial and Temporal Variations of Urban Heat Island Effect and the Effect of Percentage Impervious Surface Area and Elevation on Land Surface Temperature: Study of Chandigarh City, India. Sustain. Cities Soc. 2016, 26, 264–277. [Google Scholar] [CrossRef]
- Xu, D.; Zhou, D.; Wang, Y.; Xu, W.; Yang, Y. Field Measurement Study on the Impacts of Urban Spatial Indicators on Urban Climate in a Chinese Basin and Static-Wind City. Build. Environ. 2019, 147, 482–494. [Google Scholar] [CrossRef]
- Huang, J.-M.; Chang, H.-Y.; Wang, Y.-S. Spatiotemporal Changes in the Built Environment Characteristics and Urban Heat Island Effect in a Medium-Sized City, Chiayi City, Taiwan. Sustainability 2020, 12, 365. [Google Scholar] [CrossRef] [Green Version]
- Giridharan, R.; Lau, S.S.Y.; Ganesan, S. Nocturnal Heat Island Effect in Urban Residential Developments of Hong Kong. Energy Build. 2005, 37, 964–971. [Google Scholar] [CrossRef]
- Azhdari, A.; Soltani, A.; Alidadi, M. Urban Morphology and Landscape Structure Effect on Land Surface Temperature: Evidence from Shiraz, a Semi-Arid City. Sustain. Cities Soc. 2018, 41, 853–864. [Google Scholar] [CrossRef]
- Zhou, W.; Huang, G.; Cadenasso, M.L. Does Spatial Configuration Matter? Understanding the Effects of Land Cover Pattern on Land Surface Temperature in Urban Landscapes. Landsc. Urban Plan. 2011, 102, 54–63. [Google Scholar] [CrossRef]
- Lau, K.K.-L.; Chung, S.C.; Ren, C. Outdoor Thermal Comfort in Different Urban Settings of Sub-Tropical High-Density Cities: An Approach of Adopting Local Climate Zone (LCZ) Classification. Build. Environ. 2019, 154, 227–238. [Google Scholar] [CrossRef]
- Shafizadeh-Moghadam, H.; Weng, Q.; Liu, H.; Valavi, R. Modeling the Spatial Variation of Urban Land Surface Temperature in Relation to Environmental and Anthropogenic Factors: A Case Study of Tehran, Iran. GIScience Remote Sens. 2020, 57, 483–496. [Google Scholar] [CrossRef]
- Hendel, M.; Parison, S.; Grados, A.; Royon, L. Which Pavement Structures Are Best Suited to Limiting the UHI Effect? A Laboratory-Scale Study of Parisian Pavement Structures. Build. Environ. 2018, 144, 216–229. [Google Scholar] [CrossRef] [Green Version]
- Lin, J.D.; Hsu, C.Y.; Paramitha, P.A.; Lee, J.C. The Study of Pavement Surface Temperature Behavior of Different Permeable Pavement Materials during Summer Time. Adv. Mater. Res. 2013, 723, 711–718. [Google Scholar] [CrossRef]
- Wang, Y.; Zhang, Y.; Ding, N.; Qin, K.; Yang, X. Simulating the Impact of Urban Surface Evapotranspiration on the Urban Heat Island Effect Using the Modified RS-PM Model: A Case Study of Xuzhou, China. Remote Sens. 2020, 12, 578. [Google Scholar] [CrossRef] [Green Version]
- Georgakis, C.; Santamouris, M. Experimental Investigation of Air Flow and Temperature Distribution in Deep Urban Canyons for Natural Ventilation Purposes. Energy Build. 2006, 38, 367–376. [Google Scholar] [CrossRef]
- Ghadban, M.; Baayoun, A.; Lakkis, I.; Najem, S.; Saliba, N.A.; Shihadeh, A. A Novel Method to Improve Temperature Forecast in Data-Scarce Urban Environments with Application to the Urban Heat Island in Beirut. Urban Clim. 2020, 33, 100648. [Google Scholar] [CrossRef]
- Pasetto, M.; Pasquini, E.; Giacomello, G.; Baliello, A. Innovative Pavement Surfaces as Urban Heat Islands Mitigation Strategy: Chromatic, Thermal and Mechanical Characterisation of Clear/Coloured Mixtures. Road Mater. Pavement Des. 2019, 20, S533–S555. [Google Scholar] [CrossRef]
- Feng, D.; Gong, C. Sensitivity Analysis and Determination of the Effects of Asphalt Pavement Thermophysical Properties on the Temperature Field. J. Highw. Transp. Res. Dev. 2012, 6, 1–10. [Google Scholar] [CrossRef]
- Dimoudi, A.; Kantzioura, A.; Zoras, S.; Pallas, C.; Kosmopoulos, P. Investigation of Urban Microclimate Parameters in an Urban Center. Energy Build. 2013, 64, 1–9. [Google Scholar] [CrossRef]
- Chen, G.; Wang, D.; Wang, Q.; Li, Y.; Wang, X.; Hang, J.; Gao, P.; Ou, C.; Wang, K. Scaled Outdoor Experimental Studies of Urban Thermal Environment in Street Canyon Models with Various Aspect Ratios and Thermal Storage. Sci. Total Environ. 2020, 726, 138147. [Google Scholar] [CrossRef]
- Fikfak, A.; Kosanović, S.; Konjar, M.; Grom, J.P.; Zbašnik-Senegačnik, M. The Impact of Morphological Features on Summer Temperature Variations on the Example of Two Residential Neighborhoods in Ljubljana, Slovenia. Sustainability 2017, 9, 122. [Google Scholar] [CrossRef] [Green Version]
- Taleghani, M.; Kleerekoper, L.; Tenpierik, M.; Dobbelsteen, A. Outdoor Thermal Comfort within Five Different Urban Forms in The Netherlands. Build. Environ. 2014, 83, 65–78. [Google Scholar] [CrossRef]
- Liao, F.-C.; Cheng, M.-J.; Hwang, R.-L.; Yang, W.-S. The Effect of Land Cover and Land Use on Urban Heat Island in Taiwan. In Proceedings of the World SB14, Barcelona, Spain, 28–30 October 2014; pp. 28–30. [Google Scholar]
- Taleghani, M.; Tenpierik, M.; van den Dobbelsteen, A.; Sailor, D.J. Heat in Courtyards: A Validated and Calibrated Parametric Study of Heat Mitigation Strategies for Urban Courtyards in the Netherlands. Sol. Energy 2014, 103, 108–124. [Google Scholar] [CrossRef]
- Vargas-Nordcbeck, A.; Timm, D.H. Evaluation of Pavement Temperatures of Various Pavement Sections. In Transportation and Development Institute Congress 2011: Integrated Transportation and Development for a Better Tomorrow, Proceedings of the First Transportation and Development Institute Congress, Chicago, IL, USA, 13–16 March 2011; American Society of Civil Engineers: Reston, VA, USA, 2012; pp. 782–791. [Google Scholar] [CrossRef]
- Johansson, E.; Grundström, K.; Rosenlund, H. Street Canyon Microclimate in Traditional and Modern Neighbourhoods in a Hot Dry Climate - a Case Study in Fez, Morocco. In Proceedings of the PLEA (Passive and Low Energy Architecture) Association, Florianópolis, Brazil, 2 January 2001; Pereira, F.O.R., Rüther, R., Souza, R.V.G., Afonso, S., da Cunha Neto, J.A.B., Eds.; Lund University: Lund, Sweden, 2001; pp. 661–665. [Google Scholar]
- Yahia, M.W.; Johansson, E. Influence of Urban Planning Regulations on the Microclimate in a Hot Dry Climate: The Example of Damascus, Syria. J. Hous. Built Env. 2013, 28, 51–65. [Google Scholar] [CrossRef]
- Bokaie, M.; Zarkesh, M.K.; Arasteh, P.D.; Hosseini, A. Assessment of Urban Heat Island Based on the Relationship between Land Surface Temperature and Land Use/Land Cover in Tehran. Sustain. Cities Soc. 2016, 23, 94–104. [Google Scholar] [CrossRef]
- Battista, G.; de Lieto Vollaro, E.; Grignaffini, S.; Ocłoń, P.; Vallati, A. Experimental Investigation about the Adoption of High Reflectance Materials on the Envelope Cladding on a Scaled Street Canyon. Energy 2021, 230, 120801. [Google Scholar] [CrossRef]
- Gaffin, S.R.; Imhoff, M.; Rosenzweig, C.; Khanbilvardi, R.; Pasqualini, A.; Kong, A.Y.Y.; Grillo, D.; Freed, A.; Hillel, D.; Hartung, E. Bright Is the New Black—Multi-Year Performance of High-Albedo Roofs in an Urban Climate. Environ. Res. Lett. 2012, 7, 014029. [Google Scholar] [CrossRef]
- Morini, E.; Touchaei, A.G.; Castellani, B.; Rossi, F.; Cotana, F. The Impact of Albedo Increase to Mitigate the Urban Heat Island in Terni (Italy) Using the WRF Model. Sustainability 2016, 8, 999. [Google Scholar] [CrossRef] [Green Version]
- Salvati, A.; Kolokotroni, M.; Kotopouleas, A.; Watkins, R.; Giridharan, R.; Nikolopoulou, M. Impact of Urban Albedo on Microclimate: Computational Investigation in London. In Proceedings of the 35th International Conference on Passive and Low Energy Architecture, Coruña, Spain, 1–3 September 2020; Álvarez, J.R., Soares Gonçalves, J.C., Eds.; PLEA Association: Coruña, Spain, 2020; Volume 1, pp. 677–682. [Google Scholar] [CrossRef]
- Tsoka, S.; Tsikaloudaki, K.; Theodosiou, T. Urban Space’s Morphology and Microclimatic Analysis: A Study for a Typical Urban District in the Mediterranean City of Thessaloniki, Greece. Energy Build. 2017, 156, 96–108. [Google Scholar] [CrossRef]
- Bonafoni, S.; Baldinelli, G.; Rotili, A.; Verducci, P. Albedo and Surface Temperature Relation in Urban Areas: Analysis with Different Sensors. In Proceedings of the 2017 Joint Urban Remote Sensing Event (JURSE), Dubai, United Arab Emirates, 6–8 March 2017; Institute of Electrical and Electronics Engineers (IEEE): Piscataway Township, NJ, USA, 2017; Volume 1, pp. 1–4, ISBN 9781509058099. [Google Scholar]
- Taleghani, M. The Impact of Increasing Urban Surface Albedo on Outdoor Summer Thermal Comfort within a University Campus. Urban Clim. 2018, 24, 175–184. [Google Scholar] [CrossRef]
- Yang, X.; Li, Y. The Impact of Building Density and Building Height Heterogeneity on Average Urban Albedo and Street Surface Temperature. Build. Environ. 2015, 90, 146–156. [Google Scholar] [CrossRef]
- Morini, E.; Castellani, B.; Presciutti, A.; Anderini, E.; Filipponi, M.; Nicolini, A.; Rossi, F. Experimental Analysis of the Effect of Geometry and Façade Materials on Urban District’s Equivalent Albedo. Sustainability 2017, 9, 1245. [Google Scholar] [CrossRef] [Green Version]
- Pomerantz, M.; Pon, B.; Akbari, H.; Chang, S.C. The Effect of Pavements’ Temperatures on Air Temperatures in Large Cities; Ernest Orlando Lawrence Berkeley National Laboratory: Berkeley, CA, USA, 2000; Volume 1.
- Morini, E.; Touchaei, A.G.; Rossi, F.; Cotana, F.; Akbari, H. Evaluation of Albedo Enhancement to Mitigate Impacts of Urban Heat Island in Rome (Italy) Using WRF Meteorological Model. Urban Clim. 2018, 24, 551–566. [Google Scholar] [CrossRef]
- Jandaghian, Z.; Berardi, U. Analysis of the Cooling Effects of Higher Albedo Surfaces during Heat Waves Coupling the Weather Research and Forecasting Model with Building Energy Models. Energy Build. 2020, 207, 109627. [Google Scholar] [CrossRef]
- Andreou, E. Thermal Comfort in Outdoor Spaces and Urban Canyon Microclimate. Renew. Energy 2013, 55, 182–188. [Google Scholar] [CrossRef]
- Sen, S.; Fernandèz, J.P.R.M.-R.; Roesler, J. Reflective Parking Lots for Microscale Urban Heat Island Mitigation. Transp. Res. Rec. 2020, 2674, 663–671. [Google Scholar] [CrossRef]
- Santamouris, M.; Haddad, S.; Saliari, M.; Vasilakopoulou, K.; Synnefa, A.; Paolini, R.; Ulpiani, G.; Garshasbi, S.; Fiorito, F. On the Energy Impact of Urban Heat Island in Sydney: Climate and Energy Potential of Mitigation Technologies. Energy Build. 2018, 166, 154–164. [Google Scholar] [CrossRef]
- Lee, H.; Mayer, H. Thermal Comfort of Pedestrians in an Urban Street Canyon Is Affected by Increasing Albedo of Building Walls. Int. J. Biometeorol. 2018, 62, 1199–1209. [Google Scholar] [CrossRef]
- Athamena, K.; Sini, J.-F.; Rosant, J.-M.; Guilhot, J. Numerical Coupling Model to Compute the Microclimate Parameters inside a Street Canyon: Part I: Methodology and Experimental Validation of Surface Temperature. Sol. Energy 2018, 174, 1237–1251. [Google Scholar] [CrossRef]
- Nazarian, N.; Kleissl, J. CFD Simulation of an Idealized Urban Environment: Thermal Effects of Geometrical Characteristics and Surface Materials. Urban Clim. 2015, 12, 141–159. [Google Scholar] [CrossRef]
- Georgakis, C.; Zoras, S.; Santamouris, M. Studying the Effect of “Cool” Coatings in Street Urban Canyons and Its Potential as a Heat Island Mitigation Technique. Sustain. Cities Soc. 2014, 13, 20–31. [Google Scholar] [CrossRef]
- Krayenhoff, E.S.; Voogt, J.A. Impacts of Urban Albedo Increase on Local Air Temperature at Daily–Annual Time Scales: Model Results and Synthesis of Previous Work. J. Appl. Meteorol. Climatol. 2010, 49, 1634–1648. [Google Scholar] [CrossRef] [Green Version]
- Susca, T. Multiscale Approach to Life Cycle Assessment. J. Ind. Ecol. 2012, 16, 951–962. [Google Scholar] [CrossRef]
- Imran, H.M.; Kala, J.; Ng, A.W.M.; Muthukumaran, S. Effectiveness of Green and Cool Roofs in Mitigating Urban Heat Island Effects during a Heatwave Event in the City of Melbourne in Southeast Australia. J. Clean. Prod. 2018, 197, 393–405. [Google Scholar] [CrossRef]
- Di Giuseppe, E.; Pergolini, M.; Stazi, F. Numerical Assessment of the Impact of Roof Reflectivity and Building Envelope Thermal Transmittance on the UHI Effect. Energy Procedia 2017, 134, 404–413. [Google Scholar] [CrossRef]
- Macintyre, H.L.; Heaviside, C. Potential Benefits of Cool Roofs in Reducing Heat-Related Mortality during Heatwaves in a European City. Environ. Int. 2019, 127, 430–441. [Google Scholar] [CrossRef]
- Ronchi, S.; Salata, S.; Arcidiacono, A. Which Urban Design Parameters Provide Climate-Proof Cities? An Application of the Urban Cooling InVEST Model in the City of Milan Comparing Historical Planning Morphologies. Sustain. Cities Soc. 2020, 63, 102459. [Google Scholar] [CrossRef]
- He, X.; Gao, W.; Wang, R. Impact of Urban Morphology on the Microclimate around Elementary Schools: A Case Study from Japan. Build. Environ. 2021, 206, 108383. [Google Scholar] [CrossRef]
- Zwoliński, A.; Zwoliński, W. Analytical Study of the Impact of Greenery and Public Space Distribution on Land Surface Temperature in Mid-Size Cities of Poland. In PROJECTIONS—Proceedings of the 26th CAADRIA Conferencene, Hong Kong, China, 29 March–1 April 2021; Globa, A.A., van Ameijde, J., Fingrut, A., Kim, N., Lo, T.T.S., Eds.; The Chinese University of Hong Kong: Hong Kong, China, 2021; Volume 2, pp. 437–446. [Google Scholar]
- Chun, B.; Guldmann, J.-M. Spatial Statistical Analysis and Simulation of the Urban Heat Island in High-Density Central Cities. Landsc. Urban Plan. 2014, 125, 76–88. [Google Scholar] [CrossRef]
- Li, Y.; Wang, D.; Li, S.; Gao, W. Impact Analysis of Urban Morphology on Residential District Heat Energy Demand and Microclimate Based on Field Measurement Data. Sustainability 2021, 13, 2070. [Google Scholar] [CrossRef]
- Takebayashi, H.; Moriyama, M. Relationships between the Properties of an Urban Street Canyon and Its Radiant Environment: Introduction of Appropriate Urban Heat Island Mitigation Technologies. Sol. Energy 2012, 86, 2255–2262. [Google Scholar] [CrossRef]
- Lin, P.; Song, D.; LAU, S.S.Y.; Hao, Q.I.N. Investigation of The Impacts of Urban Morphology on Summer-Time Urban Heat Island Using GIS And Field Measurement. Res. Sq. 2021, 1–28. [Google Scholar]
- Chen, S.; Lang, W.; Li, X.; Shen, C.; Fan, Q. Determining the Influence of Building Density on Heat Island Effect Using Baidu Map and Remote Sensing. Photogramm. Eng. Remote Sens. 2018, 84, 549–558. [Google Scholar] [CrossRef]
- Loughner, C.P.; Allen, D.J.; Zhang, D.-L.; Pickering, K.E.; Dickerson, R.R.; Landry, L. Roles of Urban Tree Canopy and Buildings in Urban Heat Island Effects: Parameterization and Preliminary Results. J. Appl. Meteorol. Climatol. 2012, 51, 1775–1793. [Google Scholar] [CrossRef]
- Alexander, C. Influence of the Proportion, Height and Proximity of Vegetation and Buildings on Urban Land Surface Temperature. Int. J. Appl. Earth Obs. Geoinf. 2021, 95, 102265. [Google Scholar] [CrossRef]
- Guo, G.; Zhou, X.; Wu, Z.; Xiao, R.; Chen, Y. Characterizing the Impact of Urban Morphology Heterogeneity on Land Surface Temperature in Guangzhou, China. Environ. Model. Softw. 2016, 84, 427–439. [Google Scholar] [CrossRef]
- Chen, L.; Mak, C.M. Integrated Impacts of Building Height and Upstream Building on Pedestrian Comfort around Ideal Lift-up Buildings in a Weak Wind Environment. Build. Environ. 2021, 200, 107963. [Google Scholar] [CrossRef]
- Oh, M.; Jang, K.M.; Kim, Y. Empirical Analysis of Building Energy Consumption and Urban Form in a Large City: A Case of Seoul, South Korea. Energy Build. 2021, 245, 111046. [Google Scholar] [CrossRef]
- Yuan, J.; Yamanaka, T.; Kobayashi, T.; Kitakaze, H.; Emura, K. Effect of Highly Reflective Building Envelopes on Outdoor Environment Temperature and Indoor Thermal Loads Using CFD and Numerical Analysis. E3S Web Conf. 2019, 111, 06031. [Google Scholar] [CrossRef] [Green Version]
- Kalman, Y.; Pearlmutter, D.; Erell, E. Impact of Increasing the Height of Tel Aviv Buildings on Pedestrian Comfort and Building Energy Efficiency. In Proceedings of the 29th PLEA International Conference: Sustainable Architecture for a Renewable Future, Munich, Germany, 10–12 September 2013; pp. 1–7. [Google Scholar]
- Salvati, A.; Coch, H.; Morganti, M. Effects of Urban Compactness on the Building Energy Performance in Mediterranean Climate. Energy Procedia 2017, 122, 499–504. [Google Scholar] [CrossRef] [Green Version]
- Ramyar, R.; Zarghami, E.; Bryant, M. Spatio-Temporal Planning of Urban Neighborhoods in the Context of Global Climate Change: Lessons for Urban Form Design in Tehran, Iran. Sustain. Cities Soc. 2019, 51, 101554. [Google Scholar] [CrossRef]
- Abreu-Harbich, L.V.; Labaki, L.C.; Matzarakis, A. Thermal Bioclimate in Idealized Urban Street Canyons in Campinas, Brazil. Theor. Appl. Climatol. 2014, 115, 333–340. [Google Scholar] [CrossRef]
- Herrmann, J.; Matzarakis, A. Mean Radiant Temperature in Idealised Urban Canyons—Examples from Freiburg, Germany. Int. J. Biometeorol. 2012, 56, 199–203. [Google Scholar] [CrossRef] [PubMed]
- Delpak, N.; Sajadzadeh, H.; Hasanpourfard, S.; Aram, F. The Effect of Street Orientation on Outdoor Thermal Comfort in a Cold Mountainous Climate. Preprints 2021, 2021050654. [Google Scholar] [CrossRef]
- Lobaccaro, G.; Acero, J.A.; Sanchez Martinez, G.; Padro, A.; Laburu, T.; Fernandez, G. Effects of Orientations, Aspect Ratios, Pavement Materials and Vegetation Elements on Thermal Stress inside Typical Urban Canyons. Int. J. Environ. Res. Public Health 2019, 16, 3574. [Google Scholar] [CrossRef] [Green Version]
- Sharifi, E.; Lehmann, S. Comparative Analysis of Surface Urban Heat Island Effect in Central Sydney. J. Sustain. Dev. 2014, 7, 23–24. [Google Scholar] [CrossRef] [Green Version]
- Johansson, E. Influence of Urban Geometry on Outdoor Thermal Comfort in a Hot Dry Climate: A Study in Fez, Morocco. Build. Environ. 2006, 41, 1326–1338. [Google Scholar] [CrossRef]
- Kantzioura, A.; Kosmopoulos, P.; Dimoudi, A.; Zoras, S. Experimental Investigation of Microclimatic Conditions in Relation to the Built Environment in a Central Urban Area in Thessaloniki (Northern Greece): A Case Study. Sustain. Cities Soc. 2015, 19, 331–340. [Google Scholar] [CrossRef]
- Martinelli, L.; Matzarakis, A. Influence of Height/Width Proportions on the Thermal Comfort of Courtyard Typology for Italian Climate Zones. Sustain. Cities Soc. 2017, 29, 97–106. [Google Scholar] [CrossRef]
- Chatzidimitriou, A.; Axarli, K. Street Canyon Geometry Effects on Microclimate and Comfort; A Case Study in Thessaloniki. Procedia Environ. Sci. 2017, 38, 643–650. [Google Scholar] [CrossRef]
- Boccalatte, A.; Fossa, M.; Gaillard, L.; Menezo, C. Microclimate and Urban Morphology Effects on Building Energy Demand in Different European Cities. Energy Build. 2020, 224, 110129. [Google Scholar] [CrossRef]
- Chen, G.; Charlie Lam, C.K.; Wang, K.; Wang, B.; Hang, J.; Wang, Q.; Wang, X. Effects of Urban Geometry on Thermal Environment in 2D Street Canyons: A Scaled Experimental Study. Build. Environ. 2021, 198, 107916. [Google Scholar] [CrossRef]
- Bourbia, F.; Boucheriba, F.; Tebbani, H. Street Design and Outdoor Comfort for Semi Arid Climate; PLEA: Waging am See, Germany, 2005; pp. 1–6. [Google Scholar]
- Le, M.T.; Shukurov, I.; Shukurova, L.; Dmitrieva, A. A Study Case of Mathematical Calculation of Urban Heat Island Intensity Based on Urban Geometry. In Proceedings of the EECE 2019, St. Petersburg, Russia, 19–20 November 2019; Anatolijs, B., Nikolai, V., Vitalii, S., Eds.; Springer International Publishing: Cham, Switzerland, 2020; pp. 373–388. [Google Scholar]
- Zhang, Y.; Du, X.; Shi, Y. Effects of Street Canyon Design on Pedestrian Thermal Comfort in the Hot-Humid Area of China. Int. J. Biometeorol. 2017, 61, 1421–1432. [Google Scholar] [CrossRef] [PubMed]
- Xi, C.; Ren, C.; Wang, J.; Feng, Z.; Cao, S.-J. Impacts of Urban-Scale Building Height Diversity on Urban Climates: A Case Study of Nanjing, China. Energy Build. 2021, 251, 111350. [Google Scholar] [CrossRef]
- Equere, V.; Mirzaei, P.A.; Riffat, S. Definition of a New Morphological Parameter to Improve Prediction of Urban Heat Island. Sustain. Cities Soc. 2020, 56, 102021. [Google Scholar] [CrossRef]
- Shashua-Bar, L.; Hoffman, M.E. Quantitative Evaluation of the Effects of Built-up Geometry and Trees on Diurnal Air Temperature in Canyon-Type Courtyards. In Advances in Building Technology; Anson, M., Ko, J.M., Lam, E.S.S., Eds.; Elsevier: Oxford, UK, 2002; pp. 1493–1500. ISBN 978-0-08-044100-9. [Google Scholar]
- Yamaoka, N.; Yoshida, H.; Tanabe, M.; Yamashita, M.; Koga, T. Simulation Study of the Influence of Different Urban Canyons Element on the Canyon Thermal Environment. Build. Simul. 2008, 1, 118–128. [Google Scholar] [CrossRef] [Green Version]
- Jamei, E.; Rajagopalan, P. Effect of Street Design on Pedestrian Thermal Comfort. Archit. Sci. Rev. 2019, 62, 92–111. [Google Scholar] [CrossRef]
- Giannopoulou, K.; Santamouris, M.; Livada, I.; Georgakis, C.; Caouris, Y. The Impact of Canyon Geometry on Intra Urban and Urban: Suburban Night Temperature Differences Under Warm Weather Conditions. Pure Appl. Geophys. 2010, 167, 1433–1449. [Google Scholar] [CrossRef]
- Shashua-Bar, L.; Tzamir, Y.; Hoffman, M.E. Thermal Effects of Building Geometry and Spacing on the Urban Canopy Layer Microclimate in a Hot-Humid Climate in Summer. Int. J. Climatol. 2004, 24, 1729–1742. [Google Scholar] [CrossRef]
- Achour-Younsi, S.; Kharrat, F. Outdoor Thermal Comfort: Impact of the Geometry of an Urban Street Canyon in a Mediterranean Subtropical Climate—Case Study Tunis, Tunisia. Procedia Soc. Behav. Sci. 2016, 216, 689–700. [Google Scholar] [CrossRef] [Green Version]
- Tong, S.; Wong, N.H.; Jusuf, S.K.; Tan, C.L.; Wong, H.F.; Ignatius, M.; Tan, E. Study on Correlation between Air Temperature and Urban Morphology Parameters in Built Environment in Northern China. Build. Environ. 2018, 127, 239–249. [Google Scholar] [CrossRef]
- Jiang, Y.; Wu, C.; Teng, M. Impact of Residential Building Layouts on Microclimate in a High Temperature and High Humidity Region. Sustainability 2020, 12, 1046. [Google Scholar] [CrossRef] [Green Version]
- Wang, W.; Ng, E. Large-Eddy Simulations of Air Ventilation in Parametric Scenarios: Comparative Studies of Urban Form and Wind Direction. Archit. Sci. Rev. 2018, 61, 215–225. [Google Scholar] [CrossRef]
- Li, Z.; Zhang, H.; Wen, C.-Y.; Yang, A.-S.; Juan, Y.-H. Effects of Height-Asymmetric Street Canyon Configurations on Outdoor Air Temperature and Air Quality. Build. Environ. 2020, 183, 107195. [Google Scholar] [CrossRef]
- Herbert, J.M.; Herbert, R.D. Simulation of the Effects of Canyon Geometry on Thermal Climate in City Canyons. Math. Comput. Simul. 2002, 59, 243–253. [Google Scholar] [CrossRef]
- Chatzipoulka, C.; Compagnon, R.; Nikolopoulou, M. Urban Geometry and Solar Availability on Façades and Ground of Real Urban Forms: Using London as a Case Study. Sol. Energy 2016, 138, 53–66. [Google Scholar] [CrossRef] [Green Version]
- Andreou, E. The Effect of Urban Layout, Street Geometry and Orientation on Shading Conditions in Urban Canyons in the Mediterranean. Renew. Energy 2014, 63, 587–596. [Google Scholar] [CrossRef]
- Niachou, K.; Livada, I.; Santamouris, M. Experimental Study of Temperature and Airflow Distribution inside an Urban Street Canyon during Hot Summer Weather Conditions—Part I: Air and Surface Temperatures. Build. Environ. 2008, 43, 1383–1392. [Google Scholar] [CrossRef]
- Lau, K.K.-L.; Ren, C.; Ho, J.; Ng, E. Numerical Modelling of Mean Radiant Temperature in High-Density Sub-Tropical Urban Environment. Energy Build. 2016, 114, 80–86. [Google Scholar] [CrossRef]
- Targhi, M.Z.; Van Dessel, S. Potential Contribution of Urban Developments to Outdoor Thermal Comfort Conditions: The Influence of Urban Geometry and Form in Worcester, Massachusetts, USA. Procedia Eng. 2015, 118, 1153–1161. [Google Scholar] [CrossRef] [Green Version]
- Yin, S.; Lang, W.; Xiao, Y. The Synergistic Effect of Street Canyons and Neighbourhood Layout Design on Pedestrian-Level Thermal Comfort in Hot-Humid Area of China. Sustain. Cities Soc. 2019, 49, 101571. [Google Scholar] [CrossRef]
- Muhaisen, A.S.; Abed, H.M. Effect of Urban Geometry and Spacing on the Thermal Performance in the Mediterranean Climate of the Gaza Strip. J. Archit. Plan. 2014, 26, 1. [Google Scholar]
- Ketterer, C.; Matzarakis, A. Human-Biometeorological Assessment of Heat Stress Reduction by Replanning Measures in Stuttgart, Germany. Landsc. Urban Plan. 2014, 122, 78–88. [Google Scholar] [CrossRef]
- Chen, T.; Yang, H.; Chen, G.; Lam, C.K.C.; Hang, J.; Wang, X.; Liu, Y.; Ling, H. Integrated Impacts of Tree Planting and Aspect Ratios on Thermal Environment in Street Canyons by Scaled Outdoor Experiments. Sci. Total Environ. 2021, 764, 142920. [Google Scholar] [CrossRef]
- Coutts, A.M.; White, E.C.; Tapper, N.J.; Beringer, J.; Livesley, S.J. Temperature and Human Thermal Comfort Effects of Street Trees across Three Contrasting Street Canyon Environments. Theor. Appl. Climatol. 2016, 124, 55–68. [Google Scholar] [CrossRef]
- Shashua-Bar, L.; Tsiros, I.X.; Hoffman, M. Passive Cooling Design Options to Ameliorate Thermal Comfort in Urban Streets of a Mediterranean Climate (Athens) under Hot Summer Conditions. Build. Environ. 2012, 57, 110–119. [Google Scholar] [CrossRef]
- Weng, Q.; Liu, H.; Liang, B.; Lu, D. The Spatial Variations of Urban Land Surface Temperatures: Pertinent Factors, Zoning Effect, and Seasonal Variability. IEEE J. Sel. Top. Appl. Earth Obs. Remote Sens. 2008, 1, 154–166. [Google Scholar] [CrossRef]
- Smith, C.L.; Webb, A.; Levermore, G.J.; Lindley, S.J.; Beswick, K. Fine-Scale Spatial Temperature Patterns across a UK Conurbation. Clim. Change 2011, 109, 269–286. [Google Scholar] [CrossRef]
- Zhang, X.; Estoque, R.C.; Murayama, Y. An Urban Heat Island Study in Nanchang City, China Based on Land Surface Temperature and Social-Ecological Variables. Sustain. Cities Soc. 2017, 32, 557–568. [Google Scholar] [CrossRef]
- Shimazaki, Y.; Aoki, M.; Nitta, J.; Okajima, H.; Yoshida, A. Experimental Determination of Pedestrian Thermal Comfort on Water-Retaining Pavement for UHI Adaptation Strategy. Atmosphere 2021, 12, 127. [Google Scholar] [CrossRef]
- Liu, K.; Zhang, X.; Li, X.; Jiang, H. Multiscale Analysis of Urban Thermal Characteristics: Case Study of Shijiazhuang, China. J. Appl. Remote Sens. 2014, 8, 083649. [Google Scholar] [CrossRef]
- Lu, J.; Li, C.; Yu, C.; Jin, M.; Dong, S. Regression Analysis of the Relationship between Urban Heat Island Effect and Urban Canopy Characteristics in a Mountainous City, Chongqing. Indoor Built Environ. 2012, 21, 821–836. [Google Scholar] [CrossRef]
- Zhao, H.; Zhang, H.; Miao, C.; Ye, X.; Min, M. Linking Heat Source–Sink Landscape Patterns with Analysis of Urban Heat Islands: Study on the Fast-Growing Zhengzhou City in Central China. Remote Sens. 2018, 10, 1268. [Google Scholar] [CrossRef] [Green Version]
- Dobrovolný, P.; Krahula, L. The Spatial Variability of Air Temperature and Nocturnal Urban Heat Island Intensity in the City of Brno, Czech Republic. Morav. Geogr. Rep. 2015, 23, 8–16. [Google Scholar] [CrossRef] [Green Version]
- Berger, C.; Rosentreter, J.; Voltersen, M.; Baumgart, C.; Schmullius, C.; Hese, S. Spatio-Temporal Analysis of the Relationship between 2D/3D Urban Site Characteristics and Land Surface Temperature. Remote Sens. Environ. 2017, 193, 225–243. [Google Scholar] [CrossRef]
- Yuan, C.; Ng, E. Building Porosity for Better Urban Ventilation in High-Density Cities—A Computational Parametric Study. Build. Environ. 2012, 50, 176–189. [Google Scholar] [CrossRef]
- Sun, F.; Liu, M.; Wang, Y.; Wang, H.; Che, Y. The Effects of 3D Architectural Patterns on the Urban Surface Temperature at a Neighborhood Scale: Relative Contributions and Marginal Effects. J. Clean. Prod. 2020, 258, 120706. [Google Scholar] [CrossRef]
- Sun, C.-Y. A Street Thermal Environment Study in Summer by the Mobile Transect Technique. Theor. Appl. Climatol. 2011, 106, 433–442. [Google Scholar] [CrossRef]
- Chatzipoulka, C.; Nikolopoulou, M.; Watkins, R. The Impact of Urban Geometry on the Radiant Environment in Outdoor Spaces. In Proceedings of the ICUC9—9th International Conference on Urban Climate jointly with 12th Symposium on the Urban Environment, Toulouse, France, 20–24 July 2015; pp. 1–6. [Google Scholar]
- Yang, Y.; Zhang, X.; Lu, X.; Hu, J.; Pan, X.; Zhu, Q.; Su, W. Effects of Building Design Elements on Residential Thermal Environment. Sustainability 2017, 10, 57. [Google Scholar] [CrossRef] [Green Version]
- Wong, M.S.; Nichol, J.; Lee, K.-H. A Satellite View of Urban Heat Island: Causative Factors and Scenario Analysis. Korean J. Remote Sens. 2010, 26, 617–627. [Google Scholar]
- Lin, P.; Lau, S.S.Y.; Qin, H.; Gou, Z. Effects of Urban Planning Indicators on Urban Heat Island: A Case Study of Pocket Parks in High-Rise High-Density Environment. Landsc. Urban Plan. 2017, 168, 48–60. [Google Scholar] [CrossRef]
- Mohegh, A.; Levinson, R.; Taha, H.; Gilbert, H.; Zhang, J.; Li, Y.; Tang, T.; Ban-Weiss, G.A. Observational Evidence of Neighborhood Scale Reductions in Air Temperature Associated with Increases in Roof Albedo. Climate 2018, 6, 98. [Google Scholar] [CrossRef] [Green Version]
- Zhou, X.; Chen, H. Impact of Urbanization-Related Land Use Land Cover Changes and Urban Morphology Changes on the Urban Heat Island Phenomenon. Sci. Total Environ. 2018, 635, 1467–1476. [Google Scholar] [CrossRef] [PubMed]
- Zhang, M.; Gao, Z. Effect of Urban Form on Microclimate and Energy Loads: Case Study of Generic Residential District Prototypes in Nanjing, China. Sustain. Cities Soc. 2021, 70, 102930. [Google Scholar] [CrossRef]
- Mirzaee, S.; Özgun, O.; Ruth, M.; Binita, K.C. Neighborhood-Scale Sky View Factor Variations with Building Density and Height: A Simulation Approach and Case Study of Boston. Urban Clim. 2018, 26, 95–108. [Google Scholar] [CrossRef]
- Vartholomaios, A. A Parametric Sensitivity Analysis of the Influence of Urban Form on Domestic Energy Consumption for Heating and Cooling in a Mediterranean City. Sustain. Cities Soc. 2017, 28, 135–145. [Google Scholar] [CrossRef]
- Giridharan, R.; Lau, S.S.Y.; Ganesan, S.; Givoni, B. Lowering the Outdoor Temperature in High-Rise High-Density Residential Developments of Coastal Hong Kong: The Vegetation Influence. Build. Environ. 2008, 43, 1583–1595. [Google Scholar] [CrossRef]
- Rhee, J.; Park, S.; Lu, Z. Relationship between Land Cover Patterns and Surface Temperature in Urban Areas. GISci. Remote Sens. 2014, 51, 521–536. [Google Scholar] [CrossRef]
- Sharifi, E.; Lehmann, S. Correlation analysis of surface temperature of rooftops, streetscapes and urban heat island effect: Case study of central Sydney. J. Urban Environ. Eng. 2015, 9, 3–11. [Google Scholar] [CrossRef]
- Zhou, B.; Rybski, D.; Kropp, J.P. The Role of City Size and Urban Form in the Surface Urban Heat Island. Sci. Rep. 2017, 7, 4791. [Google Scholar] [CrossRef]
- Zhang, J.; Gou, Z.; Lu, Y.; Lin, P. The Impact of Sky View Factor on Thermal Environments in Urban Parks in a Subtropical Coastal City of Australia. Urban For. Urban Green. 2019, 44, 126422. [Google Scholar] [CrossRef]
- Kedissa, C.; Outtas, S.; Belarbi, R. The Impact of Height/Width Ratio on the Microclimate and Thermal Comfort Levels of Urban Courtyards. Int. J. Sustain. Build. Technol. Urban Dev. 2016, 7, 174–183. [Google Scholar] [CrossRef]
- Dirksen, M.; Ronda, R.J.; Theeuwes, N.E.; Pagani, G.A. Sky View Factor Calculations and Its Application in Urban Heat Island Studies. Urban Clim. 2019, 30, 100498. [Google Scholar] [CrossRef]
- Castellani, B.; Nicolini, A.; Gambelli, A.M.; Filipponi, M.; Morini, E.; Rossi, F. Experimental Assessment of the Combined Effect of Retroreflective Façades and Pavement in Urban Canyons. IOP Conf. Ser. Mater. Sci. Eng. 2019, 609, 072004. [Google Scholar] [CrossRef] [Green Version]
- Rossi, F.; Pisello, A.L.; Nicolini, A.; Filipponi, M.; Palombo, M. Analysis of Retro-Reflective Surfaces for Urban Heat Island Mitigation: A New Analytical Model. Appl. Energy 2014, 114, 621–631. [Google Scholar] [CrossRef]
- Rossi, F.; Morini, E.; Castellani, B.; Nicolini, A.; Bonamente, E.; Anderini, E.; Cotana, F. Beneficial Effects of Retroreflective Materials in Urban Canyons: Results from Seasonal Monitoring Campaign. J. Phys. Conf. Ser. 2015, 655, 012012. [Google Scholar] [CrossRef]
- Echevarría Icaza, L.; van der Hoeven, F.D.; van den Dobbelsteen, A. The Urban Heat Island Effect in Dutch City Centres: Identifying Relevant Indicators and First Explorations. In Implementing Climate Change Adaptation in Cities and Communities: Integrating Strategies and Educational Approaches; Leal Filho, W., Adamson, K., Dunk, R.M., Azeiteiro, U.M., Illingworth, S., Alves, F., Climate Change Management, Eds.; Springer International Publishing: Cham, Switzerland, 2016; pp. 123–160. ISBN 978-3-319-28591-7. [Google Scholar]
- Alsabry, A.; Truszkiewicz, P.; Szymański, K.; Łaskawiec, K.; Rojek, Ł. Analysis of Energy Consumption and Possibilities of Thermal-Modernization in Residential Buildings in Poland Case Study: The Town of Zielona Góra. Int. J. Appl. Mech. Eng. 2017, 22. [Google Scholar] [CrossRef] [Green Version]
- Dai, Q.; Schnabel, M.A. Thermal Comfort Levels Classified by Aspect Ratio and Orientation for Three Zones of a Street in Rotterdam. Archit. Sci. Rev. 2014, 57, 286–294. [Google Scholar] [CrossRef]
- Tong, S.; Wong, N.H.; Tan, C.L.; Jusuf, S.K.; Ignatius, M.; Tan, E. Impact of Urban Morphology on Microclimate and Thermal Comfort in Northern China. Sol. Energy 2017, 155, 212–223. [Google Scholar] [CrossRef]
- Huang, X.; Li, C.; Zhuang, Z. Analysis of Height-to-Width Ratio of Commercial Streets with Arcades Based on Sunshine Hours and Street Orientation. Appl. Sci. 2021, 11, 1706. [Google Scholar] [CrossRef]
- Koopmans, S.; Ronda, R.; Steeneveld, G.-J.; Holtslag, A.A.M.; Klein Tank, A.M.G. Quantifying the Effect of Different Urban Planning Strategies on Heat Stress for Current and Future Climates in the Agglomeration of The Hague (The Netherlands). Atmosphere 2018, 9, 353. [Google Scholar] [CrossRef] [Green Version]
- Liu, Y.; Li, Q.; Yang, L.; Mu, K.; Zhang, M.; Liu, J. Urban Heat Island Effects of Various Urban Morphologies under Regional Climate Conditions. Sci. Total Environ. 2020, 743, 140589. [Google Scholar] [CrossRef] [PubMed]
- Ferguson, N. Complexity and Collapse: Empires on the Edge of Chaos. Foreign Aff. 2010, 89, 18. [Google Scholar]
- Kruis, N.J.; Heun, M.K. Analysis of the Performance of Earthship Housing in Various Global Climates. In Proceedings of the ES2007 Energy Sustainability, Long Beach, CA, USA, 27–30 June 2007; pp. 431–440. [Google Scholar]
- Sabján, T. Reconstructions of Medieval Pit-Houses. In The Rural House: From the Migration Period to the Oldest Still Standing Buildings, Proceedings of the Ruralia IV, Bad Bederkesa, Germany, 8–13 September 2001; Památky Archeologické; Archeologický ústav AV ČR: Prague, Czech Republic, 2002; Volume 15, pp. 320–332. [Google Scholar]
- Prinz, R.P. Hacking the Earthship: In Search of an Earth-Shelter That Works for Everybody; Archinia Press: Santa Fe, NM, USA, 2015; ISBN 0-9861155-1-7. [Google Scholar]
- Nývlt, V.; Musílek, J.; Čejka, J.; Stopka, O. The Study of Derinkuyu Underground City in Cappadocia Located in Pyroclastic Rock Materials. Procedia Eng. 2016, 161, 2253–2258. [Google Scholar] [CrossRef] [Green Version]
- Kostigen, T. Humans v. Sky & Space. In Hacking Planet Earth. Technologies That Can Counteract Climate Change and Create a Better Future; Penguin Random House LLC: New York, USA, 2020; Volume 1, pp. 70–84. [Google Scholar]
- Bernstein, L.; Bosch, P.; Canziani, O.; Chen, Z.; Christ, R.; Riahi, K. IPCC, 2007: Climate Change 2007: Synthesis Report. Contribution of Working Groups I, II and III to the Fourth Assessment Report of the Intergovernmental Panel on Climate Change; IPCC: Geneva, Switzerland, 2008; 104p. [Google Scholar]
- Rafiee, A.; Dias, E.; Koomen, E. Local Impact of Tree Volume on Nocturnal Urban Heat Island: A Case Study in Amsterdam. Urban For. Urban Green. 2016, 16, 50–61. [Google Scholar] [CrossRef]
- Zonato, A.; Martilli, A.; Di Sabatino, S.; Zardi, D.; Giovannini, L. Evaluating the Performance of a Novel WUDAPT Averaging Technique to Define Urban Morphology with Mesoscale Models. Urban Clim. 2020, 31, 100584. [Google Scholar] [CrossRef]
- Lindberg, F.; Eliasson, I.; Holmer, B. Urban Geometry and Temperature Variations. In Proceedings of the Fifth Conference on Urban Climate, ICUC5, Łódź, Poland, 1–5 September 2003; University of Lodz: Lodz, Poland, 2003; pp. 1–4. [Google Scholar]
- Yang, Z.; Chen, Y.; Zheng, Z.; Huang, Q.; Wu, Z. Application of Building Geometry Indexes to Assess the Correlation between Buildings and Air Temperature. Build. Environ. 2020, 167, 106477. [Google Scholar] [CrossRef]
- Salvati, A.; Palme, M.; de la Barrera, F. Urban Morphology Parameterization for Climate Modelling in Urban Planning. J. Build. Perform. Simul. 2018, 6, 189. [Google Scholar]
- Yang, J.; Shi, B.; Xia, G.; Xue, Q.; Cao, S.-J. Impacts of Urban Form on Thermal Environment Near the Surface Region at Pedestrian Height: A Case Study Based on High-Density Built-Up Areas of Nanjing City in China. Sustainability 2020, 12, 1737. [Google Scholar] [CrossRef] [Green Version]
- Cao, Z.; Wu, Z.; Liu, L.; Chen, Y.; Zou, Y. Assessing the Relationship between Anthropogenic Heat Release Warming and Building Characteristics in Guangzhou: A Sustainable Development Perspective. Sci. Total Environ. 2019, 695, 133759. [Google Scholar] [CrossRef]
- Zhou, Y.; Zhuang, Z.; Yang, F.; Yu, Y.; Xie, X. Urban Morphology on Heat Island and Building Energy Consumption. Procedia Eng. 2017, 205, 2401–2406. [Google Scholar] [CrossRef]
- Hidalgo García, D.; Arco Díaz, J. Modeling of the Urban Heat Island on Local Climatic Zones of a City Using Sentinel 3 Images: Urban Determining Factors. Urban Clim. 2021, 37, 100840. [Google Scholar] [CrossRef]
- Dobrovolný, P. The Surface Urban Heat Island in the City of Brno (Czech Republic) Derived from Land Surface Temperatures and Selected Reasons for Its Spatial Variability. Theor. Appl. Climatol. 2013, 112, 89–98. [Google Scholar] [CrossRef]
- Kouklis, G.-R.; Yiannakou, A. The Contribution of Urban Morphology to the Formation of the Microclimate in Compact Urban Cores: A Study in the City Center of Thessaloniki. Urban Sci. 2021, 5, 37. [Google Scholar] [CrossRef]
- Leconte, F.; Bouyer, J.; Claverie, R.; Pétrissans, M. Using Local Climate Zone Scheme for UHI Assessment: Evaluation of the Method Using Mobile Measurements. Build. Environ. 2015, 83, 39–49. [Google Scholar] [CrossRef]
- Liu, L.; Lin, Y.; Xiao, Y.; Xue, P.; Shi, L.; Chen, X.; Liu, J. Quantitative Effects of Urban Spatial Characteristics on Outdoor Thermal Comfort Based on the LCZ Scheme. Build. Environ. 2018, 143, 443–460. [Google Scholar] [CrossRef]
- Stewart, I.D.; Oke, T.R.; Krayenhoff, E.S. Evaluation of the ‘Local Climate Zone’ Scheme Using Temperature Observations and Model Simulations. Int. J. Climatol. 2014, 34, 1062–1080. [Google Scholar] [CrossRef]
- Kim, M.; Lee, K.; Cho, G.-H. Temporal and Spatial Variability of Urban Heat Island by Geographical Location: A Case Study of Ulsan, Korea. Build. Environ. 2017, 126, 471–482. [Google Scholar] [CrossRef]
- Unger, J.; Bottyán, Z.; Sümeghy, Z.; Gulyás, Á. Connection between Urban Heat Island and Surface Parameters: Measurements and Modeling. Időjárás Q. J. Hung. Meteorol. Serv. 2004, 108, 173–194. [Google Scholar]
- Unger, J.; Bottyán, Z.; Sümeghy, Z.; Gulyás, Á. Urban Heat Island Development Affected by Urban Surface Factors. Időjárás Q. J. Hung. Meteorol. Serv. 2000, 104, 253–268. [Google Scholar]
- Bottyán, Z.; Unger, J. The Role of Land-Use Parameters in the Spatial Development of Urban Heat Island in Szeged, Hungary. In Proceedings of the Fourth Symposium on the Urban Environment, Norfolk, VI, USA, 20–24 May 2002; p. 1186422. [Google Scholar]
- Pouramin, K.; Khatami, S.M.; Shamsodini, A. Effective Factors of Forming Urban Heat Islands; With an Emphasis on Urban Design Challenges and Features. Urban Des. Discourse Rev. Contemp. Lit. Theor. 2020, 1, 69–83. [Google Scholar]
- Unger, J.; Bottyán, Z.; Balázs, B.; Kovács, P.; Géczi, R. A Statistical Model for Estimating Mean Maximum Urban Heat Island. In Proceedings of the 5th International Conference on Urban Climatology; Lodz, Poland, 1–5 September 2003, University of Lodz: Lodz, Poland, 2003; pp. 155–158. [Google Scholar]
- Goldberg, V.; Kubjuhn, C.; Bernhofer, C. How Relevant Is Urban Planning for the Thermal Comfort of Pedestrians? Numerical Case Studies in Two Districts of the City of Dresden (Saxony/Germany). Meteorol. Z. 2014, 22, 739–751. [Google Scholar] [CrossRef]
- Yang, J.; Wong, M.S.; Ho, H.C.; Krayenhoff, E.S.; Chan, P.W.; Abbas, S.; Menenti, M. A Semi-Empirical Method for Estimating Complete Surface Temperature from Radiometric Surface Temperature, a Study in Hong Kong City. Remote Sens. Environ. 2020, 237, 111540. [Google Scholar] [CrossRef]
- Lau, S.S.Y.; Yang, F.; Tai, J.; Wu, X.L.; Wang, J. The Study of Summer-Time Heat Island, Built Form and Fabric in a Densely Built Urban Environment in Compact Chinese Cities: Hong Kong, Guangzhou. Int. J. Sustain. Dev. 2011, 14, 30–48. [Google Scholar] [CrossRef]
- Ando, H.; Morishima, W.; Yokoyama, H.; Akasaka, I. Effects of Urban Geometry on Urban Heat Islands in Tokyo. In Proceedings of the Seventh International Conference on Urban Climate, Yokohama, Japan, 29 June–3 July 2009; pp. 1–4. [Google Scholar]
- Caliskan, O.; Sakar, B. Design for Mitigating Urban Heat Island: Proposal of a Parametric Model. Iconarp Int. J. Archit. Plan. 2019, 7, 158–181. [Google Scholar] [CrossRef]
- Liu, N.; Morawska, L. Modeling the Urban Heat Island Mitigation Effect of Cool Coatings in Realistic Urban Morphology. J. Clean. Prod. 2020, 264, 121560. [Google Scholar] [CrossRef]
- Zhang, S.; Wang, P. Impact of Urban Form on Land Surface Temperature (LST) Based Seasonal Characteristics: Empirical Study from Nanjing. IOP Conf. Ser. Earth Environ. Sci. 2021, 647, 012184. [Google Scholar] [CrossRef]
- Xu, L.; Cui, S.; Tang, J.; Nguyen, M.; Liu, J.; Zhao, Y. Assessing the Adaptive Capacity of Urban Form to Climate Stress: A Case Study on an Urban Heat Island. Environ. Res. Lett. 2019, 14, 044013. [Google Scholar] [CrossRef]
- Sangiorgio, V.; Fiorito, F.; Santamouris, M. Development of a Holistic Urban Heat Island Evaluation Methodology. Sci. Rep. 2020, 10, 17913. [Google Scholar] [CrossRef]
- Trlica, A.; Hutyra, L.R.; Schaaf, C.L.; Erb, A.; Wang, J.A. Albedo, Land Cover, and Daytime Surface Temperature Variation Across an Urbanized Landscape. Earth’s Future 2017, 5, 1084–1101. [Google Scholar] [CrossRef] [Green Version]
- Weng, Q.; Lu, D. A Sub-Pixel Analysis of Urbanization Effect on Land Surface Temperature and Its Interplay with Impervious Surface and Vegetation Coverage in Indianapolis, United States. Int. J. Appl. Earth Obs. Geoinf. 2008, 10, 68–83. [Google Scholar] [CrossRef]
- Xu, H.; Lin, D.; Tang, F. The Impact of Impervious Surface Development on Land Surface Temperature in a Subtropical City: Xiamen, China. Int. J. Climatol. 2013, 33, 1873–1883. [Google Scholar] [CrossRef]
- Wang, J.; Qingming, Z.; Guo, H.; Jin, Z. Characterizing the Spatial Dynamics of Land Surface Temperature–Impervious Surface Fraction Relationship. Int. J. Appl. Earth Obs. Geoinf. 2016, 45, 55–65. [Google Scholar] [CrossRef]
- Zhang, Z.; Ji, M.; Shu, J.; Deng, Z.; Key, Y. Surface Urban Heat Island in Shanghai, China: Examining the Relationship between Land Surface Temperature and Impervious Surface Fractions Derived from Landsat ETM + IMAGERY. Environ. Sci. Math. 2008, 601–606. [Google Scholar]
- Bottyán, Z.; Balázs, B.; Gál, T.M.; Zboray, Z. A Statistical Approach for Estimating Mean Maximum Urban Temperature Excess. Acta Climatol. Chorol. 2003, 36, 17–26. [Google Scholar]
- Schubert, S.; Grossman-Clarke, S. The Influence of Green Areas and Roof Albedos on Air Temperatures during Extreme Heat Events in Berlin, Germany. Meteorol. Z. 2013, 22, 131–143. [Google Scholar] [CrossRef] [Green Version]
- Wang, Y.; Du, H.; Xu, Y.; Lu, D.; Wang, X.; Guo, Z. Temporal and Spatial Variation Relationship and Influence Factors on Surface Urban Heat Island and Ozone Pollution in the Yangtze River Delta, China. Sci. Total Environ. 2018, 631–632, 921–933. [Google Scholar] [CrossRef]
- Grigoraș, G.; Urițescu, B. Land Use/Land Cover Changes Dynamics and Their Effects on Surface Urban Heat Island in Bucharest, Romania. Int. J. Appl. Earth Obs. Geoinf. 2019, 80, 115–126. [Google Scholar] [CrossRef]
- Zhao, C.; Jensen, J.; Weng, Q.; Weaver, R. A Geographically Weighted Regression Analysis of the Underlying Factors Related to the Surface Urban Heat Island Phenomenon. Remote Sens. 2018, 10, 1428. [Google Scholar] [CrossRef] [Green Version]
- Deilami, K.; Kamruzzaman, M.; Hayes, J.F. Correlation or Causality between Land Cover Patterns and the Urban Heat Island Effect? Evidence from Brisbane, Australia. Remote Sens. 2016, 8, 716. [Google Scholar] [CrossRef] [Green Version]
- Unger, J.; Sümeghy, Z.; Mucsi, L.; Pál, V.; Kádár, E.; Kevei-Bárány, I. Urban Temperature Excess as a Function of Urban Parameters in Szeged, Part 1: Seasonal Patterns. Acta Climatol. Chorol. 2001, 34, 5–14. [Google Scholar]
- Balázs, B.; Unger, J.; Gál, T.; Sümeghy, Z.; Geiger, J.; Szegedi, S. Simulation of the mean urban heat island using 2D surface parameters: Empirical modelling, verification and extension. Meteorol. Appl. 2009, 16, 275–287. [Google Scholar] [CrossRef]
- Hafner, J.; Kidder, S.Q. Urban Heat Island Modeling in Conjunction with Satellite-Derived Surface/Soil Parameters. J. Appl. Meteorol. Climatol. 1999, 38, 448–465. [Google Scholar] [CrossRef] [Green Version]
- Evola, G.; Gagliano, A.; Fichera, A.; Marletta, L.; Martinico, F.; Nocera, F.; Pagano, A. UHI Effects and Strategies to Improve Outdoor Thermal Comfort in Dense and Old Neighbourhoods. Energy Procedia 2017, 134, 692–701. [Google Scholar] [CrossRef]
- Falasca, S.; Ciancio, V.; Salata, F.; Golasi, I.; Rosso, F.; Curci, G. High Albedo Materials to Counteract Heat Waves in Cities: An Assessment of Meteorology, Buildings Energy Needs and Pedestrian Thermal Comfort. Build. Environ. 2019, 163, 106242. [Google Scholar] [CrossRef]
- Franzitta, V.; Viola, A.; Trapanese, M.; Costanzo, S. Assessment of the Trend of Albedo: A Case Study of Palermo. Adv. Mater. Res. 2013, 734–737, 1865–1869. [Google Scholar] [CrossRef] [Green Version]
- Peng, J.; Jia, J.; Liu, Y.; Li, H.; Wu, J. Seasonal Contrast of the Dominant Factors for Spatial Distribution of Land Surface Temperature in Urban Areas. Remote Sens. Environ. 2018, 215, 255–267. [Google Scholar] [CrossRef]
- Dousset, B.; Gourmelon, F. Satellite Multi-Sensor Data Analysis of Urban Surface Temperatures and Landcover. ISPRS J. Photogramm. Remote Sens. 2003, 58, 43–54. [Google Scholar] [CrossRef]
- Franck, U.; Krüger, M.; Schwarz, N.; Grossmann, K.; Röder, S.; Schlink, U. Heat Stress in Urban Areas: Indoor and Outdoor Temperatures in Different Urban Structure Types and Subjectively Reported Well-Being during a Heat Wave in the City of Leipzig. Meteorol. Z. 2013, 22, 167–177. [Google Scholar] [CrossRef]
- Matzarakis, A.; Mayer, H. Dependence of Urban Climate on Urban Morphology. In Proceedings of the 5th Japanese-German Meeting on Urban Climatology, Freiburg, Germany, 6–8 October 2008; Mayer, H., Matzarakis, A., Eds.; Albert-Ludwigs-University of Freiburg: Freiburg, Germany, 2009; pp. 277–282. [Google Scholar]
- Nouri, A.S.; Costa, J.P.; Matzarakis, A. Examining Default Urban-Aspect-Ratios and Sky-View-Factors to Identify Priorities for Thermal-Sensitive Public Space Design in Hot-Summer Mediterranean Climates: The Lisbon Case. Build. Environ. 2017, 126, 442–456. [Google Scholar] [CrossRef]
- Cocci Grifoni, R.; D’Onofrio, R.; Sargolini, M.; Pierantozzi, M. A Parametric Optimization Approach to Mitigating the Urban Heat Island Effect: A Case Study in Ancona, Italy. Sustainability 2016, 8, 896. [Google Scholar] [CrossRef] [Green Version]
- Lee, K.; Levermore, G.J. Sky View Factor and Sunshine Factor of Urban Geometry for Urban Heat Island and Renewable Energy. Archit. Sci. Rev. 2019, 62, 26–34. [Google Scholar] [CrossRef]
- Núñez-Peiró, M.; Sánchez, C.S.-G.; González, F.J.N. Hourly Evolution of Intra-Urban Temperature Variability across the Local Climate Zones. The Case of Madrid. Urban Clim. 2021, 39, 100921. [Google Scholar] [CrossRef]
- Liang, W.; Huang, J.; Jones, P.; Wang, Q.; Hang, J. A Zonal Model for Assessing Street Canyon Air Temperature of High-Density Cities. Build. Environ. 2018, 132, 160–169. [Google Scholar] [CrossRef]
- Tsoka, S.; Tsikaloudaki, K.; Theodosiou, T.; Bikas, D. Assessing the Effect of the Urban Morphology on the Ambient Air Temperature of Urban Street Canyons under Different Meteorological Conditions. Application in Residential Areas of Thessaloniki, Greece. IOP Conf. Ser. Earth Environ. Sci. 2020, 410, 012005. [Google Scholar] [CrossRef]
- Abdollahzadeh, N.; Biloria, N. Outdoor Thermal Comfort: Analyzing the Impact of Urban Configurations on the Thermal Performance of Street Canyons in the Humid Subtropical Climate of Sydney. Front. Archit. Res. 2021, 10, 394–409. [Google Scholar] [CrossRef]
- Yahia, M.W.; Johansson, E. Landscape Interventions in Improving Thermal Comfort in the Hot Dry City of Damascus, Syria—The Example of Residential Spaces with Detached Buildings. Landsc. Urban Plan. 2014, 125, 1–16. [Google Scholar] [CrossRef]
- Lin, Y.; Ichinose, T.; Yamao, Y.; Mouri, H. Wind Velocity and Temperature Fields under Different Surface Heating Conditions in a Street Canyon in Wind Tunnel Experiments. Build. Environ. 2020, 168, 106500. [Google Scholar] [CrossRef]
- Chatzidimitriou, A.; Yannas, S. Street Canyon Design and Improvement Potential for Urban Open Spaces; the Influence of Canyon Aspect Ratio and Orientation on Microclimate and Outdoor Comfort. Sustain. Cities Soc. 2017, 33, 85–101. [Google Scholar] [CrossRef]
- Shashua-Bar, L.; Tsiros, I.X.; Hoffman, M.E. A Modeling Study for Evaluating Passive Cooling Scenarios in Urban Streets with Trees. Case Study: Athens, Greece. Build. Environ. 2010, 45, 2798–2807. [Google Scholar] [CrossRef]
- Rivera-Gómez, C.; Diz-Mellado, E.; Galán-Marín, C.; López-Cabeza, V. Tempering Potential-Based Evaluation of the Courtyard Microclimate as a Combined Function of Aspect Ratio and Outdoor Temperature. Sustain. Cities Soc. 2019, 51, 101740. [Google Scholar] [CrossRef]
- Blankenstein, S.; Kuttler, W. Impact of Street Geometry on Downward Longwave Radiation and Air Temperature in an Urban Environment. Meteorol. Z. 2004, 13, 373–379. [Google Scholar] [CrossRef]
- Oh, M.; Kim, Y. Identifying Urban Geometric Types as Energy Performance Patterns. Energy Sustain. Dev. 2019, 48, 115–129. [Google Scholar] [CrossRef]
- Rossi, F.; Cotana, F.; Coccia, V.; Pisello, A.L.; Bonamente, E.; Palombo, M.; Pignatta, G.; Morini, E. Modelling of Urban Canyon: Analytical and Experimental Remarks. In Proceedings of the 34th AIVC Conference “Energy Conservation Technologies for Mitigation and Adaptation in the Built Environment: The Role of Ventilation Strategies and Smart Materials”, Athens, Greece, 25–26 September 2013; National & Kapodistrian University of Athens: Athens, Greece, 2013; pp. 1190–1201, ISBN 978-2-930471-42-6. [Google Scholar]
- Grifoni, R.C.; Passerini, G.; Pierantozzi, M. Assessment of Outdoor Thermal Comfort and Its Relation to Urban Geometry. In Proceedings of the Sustainable Development and Planning 2013, Kos, Greece, 27–29 October 2013; WITPRESS: Southampton, UK, 2013; Volume 1, pp. 3–14. [Google Scholar]
- Lindberg, F. Modelling the urban climate using a local governmental geo-database. Meteorol. Appl. 2007, 14, 263–273. [Google Scholar] [CrossRef]
- Krüger, E.; Drach, P.; Emmanuel, R.; Corbella, O. Urban Heat Island and Differences in Outdoor Comfort Levels in Glasgow, UK. Theor. Appl. Climatol. 2013, 112, 127–141. [Google Scholar] [CrossRef]
- Scarano, M.; Mancini, F. Assessing the Relationship between Sky View Factor and Land Surface Temperature to the Spatial Resolution. Int. J. Remote Sens. 2017, 38, 6910–6929. [Google Scholar] [CrossRef]
- Sakar, B. Parametric Modelling for the Mitigation of Urban Heat Island Effect: A Model Proposal. Master’s Thesis, Middle East Technical University, Ankara, Turkey, 2018; pp. 7–57. [Google Scholar]
- Lamarca, C.; Qüense, J.; Henríquez, C. Thermal Comfort and Urban Canyons Morphology in Coastal Temperate Climate, Concepción, Chile. Urban Clim. 2018, 23, 159–172. [Google Scholar] [CrossRef]
- White, M.; Langenheim, N. Measuring Urban Canyons with Real-Time Light Based Sky View Factor Modelling. In Our Common Future in Urban Morphology. International Conference Proceedings Book. Proceedings of the ISUF 21st International Seminar on Urban Form, Porto, Portugal 3−6 July 2014; Universidade do Porto: Porto, Portugal, 2014; pp. 239–304. ISBN 978-972-99101-6-6. [Google Scholar]
- Levermore, G.; Cheung, H. A Low-Order Canyon Model to Estimate the Influence of Canyon Shape on the Maximum Urban Heat Island Effect. Build. Serv. Eng. Res. Technol. 2012, 33, 371–385. [Google Scholar] [CrossRef]
- Rezaei Rad, H.; Rafieiana, M. Evaluating the Effects of High Rise Building on Urban Heat Island by Sky View Factor: A Case Study of Narmak Neighborhood, Tehran. Naqshejahan 2016, 5, 13–22. [Google Scholar]
- Maharoof, N.; Emmanuel, R.; Thomson, C. Compatibility of Local Climate Zone Parameters for Climate Sensitive Street Design: Influence of Openness and Surface Properties on Local Climate. Urban Clim. 2020, 33, 100642. [Google Scholar] [CrossRef]
- Yuan, J.; Emura, K.; Farnham, C. Is Urban Albedo or Urban Green Covering More Effective for Urban Microclimate Improvement?: A Simulation for Osaka. Sustain. Cities Soc. 2017, 32, 78–86. [Google Scholar] [CrossRef]
- Giridharan, R.; Ganesan, S.; Lau, S.S.Y. Daytime Urban Heat Island Effect in High-Rise and High-Density Residential Developments in Hong Kong. Energy Build. 2004, 36, 525–534. [Google Scholar] [CrossRef]
- Krüger, E. Impact of Site-Specific Morphology on Outdoor Thermal Perception: A Case-Study in a Subtropical Location. Urban Clim. 2017, 21, 123–135. [Google Scholar] [CrossRef]
- Yin, S.; Yin, X. Research on the Impact of Traditional Urban Geometry on Outdoor Thermal Environment—Case Study of Neighbourhoods with Arcade Street in South China. In Learning, Adapting and Prototyping—Proceedings of the 23rd CAADRIA Conference, Beijing, China, 17–19 May 2018; Fukuda, F., Huang, W., Janssen, P., Crolla, K., Alhadidi, S., Eds.; Tsinghua University: Beijing, China; Volume 2, pp. 503–512.
- Lin, T.-P.; Ho, Y.-F.; Huang, Y.-S. Seasonal Effect of Pavement on Outdoor Thermal Environments in Subtropical Taiwan. Build. Environ. 2007, 42, 4124–4131. [Google Scholar] [CrossRef]
- ShengYue, W.; QiYang, Z.; YingNa, D.; PeiDong, S. Unidirectional Heat-Transfer Asphalt Pavement for Mitigating the Urban Heat Island Effect. J. Mater. Civ. Eng. 2014, 26, 812–821. [Google Scholar] [CrossRef]
- Taher, H.; Elsharkawy, H.; Newport, D. The Influence of Urban Green Systems on the Urban Heat Island Effect in London. IOP Conf. Ser. Earth Environ. Sci. 2019, 329, 012046. [Google Scholar] [CrossRef] [Green Version]
- Li, H.; Harvey, J.; Kendall, A. Field Measurement of Albedo for Different Land Cover Materials and Effects on Thermal Performance. Build. Environ. 2013, 59, 536–546. [Google Scholar] [CrossRef]
- Tsoka, S.; Theodosiou, T.; Tsikaloudaki, K.; Flourentzou, F. Modeling the Performance of Cool Pavements and the Effect of Their Aging on Outdoor Surface and Air Temperatures. Sustain. Cities Soc. 2018, 42, 276–288. [Google Scholar] [CrossRef]
- Lin, J.D.; Hsu, C.Y.; Citraningrum, A.; Adhitana, P. The Impact of Different Types of Permeable Pavement Utilization on Air Temperature above the Pavement. Adv. Mater. Res. 2013, 723, 678–685. [Google Scholar] [CrossRef]
- Sanusi, R.; Johnstone, D.; May, P.; Livesley, S.J. Street Orientation and Side of the Street Greatly Influence the Microclimatic Benefits Street Trees Can Provide in Summer. J. Environ. Qual. 2016, 45, 167–174. [Google Scholar] [CrossRef] [Green Version]
- Erell, E.; Williamson, T. Intra-urban Differences in Canopy Layer Air Temperature at a Mid-latitude City. Int. J. Climatol. J. R. Meteorol. Soc. 2007, 27, 1243–1255. [Google Scholar] [CrossRef]
- Ortiz, A.; Cariolet, J.-M.; Colombert, M.; Becue, V. Role of Vegetation, Urban Morphology and Building Rise in Air Quality and Urban Heat Island: Simulations in Five Parisian Neighborhoods. In Proceedings of the ICUC9-9th International Conference on Urban Climate Jointly with 12th Symposium on the Urban Environment, Toulouse, France, 20–24 July 2015; pp. 1–5. [Google Scholar]
- Henon, A.; Lagouarde, J.P.; Mestayer, P.; Groleau, D. High Resolution Surface Temperature and Urban Thermal Anisotropy Simulations: Validation against Airborne Remote Sensing TIR Data over Toulouse City (France). In Proceedings of the 8th AMS Symposium on Urban Environment (Poster Session), Boston, MA, USA, 12–16 January 2020; American Meteorological Society: Phoenix, AZ, USA, 2009. [Google Scholar]
- Bonamente, E.; Rossi, F.; Coccia, V.; Pisello, A.L.; Nicolini, A.; Castellani, B.; Cotana, F.; Filipponi, M.; Morini, E.; Santamouris, M. An Energy-Balanced Analytic Model for Urban Heat Canyons: Comparison with Experimental Data. Adv. Build. Energy Res. 2013, 7, 222–234. [Google Scholar] [CrossRef]
- Montávez, J.P.; Jiménez, J.I.; Sarsa, A. A Monte Carlo Model of The Nocturnal Surface Temperatures in Urban Canyons. Bound.-Layer Meteorol. 2000, 96, 433–452. [Google Scholar] [CrossRef] [Green Version]
- Zakšek, K.; Oštir, K. Downscaling Land Surface Temperature for Urban Heat Island Diurnal Cycle Analysis. Remote Sens. Environ. 2012, 117, 114–124. [Google Scholar] [CrossRef]

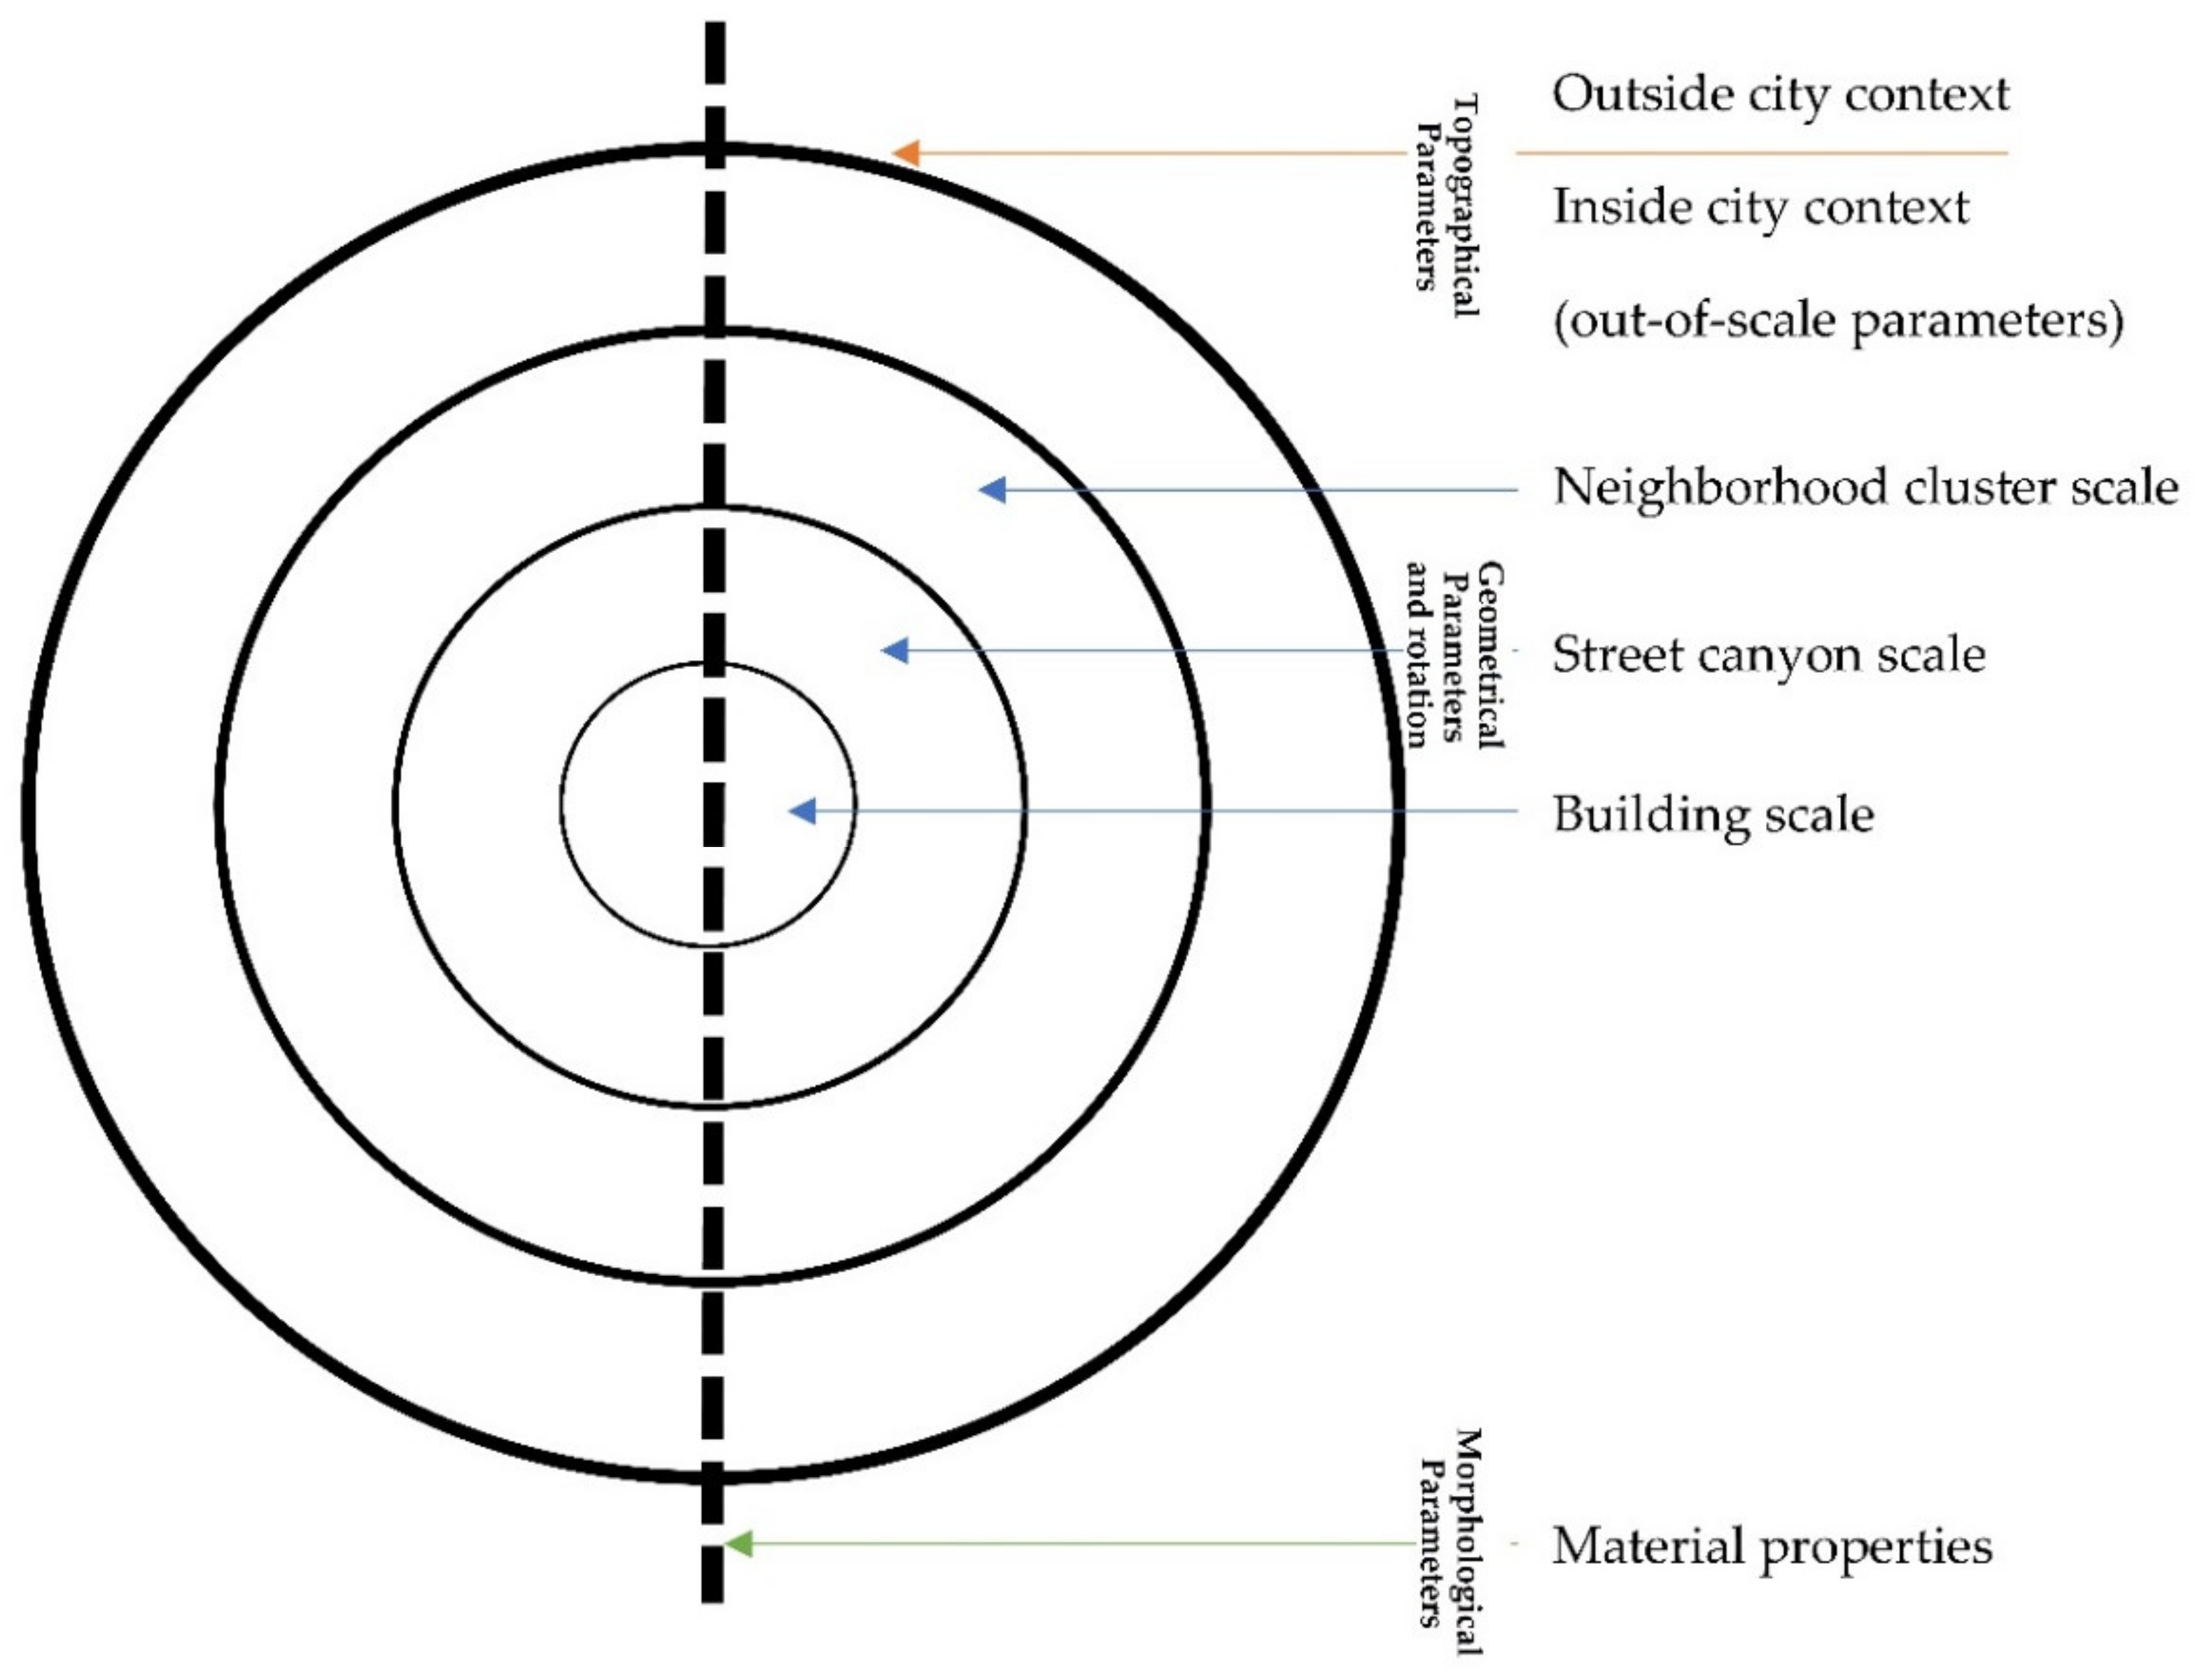


| BGI Structure | Parameter Family | Dominant Parameter |
|---|---|---|
| Water structure | Geometrical | Area |
| Morphological | Degree of vegetation along the bank | |
| Topographical | Wind exposure (trend of cold transfer) | |
| Green area | Geometrical | Area |
| Morphological | Percentage of an area covered by trees | |
| Topographical | Exposure to solar radiation/degree of shading by surrounding structures | |
| Greenery along the street | Geometrical | Tree crown width/diameter |
| Morphological | Leaf size/leaf area index (LAI) | |
| Topographical | Canyon geometry/height/width | |
| Green roof | Geometrical | Substrate layer thickness |
| Morphological | Degree of hydration/moisture of the substrate | |
| Topographical | Height of structure above the ground/distance from the nearest BGI (synergy) | |
| Green wall | Geometrical | Degree of vegetation coverage of a building/the extent of the green wall |
| Morphological | Leaf width/leaf area/foliage density/LAI | |
| Topographical | Orientation relative to the sun |
| Author | Title | Usefulness for Creating Design Guidelines |
|---|---|---|
| [93] | Street geometry factors influence urban microclimate in tropical coastal cities: a review | Identify the impact of street geometric, morphologic, and topographic factors and explain water body effects on urban microclimate. The study was conducted only for tropical coastal cities. |
| [94] | Urban design parameters for heat mitigation in tropics | Focus on heat mitigation strategies, with the use of modifications and urban geometry (shading), urban greening (street greenery, parks, green walls, green roofs), urban ventilation (street orientation), albedo, and water bodies area. Case studies only from the tropics. |
| [95] | Street design and urban microclimate: analyzing the effects of street geometry and orientation on airflow and solar access in urban canyons | Discussion about street geometry factors and street topography (orientation), mainly focusing on parameters providing solar access and airflow along streets. Hot climate regions case studies. |
| [96] | The impact of urban design descriptors on outdoor thermal environment: a literature review | Design strategies based on parameters: canyon geometry and topography, land-use intensity, building form and materials, space enclosure, and urban vegetation. The research focused on street scale urban thermal comfort. In addition, it considered the synergy of most climate zones case studies. |
| [97] | A parametric approach to optimizing urban form, energy balance, and environmental quality: the case of Mediterranean districts | The paper lists building and street form design parameters: shape factor, floor area ratio (FAR), site coverage, orientation, sky view factor (SVF), aspect ratio (H/W), the distance between buildings, and average building height. Case studies from different climate zones. |
| [98] | Review of the impact of urban block form on thermal performance, solar access, and ventilation | The research discussed urban blocks’ geometrical parameters impact and buildings’ geometrical and topographical parameters. It is focused on solar access and ventilation. Case studies from different climate zones. |
| [31] | A review on the generation, determination, and mitigation of the UHI | List case studies for UHI mitigation strategies based on urban matter parameters alteration: albedo, air conditioner occurrence, building design, water bodies. Case studies from different climate zones. |
| [99] | A review on outdoor thermal comfort evaluation for building arrangement parameters | Building Arrangement Parameters for the densely built area impact the outdoor thermal comfort. Parameters listed in a review include SVF, H/W, building height, plot size, pavement cover ratio, green plot ratio, vehicle traffic density, building density. Cases from different climate zones. |
| [100] | Overview of the UHI phenomenon toward human thermal comfort | Lists building and street design parameters such as albedo, imperviousness, canyon openness, glazing ratio, H/W ratio, type of material, heat conductivity, orientation. There are examples from different climate zones. |
| [101] | The influence of building height variability on natural ventilation and neighbor buildings in dense urban areas | Focus only on the influence of building height and dense urban areas. Case studies form different climate zones. |
| [102] | Reducing urban heat island effects: a systematic review to achieve energy consumption balance | The paper considered different types of green spaces and material properties based on parameters (incl. albedo) as a design strategy for UHI mitigation. |
| [103] | Combating urban heat island effect: a review of reflective pavements and tree shading strategies | The strategies focused on applying chip seals, white toppings, and coatings were discussed. In addition, the role of surface reflectance, including those from asphalt and concrete pavements, albedo improvements and technological trends, application of waste materials, and industrial by-products, are presented. Finally, the contribution of urban tree shading systems to pavement temperature and microclimate systems is presented. |
| [104] | Thermal performance of cooling strategies for asphalt pavement: a state-of-the-art review | The authors show how alternating road material thermophysical properties throughout the material mix and treating changes can affect thermal comfort in cities. They describe the role of vegetation in cooling strategies. Case studies from different climate zones. |
| [105] | Urban heat island: causes, consequences, and mitigation measures with emphasis on reflective and permeable pavements | The paper focuses on reflective and permeable pavements and lists road and pavement morphologic parameters: material density, albedo, emissivity, heat capacity, thermal conductivity, thermal diffusivity, thermal admittance. Case studies from different climate zones. |
| [106] | Cool pavements for urban heat island mitigation: a synthetic review | Investigating the efficiency of reflective and permeable pavement as the UHI control elements. The USA case studies from different climate zones. |
| [107] | Sustainable pavement: a review on the usage of pavement as a mitigation strategy for UHI | Short description of the UHI mitigation strategies: green and blue surfaces, cool roofs, cool pavements (reflectivity, evaporation rate, permeability, porosity, water content, and heat conduction). Case studies from different climate zones. |
| [108] | Review of studies on outdoor thermal comfort in warm, humid climates: challenges of the informal urban fabric | The paper describes the parameters’ influence on outdoor thermal comfort: canyon axis orientation, SVF, H/W. Studies only for warm and humid climates. |
| UE Structure | Parameter Family | Dominant Parameter | Number of Reports in Scientific Papers | Percentage |
|---|---|---|---|---|
| Neighborhood cluster (NH) | 380 | 100 | ||
| Geometrical parameters | 277 | 72.3 | ||
| Building density (BD) | 76 | - | ||
| Morphological parameters | 82 | 21.4 | ||
| Urban surface albedo (WAS) | 24 | - | ||
| Topographical parameters | 24 | 6.3 | ||
| Distance from the city center (CBD) | 6 | - | ||
| Street canyon (SC) | 398 | 100 | ||
| Geometrical parameters | 234 | 58.1 | ||
| Aspect ratio | 88 | - | ||
| Morphological parameters | 111 | 27.5 | ||
| Ground surface albedo | 25 | - | ||
| Topographical parameters | 58 | 14.4 | ||
| Street orientation | 50 | - | ||
| Building (BU) | 230 | 100 | ||
| Geometrical parameters | 80 | 34.8 | ||
| Building height (BH) | 55 | - | ||
| Morphological parameters | 128 | 55.7 | ||
| Material albedo | 40 | - | ||
| Topographical parameters | 22 | 9.5 | ||
| Building orientation (O) | 12 | - |
| Number of Variables | 9 | ||
|---|---|---|---|
| Number of Rejected Variables | 1 | ||
| Number of Permutations | 9999 | ||
| Parameter Family 1 | p-Value | F-Value | % Expl. |
| NH-Geom | 0.001 | 25.69 | 12.63 |
| SC-Geom | 0.001 | 21.08 | 10.22 |
| BU-Morph | 0.001 | 19.36 | 10.79 |
| SC-Morph | 0.002 | 15.23 | 8.66 |
| SC-Topo | 0.003 | 13.56 | 7.66 |
| NH-Morph | 0.005 | 10.49 | 6.15 |
| BU-Geom | 0.012 | 7.36 | 5.33 |
| BU-Topo | 0.028 | 5.88 | 5.07 |
Publisher’s Note: MDPI stays neutral with regard to jurisdictional claims in published maps and institutional affiliations. |
© 2022 by the authors. Licensee MDPI, Basel, Switzerland. This article is an open access article distributed under the terms and conditions of the Creative Commons Attribution (CC BY) license (https://creativecommons.org/licenses/by/4.0/).
Share and Cite
Antoszewski, P.; Krzyżaniak, M.; Świerk, D. The Future of Climate-Resilient and Climate-Neutral City in the Temperate Climate Zone. Int. J. Environ. Res. Public Health 2022, 19, 4365. https://doi.org/10.3390/ijerph19074365
Antoszewski P, Krzyżaniak M, Świerk D. The Future of Climate-Resilient and Climate-Neutral City in the Temperate Climate Zone. International Journal of Environmental Research and Public Health. 2022; 19(7):4365. https://doi.org/10.3390/ijerph19074365
Chicago/Turabian StyleAntoszewski, Patryk, Michał Krzyżaniak, and Dariusz Świerk. 2022. "The Future of Climate-Resilient and Climate-Neutral City in the Temperate Climate Zone" International Journal of Environmental Research and Public Health 19, no. 7: 4365. https://doi.org/10.3390/ijerph19074365