
The Effects of Urban Neighborhood Environmental Evaluation and Health Service Facilities on Residents’ Self-Rated Physical and Mental Health: A Comparative and Empirical Survey


 ,
,
Abstract
:1. Introduction
1.1. Literature Review
1.1.1. Analysis of SRH and Influencing Factors
1.1.2. Urban Neighborhood Environment and Health
1.1.3. Health Service Facilities and SRH
1.2. Theoretical Framework
2. Methods
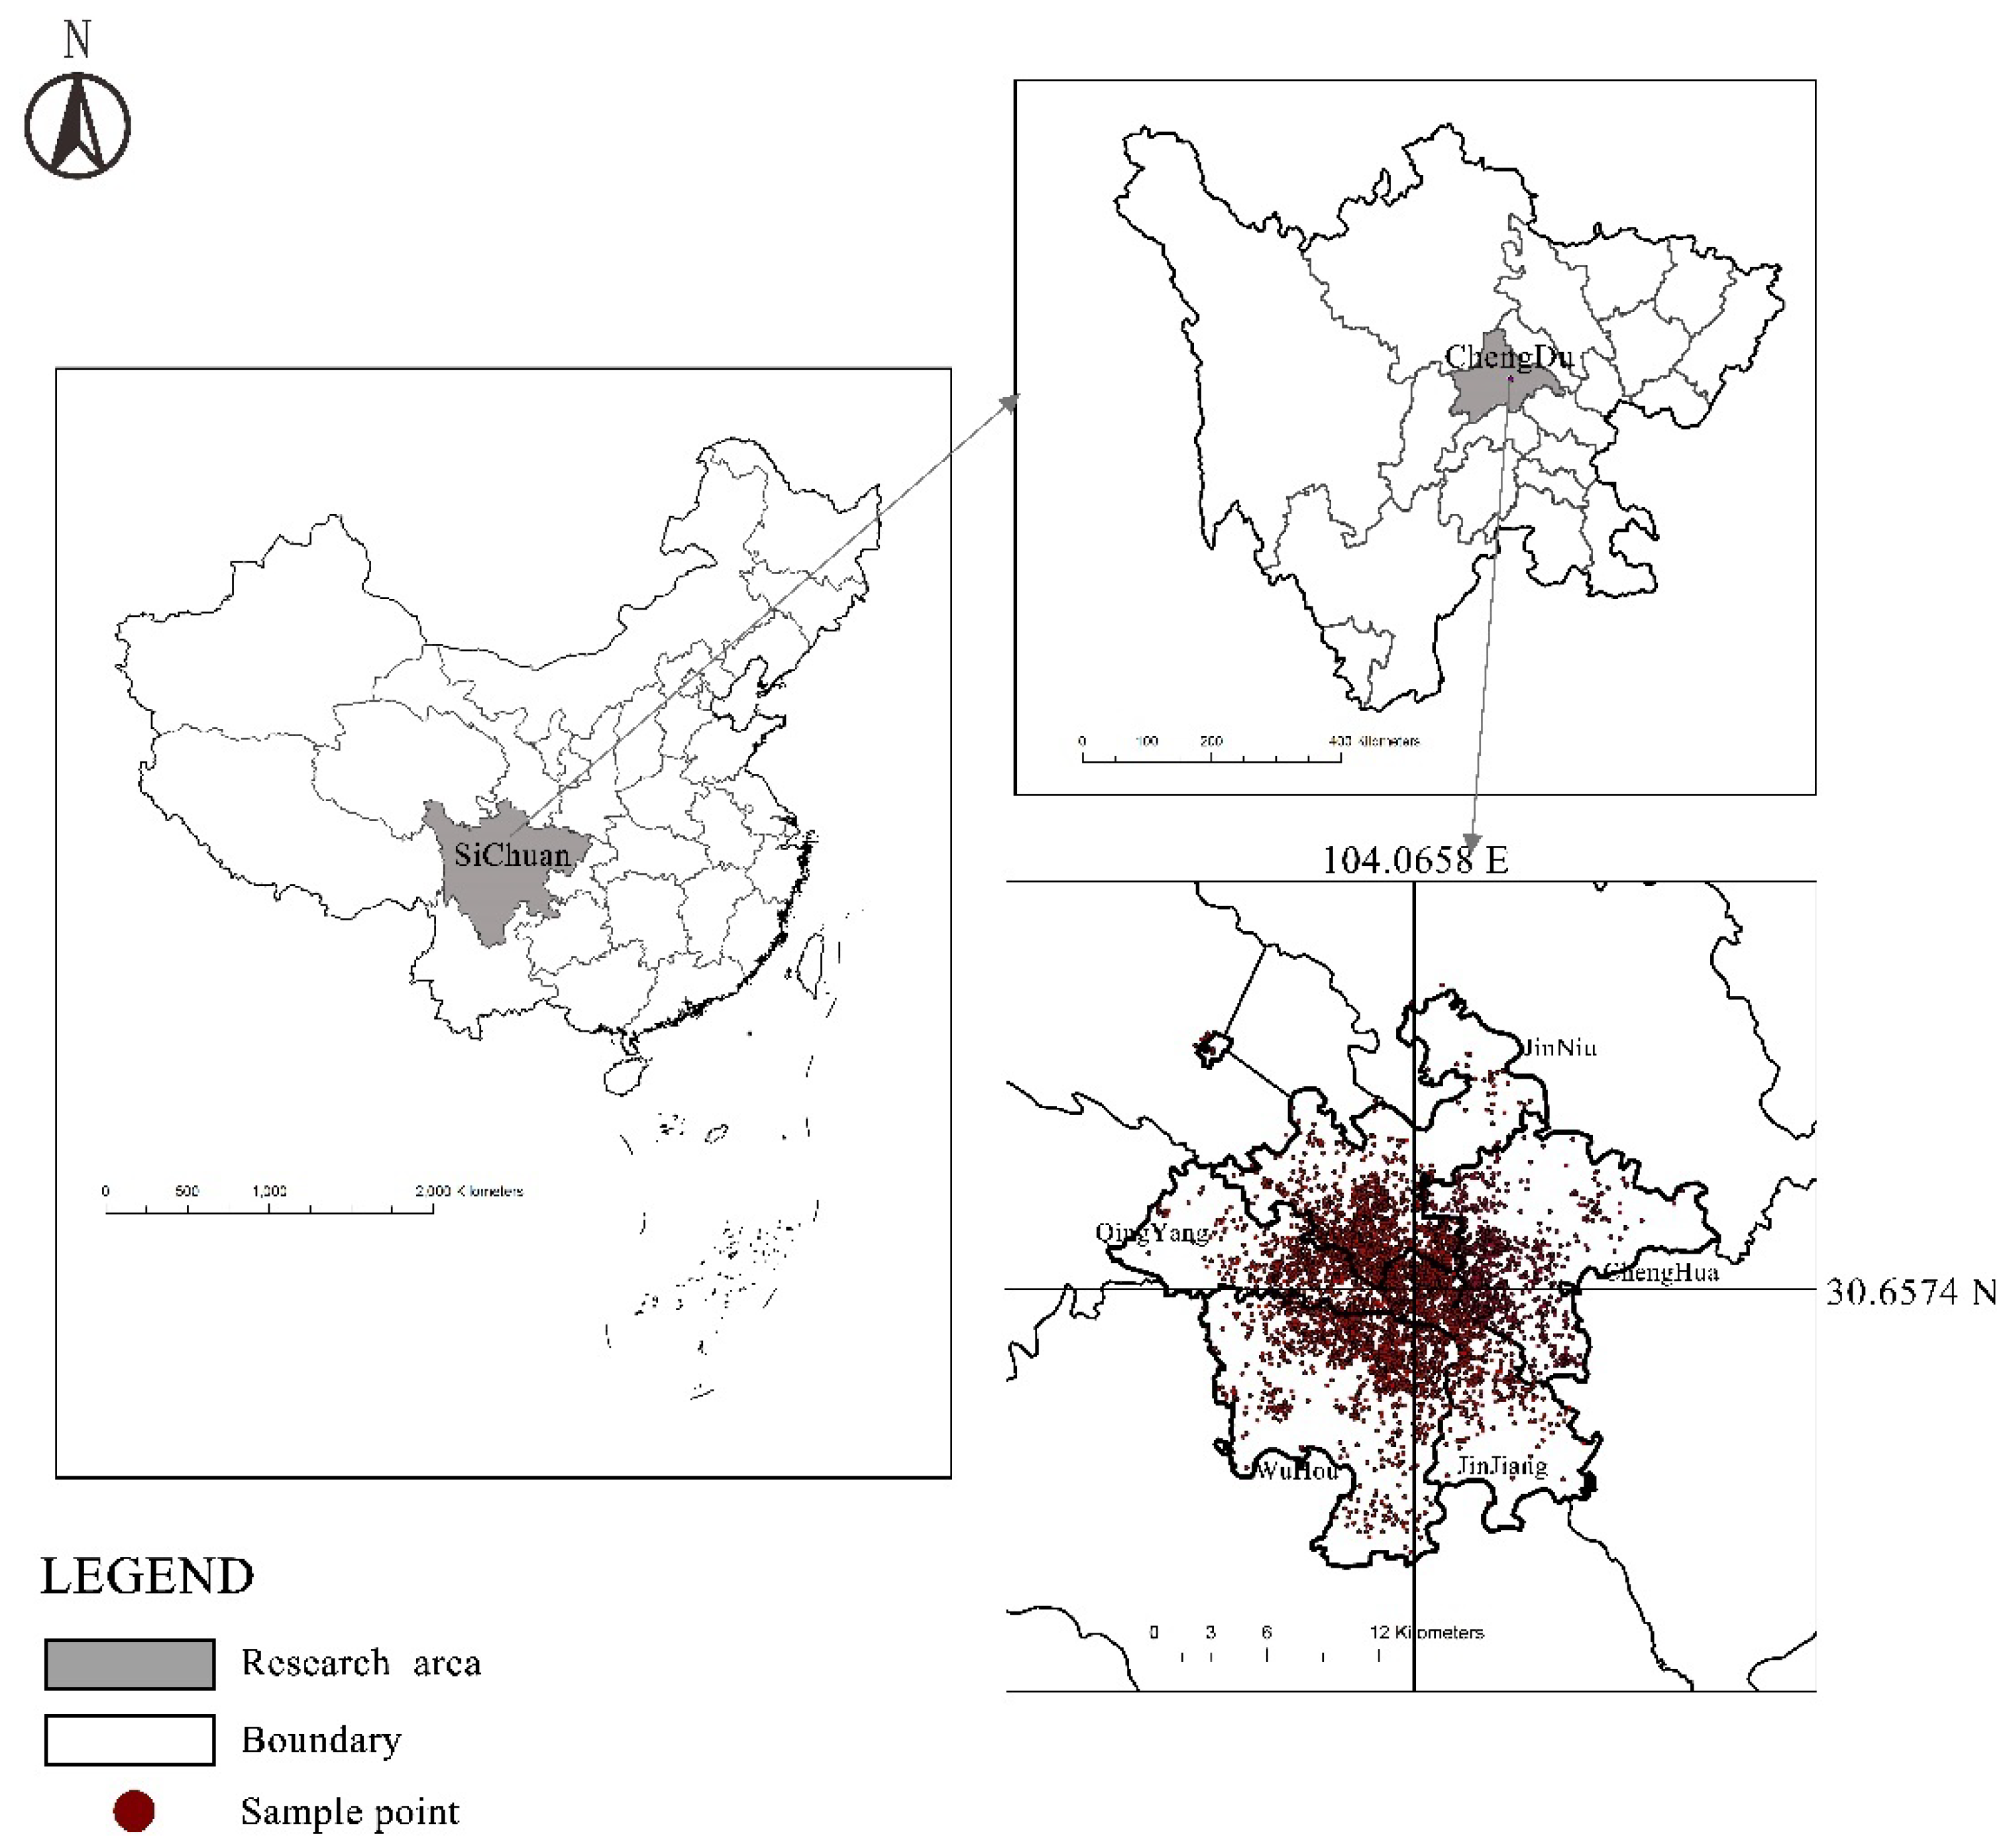
2.1. Study Area
2.2. Data Collection
2.3. Variables Analyzed
2.3.1. Dependent Variable
- (1)
- SRPH
- (2)
- SRMH
2.3.2. Independent Variables Related to Neighborhood Environment
Individual Characteristics
Neighborhood Environmental Evaluation
2.4. Statistical Analysis
3. Results
3.1. Descriptive Statistical Results
3.1.1. SRH Outcomes in Populations with Different Socio-Demographic Characteristics
3.1.2. Analysis of Neighborhood Environmental Evaluation
3.2. Associations between Neighborhood Environment Characteristics and SRH Outcomes
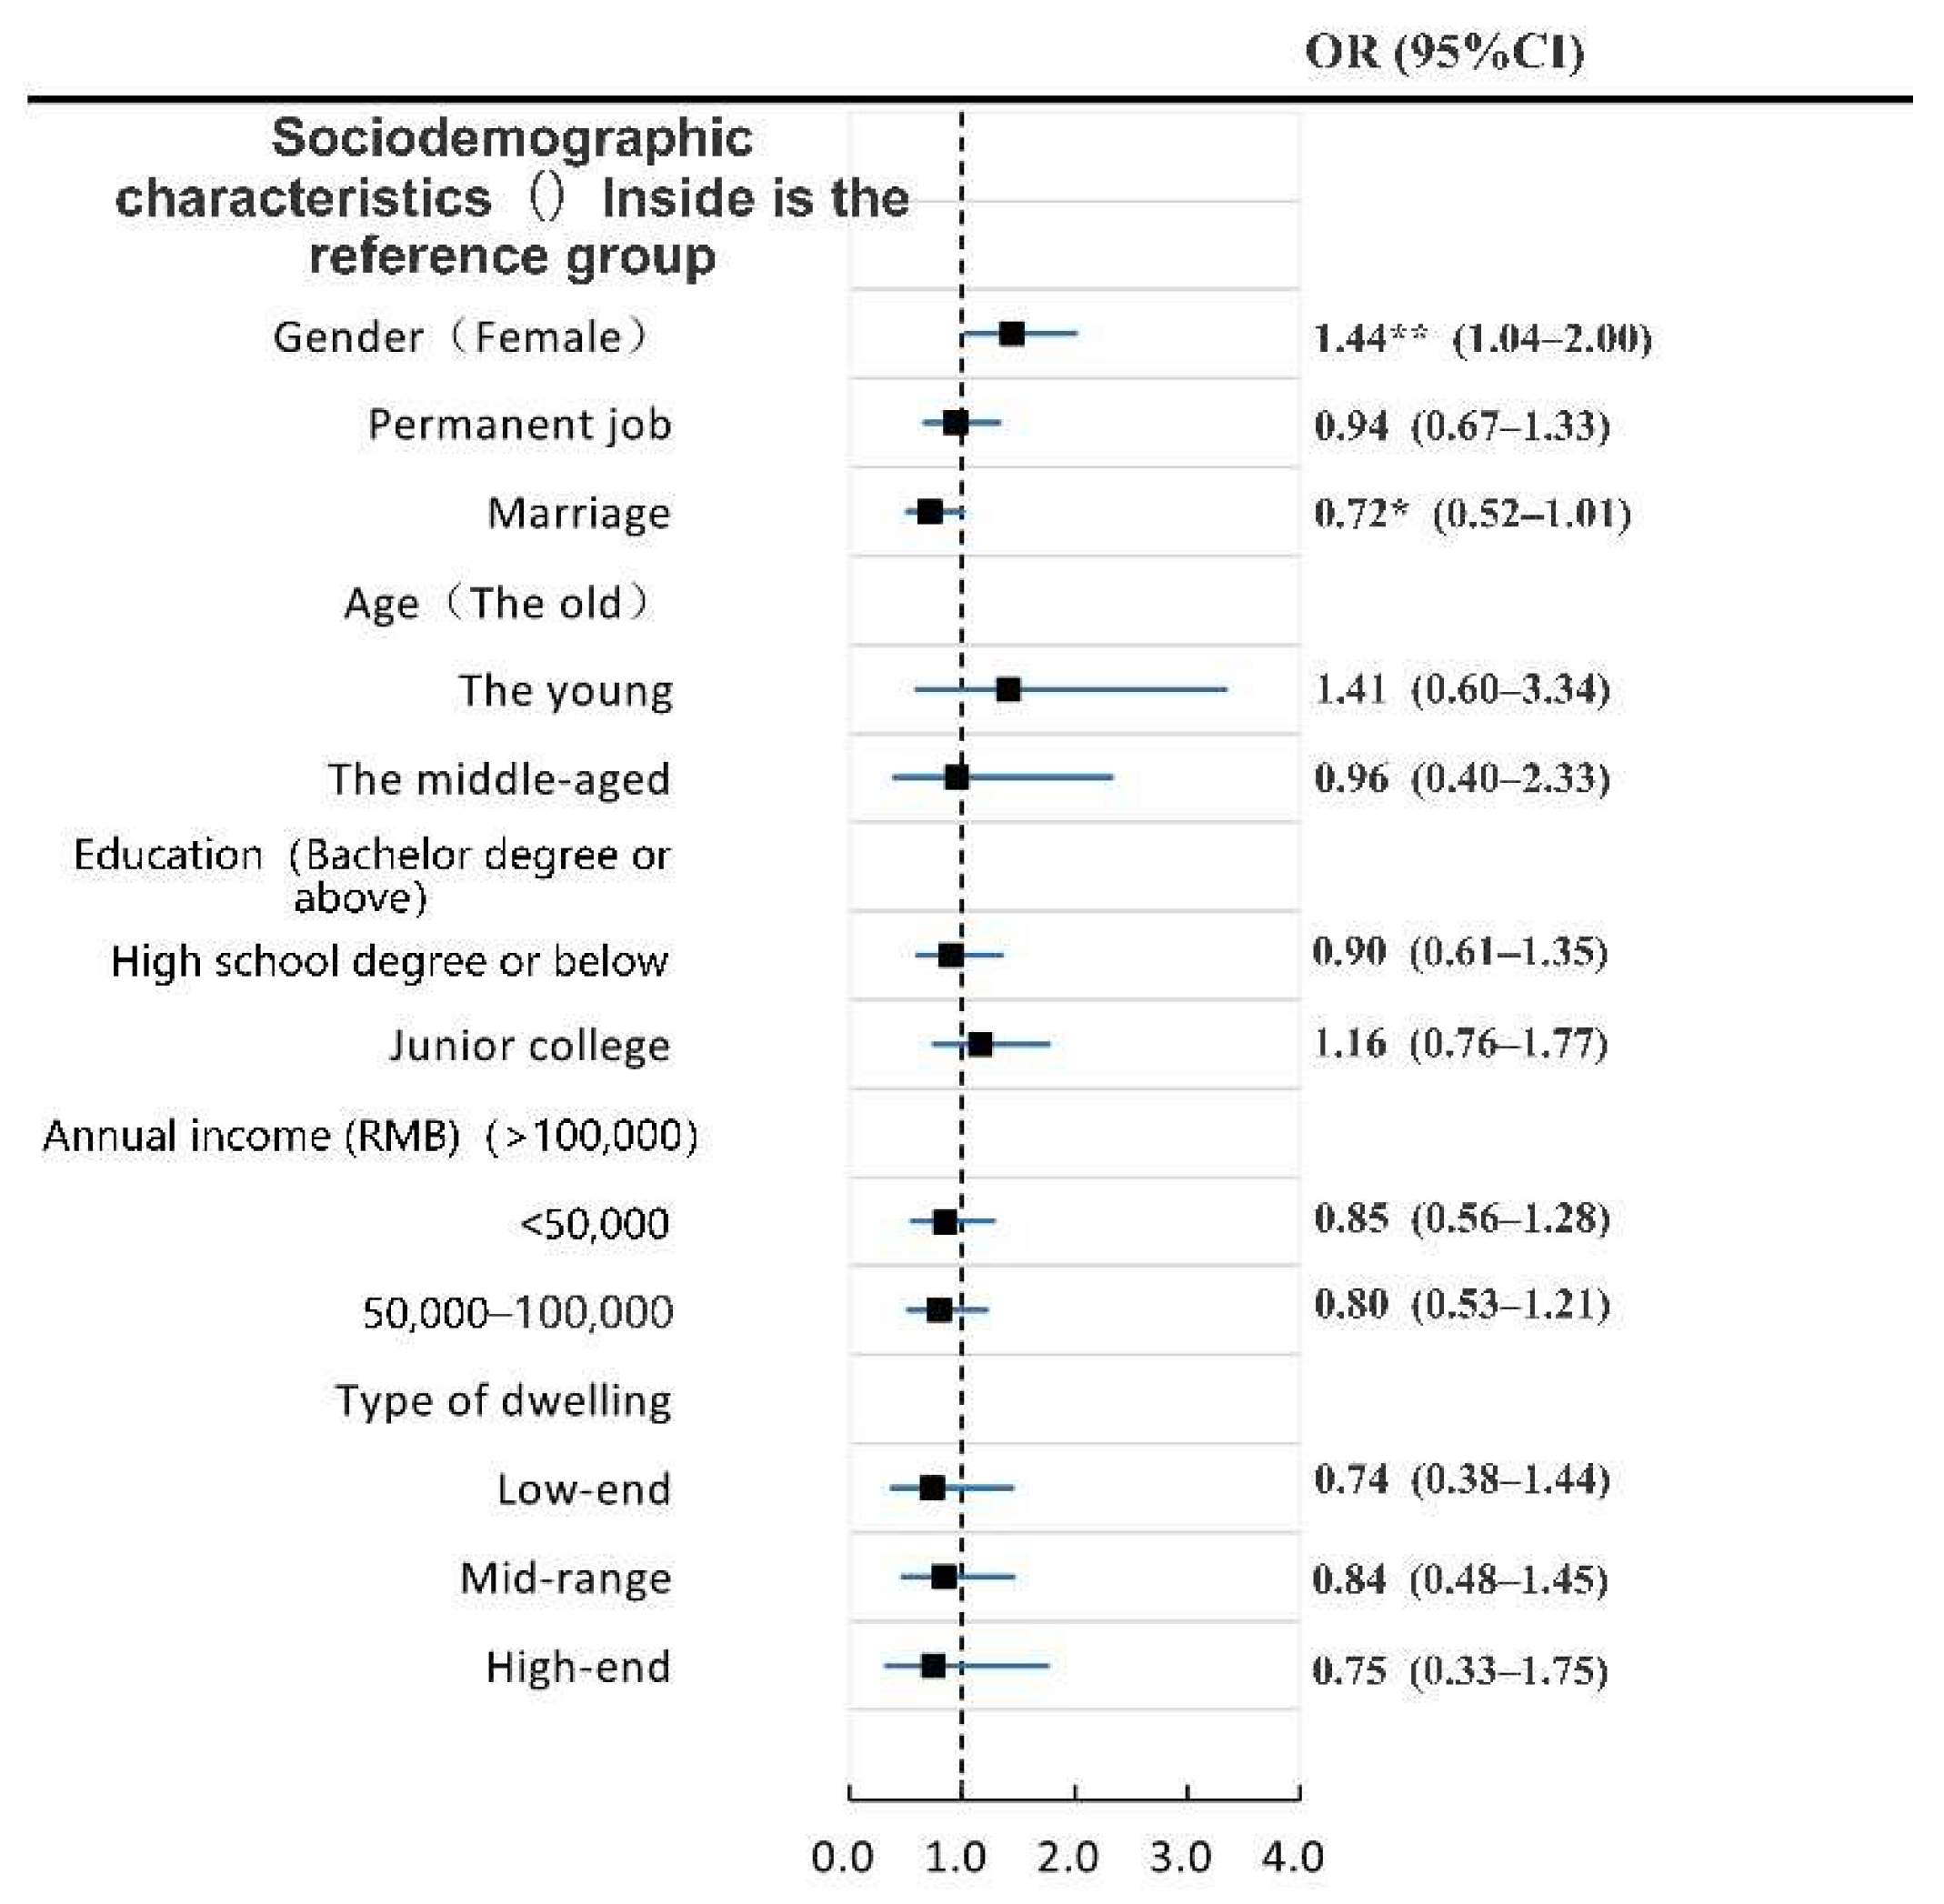
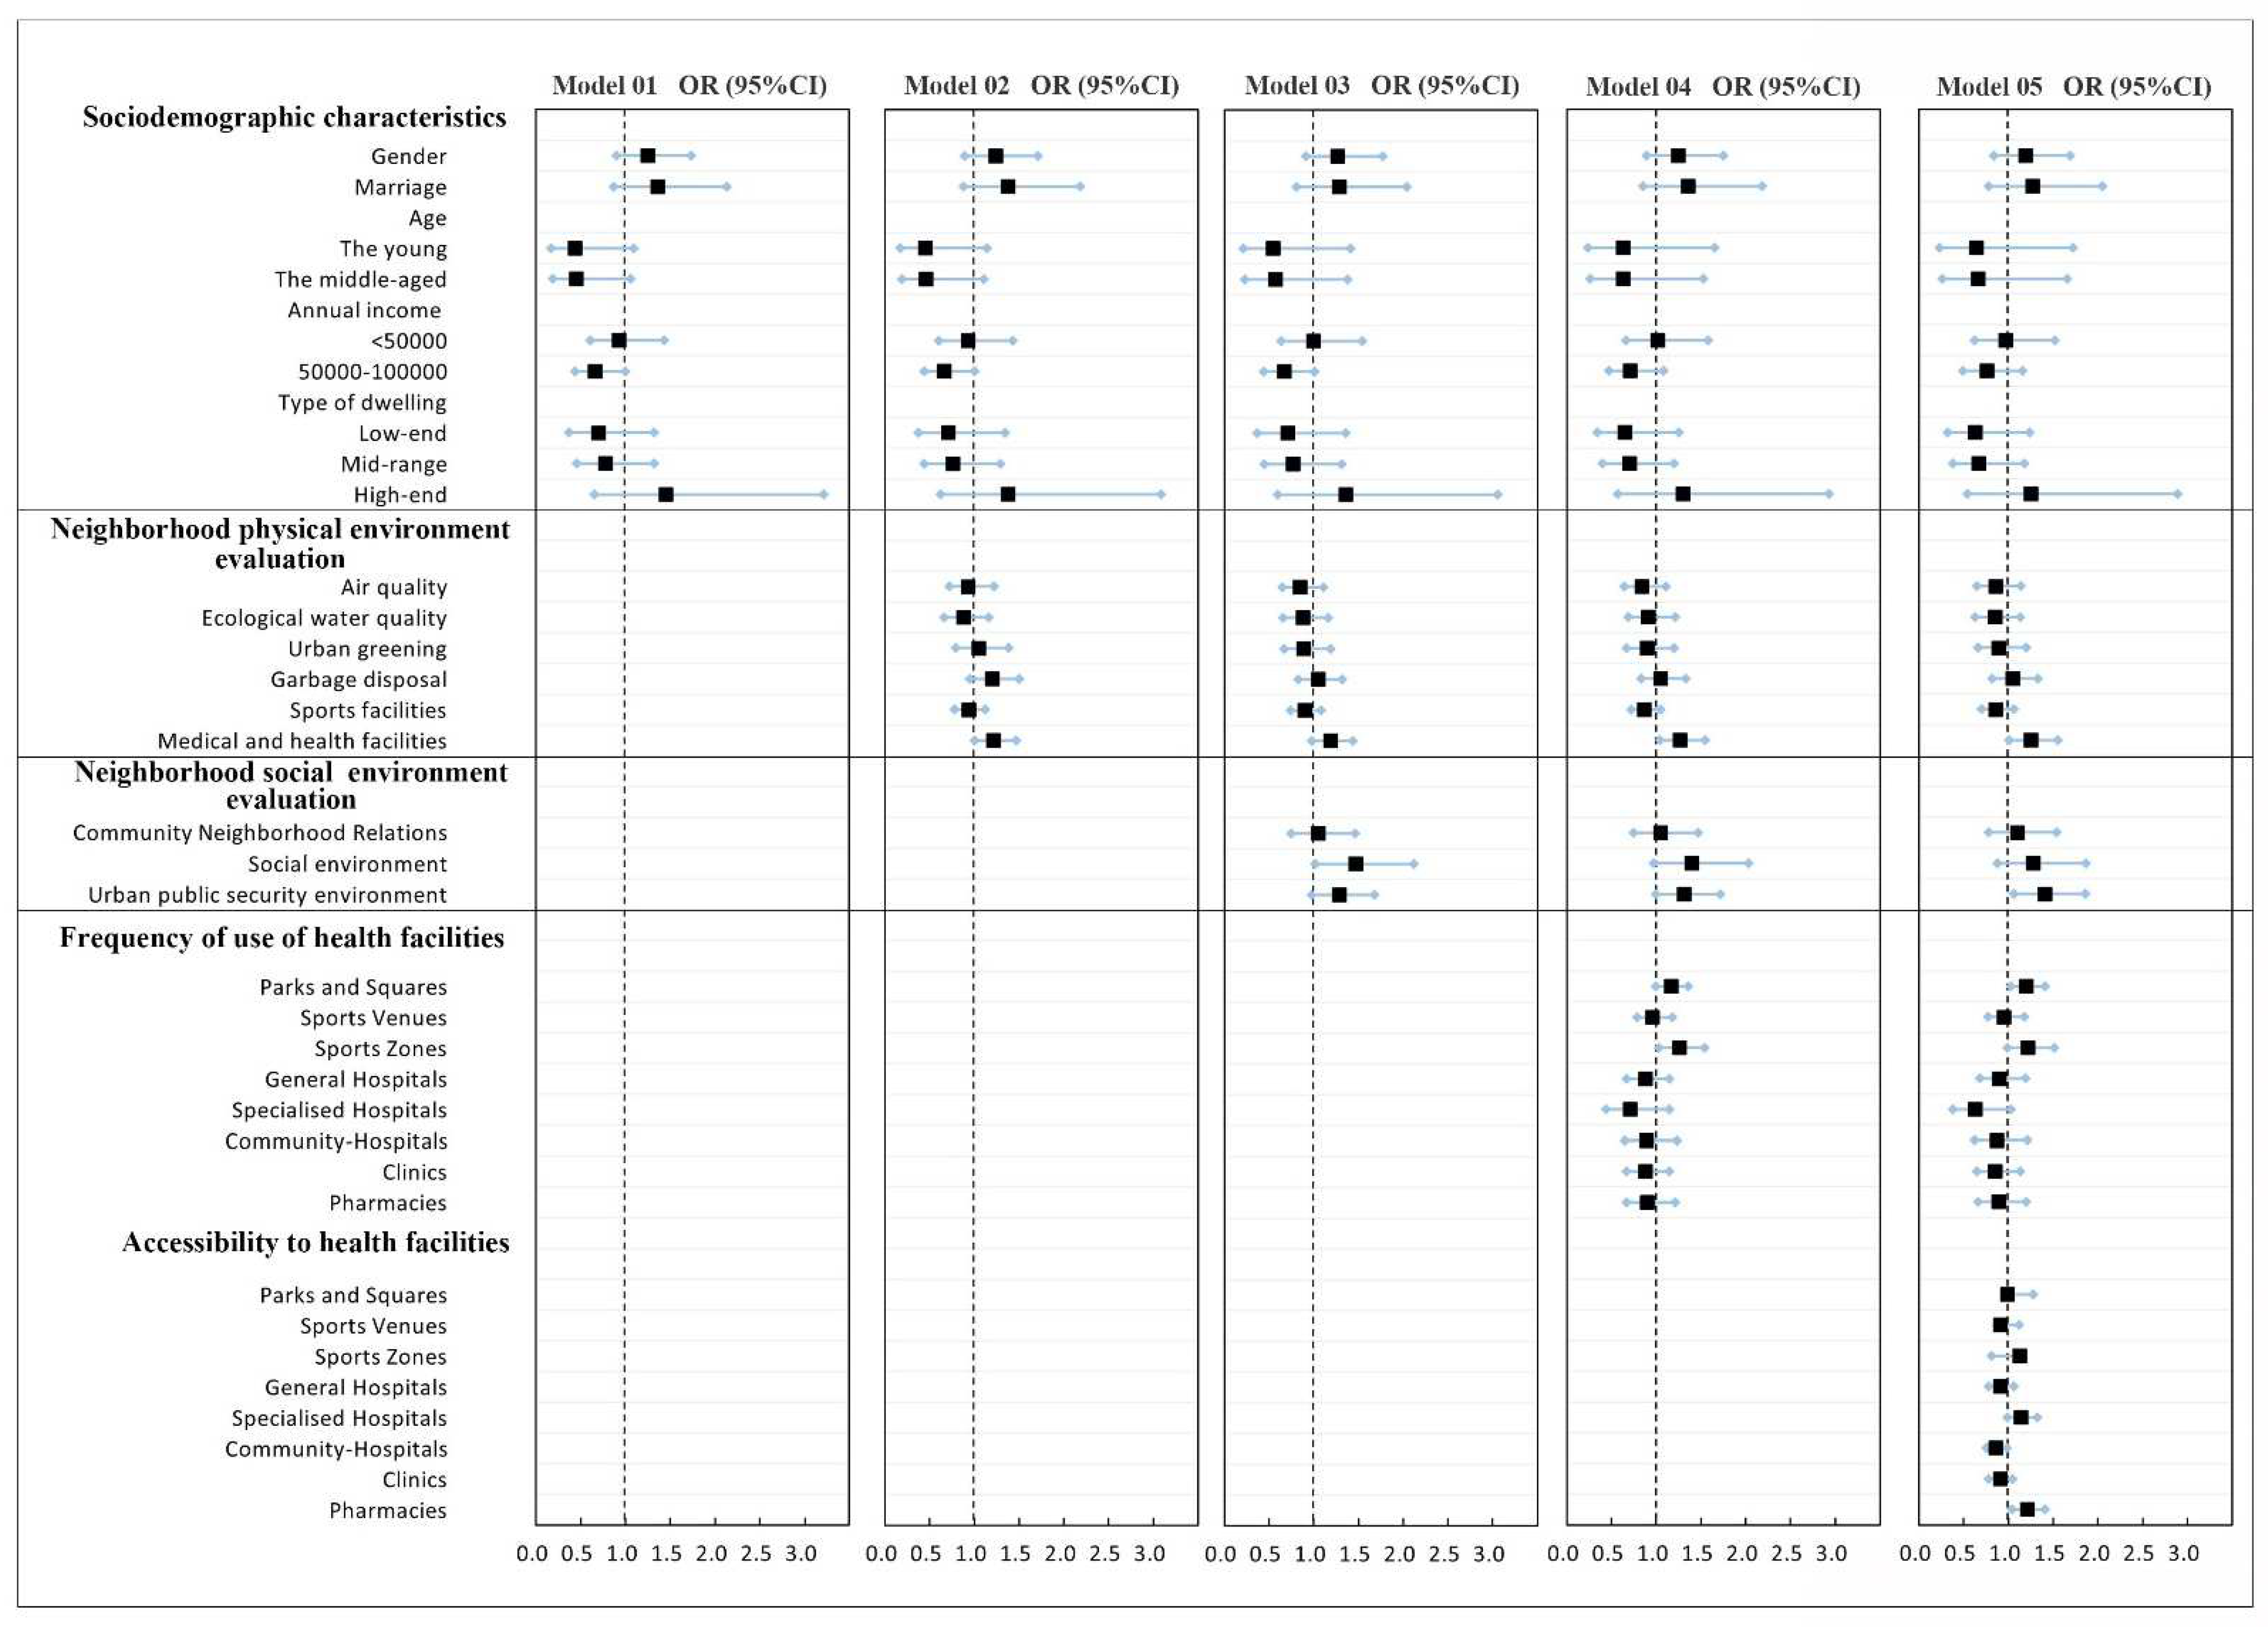
3.2.1. Analysis of the Influencing Factors of SRPH
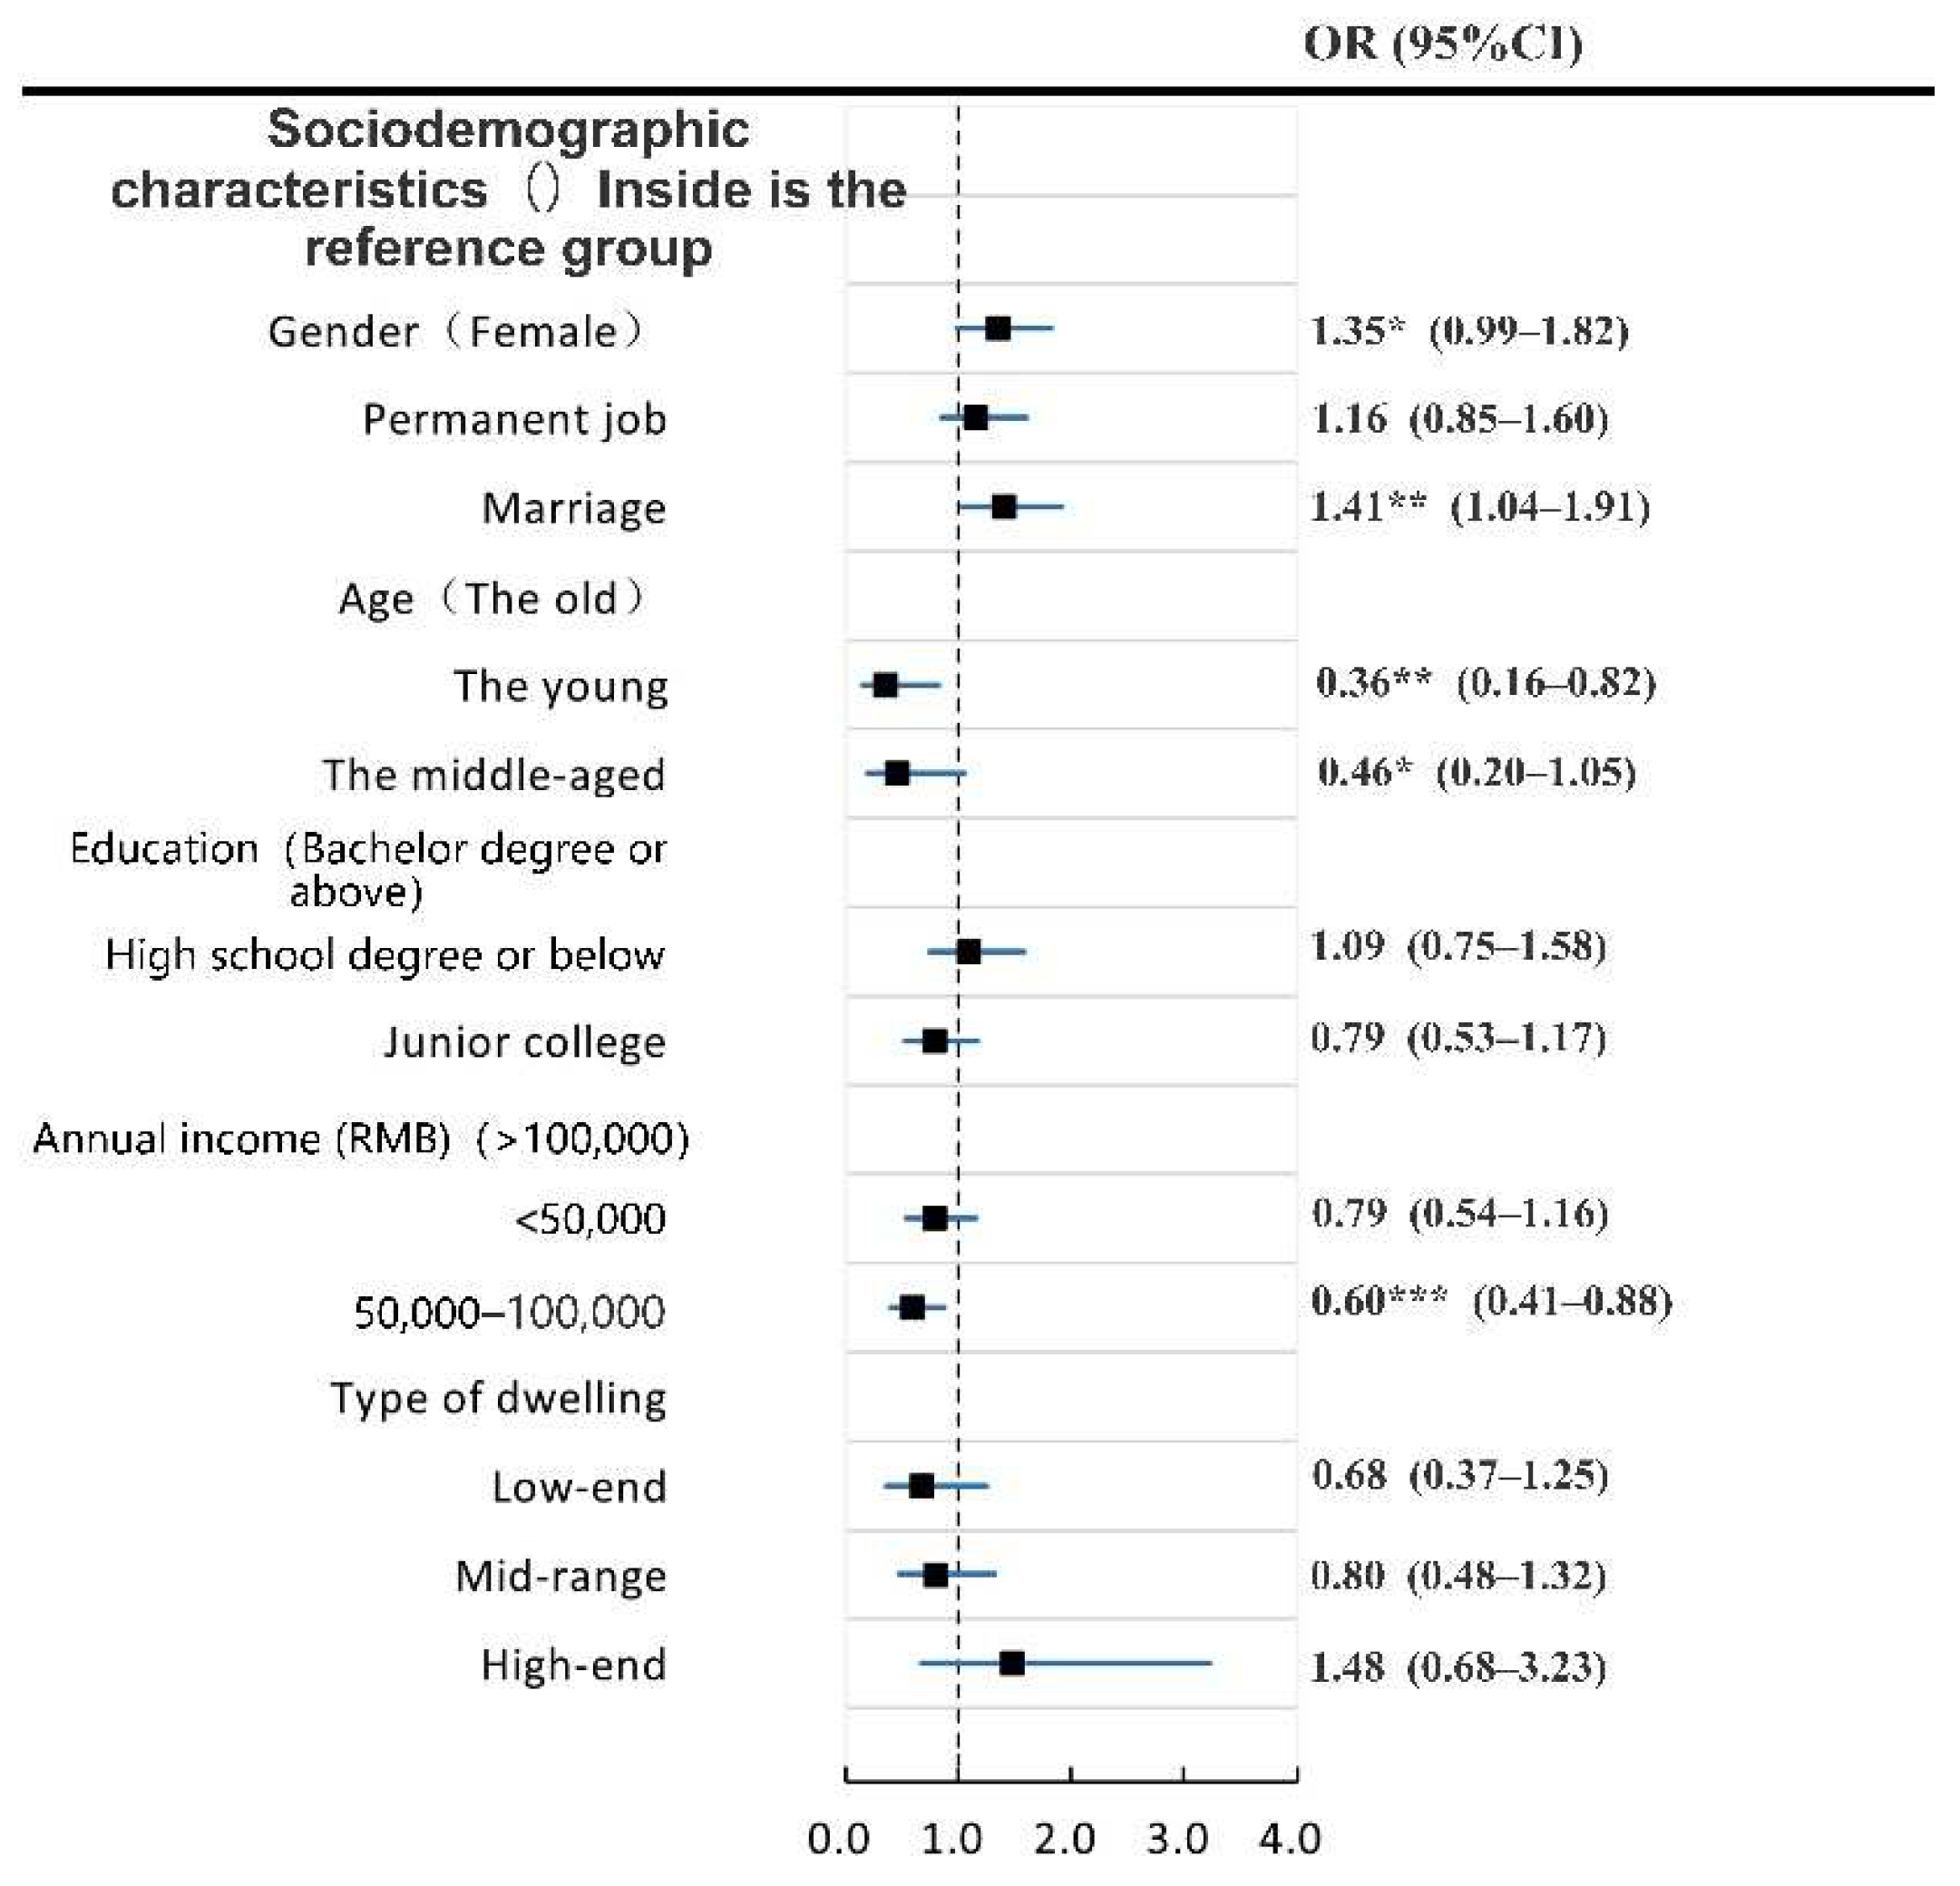
3.2.2. Influencing Factors of SRMH
3.2.3. Similarities and Differences of Factors Affecting SRMH and SRPH
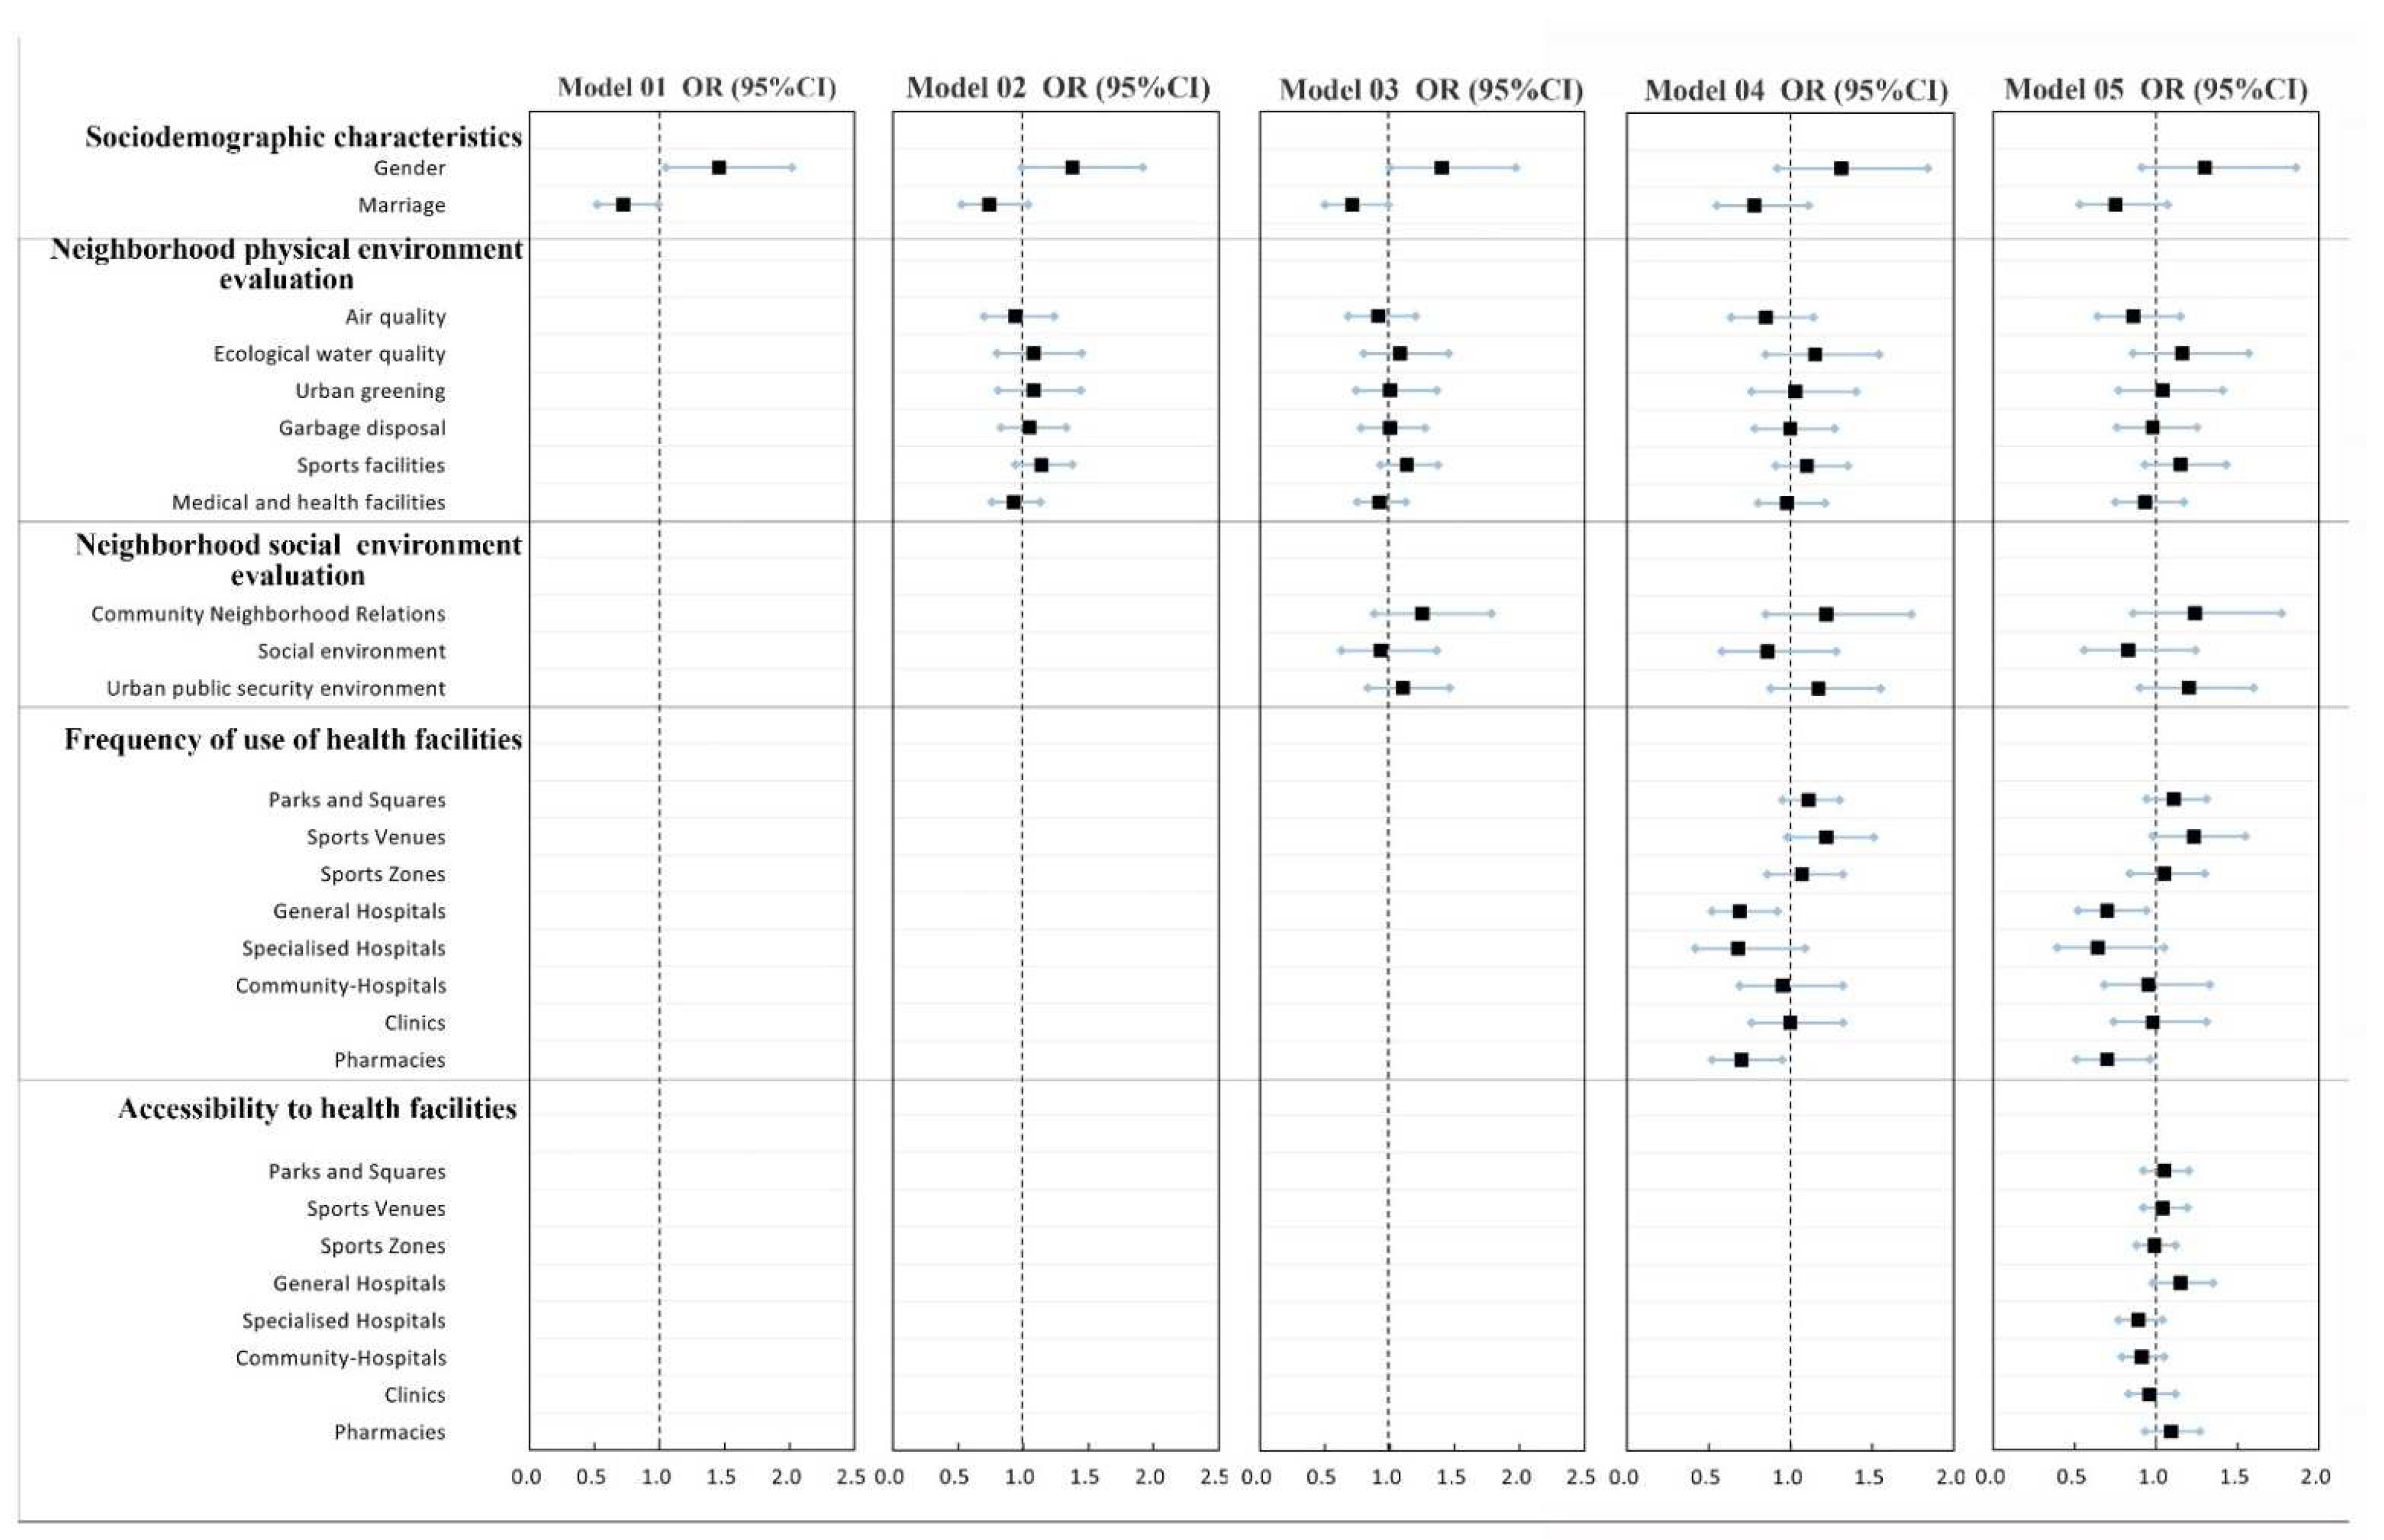
3.3. Actual and Perceived Accessibility of Health Facilities Have Different Effects on SRH
4. Discussion
4.1. Significant Differences Occur in the Effects of Socio-Demographic Characteristics on SRH
4.2. Neighborhood Environment, Health Service Facilities, and Other Factors Jointly Affect the Results of Residents’ SRH
4.2.1. Future Planning Should Pay More Attention to the Creation of a Social Environment in the Community
4.2.2. Frequency of Use and Accessibility of Health Service Facilities Play an Important Role in the Influencing Factors of SRH
4.3. Actual Accessibility of Health Services near Settlements Should Be Considered More Seriously
4.4. Strengths and Limitations
5. Conclusions
Supplementary Materials
Author Contributions
Funding
Institutional Review Board Statement
Informed Consent Statement
Data Availability Statement
Acknowledgments
Conflicts of Interest
References
- Bai, X.; Nath, I.; Capon, A.; Hasan, N.; Jaron, D. Health and wellbeing in the changing urban environment: Complex challenges, scientific responses, and the way forward. Curr. Opin. Environ. Sustain. 2012, 4, 465–472. [Google Scholar] [CrossRef] [Green Version]
- Vincens, N.; Emmelin, M.; Stafström, M. The interplay of contextual layers: A multilevel analysis of income distribution, neighborhood infrastructure, socioeconomic position and self-rated health in Brazil. Health Place 2018, 52, 155–162. [Google Scholar] [CrossRef] [PubMed]
- Krefis, A.; Augustin, M.; Schlünzen, K.; Oßenbrügge, J.; Augustin, J. How Does the Urban Environment Affect Health and Well-Being? A Systematic Review. Urban Sci. 2018, 2, 21. [Google Scholar] [CrossRef] [Green Version]
- Wen, M.; Hawkley, L.C.; Cacioppo, J.T. Objective and perceived neighborhood environment, individual SES and psychosocial factors, and self-rated health: An analysis of older adults in Cook County, Illinois. Soc. Sci. Med. 2006, 63, 2575–2590. [Google Scholar] [CrossRef] [PubMed]
- Wilkinson, R.G.; Pickett, K.E. Income inequality and population health: A review and explanation of the evidence. Soc. Sci. Med. 2006, 62, 1768–1784. [Google Scholar] [CrossRef] [PubMed]
- Kaplan, G.A.; Camacho, T. Perceived health and mortality: A nine-year follow-up of the human population laboratory cohort. Am. J. Epidemiol. 1983, 117, 292–304. [Google Scholar] [CrossRef]
- Brulle, R.J.; Pellow, D.N. Environmental justice: Human health and environmental inequalities. Annu. Rev. Public Health 2006, 27, 103–124. [Google Scholar] [CrossRef] [Green Version]
- Zhang, H.; Bago d’Uva, T.; van Doorslaer, E. The gender health gap in China: A decomposition analysis. Econ. Hum. Biol. 2015, 18, 13–26. [Google Scholar] [CrossRef]
- Strawbridge, W.; Wallhagen, M. Self-Rated Health and Mortality Over Three Decades. Res. Aging 1999, 21, 402–416. [Google Scholar] [CrossRef]
- Fleishman, J.A.; Selim, A.J.; Kazis, L.E. Deriving SF-12v2 physical and mental health summary scores: A comparison of different scoring algorithms. Qual. Life Res. 2010, 19, 231–241. [Google Scholar] [CrossRef]
- Jang, Y.; Yoon, H.; Chiriboga, D.A.; Molinari, V.; Powers, D.A. Bridging the Gap Between Common Mental Disorders and Service Use: The Role of Self-Rated Mental Health Among African Americans. Am. J. Geriatr. Psychiatry 2015, 23, 658–665. [Google Scholar] [CrossRef] [PubMed]
- World Health Organization. Global Age-Friendly Cities: A Guide; World Health Organization: Geneva, Switzerland, 2007. [Google Scholar]
- Caughy, M.O.B.; O’Campo, P.J.; Muntaner, C. When being alone might be better: Neighborhood poverty, social capital, and child mental health. Soc. Sci. Med. 2003, 57, 227–237. [Google Scholar] [CrossRef]
- Sooman, A.; Macintyre, S. Health and perceptions of the local environment in socially contrasting neighbourhoods in glasgow. Health Place 1995, 1, 15–26. [Google Scholar] [CrossRef]
- Kampa, M.; Castanas, E. Human health effects of air pollution. Environ. Pollut. 2008, 151, 362–367. [Google Scholar] [CrossRef] [PubMed]
- Schwarzenbach, R.P.; Egli, T.; Hofstetter, T.B.; von Gunten, U.; Wehrli, B. Global Water Pollution and Human Health. Annu. Rev. Environ. Resour. 2010, 35, 109–136. [Google Scholar] [CrossRef]
- Balfour, J.L.; Kaplan, G.A. Neighborhood environment and loss of physical function in older adults: Evidence from the Alameda County Study. Am. J. Epidemiol. 2002, 155, 507–515. [Google Scholar] [CrossRef] [Green Version]
- Cummins, S.; Stafford, M.; Macintyre, S.; Marmot, M.; Ellaway, A. Neighbourhood environment and its association with self rated health: Evidence from Scotland and England. J. Epidemiol. Community Health 2005, 59, 207–213. [Google Scholar] [CrossRef] [Green Version]
- Kwan, M.-P.; Wang, J.; Tyburski, M.; Epstein, D.H.; Kowalczyk, W.J.; Preston, K.L. Uncertainties in the geographic context of health behaviors: A study of substance users’ exposure to psychosocial stress using GPS data. Int. J. Geogr. Inf. Sci. 2018, 33, 1176–1195. [Google Scholar] [CrossRef]
- Schulz, A.; Northridge, M.E. Social determinants of health: Implications for environmental health promotion. Health Educ. Behav. 2004, 31, 455–471. [Google Scholar] [CrossRef]
- Diez Roux, A.V. Investigating neighborhood and area effects on health. Am. J. Public Health 2001, 91, 1783–1789. [Google Scholar] [CrossRef]
- Bobak, M.; Pikhart, H.; Rose, R.; Hertzman, C.; Marmot, M. Socioeconomic factors, material inequalities, and perceived control in self-rated health: Cross-sectional data from seven post-communist countries. Soc. Sci. Med. 2000, 51, 1343–1350. [Google Scholar] [CrossRef]
- Raudenbush, S.; Sampson, R. Systematic Social Observation of Public Spaces: A New Look at Disorder in Urban Neighborhoods. Am. J. Soc. 1999, 105, 603–651. [Google Scholar] [CrossRef] [Green Version]
- Walter Rasugu Omariba, D. Neighbourhood characteristics, individual attributes and self-rated health among older Canadians. Health Place 2010, 16, 986–995. [Google Scholar] [CrossRef] [PubMed]
- Gidlow, C.; Cochrane, T.; Davey, R.C.; Smith, G.; Fairburn, J. Relative importance of physical and social aspects of perceived neighbourhood environment for self-reported health. Prev. Med. 2010, 51, 157–163. [Google Scholar] [CrossRef]
- Barnett, A.; Cerin, E.; Zhang, C.J.P.; Sit, C.H.P.; Johnston, J.M.; Cheung, M.M.C.; Lee, R.S.Y. Associations between the neighbourhood environment characteristics and physical activity in older adults with specific types of chronic conditions: The ALECS cross-sectional study. Int. J. Behav. Nutr. Phys. Act. 2016, 13, 53. [Google Scholar] [CrossRef] [Green Version]
- Gao, J.; Fu, H.; Li, J.; Jia, Y. Association between social and built environments and leisure-time physical activity among Chinese older adults--a multilevel analysis. BMC Public Health 2015, 15, 1317. [Google Scholar] [CrossRef] [Green Version]
- Menec, V.; Nowicki, S. Examining the relationship between communities’ ‘age-friendliness’ and life satisfaction and self-perceived health in rural Manitoba, Canada. Rural Remote Health 2014, 14, 2594. [Google Scholar] [CrossRef]
- Lehning, A.J.; Smith, R.J.; Dunkle, R.E. Age-friendly environments and self-rated health: An exploration of Detroit elders. Res. Aging 2014, 36, 72–94. [Google Scholar] [CrossRef]
- Chen, Y.; Stephens, M.; Jones, C.A. Does Residents’ Satisfaction with the Neighbourhood Environment Relate to Residents’ Self-Rated Health? Evidence from Beijing. Int. J. Environ. Res. Public Health 2019, 16, 5051. [Google Scholar] [CrossRef] [Green Version]
- Gomez, L.F.; Soto-Salazar, C.; Guerrero, J.; Garcia, M.; Parra, D.C. Neighborhood environment, self-rated health and quality of life in Latin America. Health Promot Int. 2020, 35, 196–204. [Google Scholar] [CrossRef]
- Maniecka-Bryla, I.; Drygas, W.; Bryla, M.; Dziankowska-Zaborszczyk, E. Determinants of Self-Rated Health among the Elderly Living in a Big City Environment. Pol. J. Environ. Stud. 2011, 20, 691–699. [Google Scholar]
- Jarvis, I.; Koehoorn, M.; Gergel, S.E.; van den Bosch, M. Different types of urban natural environments influence various dimensions of self-reported health. Environ. Res. 2020, 186, 109614. [Google Scholar] [CrossRef] [PubMed]
- Cheng, Z.; Chen, L.J.; Li, H.H.; Lin, J.Q.; Yang, Z.B.; Yang, Y.X.; Xu, X.X.; Xian, J.R.; Shao, J.R.; Zhu, X.M. Characteristics and health risk assessment of heavy metals exposure via household dust from urban area in Chengdu, China. Sci. Total Environ. 2018, 619–620, 621–629. [Google Scholar] [CrossRef] [PubMed]
- Jia, S.; Wang, C.; Li, Y.; Zhang, F.; Liu, W. The urbanization efficiency in Chengdu City: An estimation based on a three-stage DEA model. Phys. Chem. Earth Parts A/B/C 2017, 101, 59–69. [Google Scholar] [CrossRef]
- Wu, J.; Ta, N.; Song, Y.; Lin, J.; Chai, Y. Urban form breeds neighborhood vibrancy: A case study using a GPS-based activity survey in suburban Beijing. Cities 2018, 74, 100–108. [Google Scholar] [CrossRef]
- Mavali, S.; Mahmoodi, H.; Sarbakhsh, P.; Shaghaghi, A. Psychometric Properties of the Warwick-Edinburgh Mental Wellbeing Scale (WEMWBS) in the Iranian Older Adults. Psychol. Res. Behav. Manag. 2020, 13, 693–700. [Google Scholar] [CrossRef]
- Ringdal, R.; Bradley Eilertsen, M.E.; Bjornsen, H.N.; Espnes, G.A.; Moksnes, U.K. Validation of two versions of the Warwick-Edinburgh Mental Well-Being Scale among Norwegian adolescents. Scand J. Public Health 2018, 46, 718–725. [Google Scholar] [CrossRef]
- Tennant, R.; Hiller, L.; Fishwick, R.; Platt, S.; Joseph, S.; Weich, S.; Parkinson, J.; Secker, J.; Stewart-Brown, S. The Warwick-Edinburgh Mental Well-being Scale (WEMWBS): Development and UK validation. Health Qual. Life Outcomes 2007, 5, 63. [Google Scholar] [CrossRef] [Green Version]
- Mason, P.; Kearns, A. Physical activity and mental wellbeing in deprived neighbourhoods. Ment. Health Phys. Act. 2013, 6, 111–117. [Google Scholar] [CrossRef]
- Kim, Y. Impacts of the perception of physical environments and the actual physical environments on self-rated health. Int. J. Urban Sci. 2016, 20, 73–87. [Google Scholar] [CrossRef]
- Lorenc, T.; Clayton, S.; Neary, D.; Whitehead, M.; Petticrew, M.; Thomson, H.; Cummins, S.; Sowden, A.; Renton, A. Crime, fear of crime, environment, and mental health and wellbeing: Mapping review of theories and causal pathways. Health Place 2012, 18, 757–765. [Google Scholar] [CrossRef] [PubMed]
- Kawachi, I.; Kennedy, B.P.; Glass, R. Social Capital and Self-Rated Health. Am. J. Public Health 1999, 89, 1187–1193. [Google Scholar] [CrossRef] [PubMed] [Green Version]
- Drewnowski, A.; Arterburn, D.; Zane, J.; Aggarwal, A.; Gupta, S.; Hurvitz, P.M.; Moudon, A.V.; Bobb, J.; Cook, A.; Lozano, P.; et al. The Moving to Health (M2H) approach to natural experiment research: A paradigm shift for studies on built environment and health. SSM Popul. Health 2019, 7, 100345. [Google Scholar] [CrossRef] [PubMed]
- Adler, N.E. Socioeconomic inequalities in health. No easy solution. JAMA 1993, 269, 3140–3145. [Google Scholar] [CrossRef] [PubMed]
- Wong, S.Y.; Mercer, S.W.; Woo, J.; Leung, J. The influence of multi-morbidity and self-reported socio-economic standing on the prevalence of depression in an elderly Hong Kong population. BMC Public Health 2008, 8, 119. [Google Scholar] [CrossRef] [Green Version]
- Kavanagh, A.; Bentley, R.; Turrell, G.; Broom, D.; Subramanian, S.V. Does gender modify associations between self rated health and the social and economic characteristics of local environment? J. Epidemiol. Community Health 2006, 60, 490–495. [Google Scholar] [CrossRef] [Green Version]
- Xiong, Y.H. Finely stratified society and middle-class anxiety. Beijing Cult. Rev. 2020, 05, 120–159. [Google Scholar]
- McEachan, R.R.C.; Yang, T.C.; Roberts, H.; Pickett, K.E.; Arseneau-Powell, D.; Gidlow, C.J.; Wright, J.; Nieuwenhuijsen, M. Availability, use of, and satisfaction with green space, and children’s mental wellbeing at age 4 years in a multicultural, deprived, urban area: Results from the Born in Bradford cohort study. Lancet Planet. Health 2018, 2, e244–e254. [Google Scholar] [CrossRef]
- Beyer, K.M.; Kaltenbach, A.; Szabo, A.; Bogar, S.; Nieto, F.J.; Malecki, K.M. Exposure to neighborhood green space and mental health: Evidence from the survey of the health of Wisconsin. Int. J. Environ. Res. Public Health 2014, 11, 3453–3472. [Google Scholar] [CrossRef] [Green Version]
- Mears, M.; Brindley, P.; Jorgensen, A.; Ersoy, E.; Maheswaran, R. Greenspace spatial characteristics and human health in an urban environment: An epidemiological study using landscape metrics in Sheffield, UK. Ecol. Indic. 2019, 106, 105464. [Google Scholar] [CrossRef]
- Jiao, K.; Xu, M.; Liu, M. Health status and air pollution related socioeconomic concerns in urban China. Int. J. Equity Health 2018, 17, 18. [Google Scholar] [CrossRef] [PubMed] [Green Version]
- Brown, A.F.; Ang, A.; Pebley, A.R. The relationship between neighborhood characteristics and self-rated health for adults with chronic conditions. Am. J. Public Health 2007, 97, 926–932. [Google Scholar] [CrossRef] [PubMed]
- Wong, M.; Yu, R.; Woo, J. Effects of Perceived Neighbourhood Environments on Self-Rated Health among Community-Dwelling Older Chinese. Int. J. Environ. Res. Public Health 2017, 14, 614. [Google Scholar] [CrossRef] [PubMed]
- Kivimäki, M.; Batty, G.D.; Pentti, J.; Nyberg, S.T.; Lindbohm, J.V.; Ervasti, J.; Gonzales-Inca, C.; Suominen, S.B.; Stenholm, S.; Sipilä, P.N.; et al. Modifications to residential neighbourhood characteristics and risk of 79 common health conditions: A prospective cohort study. Lancet Public Health 2021, 6, e396–e407. [Google Scholar] [CrossRef]
- Lowe, M.; Foster, S. Neighbourhood characteristics and health: Advancing research and practice. Lancet Public Health 2021, 6, e351–e352. [Google Scholar] [CrossRef]
- Roh, S.; Jang, Y.; Chiriboga, D.A.; Kwag, K.H.; Cho, S.; Bernstein, K. Perceived neighborhood environment affecting physical and mental health: A study with Korean American older adults in New York City. J. Immigr. Minor. Health 2011, 13, 1005–1012. [Google Scholar] [CrossRef] [PubMed]
- Ross, C.E.; Mirowsky, J. Neighborhood disadvantage, disorder, and health. J. Health Soc. Behav. 2001, 42, 258–276. [Google Scholar] [CrossRef] [Green Version]
- Yu, R.; Wong, M.; Woo, J. Perceptions of Neighborhood Environment, Sense of Community, and Self-Rated Health: An Age-Friendly City Project in Hong Kong. J. Urban Health 2019, 96, 276–288. [Google Scholar] [CrossRef]
- Van Cauwenberg, J.; Cerin, E.; Timperio, A.; Salmon, J.; Deforche, B.; Veitch, J. Park proximity, quality and recreational physical activity among mid-older aged adults: Moderating effects of individual factors and area of residence. Int. J. Behav. Nutr. Phys. Act. 2015, 12, 46. [Google Scholar] [CrossRef] [Green Version]
- Taylor, A.H.; Cable, N.T.; Faulkner, G.; Hillsdon, M.; Narici, M.; Van Der Bij, A.K. Physical activity and older adults: A review of health benefits and the effectiveness of interventions. J. Sports Sci. 2004, 22, 703–725. [Google Scholar] [CrossRef]
- Lan, W.; Wenyao, S.; Ying, W. Study on the Impact of Subjective Perception of Urban Environment on Residents Health: Based on A Large Sample Survey of 60 Counties and Cities in China. Human Geography 2020, 2, 55–64. [Google Scholar] [CrossRef]
- Kaplan, S.; Kaplan, R. Health. Supportive Environments, and the Reasonable. Am. J. Public Health 2015, 93, 1484–1489. [Google Scholar] [CrossRef] [PubMed]
- Ulrich, R. Natural Versus Urban Scenes: Some Psychophysiological Effects. Environ. Behav. 1981, 13, 523–556. [Google Scholar] [CrossRef]
- Giles-Corti, B.; Vernez-Moudon, A.; Reis, R.; Turrell, G.; Dannenberg, A.L.; Badland, H.; Foster, S.; Lowe, M.; Sallis, J.F.; Stevenson, M.; et al. City planning and population health: A global challenge. Lancet 2016, 388, 2912–2924. [Google Scholar] [CrossRef]
- McCormack, G.R.; Rock, M.; Toohey, A.M.; Hignell, D. Characteristics of urban parks associated with park use and physical activity: A review of qualitative research. Health Place 2010, 16, 712–726. [Google Scholar] [CrossRef] [PubMed]


| n | WEIGHTED (%) | Average SRPH Scores | Average SRMH Scores | |
|---|---|---|---|---|
| Gender | ||||
| Male | 288 | 48.7 | 3.98 | 3.80 |
| Female | 303 | 51.3 | 3.86 | 3.71 |
| Age (years) | ||||
| The young | 377 | 63.8 | 3.94 | 3.69 |
| The middle-aged | 192 | 32.5 | 3.88 | 3.83 |
| The old | 22 | 3.7 | 3.91 | 4.14 |
| Education | ||||
| High school degree or below | 140 | 23.7 | 3.84 | 3.80 |
| Junior college | 120 | 20.3 | 3.98 | 3.66 |
| Bachelor degree or above | 331 | 56.0 | 3.93 | 3.77 |
| Permanent job | ||||
| Yes | 381 | 64.5 | 3.92 | 3.77 |
| No | 210 | 35.5 | 3.92 | 3.73 |
| Marriage | ||||
| Single | 299 | 50.6 | 3.95 | 3.67 |
| Married | 292 | 49.4 | 3.89 | 3.84 |
| Annual income (RMB) | ||||
| <50,000 | 219 | 37.0 | 3.89 | 3.77 |
| 50,000–100,000 | 206 | 34.9 | 3.93 | 3.66 |
| >100,000 | 166 | 28.1 | 3.96 | 3.85 |
| Type of dwelling | ||||
| Low-end | 89 | 15.1 | 3.89 | 3.65 |
| Mid-range | 407 | 68.8 | 3.92 | 3.74 |
| High-end | 35 | 5.9 | 3.83 | 4.03 |
| Unit/dormitory | 60 | 10.2 | 4.02 | 3.83 |
| Neighborhood Physical Environment Evaluation | Neighborhood Social Environment Evaluation | ||||||||
|---|---|---|---|---|---|---|---|---|---|
| Air Quality | Ecological Water Quality | Urban Greening | Garbage Disposal | Sports Facilities | Medical and Health Facilities | Community Neighborhood Relations | Social Environment | Urban Public Security | |
| Mean | 3.45 | 3.35 | 3.70 | 3.37 | 3.23 | 3.27 | 3.62 | 3.64 | 3.80 |
| SD | 0.92 | 0.93 | 0.82 | 0.97 | 1.22 | 1.17 | 0.83 | 0.79 | 0.82 |
| Various Health Service Facilities | Actual Facility Accessibility | Perceived Facility Accessibility | ||||||
|---|---|---|---|---|---|---|---|---|
| Physical Health | Mental Health | Physical Health | Mental Health | |||||
| χ2 | p | χ2 | p | χ2 | p | χ2 | p | |
| Parks and Squares | 19.23 | 0.014 ** | 5.24 | 0.731 | 21.67 | 0.017 ** | 15.43 | 0.117 |
| Sports Venues | 19.19 | 0.014 ** | 11.10 | 0.196 | 6.09 | 0.807 | 6.07 | 0.809 |
| Sports Zones | 15.48 | 0.051 * | 6.12 | 0.633 | 2.54 | 0.990 | 9.70 | 0.467 |
| General Hospitals | 14.27 | 0.075 * | 4.75 | 0.784 | 24.74 | 0.006 ** | 24.17 | 0.007 ** |
| Specialised Hospitals | 7.48 | 0.679 | 15.25 | 0.123 | 14.49 | 0.152 | 9.03 | 0.529 |
| Community-Hospitals | 7.72 | 0.461 | 4.21 | 0.837 | 17.20 | 0.070 * | 5.693 | 0.840 |
| Clinics | 15.12 | 0.057 * | 7.57 | 0.476 | 6.48 | 0.773 | 14.06 | 0.170 |
| Pharmacies | 12.59 | 0.247 | 5.63 | 0.845 | 3.57 | 0.965 | 13.66 | 0.189 |
Publisher’s Note: MDPI stays neutral with regard to jurisdictional claims in published maps and institutional affiliations. |
© 2022 by the authors. Licensee MDPI, Basel, Switzerland. This article is an open access article distributed under the terms and conditions of the Creative Commons Attribution (CC BY) license (https://creativecommons.org/licenses/by/4.0/).
Share and Cite
Wan, J.; Zhao, Y.; Chen, Y.; Wang, Y.; Su, Y.; Song, X.; Zhang, S.; Zhang, C.; Zhu, W.; Yang, J. The Effects of Urban Neighborhood Environmental Evaluation and Health Service Facilities on Residents’ Self-Rated Physical and Mental Health: A Comparative and Empirical Survey. Int. J. Environ. Res. Public Health 2022, 19, 4501. https://doi.org/10.3390/ijerph19084501
Wan J, Zhao Y, Chen Y, Wang Y, Su Y, Song X, Zhang S, Zhang C, Zhu W, Yang J. The Effects of Urban Neighborhood Environmental Evaluation and Health Service Facilities on Residents’ Self-Rated Physical and Mental Health: A Comparative and Empirical Survey. International Journal of Environmental Research and Public Health. 2022; 19(8):4501. https://doi.org/10.3390/ijerph19084501
Chicago/Turabian StyleWan, Jiangjun, Yutong Zhao, Yun Chen, Yanlan Wang, Yi Su, Xueqian Song, Shaoyao Zhang, Chengyan Zhang, Wei Zhu, and Jinxiu Yang. 2022. "The Effects of Urban Neighborhood Environmental Evaluation and Health Service Facilities on Residents’ Self-Rated Physical and Mental Health: A Comparative and Empirical Survey" International Journal of Environmental Research and Public Health 19, no. 8: 4501. https://doi.org/10.3390/ijerph19084501
APA StyleWan, J., Zhao, Y., Chen, Y., Wang, Y., Su, Y., Song, X., Zhang, S., Zhang, C., Zhu, W., & Yang, J. (2022). The Effects of Urban Neighborhood Environmental Evaluation and Health Service Facilities on Residents’ Self-Rated Physical and Mental Health: A Comparative and Empirical Survey. International Journal of Environmental Research and Public Health, 19(8), 4501. https://doi.org/10.3390/ijerph19084501