2.2. Participants
Patient data were collected between July 2013 and March 2021. A total of 1155 VF-examined patients were selected. In these patients, surgical cases due to tumors and jaw deformity were excluded. Following this, 476 patients remained.
Patients who had undergone panoramic radiography were assessed. The exclusion criteria of panoramic radiographs, which were related to the positioning error, were in accordance with Izzetti et al. [
8]. These panoramic radiographs were analyzed for symmetry of image, inclination of occlusal plane, and localization of mandibular condyles. Patients who were unable to maintain correct positioning during panoramic radiography and cases where the hyoid bone moved during panoramic radiography were also excluded.
Finally, 77 patients who underwent both a VF exam and a panoramic radiographic exam were selected.
2.4. Image Assessment and Measurements
These panoramic radiographs were assessed using a Windows computer, HP Compaq 6300 Pro (Hewlett-Packard, Palo Alto, CA, USA), with a 21.1 inch, 2M pixel medical color LED monitor RX240 (EIZO, Tokyo, Japan).
Two oral and maxillofacial radiologists, who did not know the results of the VF exam, assessed the images. In cases where different diagnoses were obtained, the images were re-examined, and consensus was reached between both experts.
Evaluation of the vertical hyoid bone position, the horizontal hyoid bone position, and the measurement of the distance from the tongue to the palate were performed according to the method of Ito et al. [
9]. The measurement and evaluation methods are shown below.
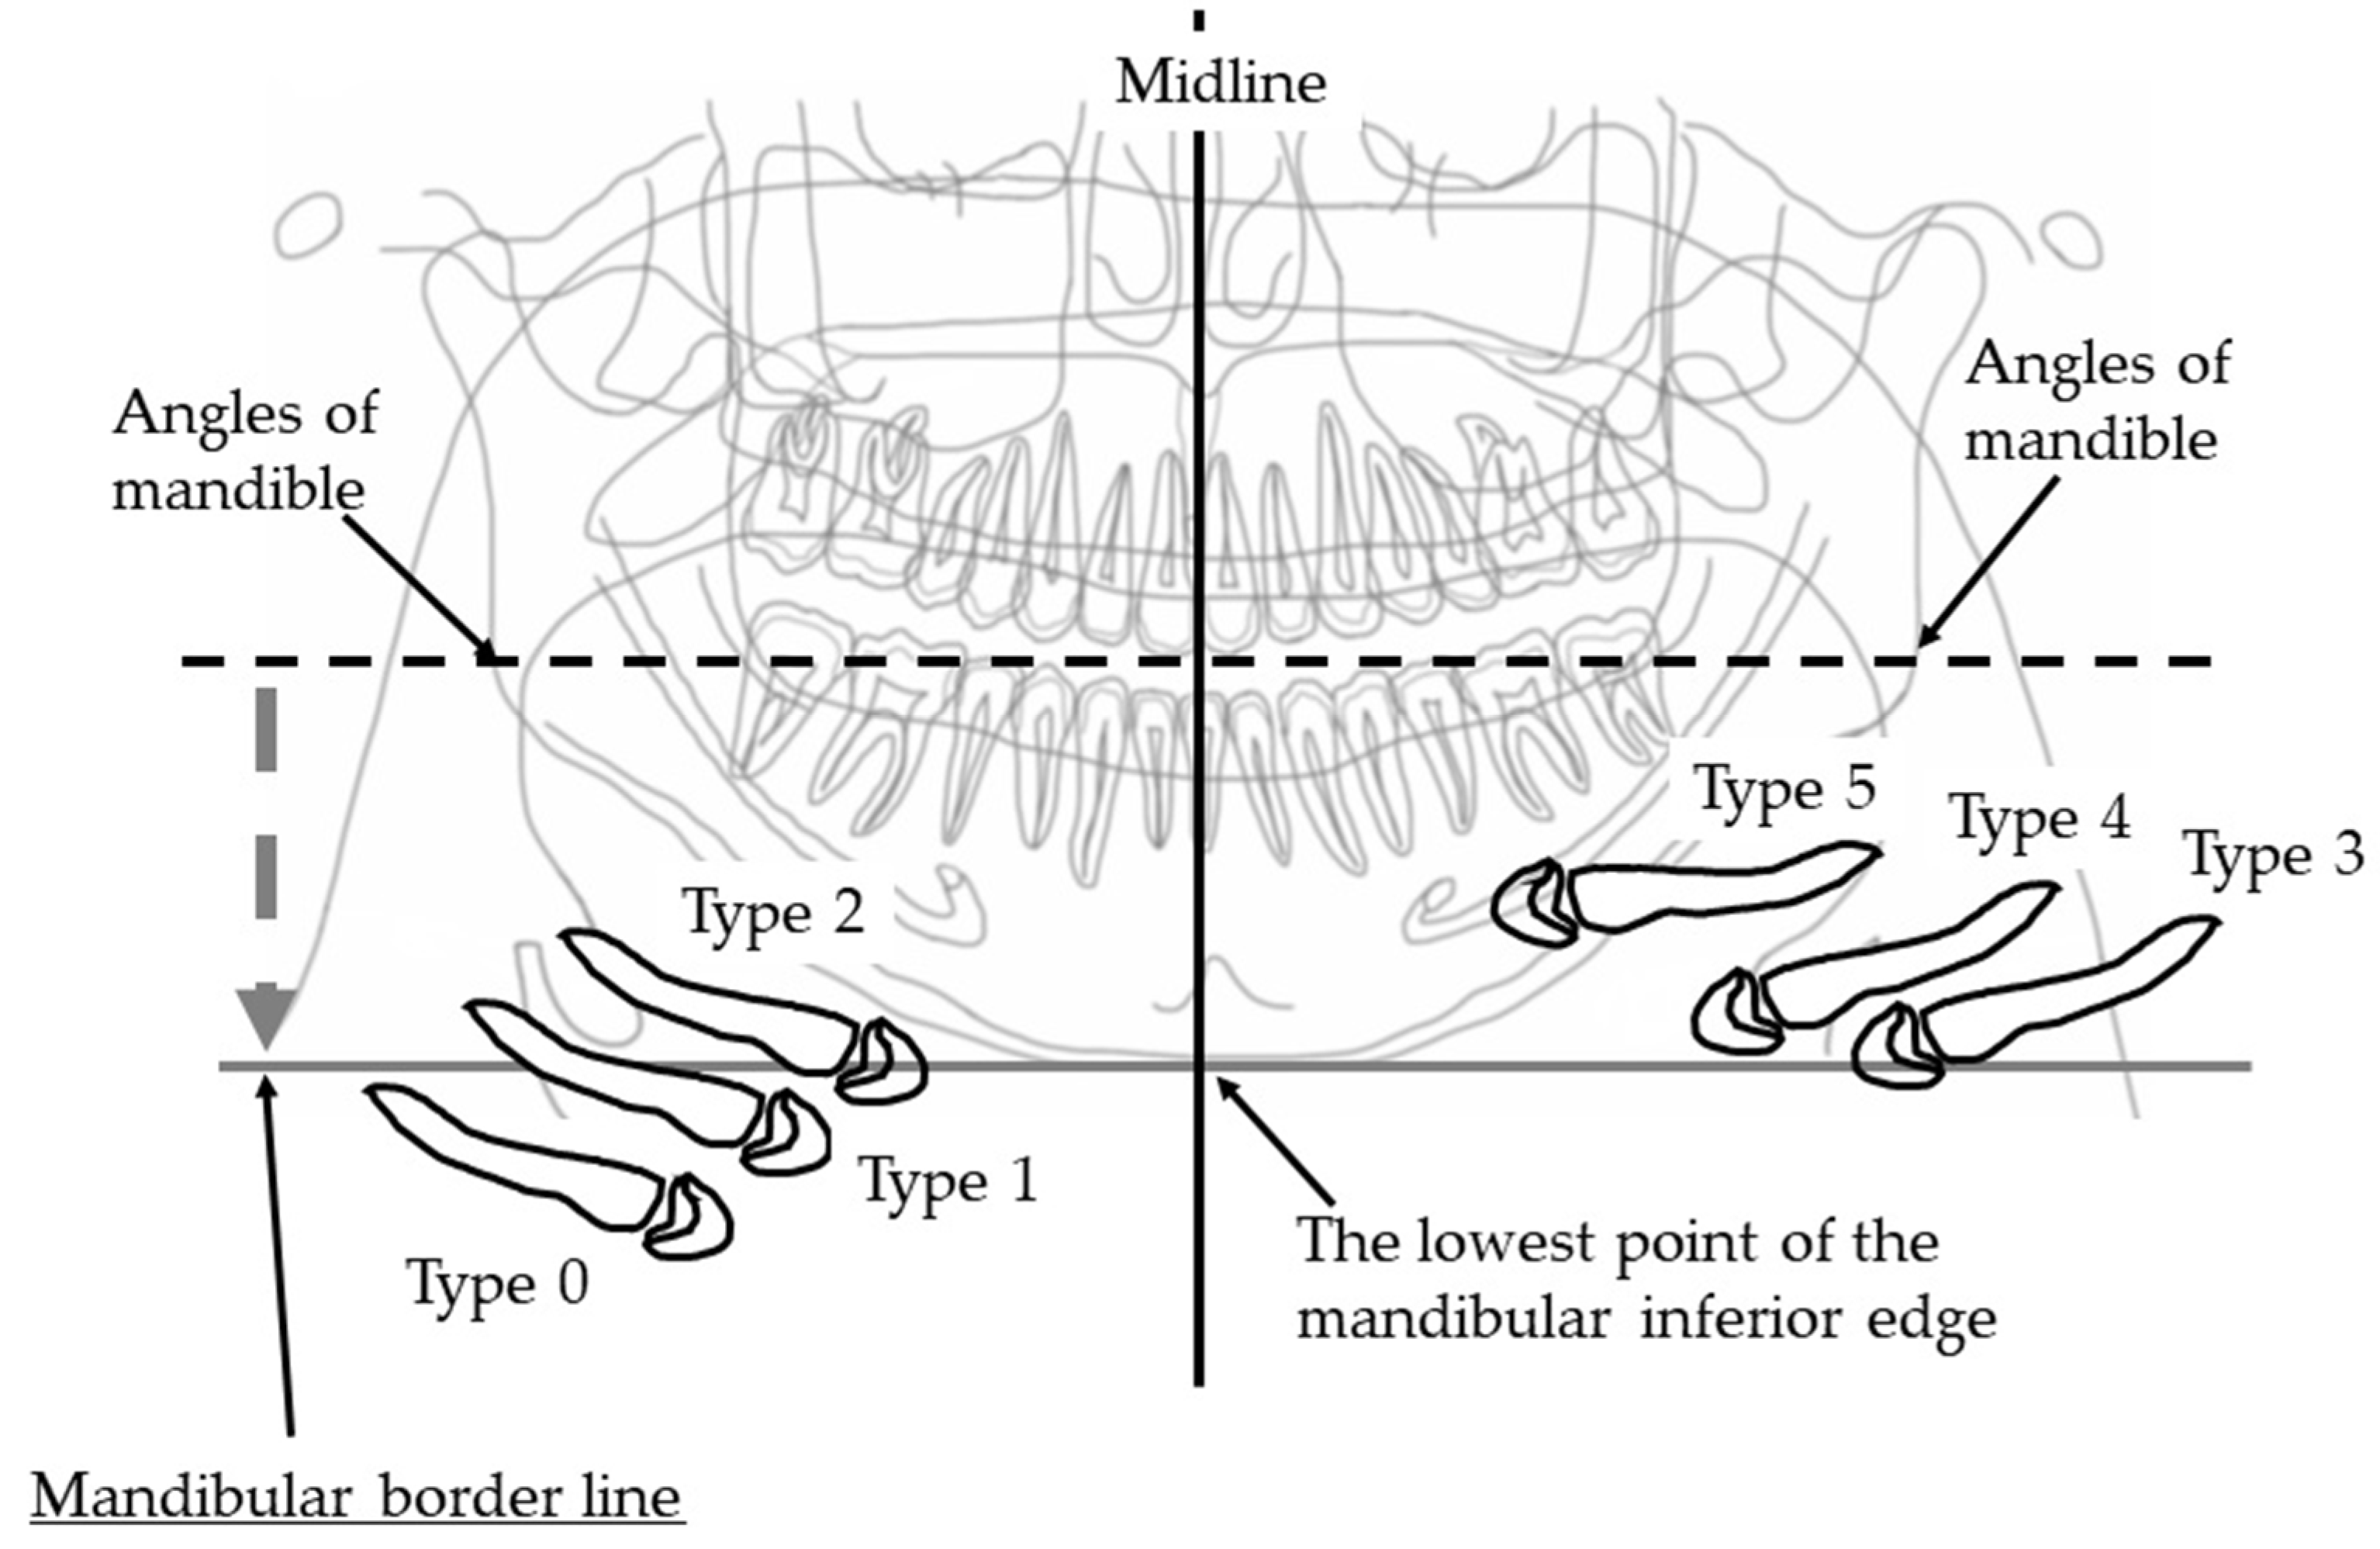
2.4.1. Vertical Hyoid Bone Position
Figure 1 illustrates the evaluation of the vertical position of the hyoid bone and shows sample images. This method of measurement was as specified in Ito et al. [
9].
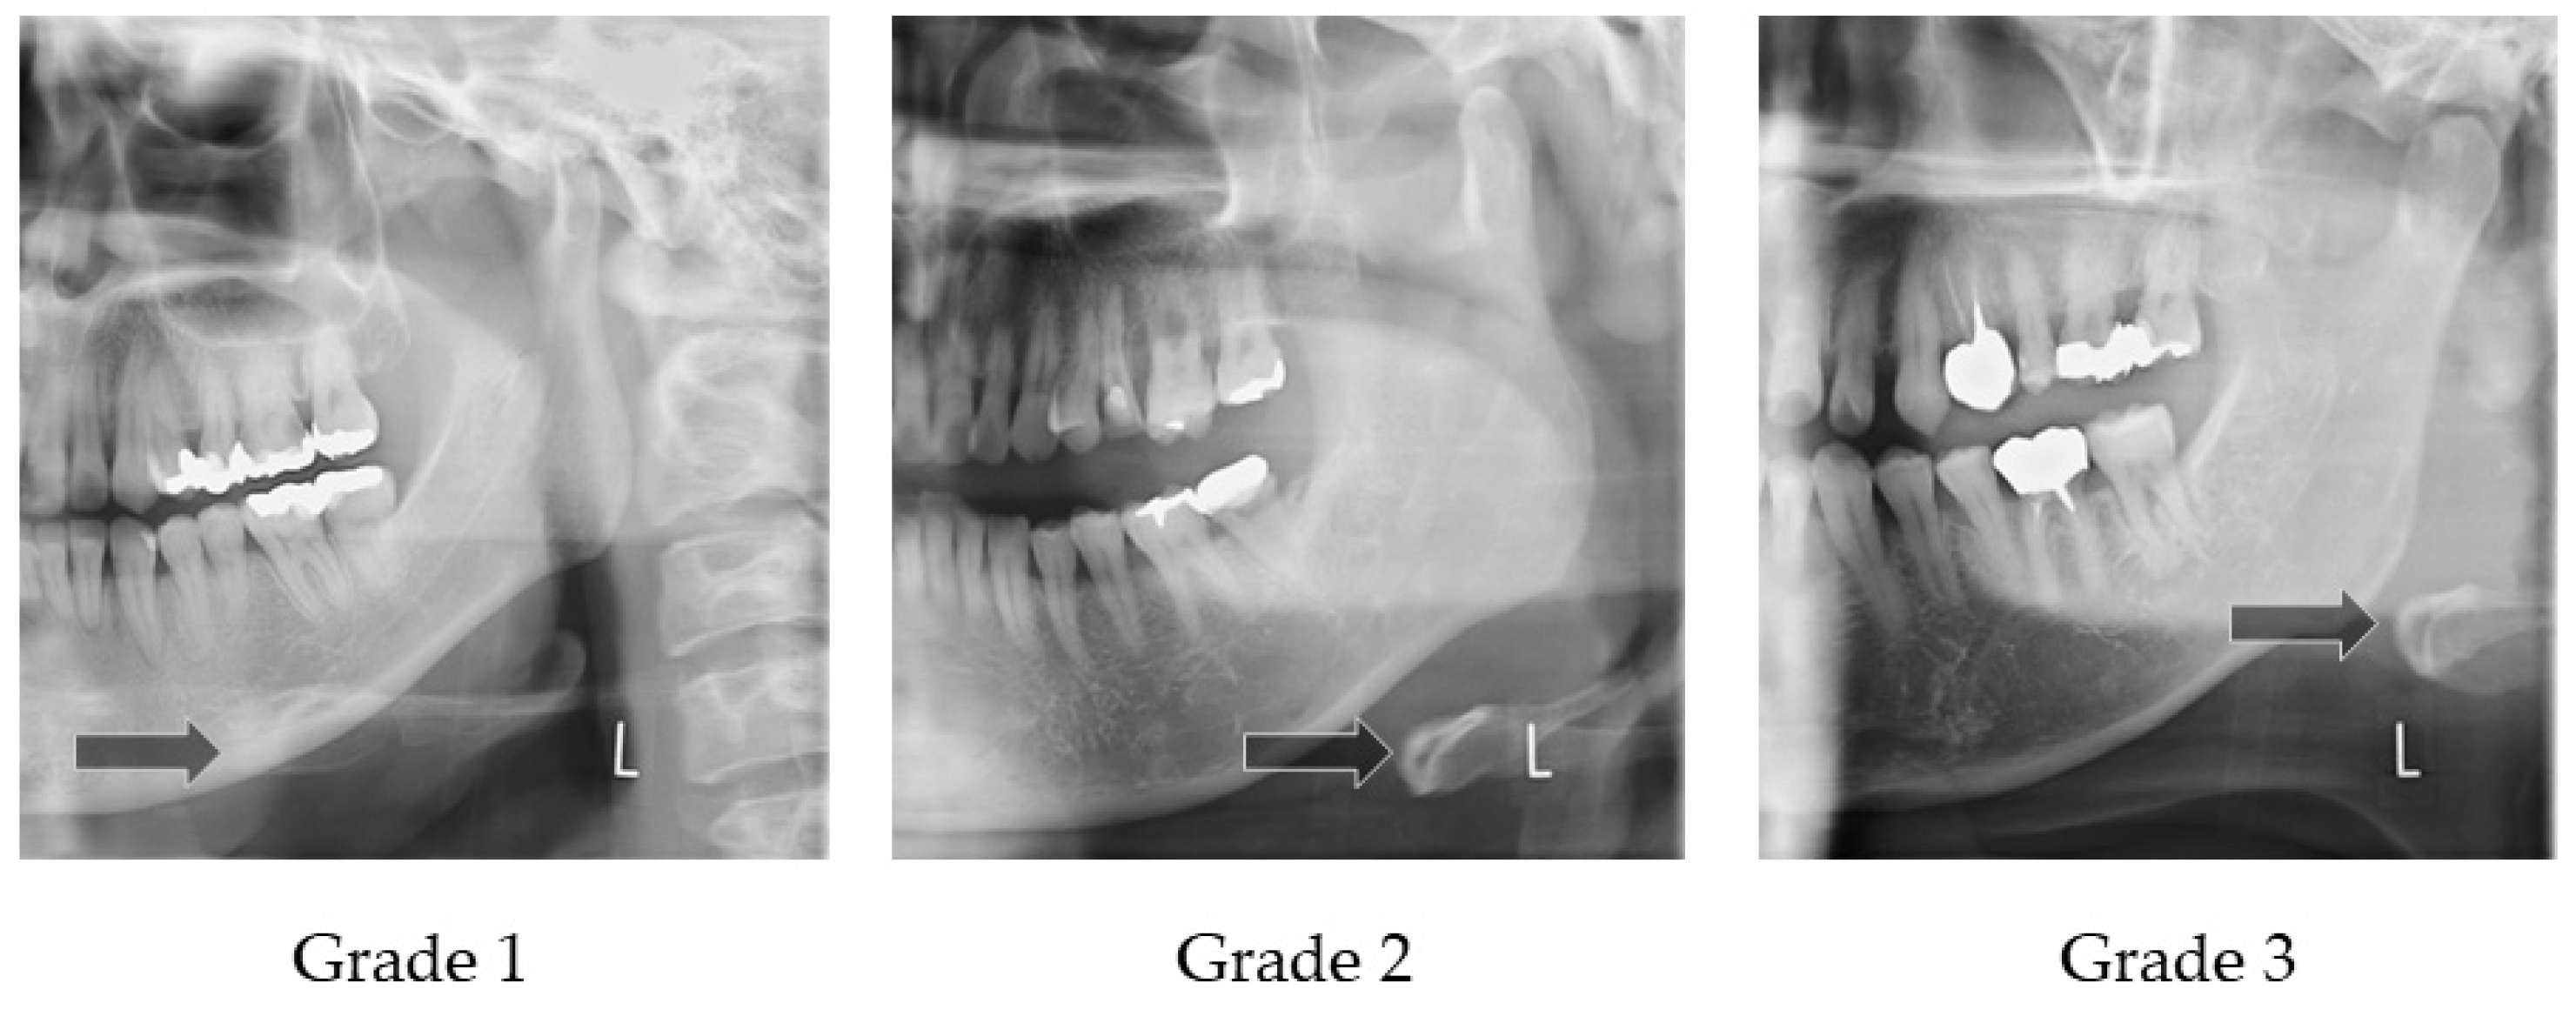
Figure 2 shows sample images.
Two landmarks were defined, as follows:
The bilateral mandible line: A simulated line connecting the right and left sides of the angles of the mandible.
The mandibular border line: The line that moved the bilateral mandibular line parallel to the lowest point of the lower border of the mandible.
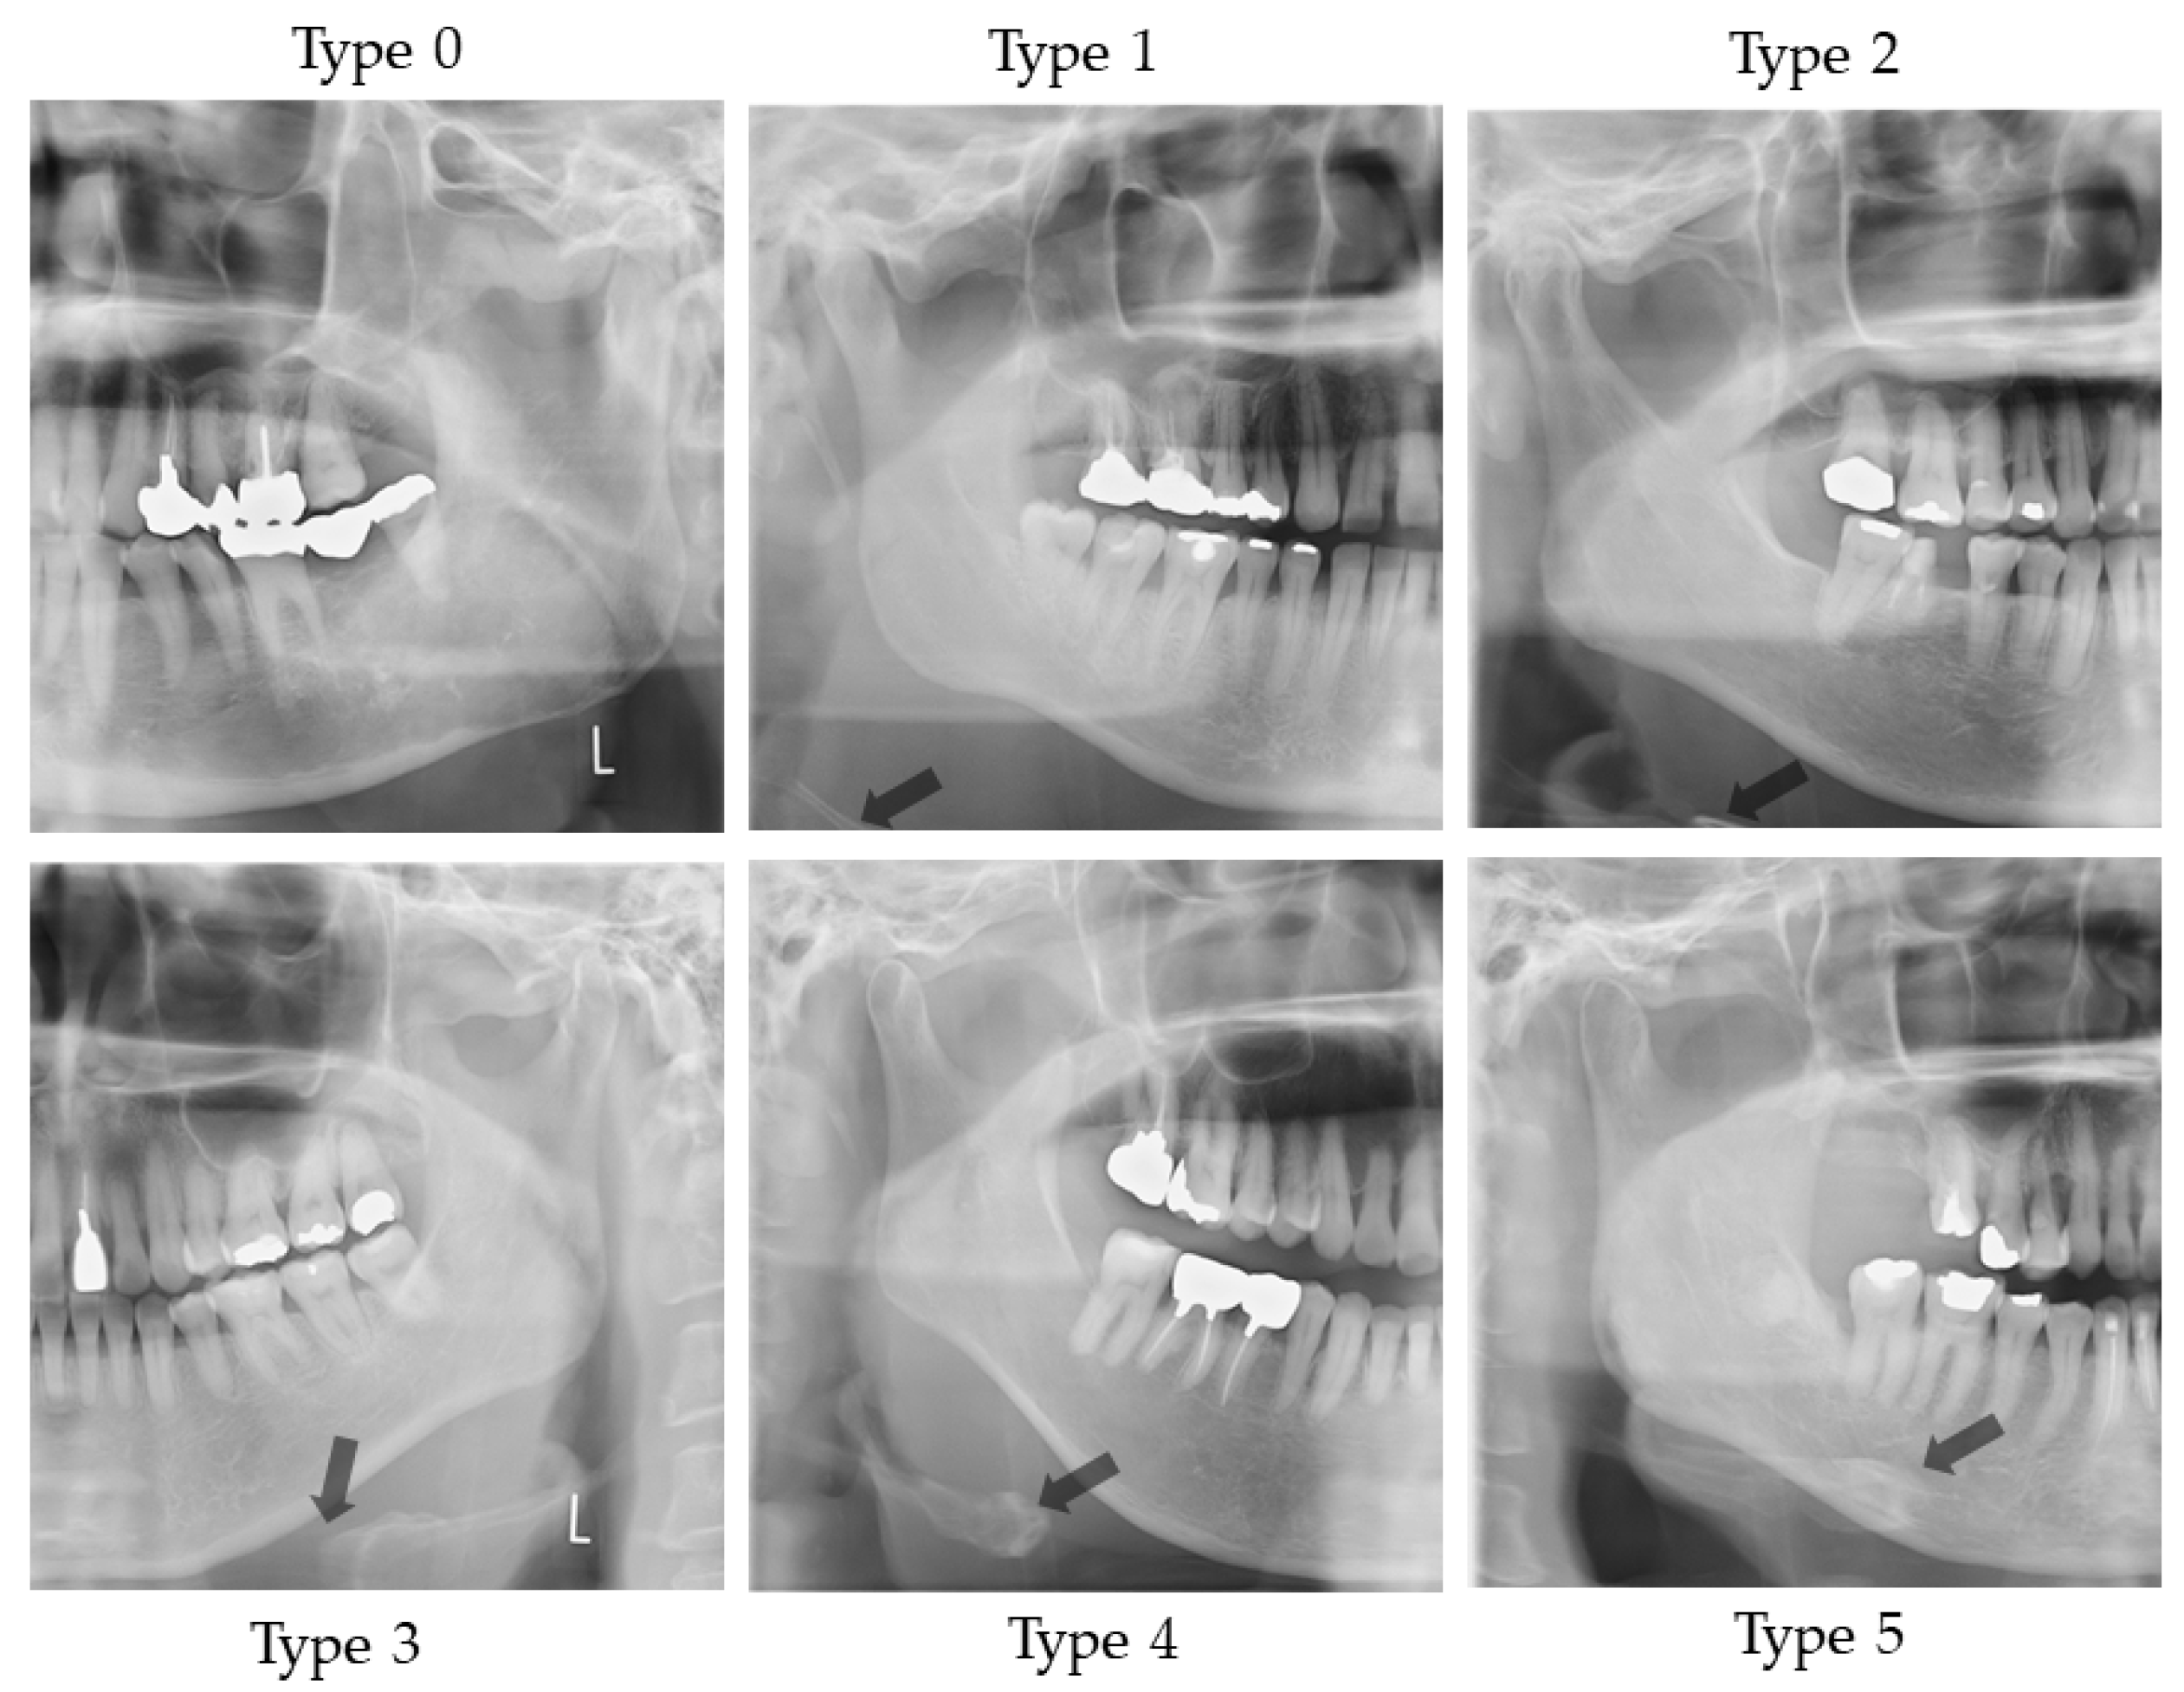
An evaluation was conducted of the extent to which the hyoid body and greater horn appeared in the upper area from the mandibular border line. The following six groups were categorized:
Type 0: The hyoid bone could not be observed in the upper area from the mandibular border line;
Type 1: Only the greater horn was observed in the upper area from the mandibular border line;
Type 2: A less than half of the hyoid body was observed in the upper area from the mandibular border line;
Type 3: More than half and less than whole of the hyoid body was observed in the upper area from the mandibular border line;
Type 4: All of the hyoid body was observed in the upper area from the mandibular border line;
Type 5: The hyoid body overlapped with the mandible bone.
On the right and left sides, if the vertical position of the hyoid bone was different, the lower position side was recorded.
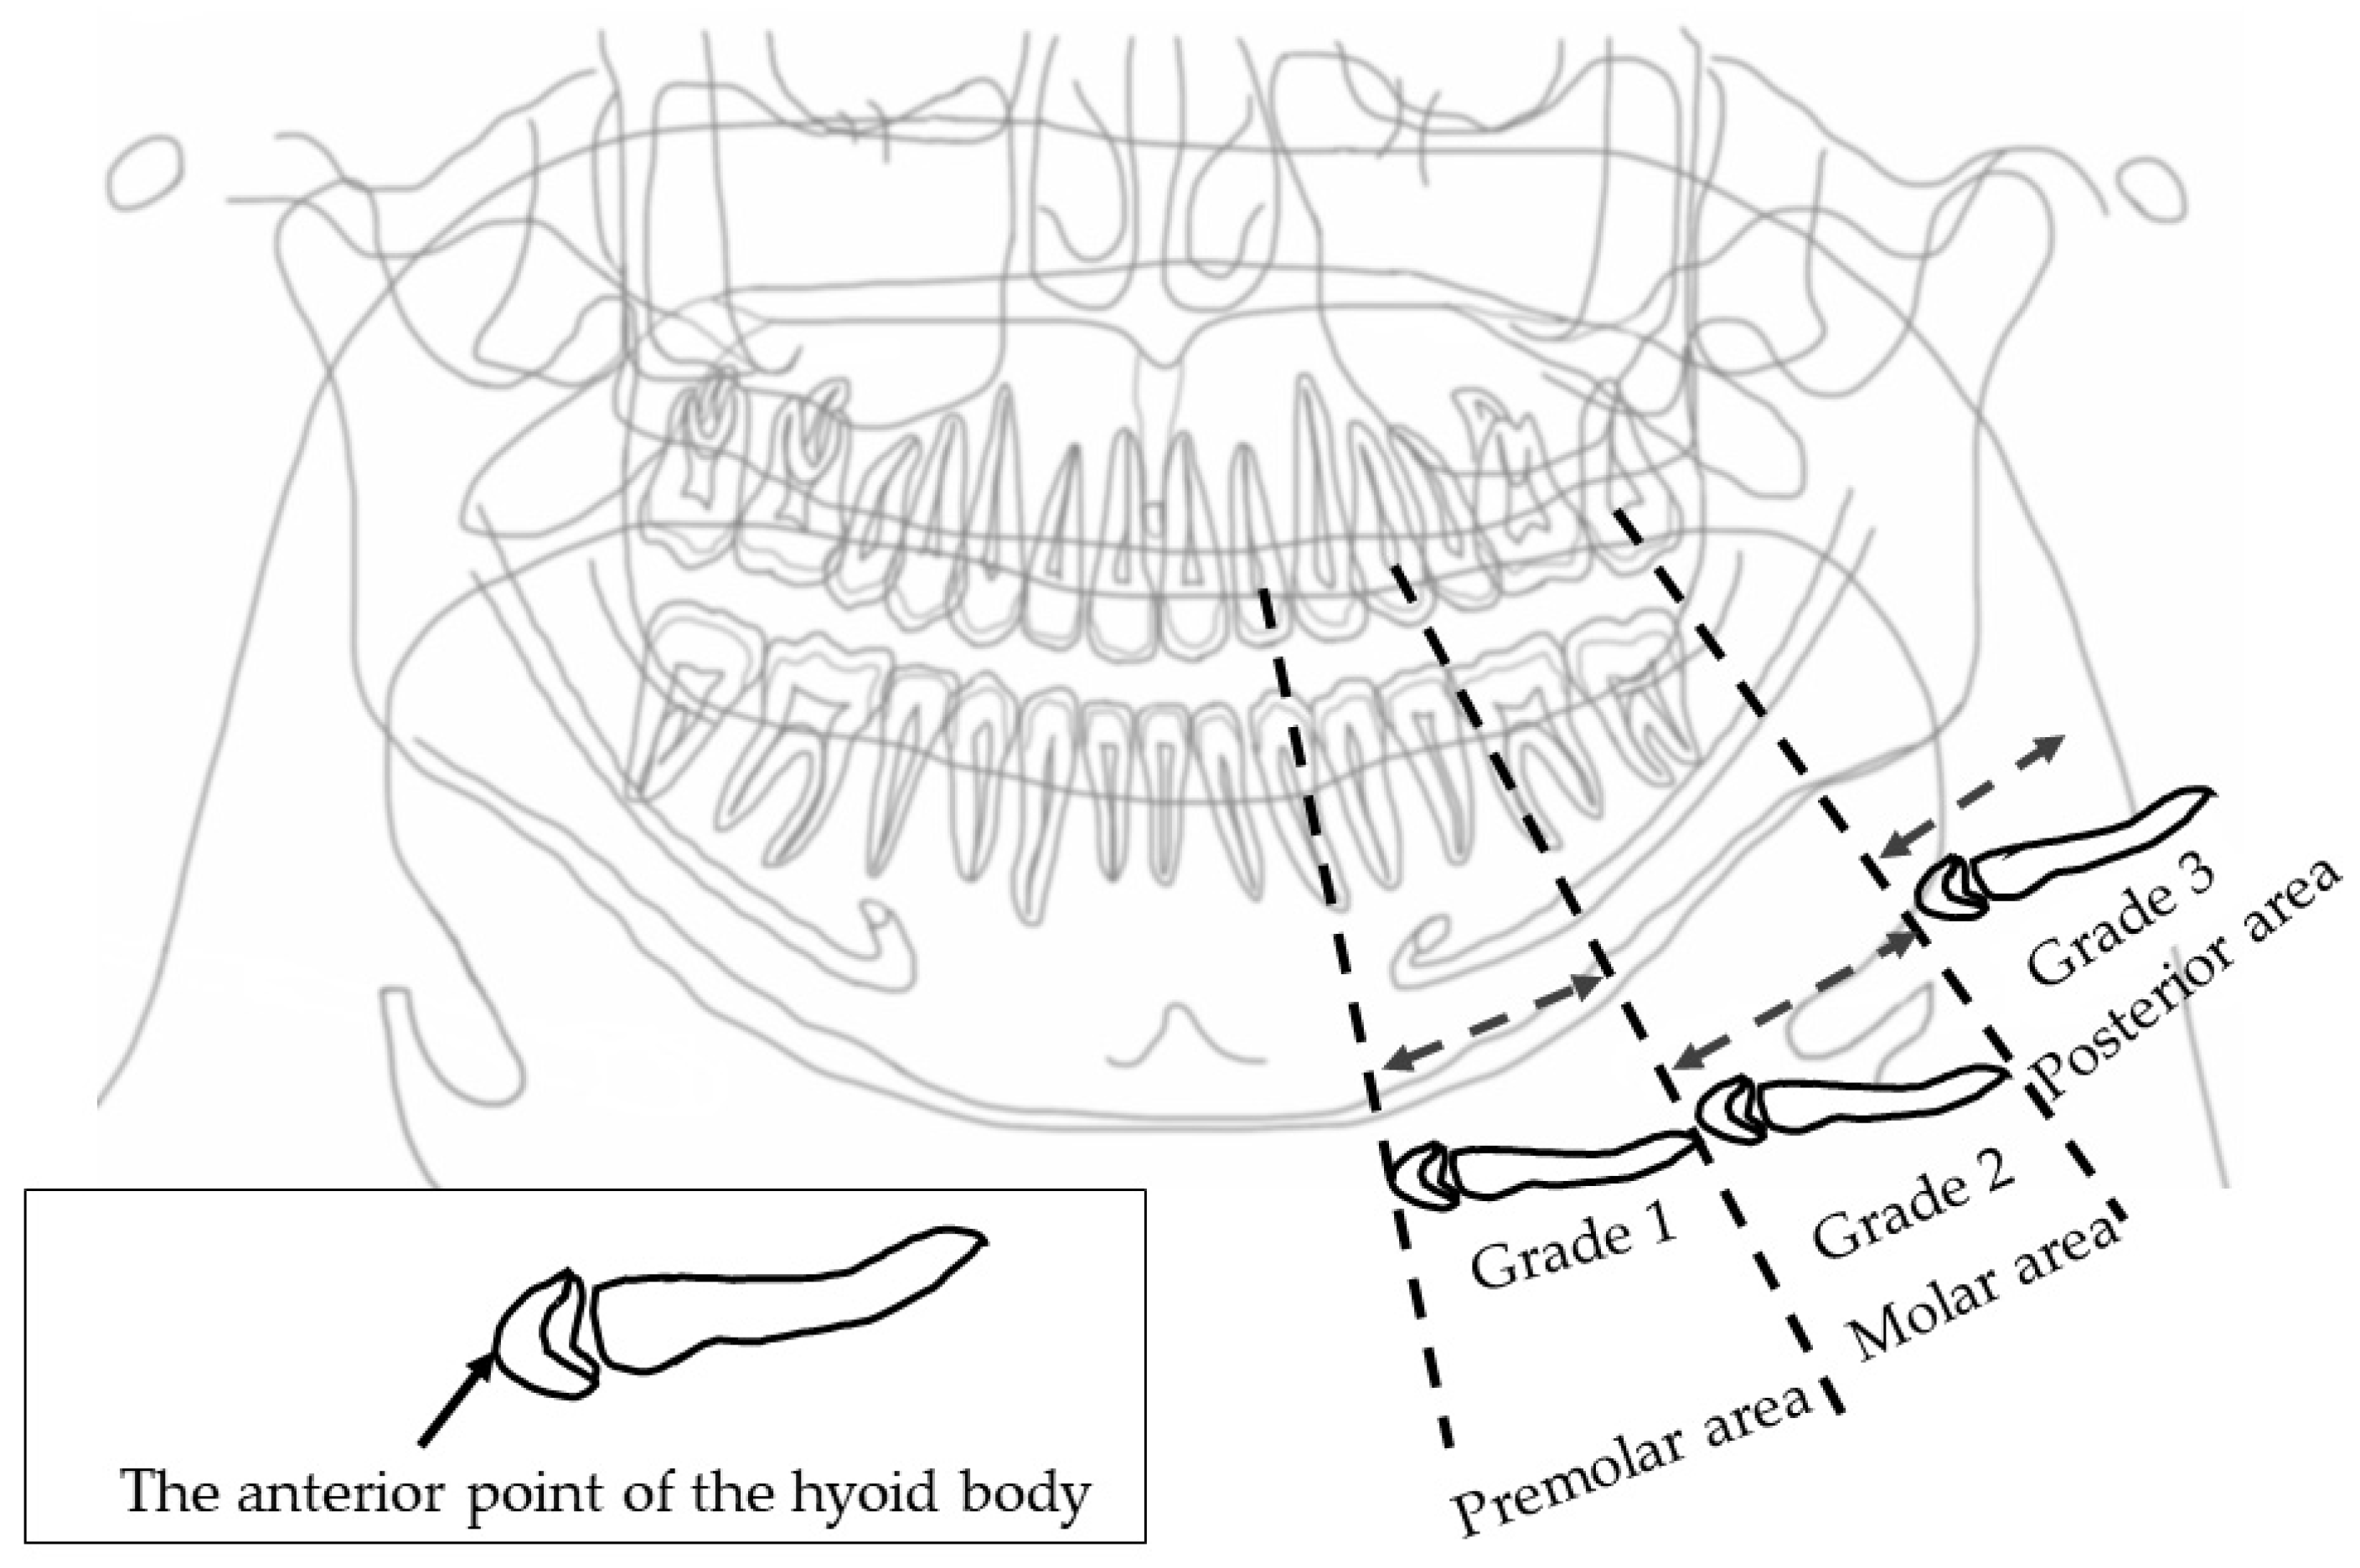
2.4.2. Horizontal Hyoid Bone Position
Figure 3 illustrates how to evaluate the position of the horizontal hyoid bone and
Figure 4 shows sample images. This method of measurement was taken from Ito et al. [
9]. The horizontal position of the hyoid bone was graded based on the anterior point of the hyoid body. Cases in which the hyoid bone was invisible were excluded from this assessment.
Six landmarks were defined, as follows:
The mesial premolar line is the point between the mesial interproximal surface of the first premolar and the vertical border of the mandible until the end of the image. When the first premolar was missing, the distal surface of the canine was used.
The distal premolar line is the point between the distal interproximal surface of the second premolar and the vertical border of the mandible until the end of the image. When the second premolar was missing, the mesial surface of the first molar was used.
The premolar area is the area between the mesial premolar line and the distal premolar line.
The distal molar line is the perpendicular line from the distal interproximal surface of the second molar or the mesial interproximal surface of the third molar to the edge of the image through the lower border of the mandible. When the second molar was missing, the mesial surface of the third molar was used.
The molar area is the area between the distal premolar line and the distal molar line.
The posterior area is the area posterior to the distal molar line.
In cases where the relevant tooth or its neighboring tooth was missing, these landmark lines were referred to the maxillary tooth.
Grade 1 is the most anterior point of the hyoid body that is observed in the premolar zone.
Grade 2 is the most anterior point of the hyoid body that is observed in the molar zone.
Grade 3 is the most anterior point of the hyoid body that is observed in the posterior zone.
The detailed technical description of these measures and their assessments (acquisition) has been previously reported and summarized.
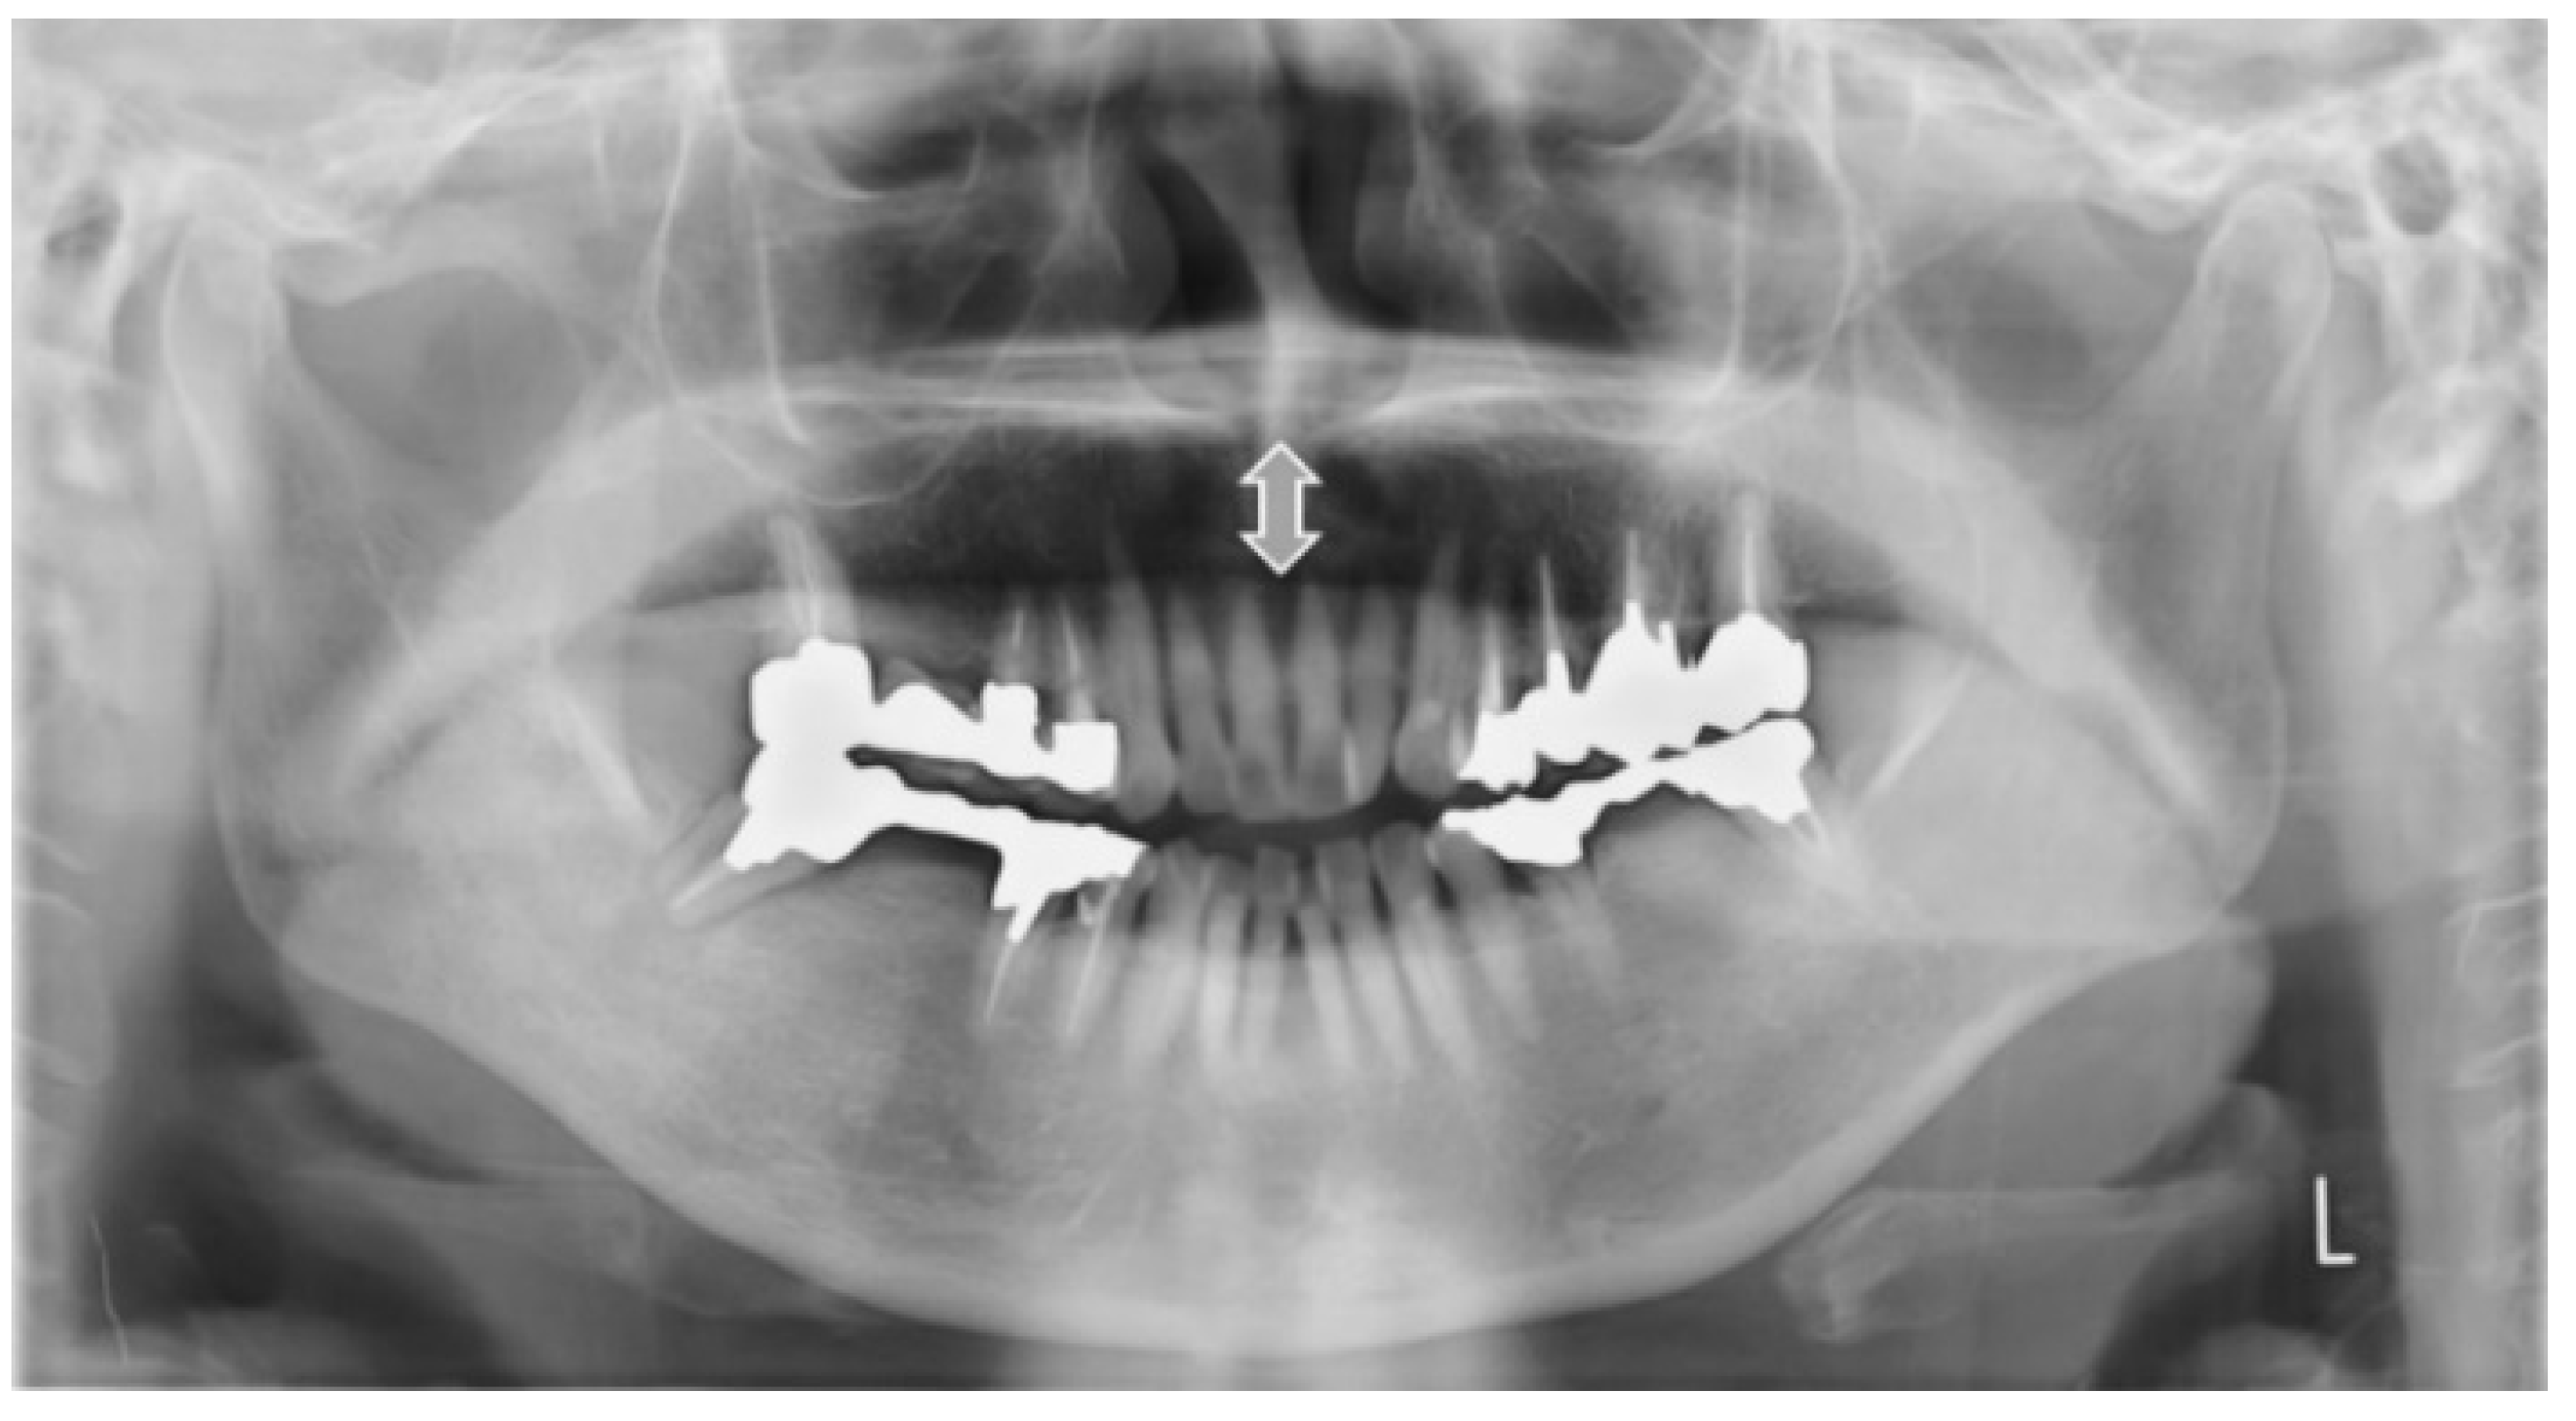
2.4.3. Measurement from the Tongue to the Palate on the Midline (mm)
Figure 5 shows the sample image of measurement from the tongue to the palate. This method of measurement was taken from Ito et al. [
9]. The distance of the tongue to the palate on the midline was measured. The midline is the line that connects the anterior nasal spines to the interproximal point of the maxillary incisors. On the midline, the distance from the surface of the tongue to the palate was measured.
2.4.4. Width of Tongue
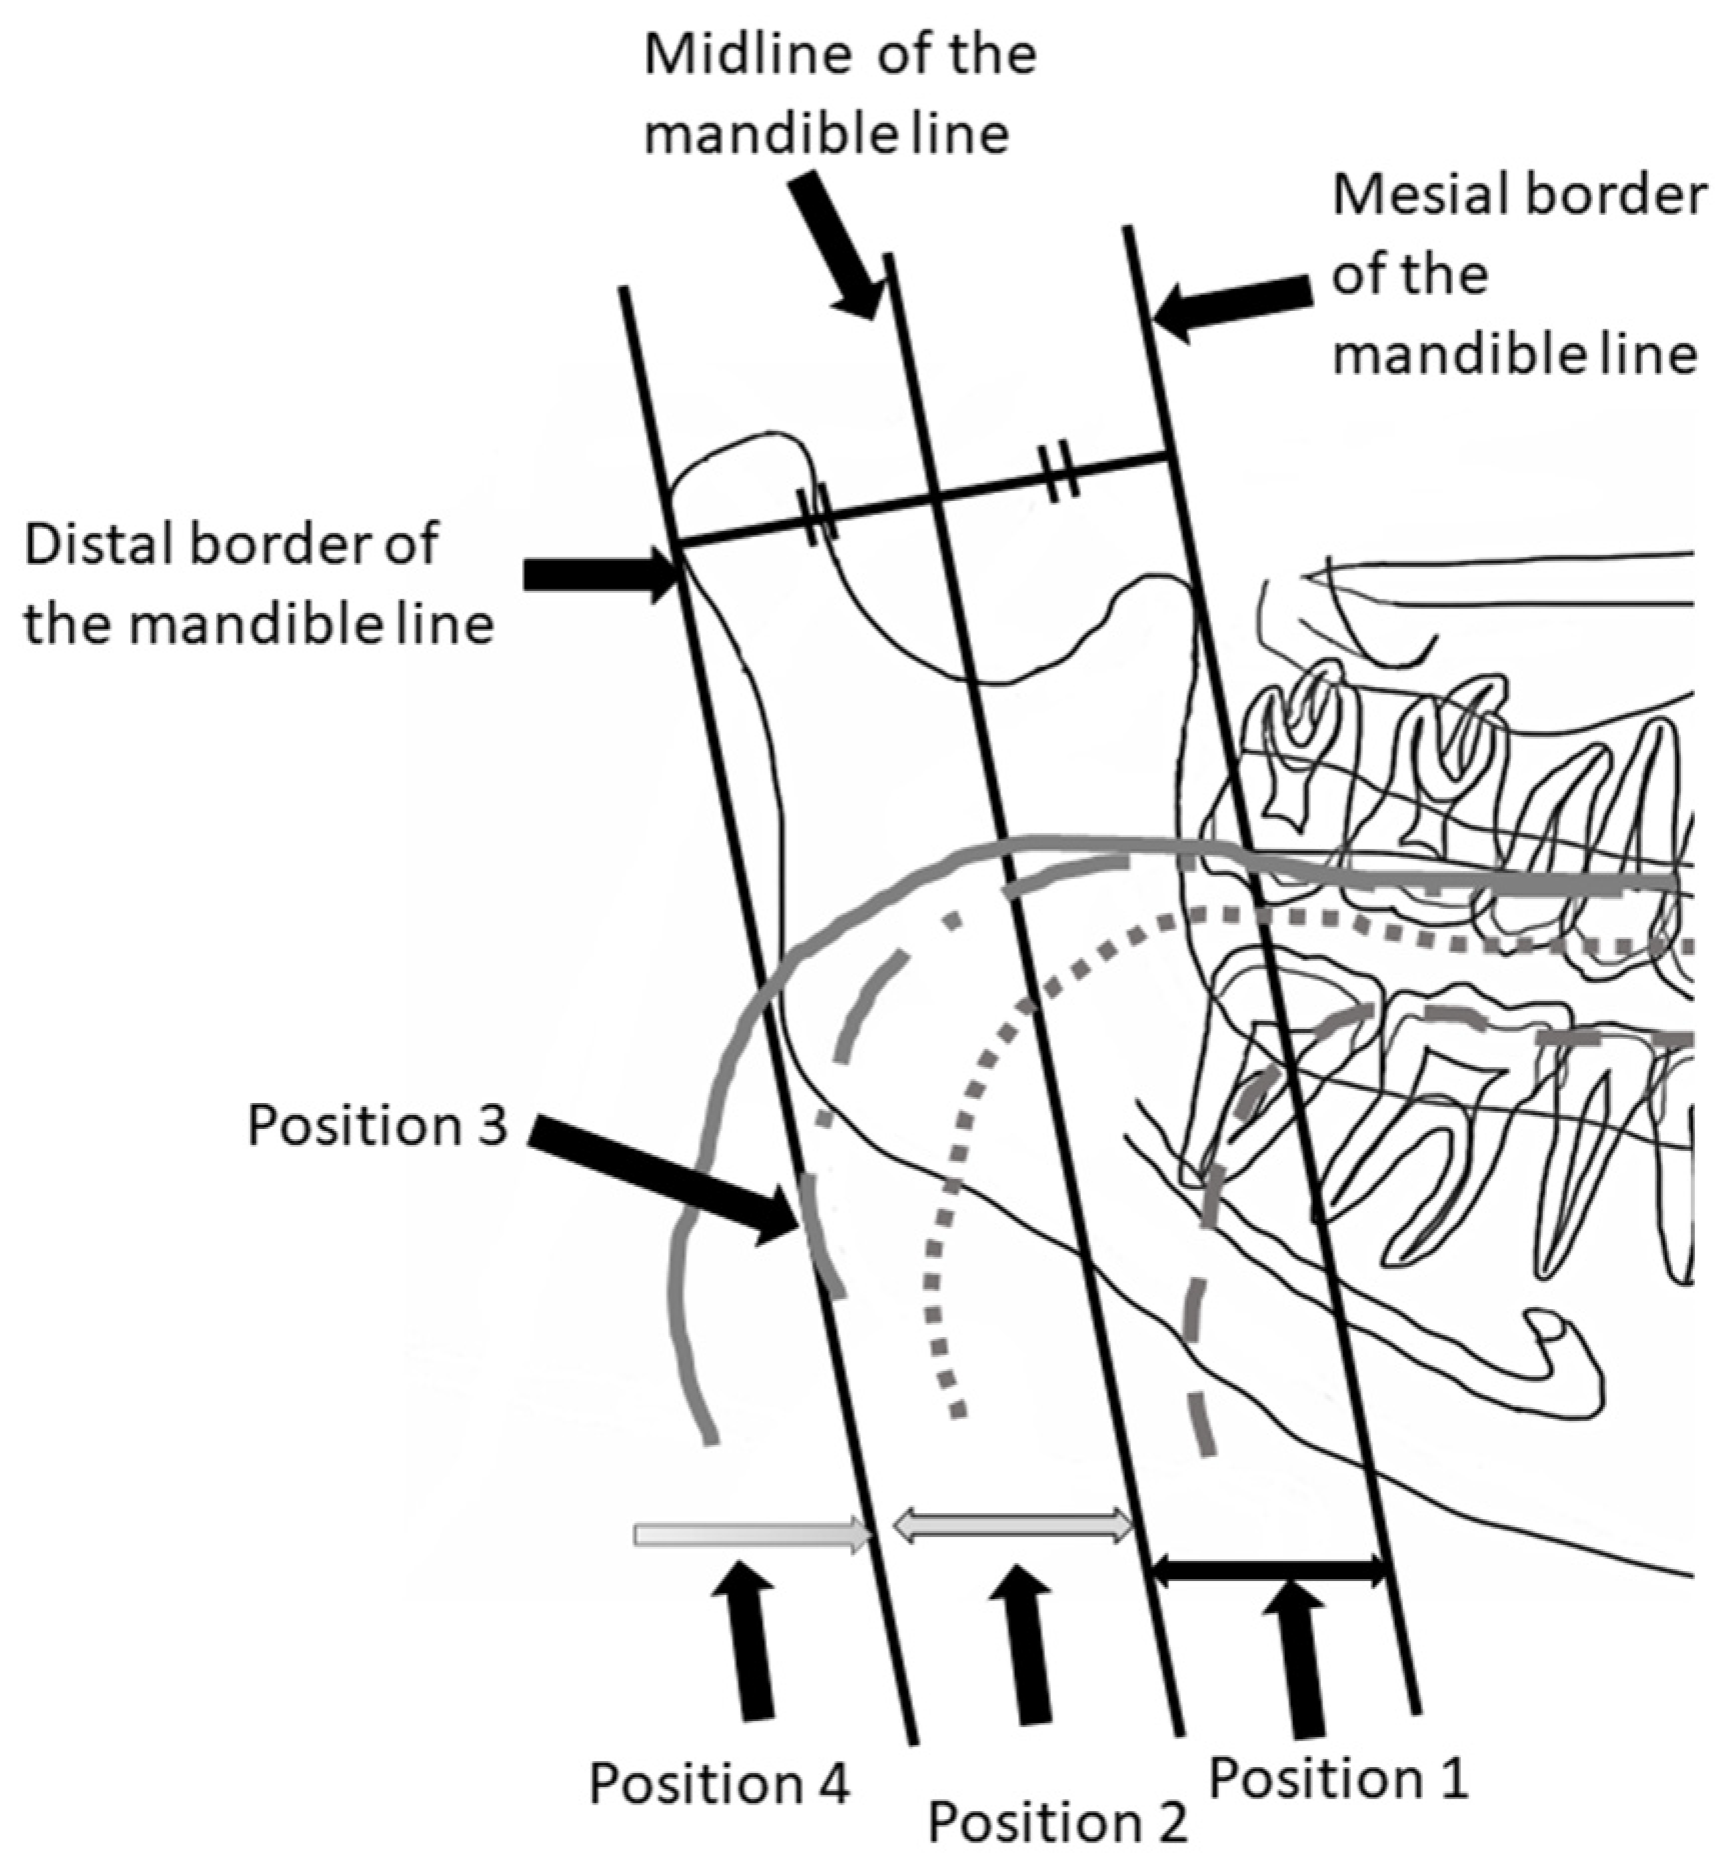
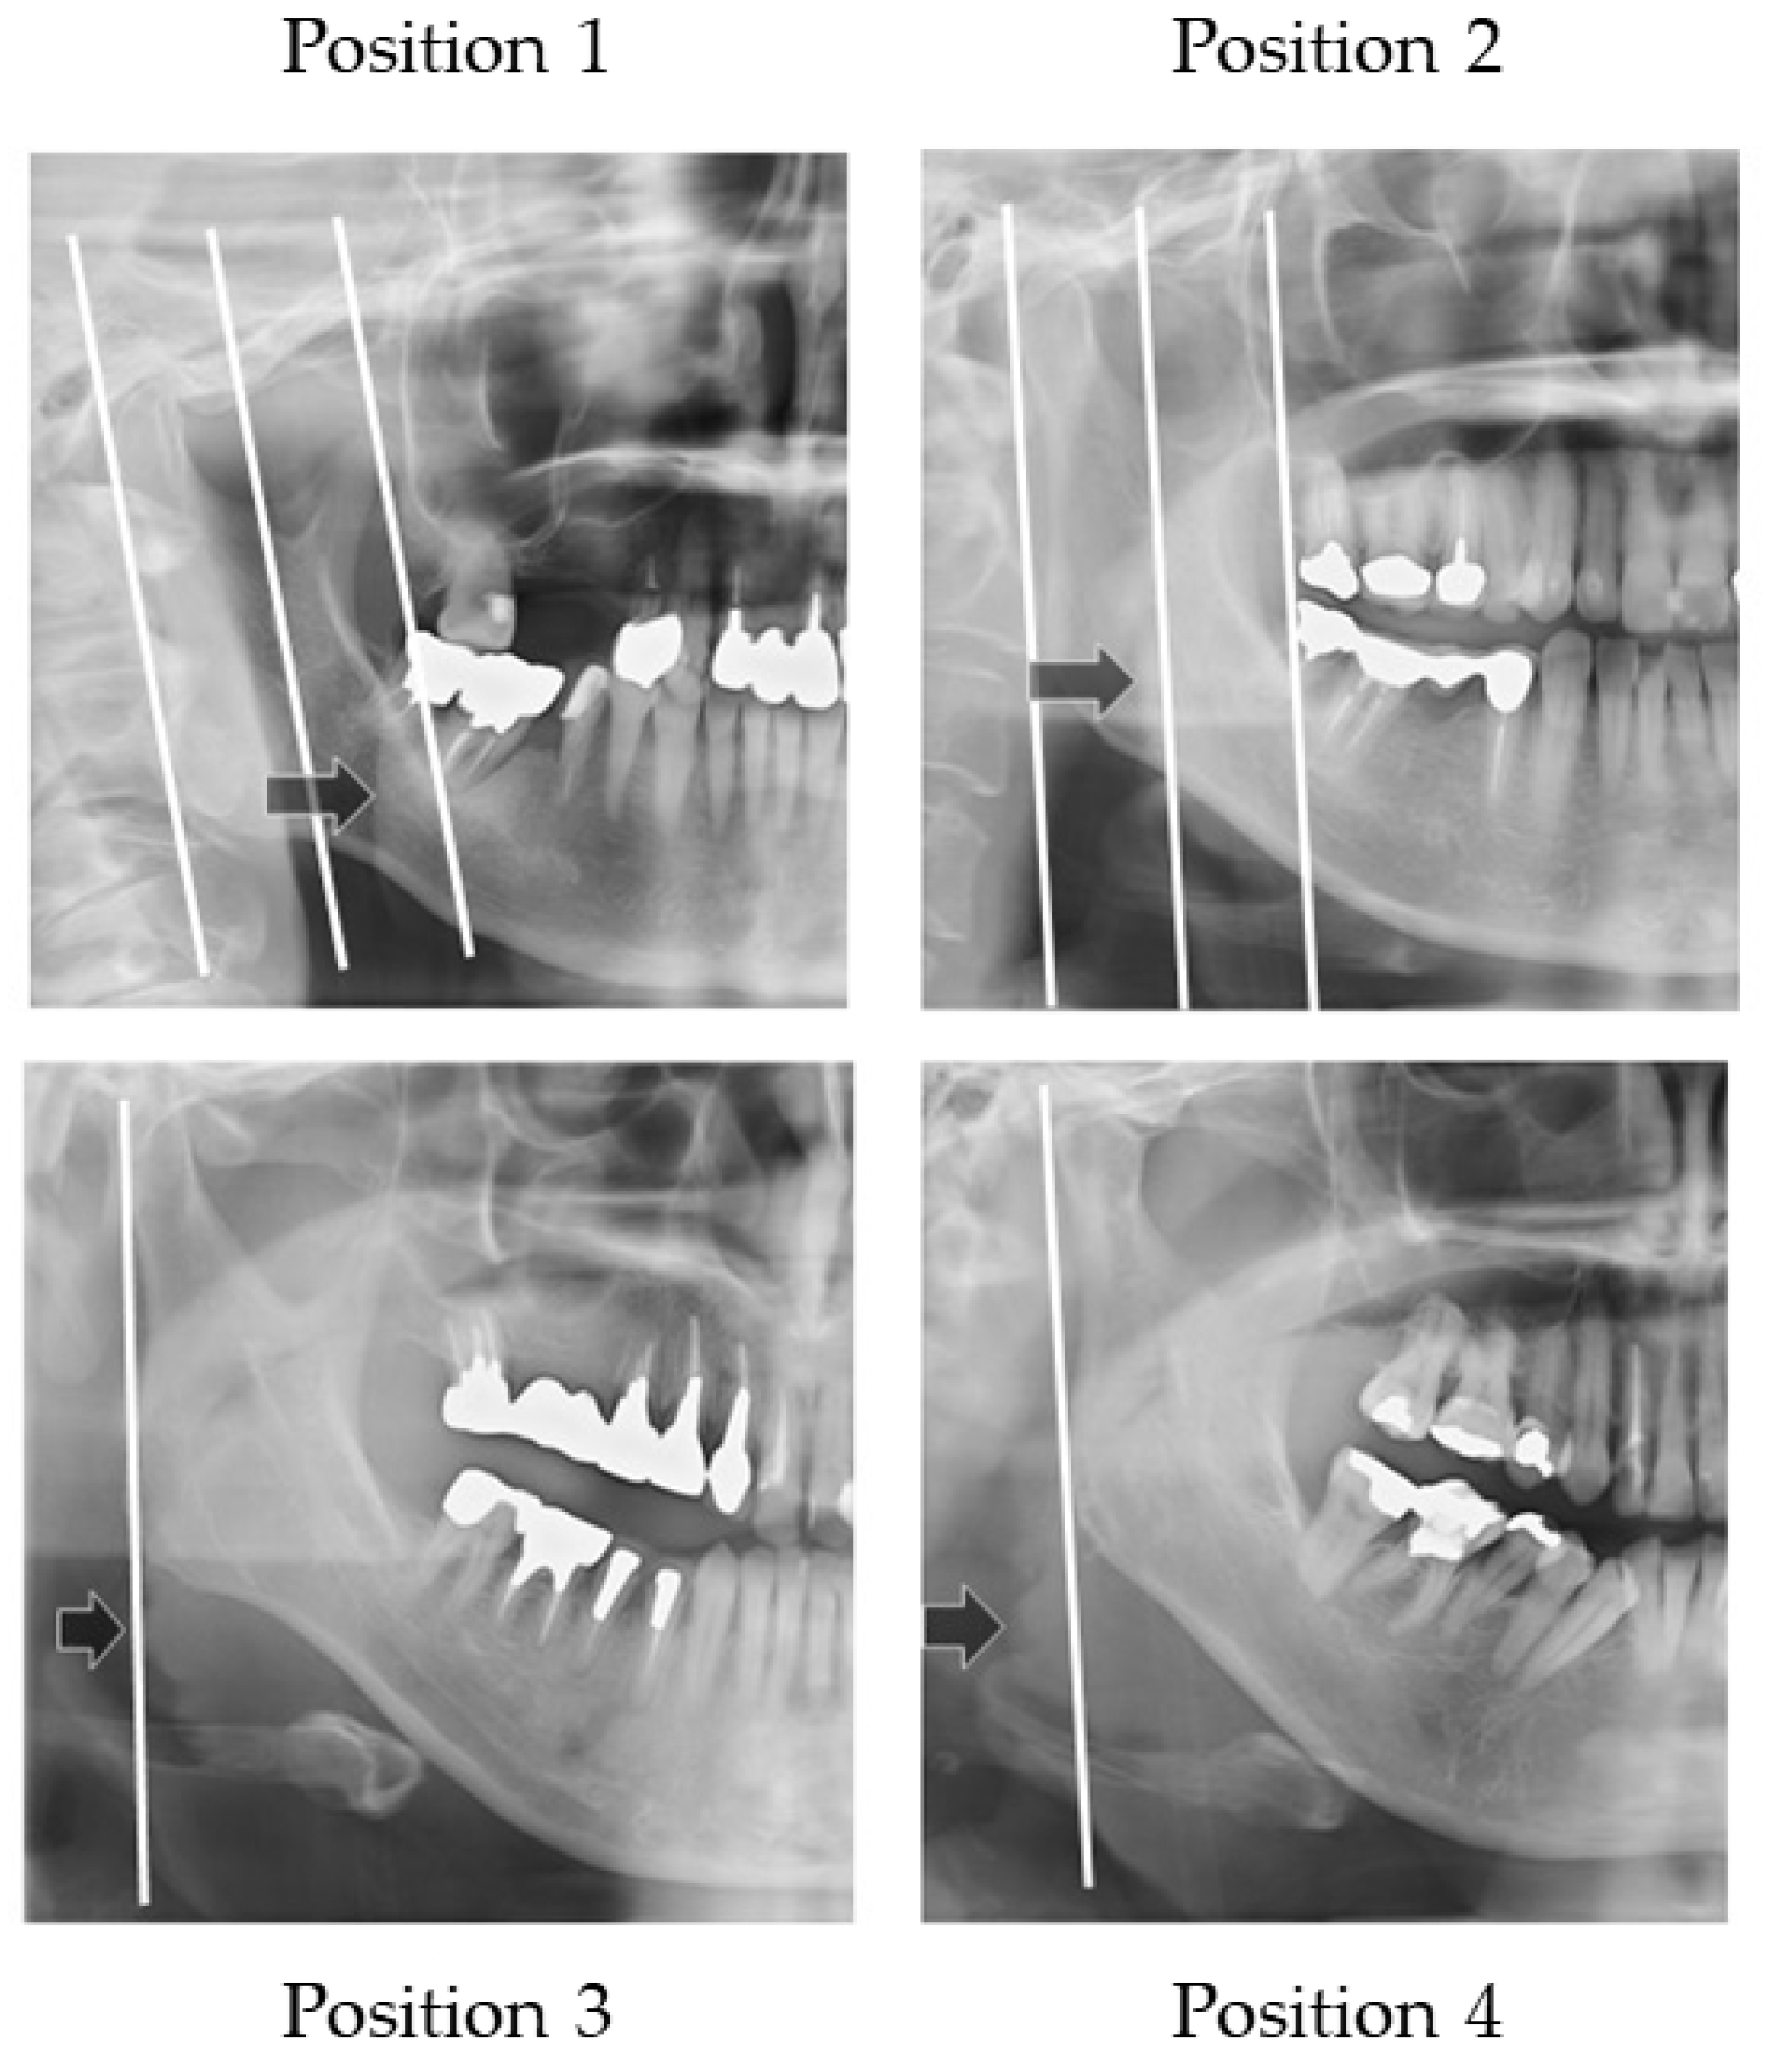
Figure 6 illustrates how to evaluate the outer position of tongue and
Figure 7 shows sample images. The width of tongue was assessed according to the location where the outer border of tongue overlapped the anatomical structure. If the right side and left side of the outer border of the tongue were different, the inner position side was used.
Three landmarks were defined, as follows:
The distal border of the mandible line is a simulated line, which is defined between the posterior point of the mandibular condyle and posterior point of the angle of the mandible.
The mesial border of the mandible line is defined as the line that is the distal border line moved in parallel to the coronoid process.
The midline of the border of the mandible line is defined as the midline of the distal border of the mandible line and the mesial border of the mandible line.
The outer border of tongue is defined according to the following positions:
Position 1: Observed between the mesial border of the mandible line and the midline border of the mandible line;
Position 2: Observed between the midline of border of the mandible line and the distal border of the mandible line;
Position 3: Observed on the distal border of the mandible line;
Position 4: Observed outside of the distal border of the mandible line.
2.5. Classified Dysphagia (+) and Dysphagia (−) Groups
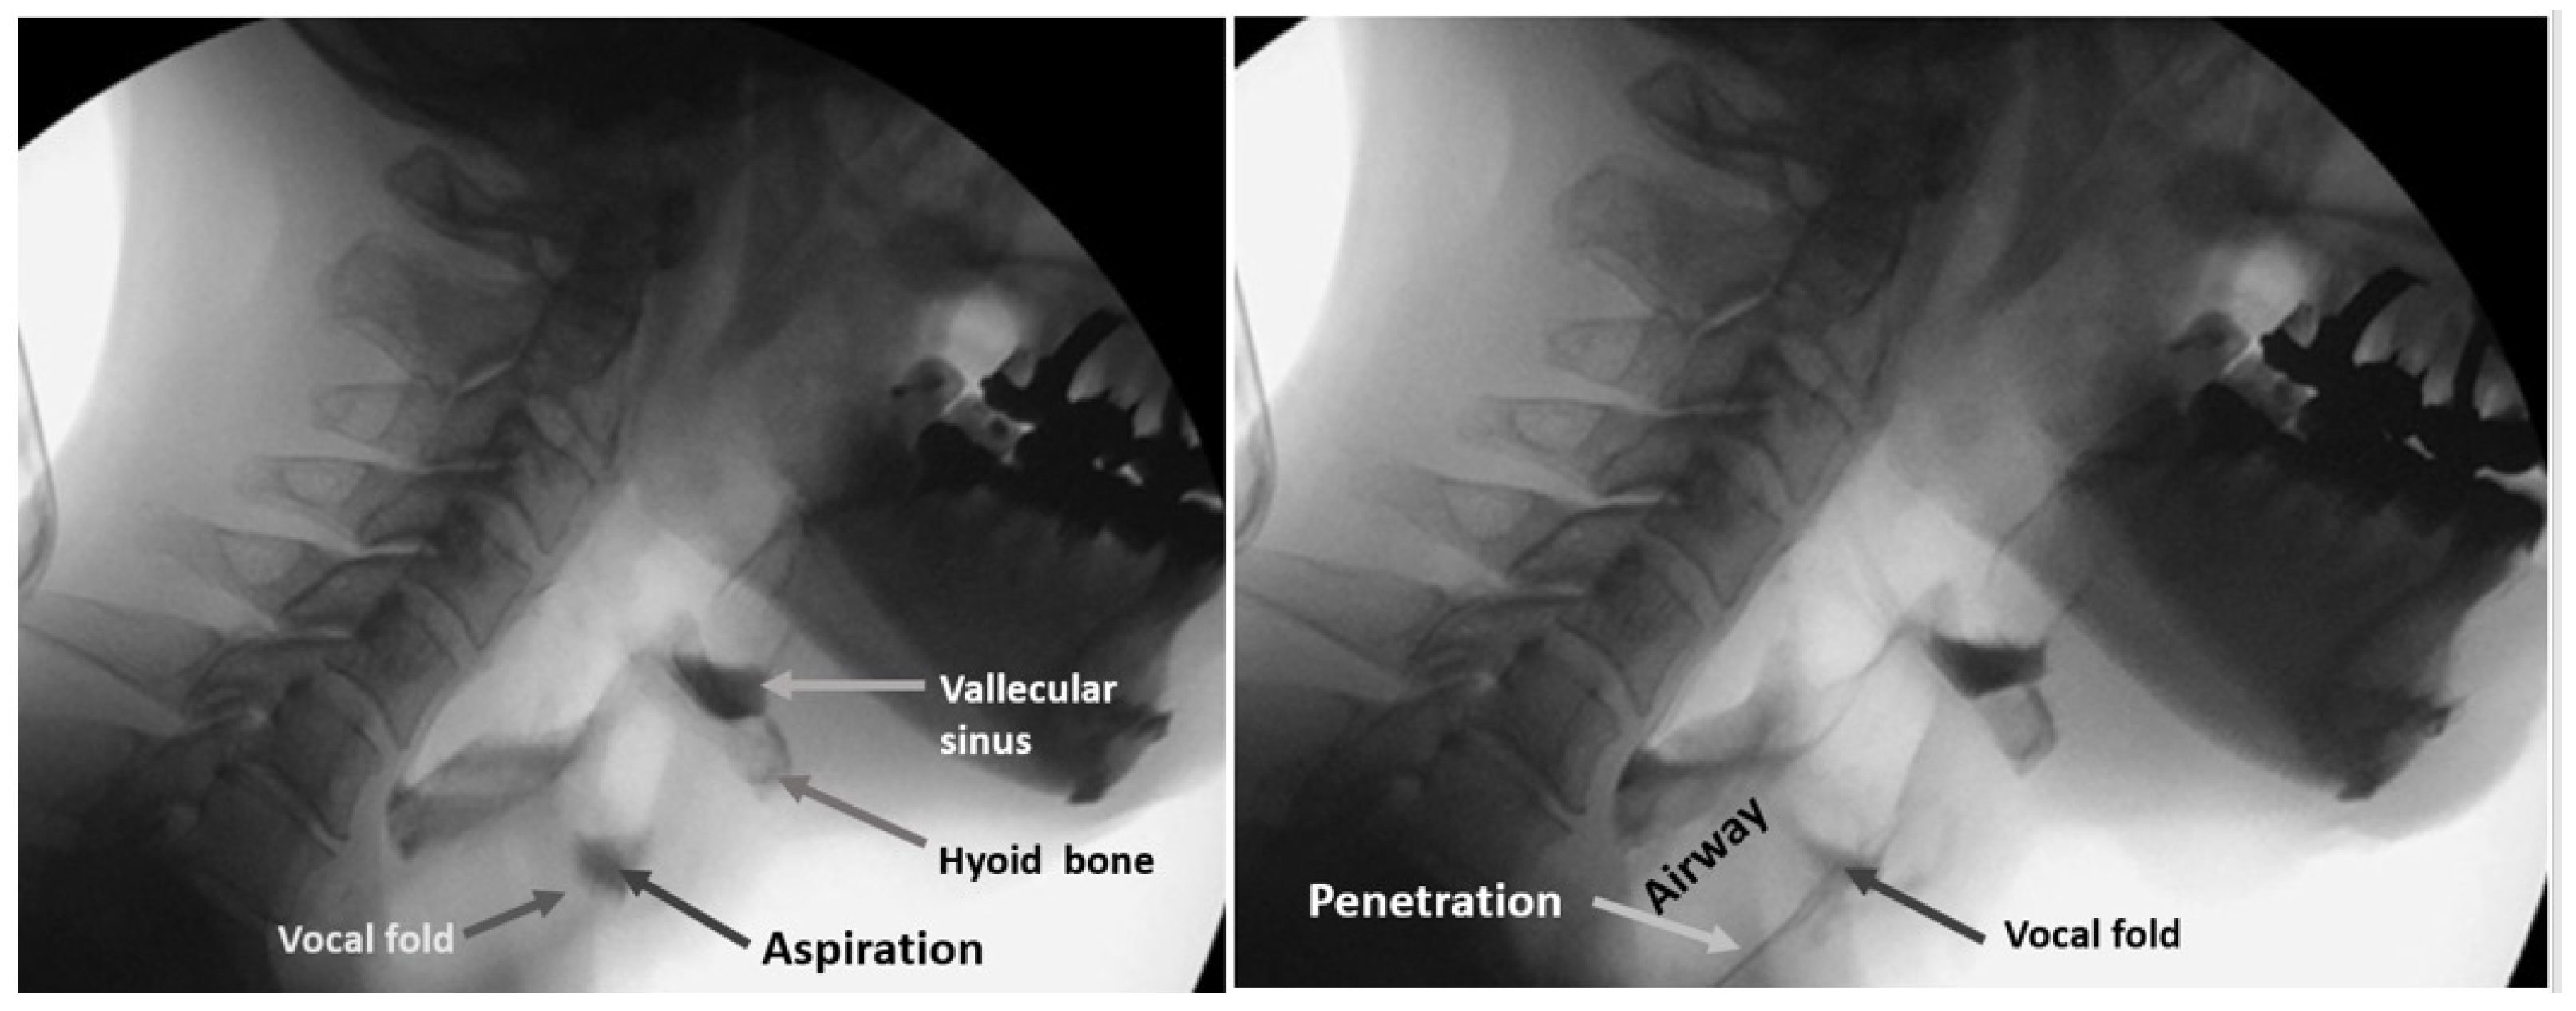
The protocol for the VF of each patient involved presentation of swallows with 1 to 3 mL standard meals with barium without any instruction for swallowing. All three or four dentists involved in the examination inspected laryngeal invasion, aspiration, and accumulation of epiglottis valley/pyriform sinus. At least two of the three or four observers were qualified as Board Certified Fellows of the Japanese Society of Dysphagia Rehabilitation. The examiners in the VF room can miss the findings on the monitor because they are concentrating on the patient’s condition. In our hospital, one or two dentists are in the VF room, and the others are outside the VF room, checking the monitor, to obtain consensus.
Figure 8 shows the sample VF images of aspiration (left image) and penetration (right image).
Observers recorded these findings on the VF exam chart. These VF exam charts were used for the classification of a dysphagia (+) case and (−) case. In this study, penetration and aspiration cases were treated as a dysphagia (+) case.
2.6. Statistical Analysis
2.6.1. Logistic Regression Analysis
SPSS Statistics Ver. 27.0 (International Business Machines Corporation, Chicago, IL, USA) was used.
The logistic regression test was used to analyze the independent influencing prognostic factors of the risk of dysphagia. A two-sided p-value of <0.05 was considered significant. Differences were analyzed between the dysphagia (+) and dysphagia (−) groups in age, gender, number of remaining teeth, vertical and horizontal hyoid bone position, the distance of the tongue to the plate, and the width of the tongue.
A correlation matrix was created in advance when the independent variables were input, and it was confirmed that there was no strong correlation between the independent variables with r > 0.80.
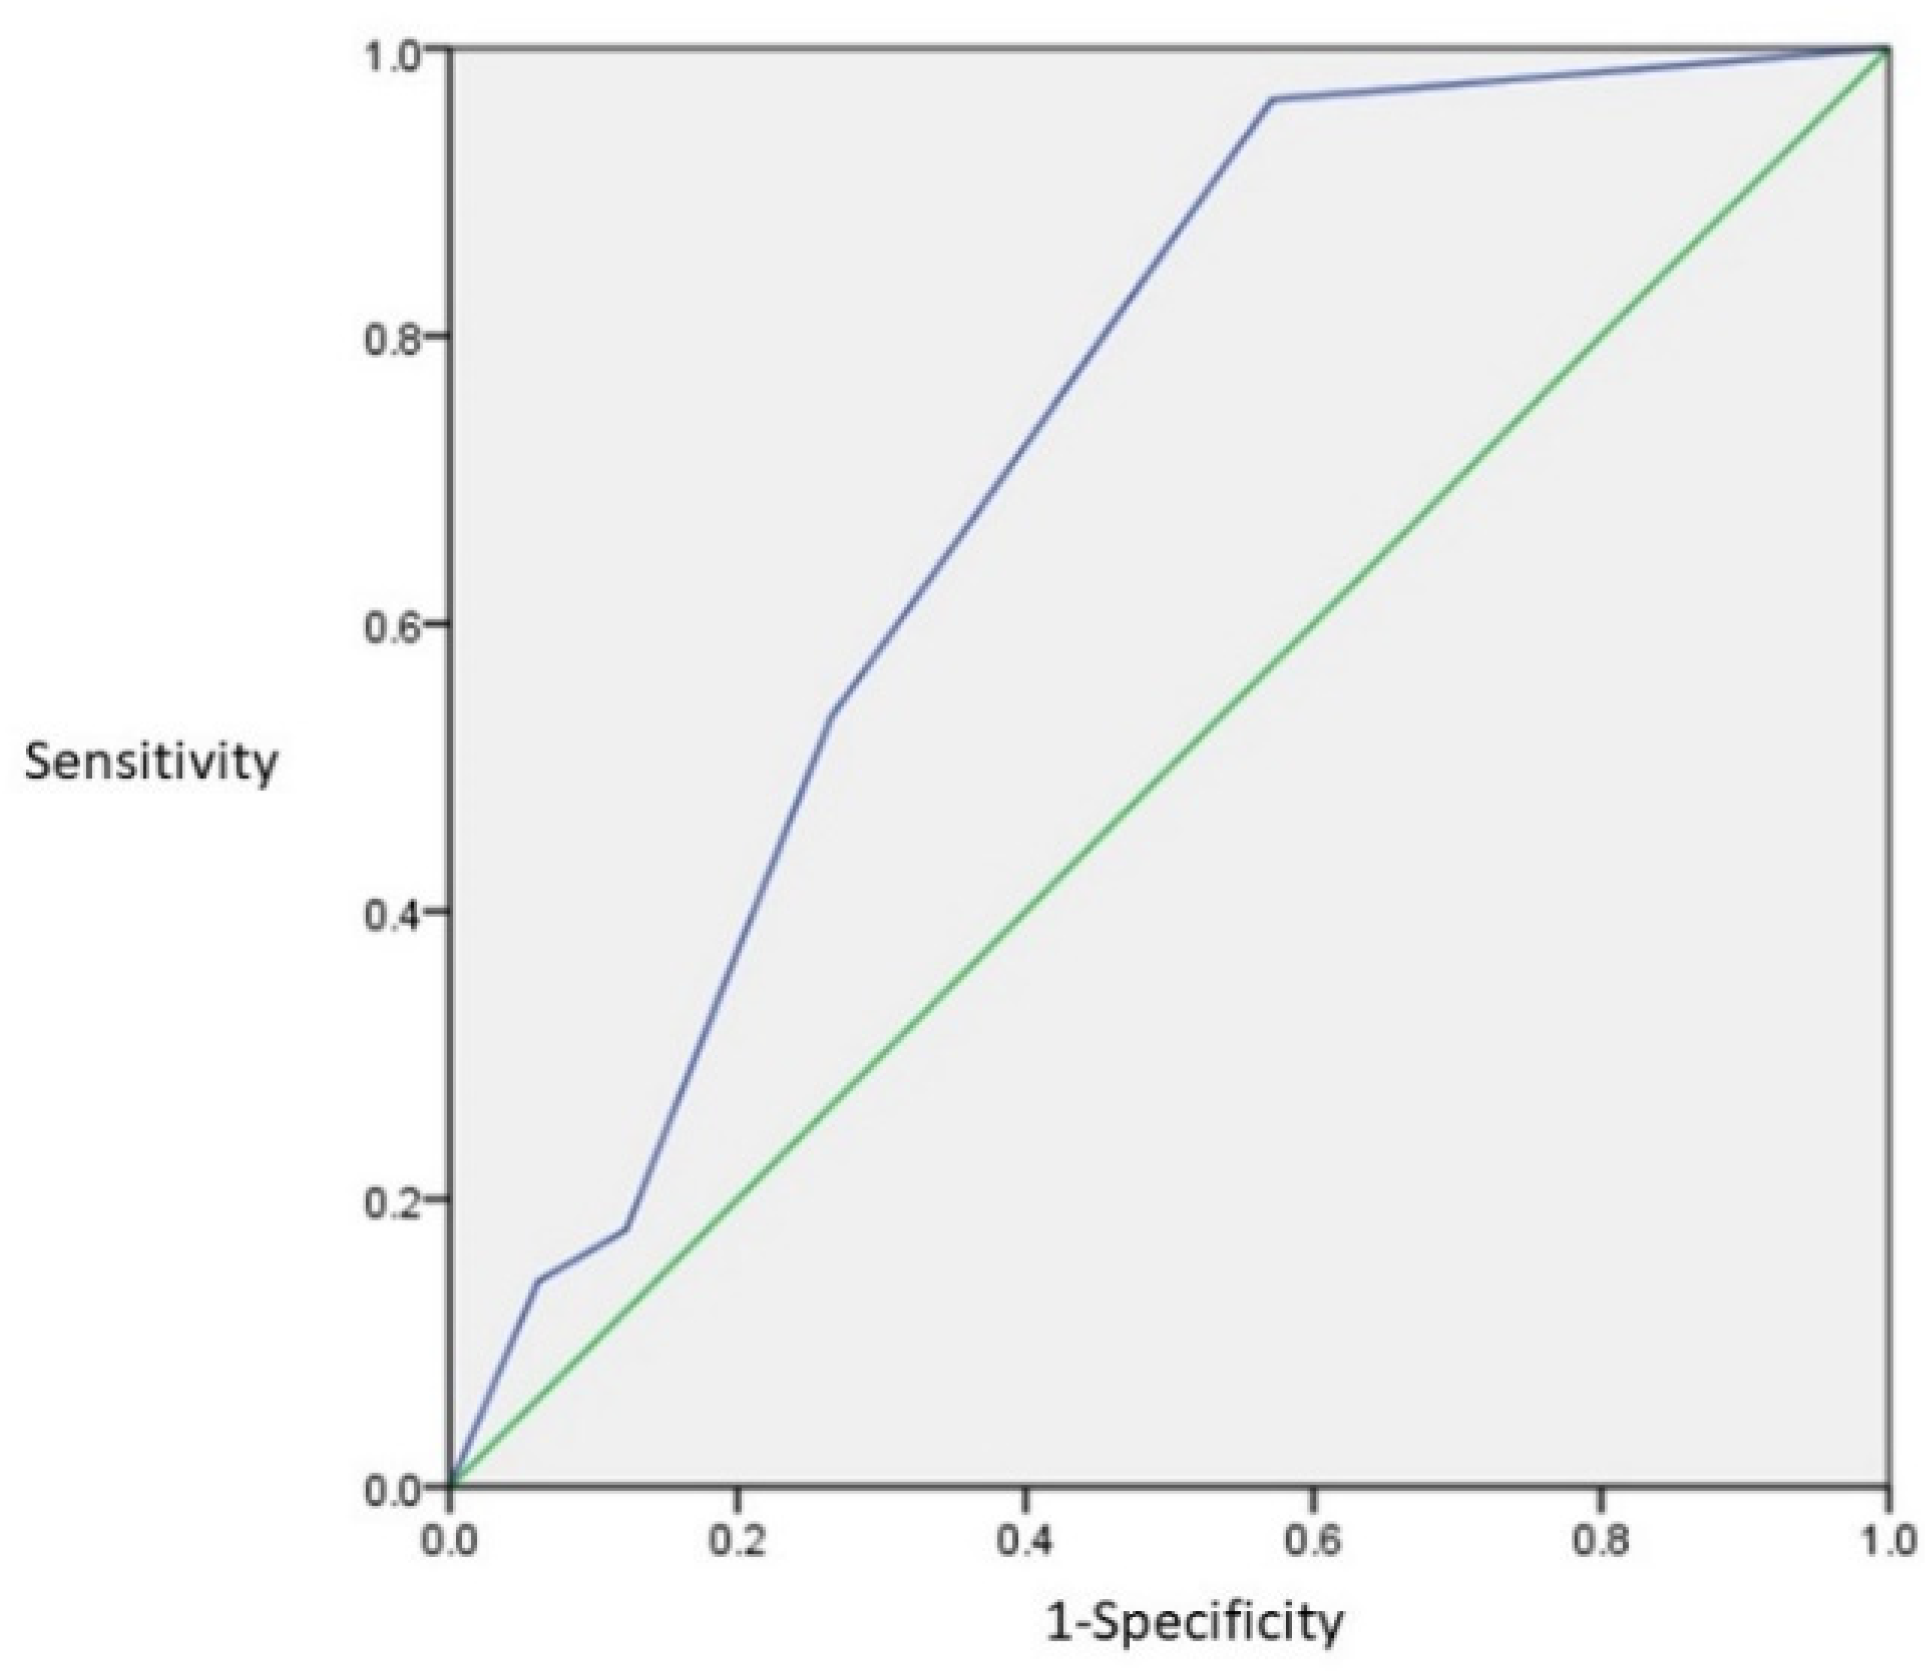
2.6.2. Decision of Cutoff Level
The effective factor, which was defined by logistic regression analysis, a receiver operating characteristic curve (ROC curve), and the decision on the cutoff level, was achieved using JMP Pro Ver. 16.0 (SAS Institute Inc., Cary, NC, USA). Cutoff level was determined using the Youden Index. It consisted of the maximum number of Sensitivity-(1-Specificity).


