
High Sensitivity and Specificity of Dormitory-Level Wastewater Surveillance for COVID-19 during Fall Semester 2020 at Syracuse University, New York

 ,
,
Abstract
:1. Introduction
2. Methods
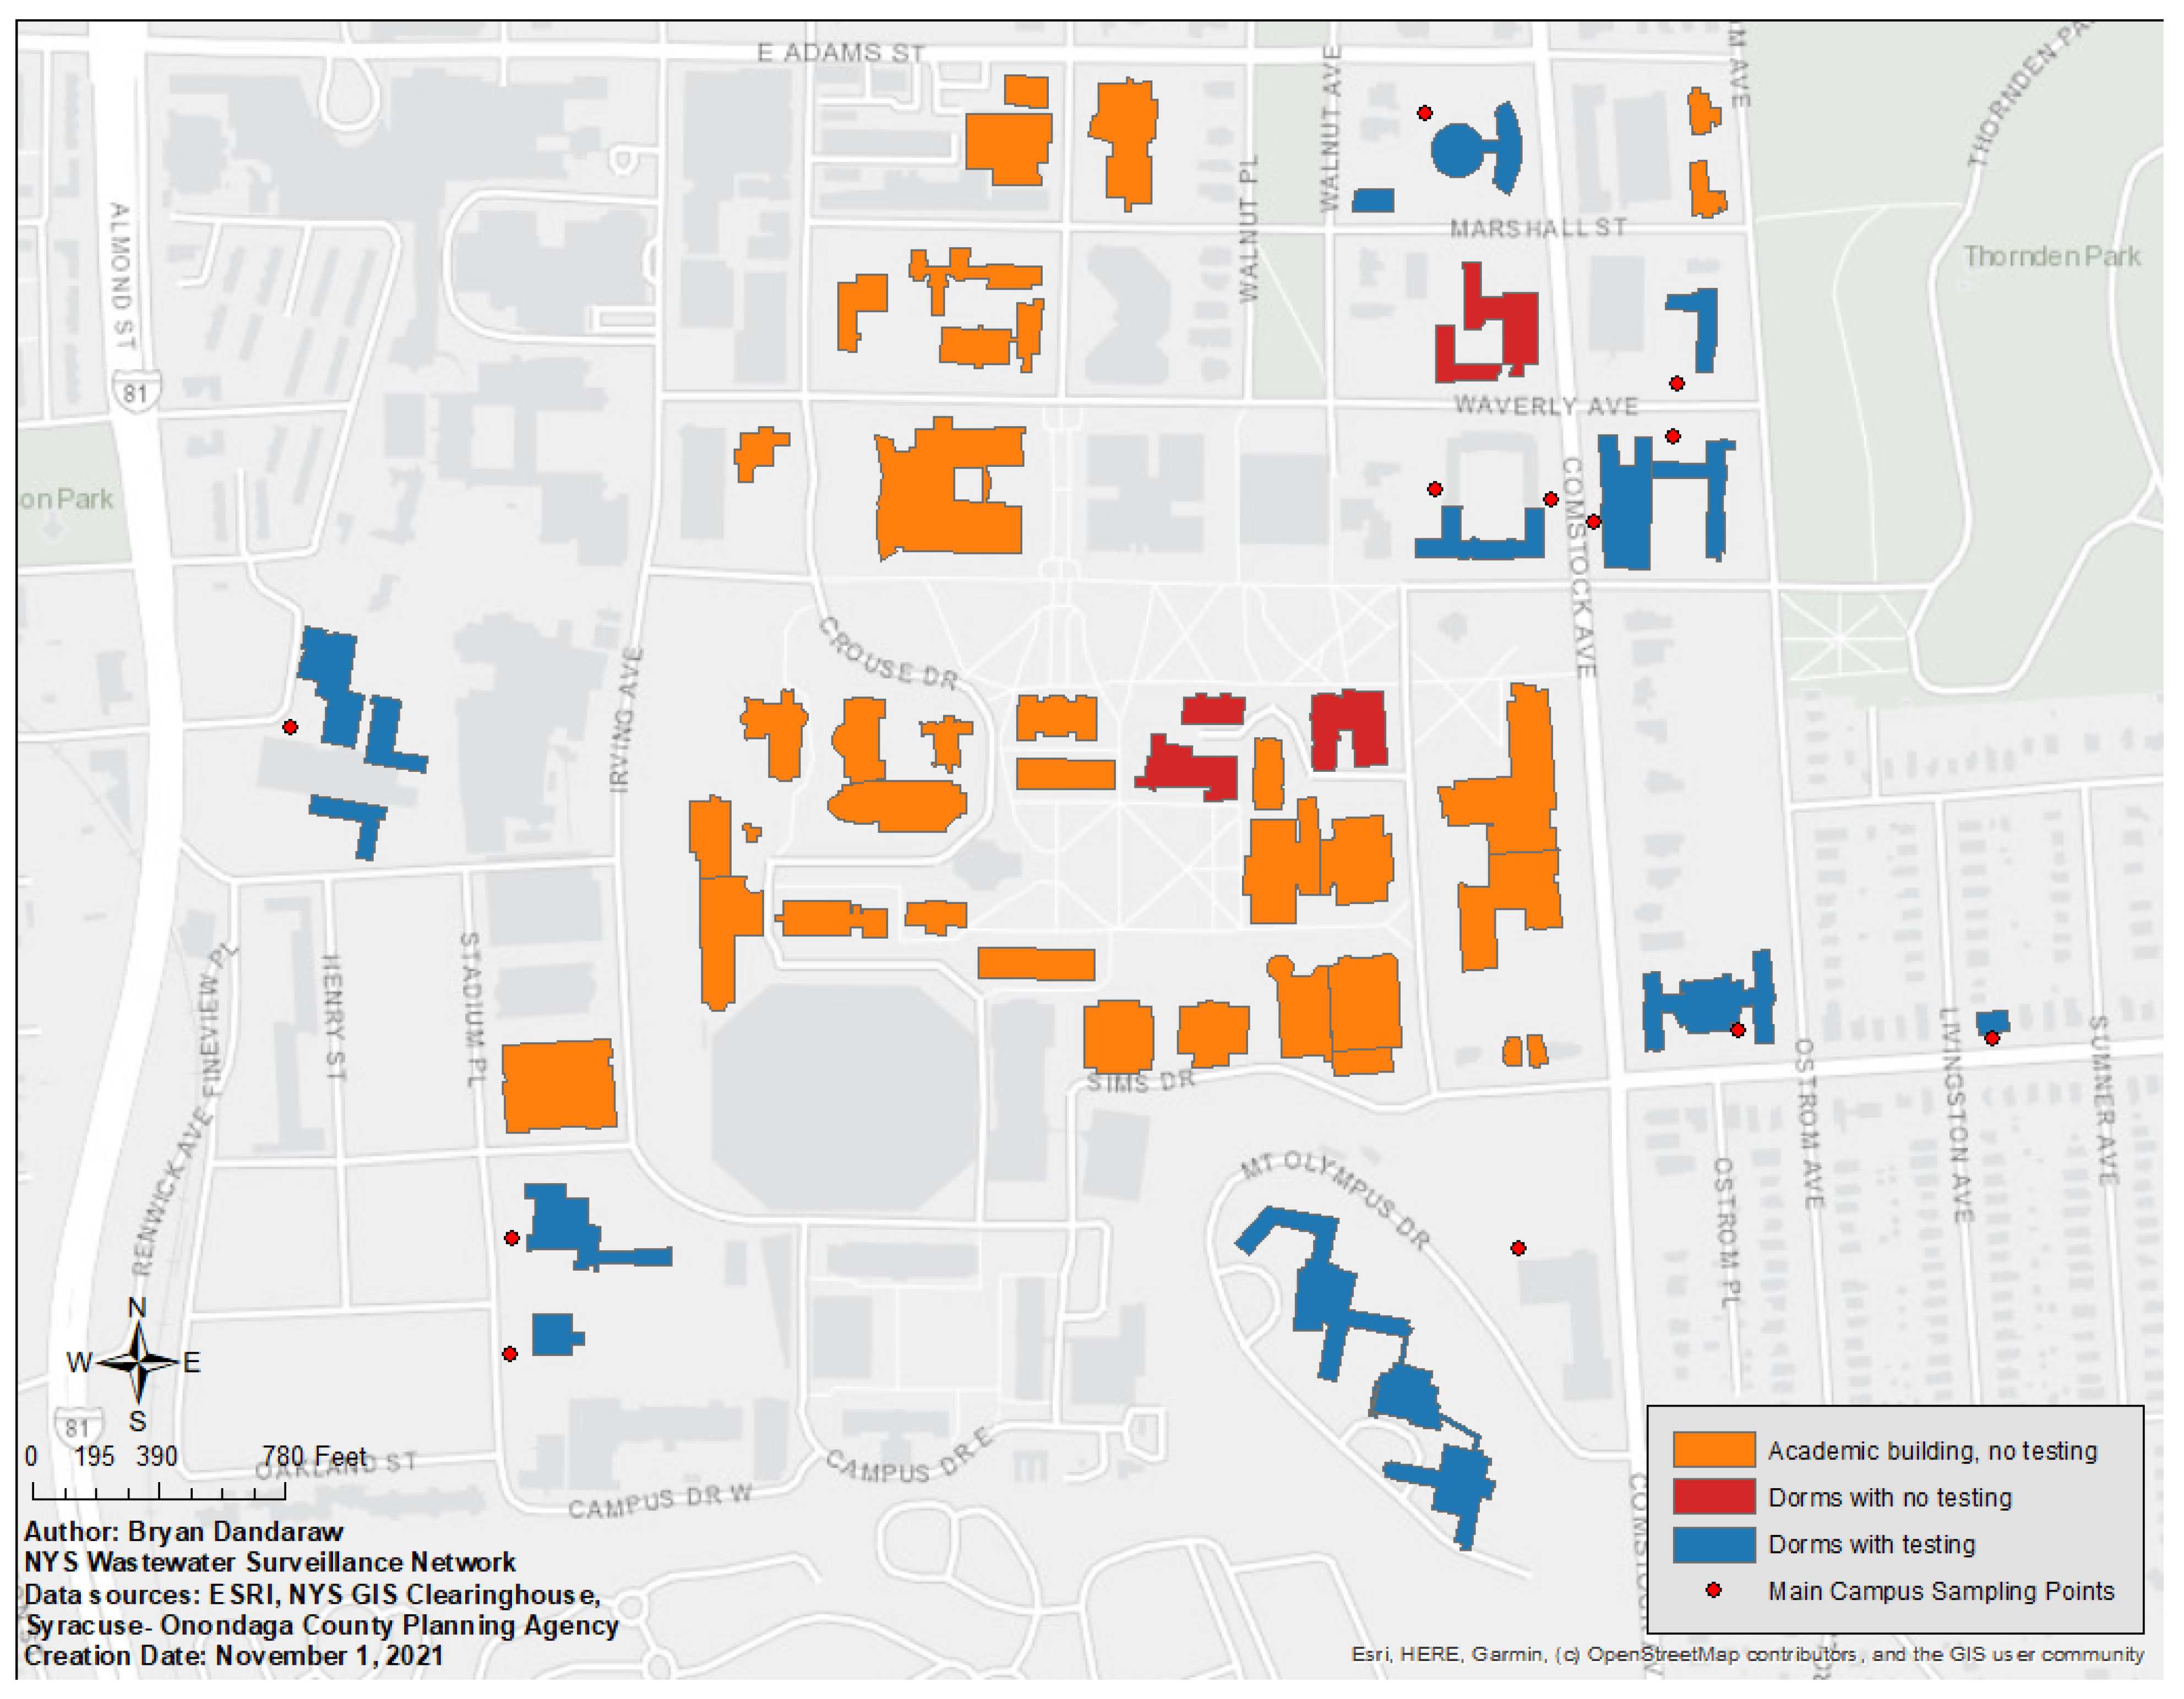
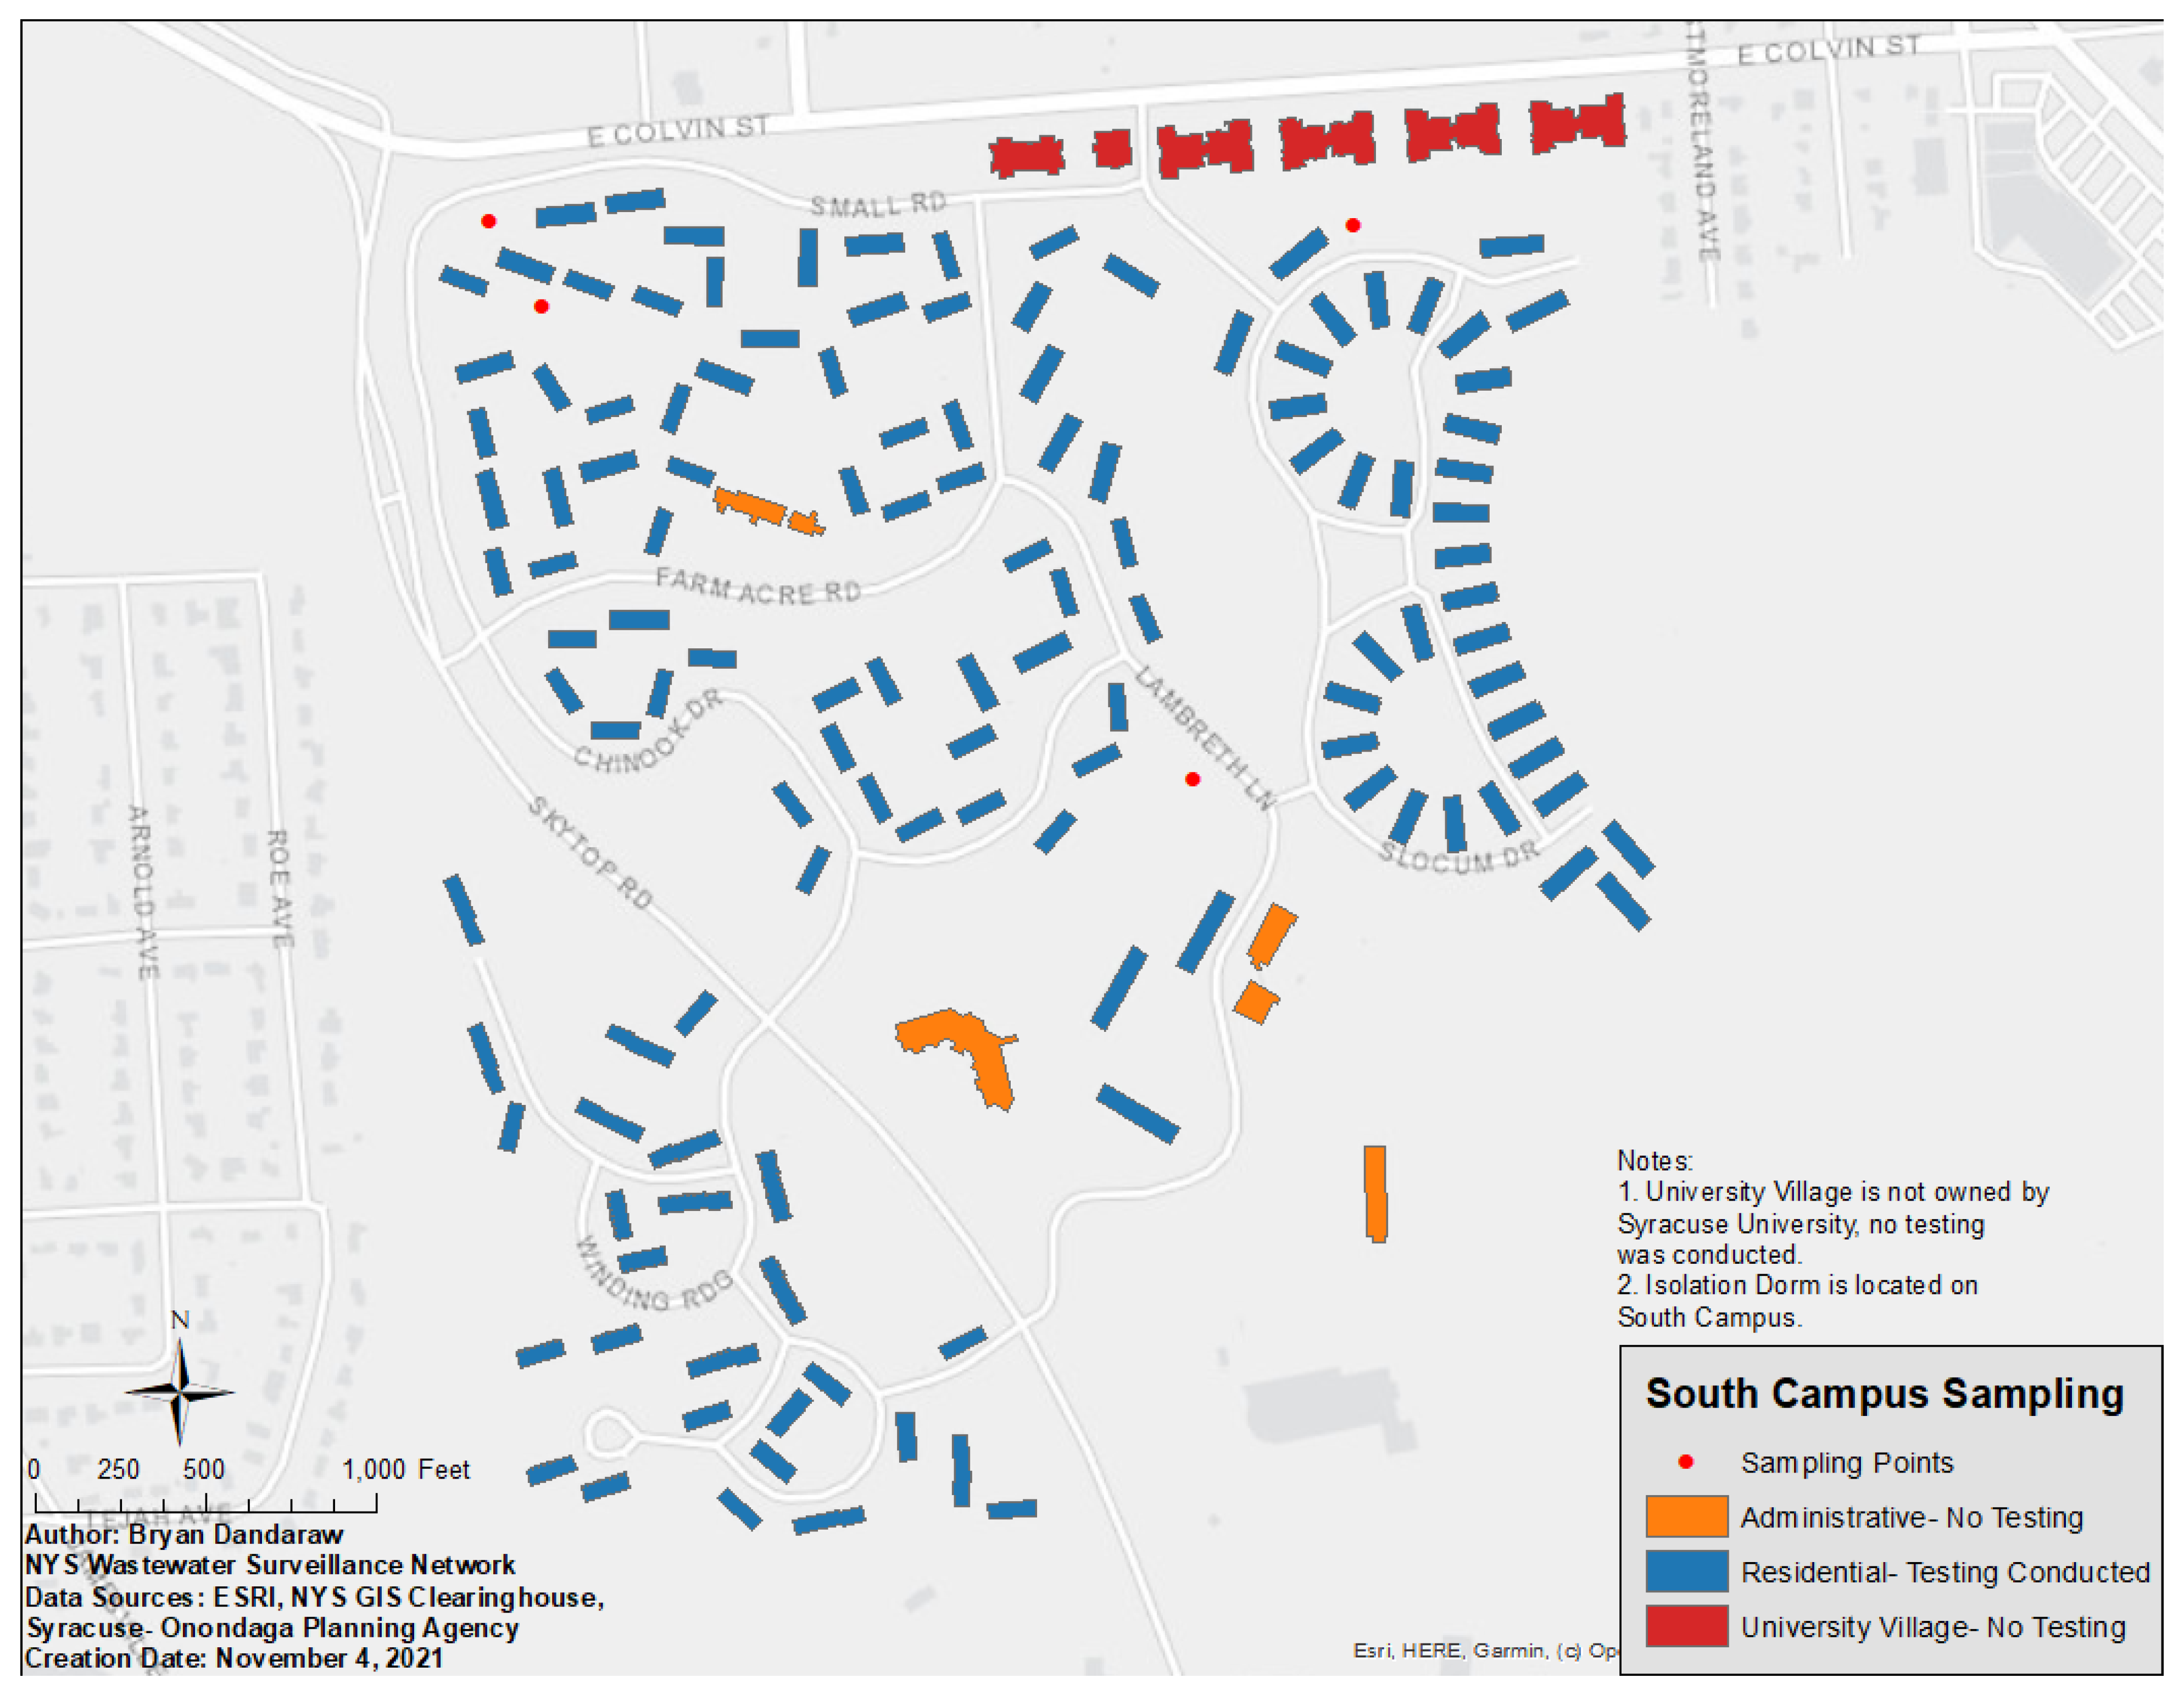
2.1. Setting
2.2. Wastewater Testing
2.3. Case Data
2.4. Data Analysis
3. Results
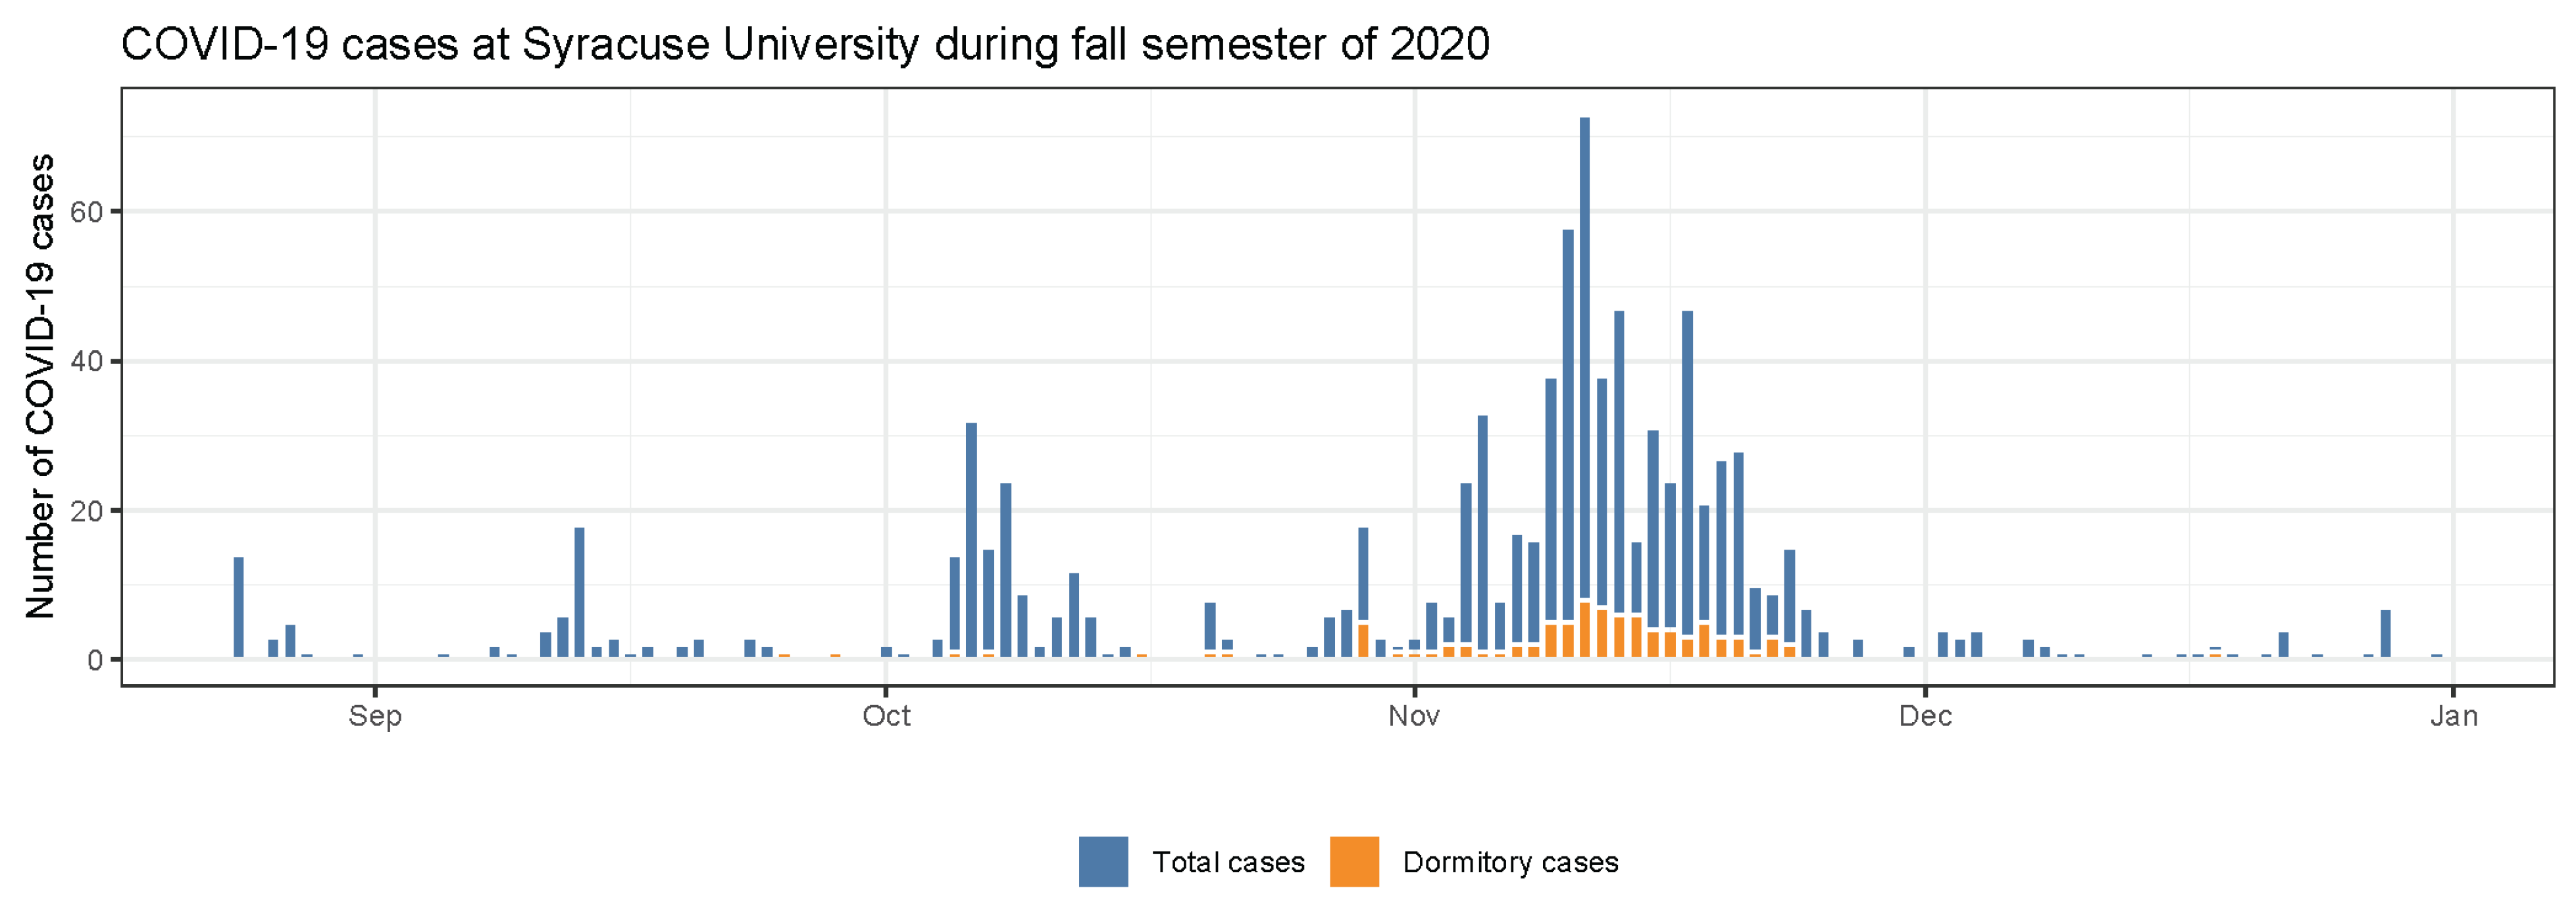
3.1. COVID-19 Cases at Syracuse University during Fall Semester 2020
3.2. Characteristics of Wastewater Samples Collected
3.3. Sensitivity and Positive Predictive Value of Wastewater Surveillance to Detect COVID-19 Cases for Each Sampling Point
4. Discussion
Limitations
5. Conclusions
Author Contributions
Funding
Institutional Review Board Statement
Informed Consent Statement
Data Availability Statement
Conflicts of Interest
References
- Sims, N.; Kasprzyk-Hordern, B. Future perspectives of wastewater-based epidemiology: Monitoring infectious disease spread and resistance to the community level. Environ. Int. 2020, 139, 105689. [Google Scholar] [CrossRef] [PubMed]
- Larsen, D.A.; Wigginton, K.R. Tracking COVID-19 with wastewater. Nat. Biotechnol. 2020, 38, 1151–1153. [Google Scholar] [CrossRef] [PubMed]
- Kilaru, P.; Hill, D.; Anderson, K.; Collins, M.B.; Green, H.; Kmush, B.L.; Larsen, D.A. Wastewater Surveillance for Infectious Disease: A Systematic Review. medRxiv 2021. [Google Scholar] [CrossRef]
- Asghar, H.; Diop, O.M.; Weldegebriel, G.; Malik, F.; Shetty, S.; Bassioni, L.E.; Akande, A.O.; Maamoun, E.A.; Zaidi, S.; Adeniji, A.J.; et al. Environmental Surveillance for Polioviruses in the Global Polio Eradication Initiative. J. Infect. Dis. 2014, 210, S294–S303. [Google Scholar] [CrossRef] [PubMed] [Green Version]
- Aarestrup, F.M.; Woolhouse, M.E.J. Using sewage for surveillance of antimicrobial resistance. Science 2020, 367, 630–632. [Google Scholar] [CrossRef]
- Zuccato, E.; Chiabrando, C.; Castiglioni, S.; Bagnati, R.; Fanelli, R. Estimating Community Drug Abuse by Wastewater Analysis. Environ. Health Perspect. 2008, 116, 1027–1032. [Google Scholar] [CrossRef] [Green Version]
- Medema, G.; Heijnen, L.; Elsinga, G.; Italiaander, R.; Brouwer, A. Presence of SARS-Coronavirus-2 RNA in Sewage and Correlation with Reported COVID-19 Prevalence in the Early Stage of the Epidemic in The Netherlands. Environ. Sci. Technol. Lett. 2020, 7, 511–516. [Google Scholar] [CrossRef]
- Naughton, C.C.; Roman, F.A.; Alvarado, A.G.F.; Tariqi, A.Q.; Deeming, M.A.; Bibby, K.; Bivins, A.; Rose, J.B.; Medema, G.; Ahmed, W.; et al. Show Us the Data: Global COVID-19 Wastewater Monitoring Efforts, Equity, and Gaps. medRxiv 2021. [Google Scholar] [CrossRef]
- Huisman, J.S.; Scire, J.; Caduff, L.; Fernandez-Cassi, X.; Ganesanandamoorthy, P.; Kull, A.; Scheidegger, A.; Stachler, E.; Boehm, A.B.; Hughes, B.; et al. Wastewater-Based Estimation of the Effective Reproductive Number of SARS-CoV-2. medRxiv 2021. [Google Scholar] [CrossRef]
- Larsen, D.A.; Collins, M.B.; Du, Q.; Hill, D.; Insaf, T.Z.; Kilaru, P.; Kmush, B.L.; Middleton, F.; Stamm, A.; Wilder, M.L.; et al. Coupling freedom from disease principles and early warning from wastewater surveillance to improve health security. PNAS Nexus 2022, 1, pgac001. [Google Scholar] [CrossRef]
- Galani, A.; Aalizadeh, R.; Kostakis, M.; Markou, A.; Alygizakis, N.; Lytras, T.; Adamopoulos, P.G.; Peccia, J.; Thompson, D.C.; Kontou, A.; et al. SARS-CoV-2 wastewater surveillance data can predict hospitalizations and ICU admissions. Sci. Total Environ. 2021, 804, 150151. [Google Scholar] [CrossRef] [PubMed]
- Harris-Lovett, S.; Nelson, K.L.; Beamer, P.; Bischel, H.N.; Bivins, A.; Bruder, A.; Butler, C.; Camenisch, T.D.; De Long, S.K.; Karthikeyan, S.; et al. Wastewater Surveillance for SARS-CoV-2 on College Campuses: Initial Efforts, Lessons Learned, and Research Needs. Int. J. Environ. Res. Public Health 2021, 18, 4455. [Google Scholar] [CrossRef] [PubMed]
- Betancourt, W.Q.; Schmitz, B.W.; Innes, G.K.; Prasek, S.M.; Brown, K.M.P.; Stark, E.R.; Foster, A.R.; Sprissler, R.S.; Harris, D.T.; Sherchan, S.P.; et al. COVID-19 containment on a college campus via wastewater-based epidemiology, targeted clinical testing and an intervention. Sci. Total Environ. 2021, 779, 146408. [Google Scholar] [CrossRef] [PubMed]
- Gibas, C.; Lambirth, K.; Mittal, N.; Juel, M.A.I.; Barua, V.B.; Brazell, L.R.; Hinton, K.; Lontai, J.; Stark, N.; Young, I.; et al. Implementing building-level SARS-CoV-2 wastewater surveillance on a university campus. Sci. Total Environ. 2021, 782, 146749. [Google Scholar] [CrossRef]
- Kilaru, P.; Larsen, D.; Monk, D. Design and Utilization of Homemade Wastewater Samplers during the COVID-19 Pandemic. engrXiv 2020. [Google Scholar] [CrossRef]
- Wilder, M.L.; Middleton, F.; Larsen, D.A.; Du, Q.; Fenty, A.; Zeng, T.; Insaf, T.; Kilaru, P.; Collins, M.; Kmush, B.; et al. Co-quantification of crAssphage increases confidence in wastewater-based epidemiology for SARS-CoV-2 in low prevalence areas. Water Res. X 2021, 11, 100100. [Google Scholar] [CrossRef]
- Institut Pasteur. Protocol: Real-Time RT-PCR Assays for the Detection of SARS-CoV-2; Institut Pasteur: Paris, Franch, 2020. [Google Scholar]
- Stevenson, M.; Sergeant, E.; Nunes, T.; Heuer, C.; Marshall, J.; Sanchez, J.; Thornton, R.; Reiczigel, J.; Robison-Cox, J.; Sebastiani, P.; et al. EpiR: Tools for the Analysis of Epidemiological Data; 2021. [Google Scholar]
- R Core Team. R: A Language and Environment for Statistical Computing; R Core Team: Vienna, Austria, 2021; Available online: http://www.R-project.org/ (accessed on 25 February 2022).
- Wang, Y.; Liu, P.; Zhang, H.; Ibaraki, M.; VanTassell, J.; Geith, K.; Cavallo, M.; Kann, R.; Saber, L.; Kraft, C.S.; et al. Early warning of a COVID-19 surge on a university campus based on wastewater surveillance for SARS-CoV-2 at residence halls. Sci. Total Environ. 2022, 821, 153291. [Google Scholar] [CrossRef]
- Bivins, A.; Lott, M.; Shaffer, M.; Wu, Z.; North, D.; Lipp, E.K.; Bibby, K. Building-level wastewater surveillance using tampon swabs and RT-LAMP for rapid SARS-CoV-2 RNA detection. Environ. Sci. Water Res. Technol. 2022, 8, 173–183. [Google Scholar] [CrossRef]
- Scott, L.C.; Aubee, A.; Babahaji, L.; Vigil, K.; Tims, S.; Aw, T.G. Targeted wastewater surveillance of SARS-CoV-2 on a university campus for COVID-19 outbreak detection and mitigation. Environ. Res. 2021, 200, 111374. [Google Scholar] [CrossRef]
- Vo, V.; Tillett, R.L.; Chang, C.-L.; Gerrity, D.; Betancourt, W.Q.; Oh, E.C. SARS-CoV-2 variant detection at a university dormitory using wastewater genomic tools. Sci. Total Environ. 2022, 805, 149930. [Google Scholar] [CrossRef]
- Fahrenfeld, N.; Medina, W.R.M.; D’Elia, S.; Modica, M.; Ruiz, A.; McLane, M. Comparison of residential dormitory COVID-19 monitoring via weekly saliva testing and sewage monitoring. Sci. Total Environ. 2021, 814, 151947. [Google Scholar] [CrossRef] [PubMed]
- Cavany, S.; Bivins, A.; Wu, Z.; North, D.; Bibby, K.; Perkins, T.A. Inferring SARS-CoV-2 RNA shedding into wastewater relative to the time of infection. Epidemiol. Infect. 2022, 150, e21. [Google Scholar] [CrossRef] [PubMed]
- Wright, J.; Driver, E.M.; Bowes, D.A.; Johnston, B.; Halden, R.U. Comparison of high-frequency in-pipe SARS-CoV-2 wastewater-based surveillance to concurrent COVID-19 random clinical testing on a public U.S. university campus. Sci. Total Environ. 2022, 820, 152877. [Google Scholar] [CrossRef] [PubMed]
- Wong, J.C.C.; Tan, J.; Lim, Y.X.; Arivalan, S.; Hapuarachchi, H.C.; Mailepessov, D.; Griffiths, J.; Jayarajah, P.; Setoh, Y.X.; Tien, W.P.; et al. Non-intrusive wastewater surveillance for monitoring of a residential building for COVID-19 cases. Sci. Total Environ. 2021, 786, 147419. [Google Scholar] [CrossRef] [PubMed]
- Colosi, L.M.; Barry, K.E.; Kotay, S.M.; Porter, M.D.; Poulter, M.D.; Ratliff, C.; Simmons, W.; Steinberg, L.I.; Wilson, D.D.; Morse, R.; et al. Development of Wastewater Pooled Surveillance of Severe Acute Respiratory Syndrome Coronavirus 2 (SARS-CoV-2) from Congregate Living Settings. Appl. Environ. Microbiol. 2021, 87, e0043321. [Google Scholar] [CrossRef]


| Sampling Point | Number of Observations | Dates Collected | Number Non-Detects | Number of Detects | Min | Mean | Median | Max | Standard Deviation |
|---|---|---|---|---|---|---|---|---|---|
| SP1 | 20 | 1 September 2020 to 19 November 2020 | 18 | 2 | <LOQ | 5.45 | 1 | 90 | 19.90 |
| SP2 | 20 | 10 September 2020 to 19 November 2020 | 17 | 3 | <LOQ | 4.85 | 1 | 75 | 16.52 |
| SP3 | 19 | 4 September 2020 to 17 November 2020 | 12 | 7 | <LOQ | 5.42 | 1 | 52 | 13.32 |
| SP4 | 20 | 1 September 2020 to 17 November 2020 | 9 | 11 | <LOQ | 13.85 | 1 | 93 | 30.21 |
| SP5 | 15 | 5 September 2020 to 17 November 2020 | 6 | 9 | <LOQ | 11.86 | 1 | 86 | 24.63 |
| SP6 | 18 | 1 September 2020 to 17 November 2020 | 14 | 4 | <LOQ | 4.83 | 1 | 48 | 11.36 |
| SP7 | 25 | 24 August 2020 to 19 November 2020 | 6 | 19 | <LOQ | 22.56 | 1 | 83 | 29.68 |
| SP8 | 3 | 4 September 2020 to 15 September 2020 | 2 | 1 | <LOQ | 1 | 1 | 1 | 0 |
| SP9 | 20 | 1 September 2020 to 17 November 2020 | 4 | 16 | <LOQ | 21.65 | 1 | 91 | 31.04 |
| SP10 | 21 | 1 September 2020 to 19 November 2020 | 17 | 4 | <LOQ | 1.95 | 1 | 21 | 4.36 |
| SP11 | 17 | 7 September 2020 to 12 November 2020 | 8 | 9 | <LOQ | 15.76 | 1 | 94 | 29.51 |
| SP12 | 19 | 10 September 2020 to 17 December 2020 | 0 | 19 | 6.97 | 42.94 | 38 | 84 | 25.91 |
| SP13 | 15 | 10 September 2020 to 17 November 2020 | 0 | 15 | 9.82 | 50.2 | 49 | 95 | 27.89 |
| SP14 | 18 | 10 September 2020 to 19 November 2020 | 9 | 9 | <LOQ | 17.33 | 1 | 80 | 26.55 |
| SP15 | 20 | 1 September 2020 to 17 November 2020 | 9 | 11 | <LOQ | 20.7 | 1 | 89 | 32.10 |
| SP16 | 20 | 4 September 2020 to 19 November 2020 | 7 | 13 | <LOQ | 19.55 | 1 | 66 | 27.27 |
| Clinical Surveillance | |||
|---|---|---|---|
| COVID-19 case | No COVID-19 case | ||
| Wastewater surveillance | SARS-CoV-2 RNA detected or quantified | True positive | False positive |
| SARS-CoV-2 RNA not detected or quantified | False negative | True negative | |
Publisher’s Note: MDPI stays neutral with regard to jurisdictional claims in published maps and institutional affiliations. |
© 2022 by the authors. Licensee MDPI, Basel, Switzerland. This article is an open access article distributed under the terms and conditions of the Creative Commons Attribution (CC BY) license (https://creativecommons.org/licenses/by/4.0/).
Share and Cite
Godinez, A.; Hill, D.; Dandaraw, B.; Green, H.; Kilaru, P.; Middleton, F.; Run, S.; Kmush, B.L.; Larsen, D.A. High Sensitivity and Specificity of Dormitory-Level Wastewater Surveillance for COVID-19 during Fall Semester 2020 at Syracuse University, New York. Int. J. Environ. Res. Public Health 2022, 19, 4851. https://doi.org/10.3390/ijerph19084851
Godinez A, Hill D, Dandaraw B, Green H, Kilaru P, Middleton F, Run S, Kmush BL, Larsen DA. High Sensitivity and Specificity of Dormitory-Level Wastewater Surveillance for COVID-19 during Fall Semester 2020 at Syracuse University, New York. International Journal of Environmental Research and Public Health. 2022; 19(8):4851. https://doi.org/10.3390/ijerph19084851
Chicago/Turabian StyleGodinez, Alex, Dustin Hill, Bryan Dandaraw, Hyatt Green, Pruthvi Kilaru, Frank Middleton, Sythong Run, Brittany L. Kmush, and David A. Larsen. 2022. "High Sensitivity and Specificity of Dormitory-Level Wastewater Surveillance for COVID-19 during Fall Semester 2020 at Syracuse University, New York" International Journal of Environmental Research and Public Health 19, no. 8: 4851. https://doi.org/10.3390/ijerph19084851
APA StyleGodinez, A., Hill, D., Dandaraw, B., Green, H., Kilaru, P., Middleton, F., Run, S., Kmush, B. L., & Larsen, D. A. (2022). High Sensitivity and Specificity of Dormitory-Level Wastewater Surveillance for COVID-19 during Fall Semester 2020 at Syracuse University, New York. International Journal of Environmental Research and Public Health, 19(8), 4851. https://doi.org/10.3390/ijerph19084851