1. Introduction
Participation in marathon running has grown by 100% over the past 20 years [
1], with numerous recreational runners taking up the sport. However, after the 25th km, the phenomenon of “hitting the wall” is a familiar experience for 40% of runners throughout marathon history [
2]. “Hitting the wall” not only refers to a sudden and dramatic slowing of pace in the latter stages of the race but also to a profound feeling of exhaustion [
3]. This phenomenon was previously evaluated in a large-scale data analysis of late-race pacing collapse in the marathon [
4]. Smyth presented an analysis of 1.7 million recreational runners, focusing on pacing at the start and end of the marathon, two particularly important race stages.
They showed how starting or finishing too quickly could result in poorer finish times, because fast starts tend to be very fast, leading to endurance problems later, while fast finishes suggest overly cautious pacing earlier in the race [
5]. Another study performed with 280 (2 h 30–3 h 40) marathoners, showed that the “fallers” (runners who had a significant decrease in their running speed during the race that appeared at the 26th km) represented the large majority of runners (77%) with significantly lower performance and higher cardiac drift (i.e., an increase of the heart rate/speed ratio) compared with the non-fallers [
6]. In addition, marathon performance was correlated with the amplitude of this cardiac drift, which was very sensitive to the running strategy.
The analysis of this running strategy showed that the faller group ran more than half the marathon distance (56%) above their average speed before they “hit the wall”. Hence, the choice of pace remains a delicate issue for the recreational marathoners, and research must explore further regarding our comprehension of the physiological responses during a marathon [
6]. This race of 42,195 km elicits a high percentage of cardiac output and
O2 max for more than 2 h 30 min [
7,
8,
9,
10]. This capacity of sustaining a high fraction of maximal cardiac output and
O2max (qualified of “Endurance”) has been reported to be correlated with the marathon performance [
6,
10,
11,
12,
13,
14].
However, to date, only one experiment, 46 years ago, measured the gas exchange and respiratory rate during the race [
8], and only one study reported the Rate of Perception of Exertion (RPE) during a marathon [
15]. The Borg 6–20 RPE Scale [
16] is a reliable measure used to quantify, monitor and assess the capacity and levels of exertion due to strong correlations between the RPE and physiological parameters [
17].
A study [
15] showed that the RPE time course was not modified by the ingestion of carbohydrates compared with placebo beverages; however, the runners were able to run faster with the same RPE throughout the race. These results suggest that RPE could be a candidate for controlling marathon pacing; however, the question remains regarding the trends and breakpoints of the RPE with each cardiorespiratory variable. Hence, the main purpose of this study was to test the hypothesis that (1) sudden changes in the physiological variables and RPE occurred when the recreational marathoners “hit the wall” and (2) that early drifts of the cardiorespiratory (HR,
O2, …)/RPE ratio could appear early in the race.
4. Discussion
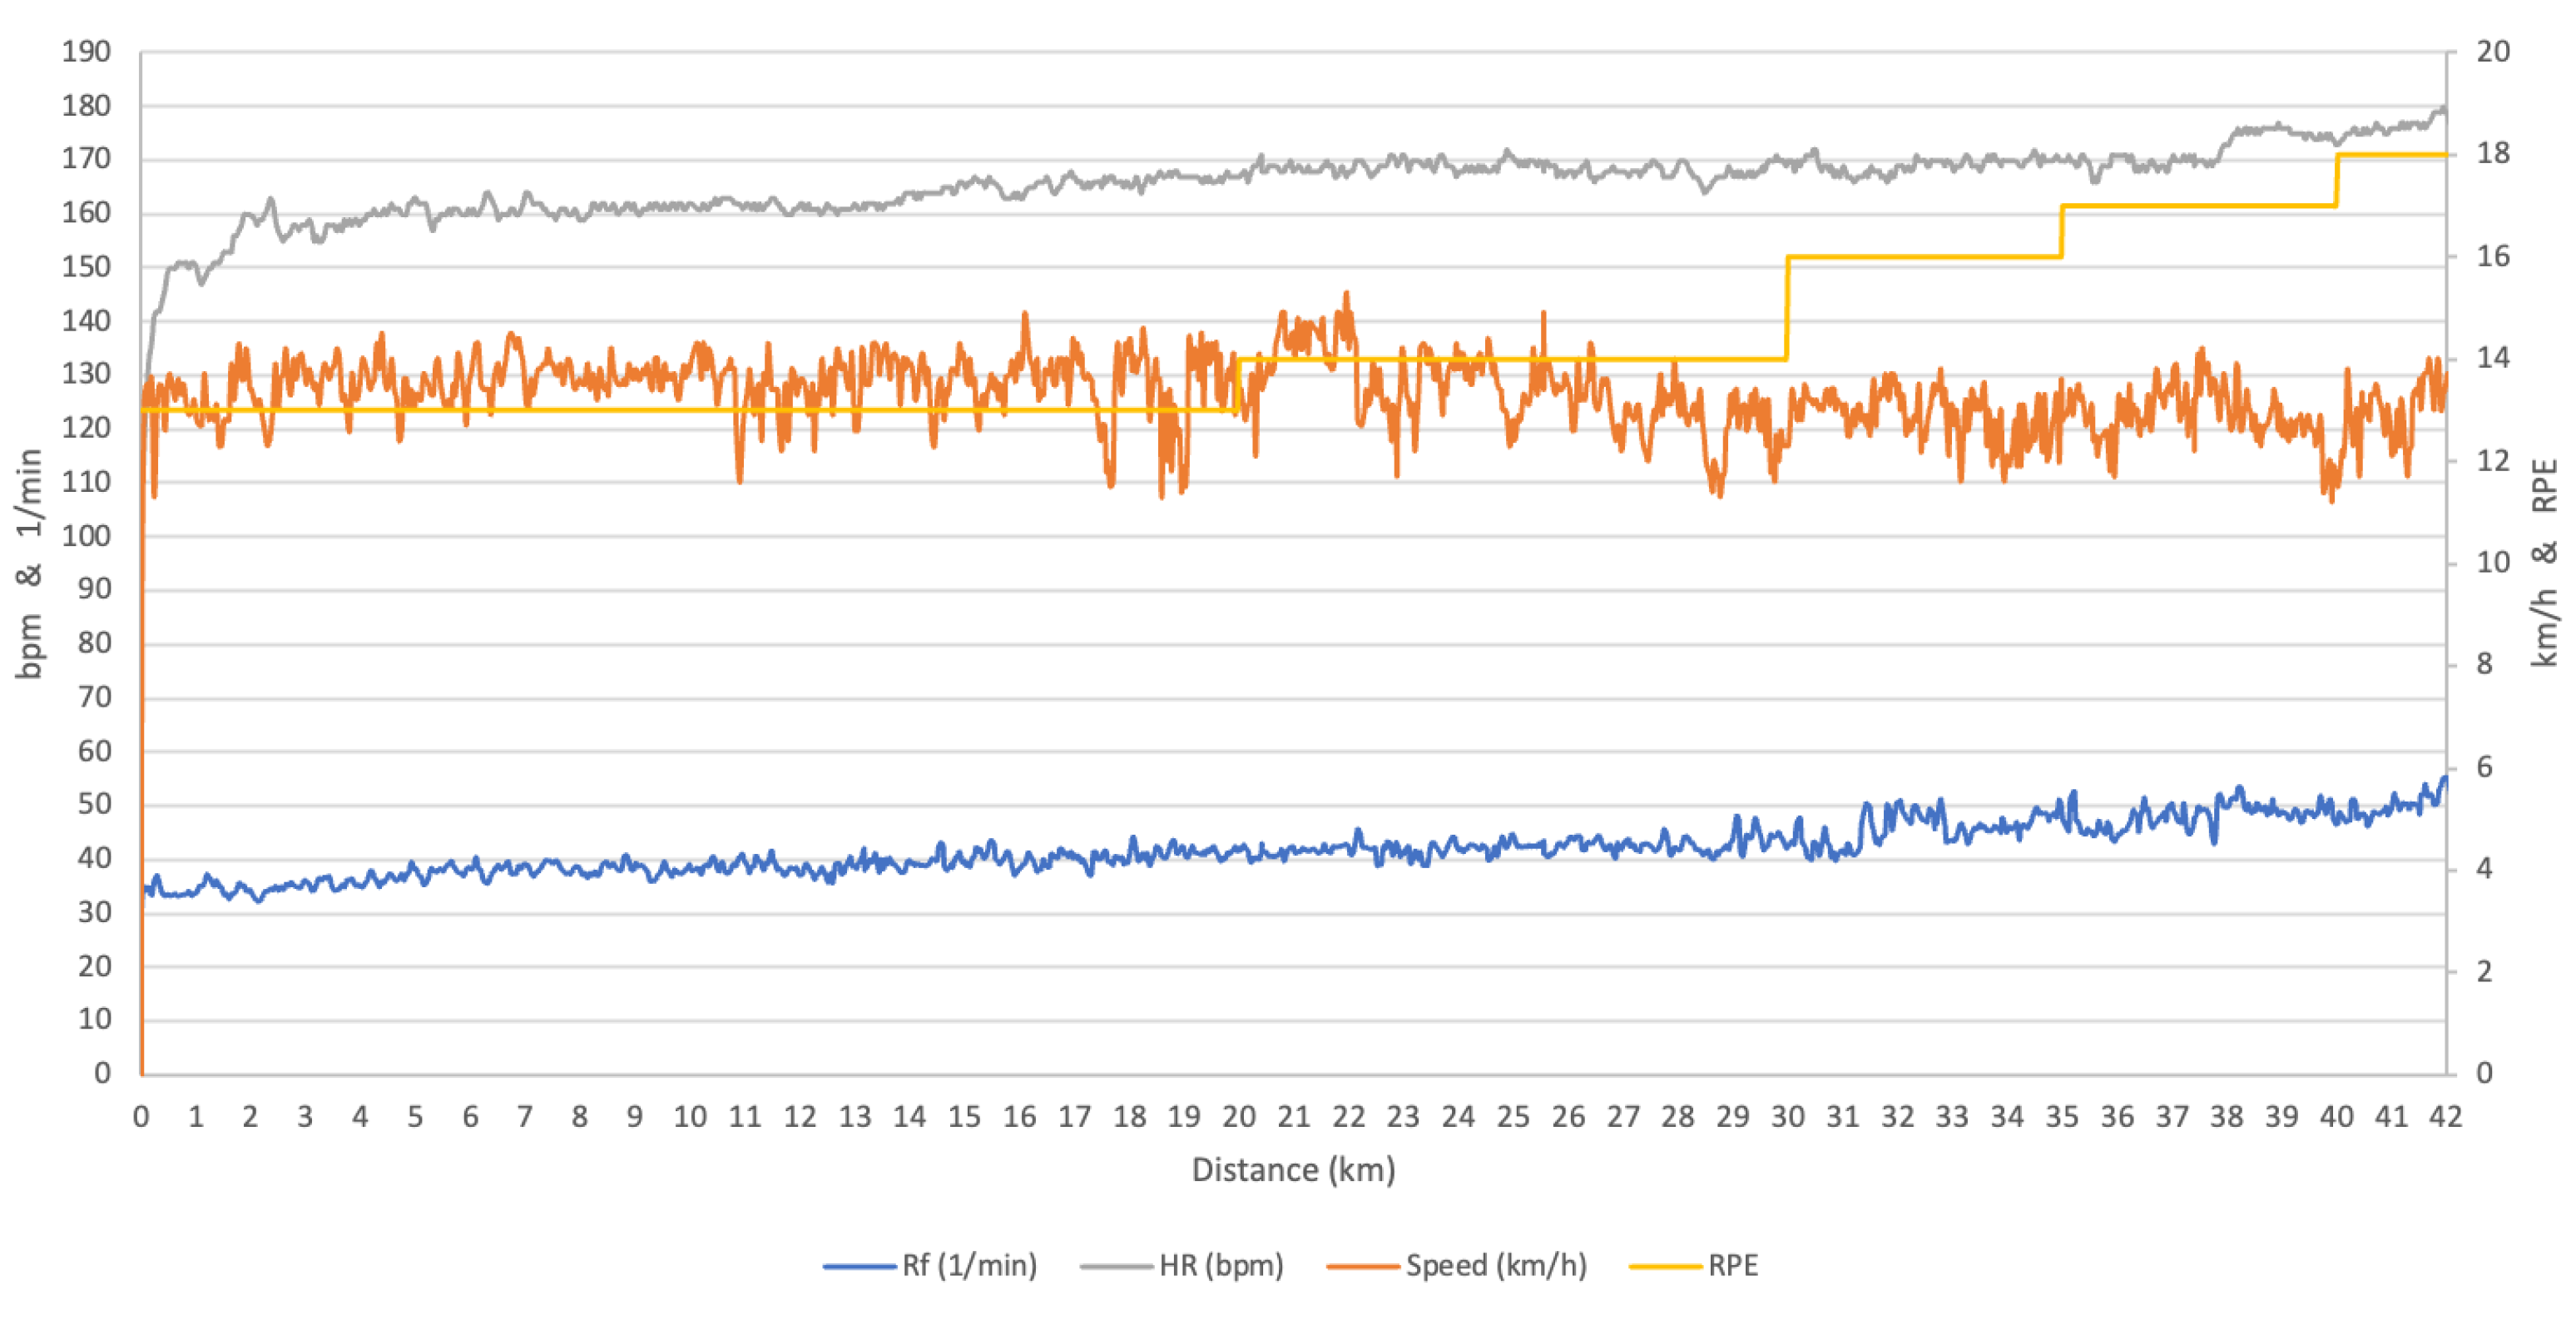
To the best of our knowledge, this is the first study to report the continuous measurement of cardiorespiratory function during a marathon race. Although the marathon race has been democratized, it remains complex due to the famous “hitting the wall” phenomenon after the 25th km. To characterize this “wall” from a physiological and Rate of Perceived Exertion (RPE) perspective in recreational marathon runners, we report the first continuous breath-by-breath gas exchange measurements during an actual marathon race (
Figure A1).
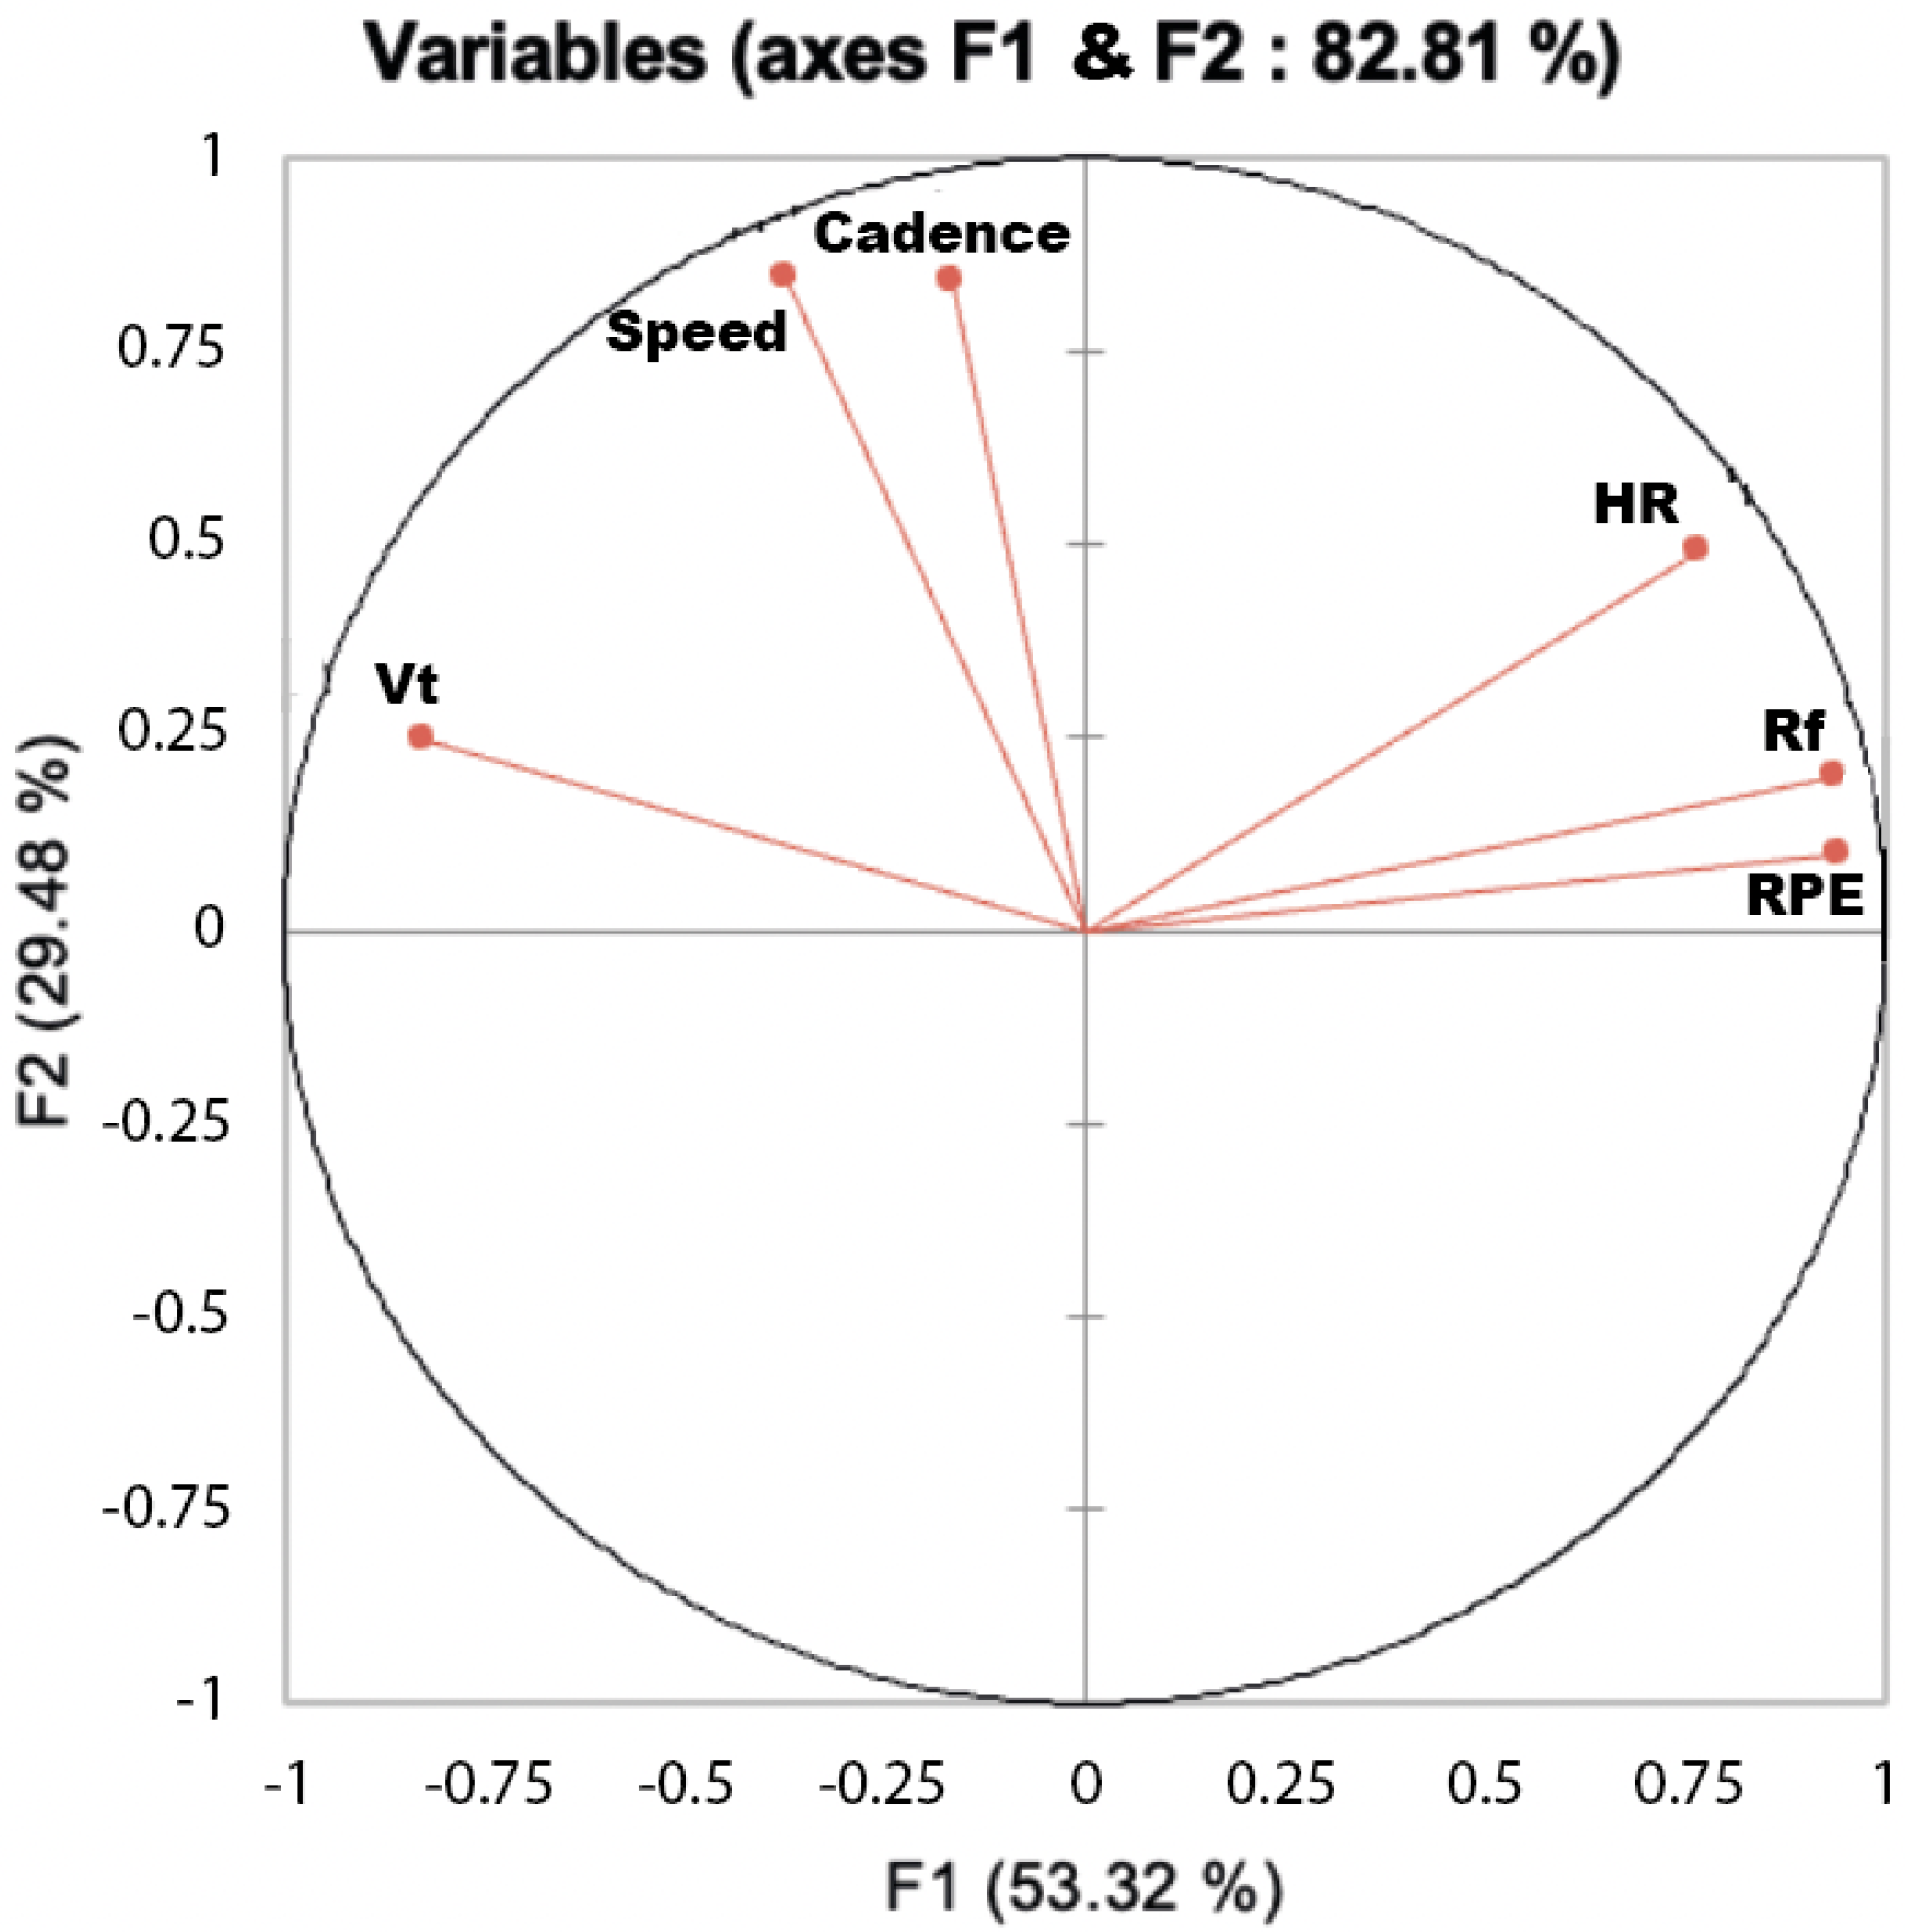
During the marathon, the oxygen uptake and ventilatory rate presented different kinetics according the runners, The sole sudden change in the physiological variables occurred when the recreational marathoners “hits the wall”, was those of the respiratory rate. However, the indexation of the cardiorespiratory parameters by RPE ratio showed a systematic drift throughout the race. The multivariate analysis of cardiorespiratory variables matrix revealed that RPE was projected on the same axis than the respiratory frequency suggesting that RPE is directly connected with this cardiorespiratory variables (
Figure A2).
In addition, the systematic increase of the respiratory frequency in all but one runner led us to hypothesize that these are good candidates for pace regulation during a marathon [
17]. The marathoners ran a RPE = 13.9, a value below their anaerobic threshold. The final blood lactate accumulation during the marathon was in accordance with those already reported by Costill in their seminal paper about the physiology of the marathon [
10].
Indeed, he underlined the marathoner’s ability to maintain an extremely high rate of energy expenditure for 2.1 to 3.0 h is impressively demonstrated by one runner, i.e., Derek Clayton, who ran in 2 h 8 min 33 s with a final lactate value at the relatively low level of 21.4 mg/100 mL (2.4 mM/100 mL).
The analysis of speed time depended on the GPS but showed a large speed variation [
6,
20], and the marathon performance depended on pacing oscillations between nonsymmetric extreme values [
18]. Beyond this analysis of the pace and HR time series during a marathon, the present study aimed to highlight the possible relationship between this pacing variation with those of the cardiorespiratory variables and with RPE. We found that, after the 25th km, “hitting the wall”, was expected to appear.
Big data on much more subjects are necessary for distinguish different marathon pace strategy taking into account only the time split every 5 km (2295 and 31,762 runners [
23,
24]). Our small sample of marathoners had homogeneous pace time serie but with very different physiological and RPE responses. Their pacing were homogeneous and consistent with that reported in the literature for the recreational marathon runners category [
5,
21,
25,
26].
It has been shown pacing strategies, in addition to the physiological aspect, include psychological aspects, such as coping mechanisms, self-esteem and life meaning [
25]. That is why the runners crossed the RPE and the physiological and pacing (speed) time series during the marathon. Indeed, the perception of effort is multidimensional and is governed by many psychological and experiential factors [
27].
Various terms and phrases, such as perceived exertion, perception of effort, sensation of effort, exertion effort and effort sense have been employed synonymously by investigators in this area of inquiry [
27]. Currently, RPE, which is now largely familiar to coaches and increasingly by endurance athletes and it appears that, for a self-paced test based on RPE, a race, such as the marathon, can also be controlled by RPE recommendations.
Individually, the performance template, as the pattern of power output during self-pace exercise has been shown to be robust and regulated in an anticipatory manner [
28]. Then, the individual performance template could also be or not be associated with a physiological and RPE [
17,
29]. The influence of time and distance left to complete, which depends on the speed at each instant, will influence the pacing according physiological variables [
17,
29]. That is why we focused on the time series of the ratio between physiological variables, candidates for the role of negative feedback controllers—the so-called “homeostats” [
30].
The coefficient of variation for the running speed was consistent with that observed in of a prior study performed on 280 marathon runs [
20]. In the present study, all the marathoners (but one) ran in “positive split,” that is to say, with a speed decrease trend in accordance with prior study with an extremely low value of risk
(
p < 0.0001) associated with the same tendency for the both components of the runners’ speed. It was recently shown that the variation in running velocity did not affect the aerobic cost of running at speed below anaerobic threshold [
31].
More importantly, our marathoners did not optimize their races in regard to speed asymmetry as they ran more than 56% of the distance above their average speed. This had consequence on the cardiorespiratory variables according their time series directional trend but not in the same way for all runners. Indeed, while heart rate has a positive or negative trend among runners, in contrast with prior studies reporting a systematic cardiac drift during a marathon [
7], the respiratory rate had a highly significant positive trend for all runners but not the minute ventilation due the tidal volume decreasing in all the runners.
In a previous study, that measured the cardiac output throughout a marathon, they did not observe this compensation phenomenon between frequency (HR) and volume (SV). Indeed, the cardiac output remained at 83 ± 20% of the maximal cardiac output with a stroke volume at 77 ± 11 and an HR at 87 ± 6% a
O2 at 76 ± 8% of and a cardiac output at 83 ± 20 of their maximal values [
6]. In contrast to the decreasing tidal volume observed in this study, in our previous study, the stroke volume did not decrease over time, which agrees with previous reports of steady state in SV during large reductions in brain perfusion in the heat-stressed human and during intense, endurance exercise [
32]. Indeed, SV remained at submaximal steady state (77 ± 3%), as did CO (69 ± 3%).
Furthermore, an increase in HR in a neutral environment has been shown to be responsible for the SV decline in steady exercise performed for 1 h at 57% of
O2max [
33]. As observed in our previous study, of the time course of the cardiac-output during a marathon, the cardiac cost, i.e., (beat/m) increased in conjunction with the increase in HR and decrease in speed. In this study, we did not measure the cardiac output as in this prior study (Billat et al., 2012 [
7]), but we chose to measure the cardiorespiratory exchanges. Indeed, cardiac output (physioflow, Manatec, France) device required many probes, and the runners were already encumbered with a cardiac belt and the 1 kg of device to measure
O2.
In addition, it is important to emphasize that the most important factor is the quality of the data, which is a real challenge such natural and long-term exercise endeavors as climbing the Mont Blanc (Billat et al., 2010 [
34]). Indeed, the problem of the long and intense run as the marathon is to have good data despite the sweat that loosens the sensors and makes the heart rate belt slip.
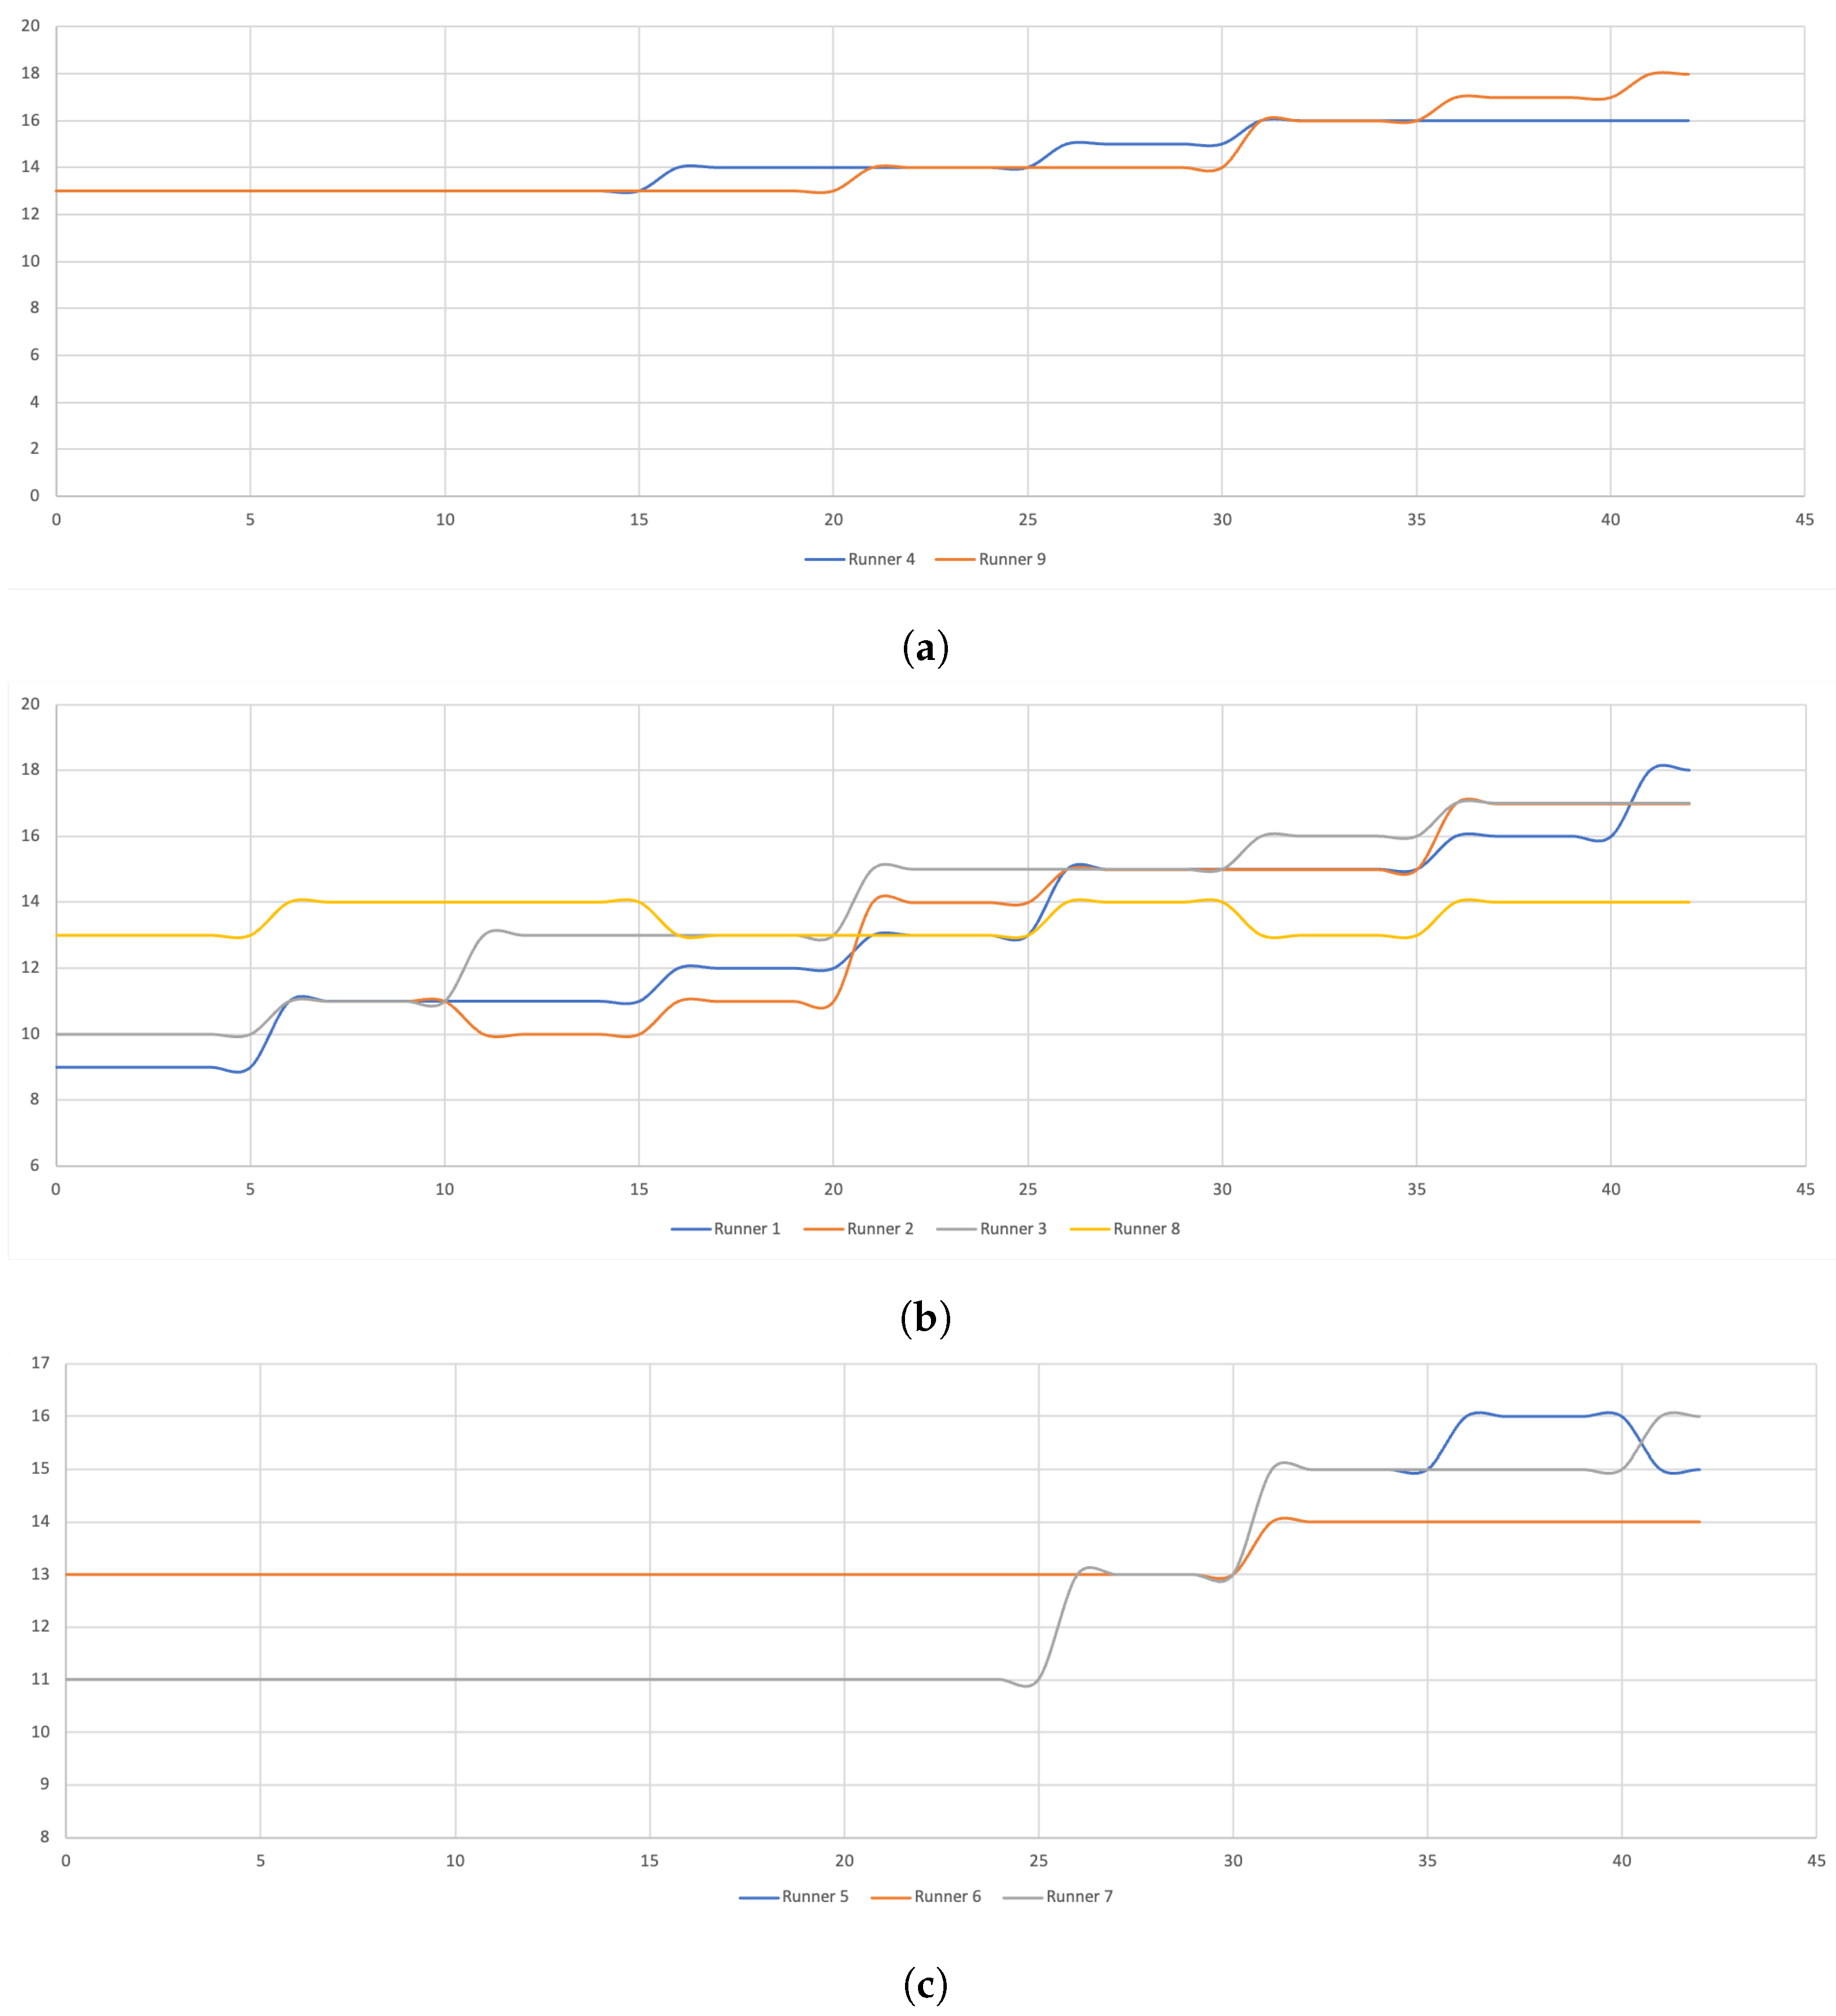
The absence of an abrupt decrease of the runners speed showed that they did not hit the wall if we only consider this face of the definition. While we detected no abrupt speed decrease, we observed a decrease in cadence in more than half of the runners (5/9) after the 25th km. Therefore, the consideration of only speed and the stride parameters analysis, especially at constant speed, does not allow us to detection of abrupt changes. The cardiorespiratory variables also did not, show an abrupt change according to the ascending and descending statistical series method. Again, we observed highly individual cardiorespiratory and speed or cadence responses at very different distances during the race.
This is why we attempted to detect differences by considering the race splits as is more commonly done, every 5 km of the race [
35] but without selecting a steady state phase since our objective was to search for steady state breaks that could allow us to detect the famous marathon wall.
The multivariate analysis revealed that, for all the runners, RPE and Rf are closed (their angle is acute) while the speed is closer to the cadence and to the Tidal volume. There are two distinguished axes, one (horizontal) rather linked with RPE and Rf and the other (vertical) with the speed, heart rate and Tidal volume. Then, RPE was closed to Rf while speed, cadence and Hr were aggregated on the orthogonal to F1 (F2) axis.
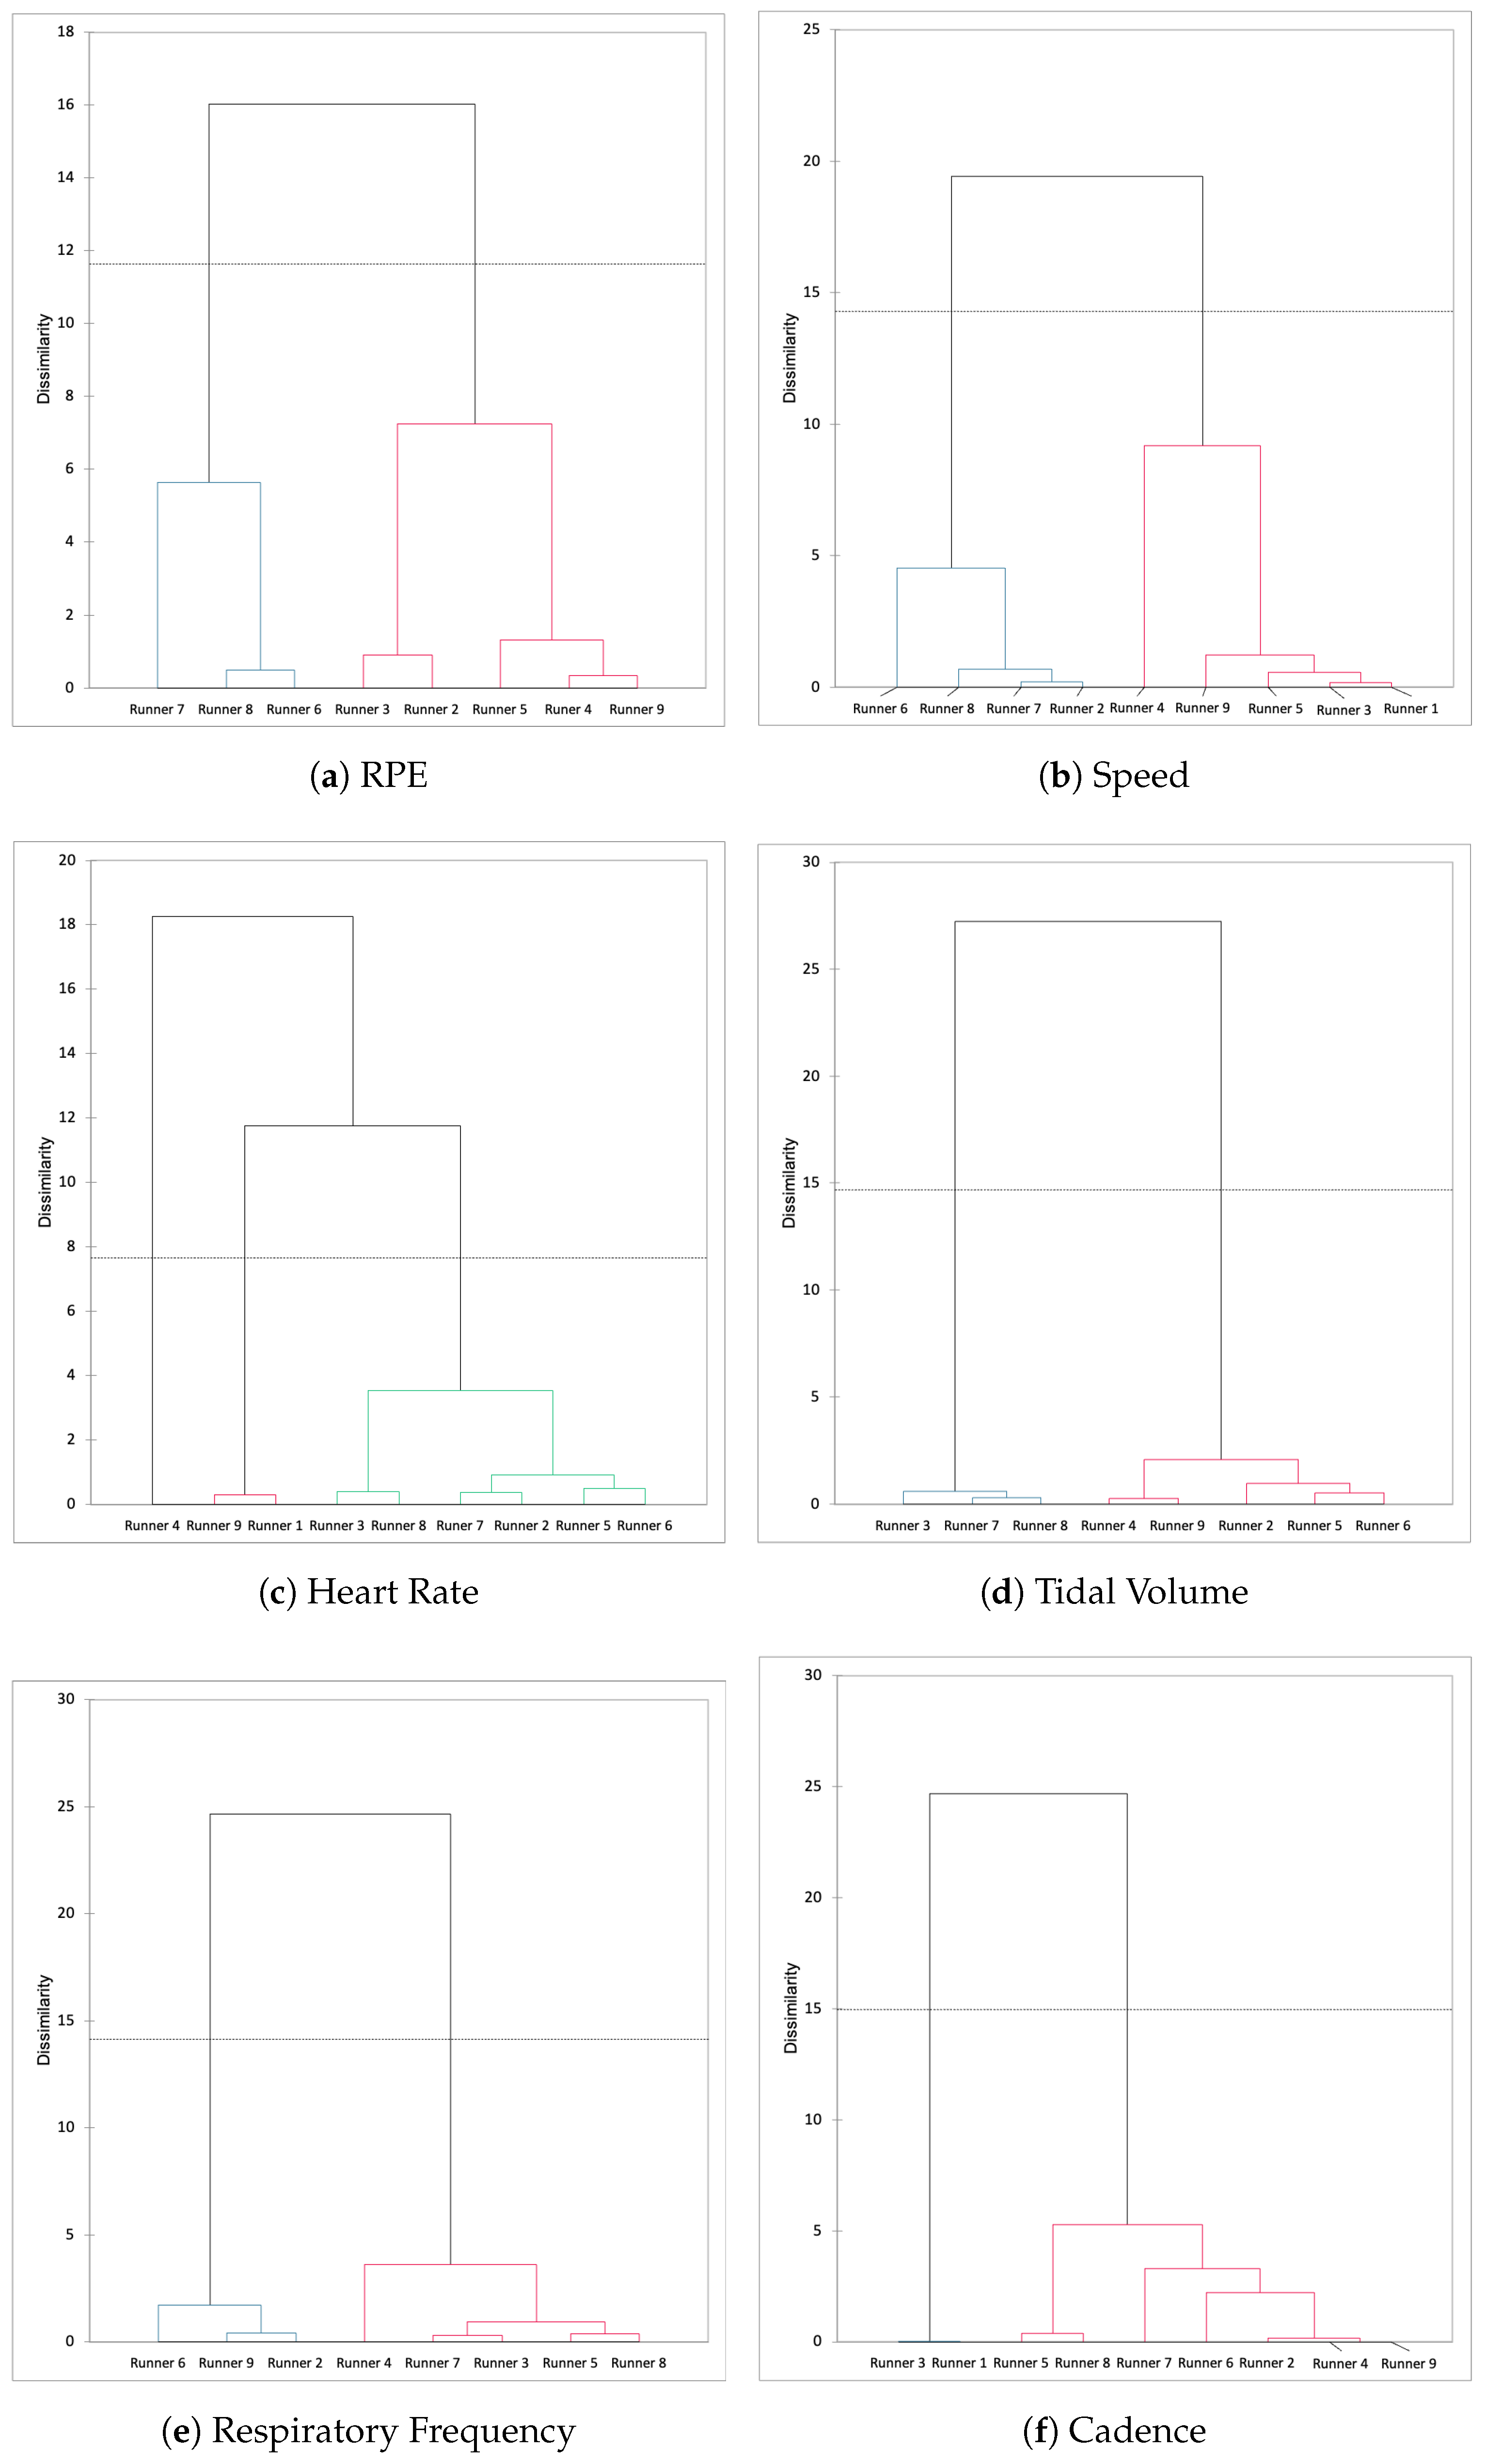
This type of multivariate analysis could be interesting to be applied on much more subjects taking these parameters (cadence, HR, Rf, RPE, speed) to test the hypothesised that some runners have a RPE-Rf-sensitive profile, while others are sensitive to the cadence and tidal volume. We added the runners as observations above the layer of physiological and speed variables. For that, when we classified the runners according the variables each 5 km, we could see that the classification was the same for RPE and speed, and the runners 6, 7 and 8 formed a cluster.
We could not distinguish any similitude between the dendograms of the other variables. In the same way, we tested the hypothesis than some 5-km splits are characterised by the same time series trend. Therefore, RPE was closed to Rf while speed, cadence and Hr were aggregated on the orthogonal to F1 (F2) axis. This type of multivariate analysis could be interesting to apply on more subjects with these parameters (cadence, HR, Rf, RPE and speed) integrated in an algorithm to define the specific types of marathon runner.


 ,
, 


