Abstract
Evacuees of the Great East Japan Earthquake have experienced adverse, long-term physical and psychological effects, including problem drinking. This study examined the risk and recovery factors for problem drinking among evacuees between fiscal years (FY) 2012 and 2017 using data on residents in the evacuation area from the Mental Health and Lifestyle Survey. With the FY 2012 survey as a baseline, a survey comprising 15,976 men and women was conducted in the evacuation area from FY 2013 to FY 2017, examining the risk and protective factors for problem drinking. Particularly, the Cutting down, Annoyed by criticism, Guilty feeling, and Eye-opener (CAGE) questionnaire was used to evaluate problem drinking. Univariate and multivariate Cox proportional hazard models were constructed to identify the risk and recovery factors of problem drinking. The findings indicated that the male gender, insufficient sleep, job change, trauma symptoms, mental illness, family financial issues, and heavy drinking (≥4 drinks per day) were significant risk factors for the incidence of problem drinking among the evacuees. Furthermore, a high blood pressure diagnosis could exacerbate problem drinking among men, while younger age and a diabetes mellitus diagnosis could increase problem drinking among women. Trauma symptoms and heavy drinking inhibited recovery from problem drinking after the disaster. Understanding these factors can shape effective long-term intervention strategies to physically and psychologically support evacuees.
1. Introduction
Research has shown that post-traumatic stress after natural disasters is linked to an elevated risk of problem drinking [1] and substance abuse such as cigarette use [2,3]. Numerous studies have reported that man-made and natural disasters, as well as terrorist attacks, are associated with increased alcohol consumption [3,4,5]. Alcohol dependence after a disaster is related to poor mental health among affected individuals [6]. Particularly, research has indicated increased alcohol consumption among several evacuees who use it as “self-medication” to mitigate their symptoms after experiencing trauma [7,8]. Furthermore, severe symptoms of post-traumatic stress disorder (PTSD) have been strongly associated with alcohol use for “coping-motivated drinking” following exposure to a disaster [9]. The Great East Japan Earthquake and Tsunami, which occurred on 11 March 2011, is considered a compound disaster, as it resulted in the exacerbated abuse of psychoactive substances, particularly alcohol, high smoking prevalence [10], and impaired sleep quality [11]. A previous study showed that evacuees changed their drinking behavior after experiencing a compound disaster. Moreover, the study also found that individuals who began drinking after the disaster had a higher risk of developing severe mental illness [12]. Another study contrasted the differences and similarities among risk factors in the development of problem drinking based on gender [13]. Furthermore, research has indicated that sleep insufficiency and heavy drinking culminated in problem drinking in both genders. Particularly, family finances and severe trauma symptoms caused problem drinking among male evacuees, while a history of mental illness increased problem drinking among female evacuees.
Based on these research findings, the present study examined the risk and protective factors for problem drinking within the context of the Great East Japan Earthquake and Tsunami of 11 March 2011 [12,13]. This study assessed how evacuees developed or recovered from problem drinking based on the Cutting down, Annoyed by criticism, Guilty feeling, and Eye-opener (CAGE) score for six years. A previous study [5] gathered over 15 years of data after the 9/11 terror attacks on the World Trade Center (WTC) in New York City and found that binge drinking was strongly linked with the PTSD symptom cluster. Furthermore, the study noted that alcohol was used intentionally as a means of self-medication. Another study found that traumatic stress may be associated with problem drinking after prolonged exposure, and that men and younger people were more likely to begin problem drinking two years after 9/11 [14]. Most studies to date have looked at short-term impacts in the first 2 years following the disaster, with few looking at the longer term. We considered the importance of conducting a long-term longitudinal study for the evacuees of the Great East Japan Earthquake in 2011. Our study hypothesized that psychological distress, trauma symptoms, and insufficient sleep culminated in developing problem drinking between the fiscal years (FY) 2012 and 2017, using a longitudinal design as a measure. It further hypothesized that social networks or support facilitate recovery from problem drinking. This is the first prospective study to explore and present the risks and protective factors for problem drinking among evacuees of the Great East Japan Earthquake.
2. Materials and Methods
2.1. Data Source
This study used data from the Mental Health and Lifestyle Survey that assessed the mental health and lifestyle of residents of evacuation areas after the Great East Japan Earthquake. The complete survey protocol was published in FY 2012 [15]. The target participants for the survey lived in 13 municipalities: Hirono, Naraha, Tomioka, Kawauchi, Okuma, Futaba, Namie, Katsurao, Iitate, Tamura, Minami-Soma, Kawamata, and Date, which consist of designated areas for evacuation allocated by the government at the time of the accident. Only the municipalities of Minami-Soma, Tamura, and Kawamata included evacuees and non-evacuees. These residents received questionnaires annually from 18 January 2012 [15,16]. Data from FY 2013 to FY 2017 were used to elucidate the development of problem drinking for six years after the disaster. The participants of the mental health survey were informed that the survey results would be examined and reported after analysis. Furthermore, only the individuals who returned the self-recorded questionnaire were considered to have provided consent to participate in the survey. This study was approved by the ethical review board of Fukushima Medical University (approval number: 2020-239).
2.2. Study Sample
Figure 1 presents the participant flow chart. The target population comprised 43,990 adults, aged 20 years and above, who responded to the FY 2012 survey (response rate 19.9%, n = 184,507). The sample population excluded those who did not answer the CAGE questionnaire in FY 2012 (n = 9899) and who did not respond to the questionnaire independently (n = 2547), because CAGE can only be assessed through self-response. Furthermore, respondents with a CAGE score of ≥2 (n = 3241) in FY 2012 were excluded. The remaining 27,064 respondents (men: 12,120; women: 14,944) formed the baseline sample for follow-up. Likewise, those individuals who did not respond on their own to the assessment from FY 2013 to FY 2017 (n = 620), and did not respond to the follow-up (n = 10,468), were excluded. Thereafter, the longitudinal data were obtained for 15,976 participants (men: 9117; women: 6859).
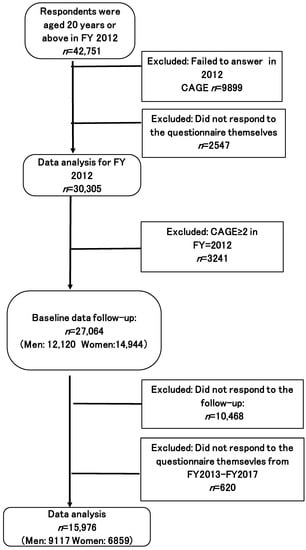
Figure 1.
Participant flow chart (CAGE < 2 in 2012).
Figure 2 presents a flow chart displaying the protective factors that helped in recovery from problem drinking. This flow chart excluded participants whose CAGE scores were below 2 (n = 27,064) in FY 2012. The remaining 3241 respondents (men: 2482, women: 759) formed the baseline sample for follow-up. Similarly, individuals who did not respond to the questionnaire independently from FY 2013 and FY 2017 (n = 61), or who did not respond to the follow-up (n = 373) were excluded from the sample. Thereafter, longitudinal data were obtained from 2807 participants (men: 2224, women: 583).
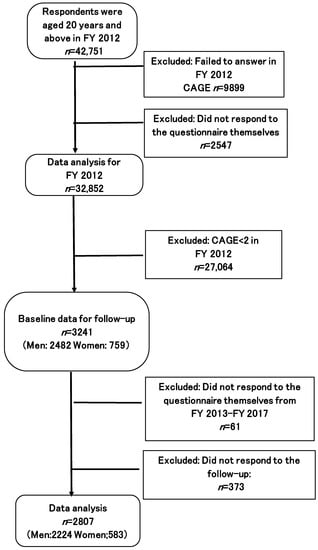
Figure 2.
Participant flow chart (CAGE ≥ 2 in 2012).
2.3. Measures
This study evaluated all variables used previously [12,13], including alcohol consumption and problem drinking (CAGE), general and socio-demographic status variables, current social network status, sleep insufficiency, risk of serious mental illness and psychological distress (K6), and trauma symptoms (PCL-S).
2.3.1. Alcohol Use and Problem Drinking Measures
To align with previous studies [12,13], heavy drinking/alcohol consumption that would enhance the risk of a lifestyle disease was defined as having four or more drinks per day (≥44 g of ethanol). According to this definition, a drink could comprise 120 mL of spirit (e.g., whiskey or brandy), 480 mL of wine, 1000 mL of beer, or 360 mL of sake. This definition is consistent with the reported median for moderate and proper drinking (20 g of ethanol per day) and heavy drinking (60 g of ethanol per day) [17].
The CAGE questionnaire is used to screen for alcohol dependency [18] and diagnose alcoholism [19]. The validity and reliability of the screening test have been confirmed. Furthermore, providing at least two positive answers was classified as indicating alcohol dependence, irrespective of the respondent’s sex [18]. Therefore, a CAGE score of ≥2 represented a drinking problem.
2.3.2. Socio-demographic Variables
This study evaluated various demographic characteristics, socio-economic factors, and disaster-related risk factors related to problem drinking [14,20,21]. Demographic factors were obtained, including sex, age (i.e., 20–49, 50–64, or ≥65 years), and history of a diagnosed of any mental illness, hypertension, and diabetes mellitus (i.e., Yes or No) [13]. This study also assessed socio-demographic factors such as employment change (i.e., change in work before and after the disaster) and post-disaster family financial situation (i.e., severe, below average, average, not severe) [13].
2.3.3. Current Social Network Status
The Lubben Social Network Scale (LSN-6) was used to screen current social networks, including family and friends, among the evacuees [22,23]. The validity of this test was explained in a previous study that used the Japanese version of the LSNS-6 [13].
2.3.4. Sleep Insufficiency
Research has shown that individuals face sleep problems after traumatic events [24]. An earlier study has shown that sleep insufficiency is a risk factor for problem drinking; thus, the participants were asked the same questions [13].
2.3.5. Risk of Serious Mental Illness and Psychological Distress
This study used the six-item Kessler Psychological Distress Scale (K6) to screen for non-specific serious mental illnesses [25], in which scores ranging from 13 to 24 are classified as “probable serious mental illness” [26]. The validity of the Japanese version of the K6 has been explored in previous studies [12,13,27].
2.3.6. Trauma Symptoms
Comorbidity of PTSD and problem drinking has been well-documented [4,28]. Therefore, this study used the PTSD Checklist-Specific (PCL-S) to identify traumatic symptoms among evacuees. Consistent with previous research [29], a cut-off of 44 was used to diagnose PTSD. The validity of the Japanese version of the PCL-S [30,31] was explored in a previous study [13].
2.4. Data Analysis
This study analyzed data for six years, from FY 2012 to FY 2017, using univariate Cox proportional models to investigate possible predictors of problem drinking. The analysis used FY 2012 as the baseline and FY 2013 to FY 2017 as the follow-up period. For participants who had multiple visits during the follow-up, the most recent data were used in the analysis as the follow-up results. The dependent variables were chosen based on previous studies [2,20] and were employed as multivariate adjustment variables. Missing data were complemented with dummy variables.
All statistical analyses were performed using SAS 9.4 (SAS Institute Inc., Cary, NC, USA). Univariate and multivariate Cox proportional hazards models were used to obtain crude and adjusted hazards ratios (HRs) and 95% confidence intervals (Cis) for the association between each factor and problem drinking or recovery. Multivariate Cox proportional hazards models for men and women were established to determine differences based on gender. p < 0.05 indicated statistical significance.
3. Results
Table 1 shows the breakdown of variables according to change (or a lack thereof) in problem drinking (i.e., individuals with low to high scores were emerging problem drinkers; individuals with continuous low scores were current non-problem drinkers) from FY 2012 to FY 2017. The table also highlights motivating factors of characteristics associated with these changes. In total, there were 1949 emerging problem drinkers and 11,463 current non-problem drinkers. Furthermore, 14.5% of the participants developed problem drinking between FY 2012 and FY 2017. Moreover, a higher number of men than women developed problem drinking during the study period. Emerging problem drinkers included a higher proportion of those with K6 and PCL-S scores of ≥13 and ≥44, respectively, and they consumed more alcohol than the current non-problem drinkers. Becoming a problem drinker was associated with age, subjective health condition, history of a serious mental illness, sleep insufficiency, high blood pressure, diabetes mellitus, and family financial status (p < 0.05).

Table 1.
Characteristics of participants who only developed problem drinking after FY 2012.
Table 2 presents an overview of the univariate Cox proportional hazard models, which were established using factors deemed significant during survival analysis to identify the association between social and psychological indicators and problem drinking frequency among the evacuees. Table 2 shows that being a man (HR: 2.30; 95% CI: 2.09–2.53), heavy alcohol consumption (HR: 2.02; 95% CI: 1.85–2.21), sleep insufficiency (HR: 1.64; 95% CI: 1.46–1.84), psychological distress (HR: 1.63; 95% CI: 1.43–1.85), trauma symptoms (HR: 1.98; 95% CI: 1.79–2.19), a history of mental illness (HR: 1.52; 95% CI: 1.32–1.76), and family finances (HR: 1.74; 95% CI: 1.57–1.94) significantly influenced the development of problem drinking.
Table 2.
Crude hazard ratios and 95% confidence intervals for the occurrence of problem drinking from FY 2012 to FY 2017.
Table 3 presents the results of multivariate Cox proportional hazards analysis according to sex to determine sex-based differences. Alcohol consumption, trauma symptoms, and family finances were common risk factors for problem drinking among both men and women. Sleep insufficiency (HR: 1.22; 95% CI: 1.04–1.42) and high blood pressure (HR: 1.12; 95% CI: 1.00–1.25) significantly influenced problem drinking among men, independent of age. In contrast, younger age (HR: 1.59; 95% CI: 1.21–2.08), a history of diabetes mellitus (HR: 1.32; 95% CI: 1.02–1.69), and a history of mental illness (HR: 1.31; 95% CI: 1.02–1.69) were significant risk factors for problem drinking among women independent of age.
Table 3.
Multivariate-adjusted HRs and 95% CIs for the occurrence of problem drinking from FY 2012 to FY 2017.
This study also examined the factors that enabled recovery from problem drinking between FY 2012 and 2017. Table 4 presents the variables based on the change (or a lack thereof) in recovery rates from problem drinking (i.e., individuals with high to low scores were recovering problem drinkers; individuals with continuously high scores were current problem drinkers) from FY 2012 to 2017, revealing the characteristics associated with these changes. The total number of recovering and current problem drinkers was 1993 and 814, respectively. Furthermore, 71.0% of the participants were recovering problem drinkers from FY 2013 to FY 2017. Recovering problem drinkers also included a higher proportion of those with K6 and PCL-S scores of <13 and <44, respectively, and were not heavy drinkers when compared to current problem drinkers. Recovery from problem drinking was associated with age, subjective health, sleep insufficiency, family financial status, and alcohol consumption (p < 0.05).
Table 4.
Characteristics of problem drinkers in FY 2012 by subsequent recovery.
Table 5 presents an overview of univariate Cox proportional hazards models, which were established using factors that were determined as significant during survival analysis, to identify the association between social and psychological indicators and frequency of recovery from problem drinking among the evacuees. Univariate Cox proportional hazards analysis showed that LSN-6 tended to be associated with a reduced risk of problem drinking (HR: 0.93; 95% CI: 0.85–1.02) although its statistical significance was not found.
Table 5.
Crude HRs and 95% CIs for recovery from problem drinking from FY 2012 to FY 2017.
Table 6 presents the results of multivariate Cox proportional hazards analysis according to sex to determine sex-based differences. Heavy drinking (≥4 drinks) and trauma symptoms (PCL ≥ 44) were significant factors that prevented recovery from problem drinking.
Table 6.
Multivariate-adjusted HRs and 95% CIs for recovery from problem drinking from FY 2012 to FY 2017.
4. Discussion
This study examined the risk and recovery factors for problem drinking from FY 2012 to FY 2017 among evacuees from regions affected by the Great East Japan Earthquake. The results showed that there are some similarities and differences between men and women in developing problem drinking after disasters. Additionally, heavy drinking (≥4 drinks) and trauma symptoms (PCL ≥ 44) were found to be significant factors that prevented recovery from problem drinking among both genders. Previous studies have reported that individuals are impacted by drinking behavior, including alcohol consumption for two years after traumatic events [6,32,33,34]. However, our study is the first to underscore the risk factors and recovery from problem drinking over six years.
This research found that a substantial proportion of the sample (15.5%) developed problem drinking within six years of experiencing a compound disaster. This implies that several evacuees still suffered from disaster-related drinking problems for more than a few years after the disaster. Therefore, one must provide seamless support for evacuees who suffer from drinking issues by understanding any risk factors such as trauma issues and any other risk factors underlying problem drinking. The results also show that alcohol consumption (≥4 drinks), disaster-related factors, family finances, and sleep insufficiencies were related to the development of problem drinking from FY 2012 to FY 2017, which were the same risk factors in the chronic post-disaster phase from FY 2012 to FY 2013. Additionally, heavy drinking was found to be a significant factor in the development of problem drinking from FY 2012 to FY 2017 among men and women. Risk factors for the development of problem drinking in the chronic phase after a compound disaster, such as male sex, sleep insufficiency, trauma symptoms (PCL-S ≥ 44), and family finances, were constant from FY 2012 to FY 2013. Notably, upon comparing the HR in the short-term research from FY 2012 to FY 2013, the HR of men with problem drinking in the present study from FY 2012 to FY 2017 (2.03 95% CI: 1.83–2.04) was higher than the odds ratio (OR = 1.77, 95%CI: 1.41–2.21) in the previous study [12]. Furthermore, the HRs for trauma symptoms (PCL-S ≥ 44) and alcohol consumption (≥4 drinks) remained high between the chronic phase and FY 2012–FY 2017. Therefore, both alcohol consumption and trauma symptoms led to the development of problem drinking. Notably, continued trauma symptoms and heavy alcohol consumption could comprise severe risk factors for developing problem drinking among men in the period from FY 2012 to FY 2017 in contrast to FY 2012 to FY 2013. Thus, the findings of this study emphasize the importance of (a) having practitioners intervene to support evacuees who have a drinking problem, (b) paying attention to the assessment of trauma symptoms, and (c) providing psychoeducation on alcohol. Meanwhile, a mental illness diagnosis and subjective health conditions indicated long-term risk factors for problem drinking, but not in the short term.
Variation based on gender was found in the risk factors for developing problem drinking from FY 2012 to FY 2017. Sleep insufficiency and high blood pressure were significant risk factors in men. Furthermore, women of a younger age (i.e., 20–49 years) and diagnosed with diabetes mellitus and mental illness constituted significant risk factors. An association between physical illnesses such as high blood pressure and diabetes mellitus and the development of problem drinking among evacuees is a new finding. Moreover, insomnia has been strongly associated with problem drinking [35,36] as alcohol has also been used as a medication for insomnia [35].
Assessing the differences in risk factors based on gender is crucial for understanding how problem drinking develops and when particular intervention plans can be implemented. In contrast to the preceding short-term study between FY 2012 and FY 2013, this study found differences based on gender. A history of diabetes mellitus and mental illness was significantly associated with the risk of problem drinking among women. To examine whether the result is a reversal of causality, the results of the follow-up study, excluding the FY 2013 data, were analyzed, as shown in the Appendix A (Table A1, Table A2, Table A3, Table A4, Table A5 and Table A6). The results showed that diabetes mellitus was still a risk factor among women (HR: 1.47; 95% C1: 1.11–1.94). Therefore, this study statistically analyzed the breakdown of women both with and without a history of diabetes mellitus for each response to CAGE questions. Positive responses to three questions (i.e., “Have you ever felt you ought to cut down on your drinking?” Have people annoyed you by criticizing your drinking?”, and “Have you ever felt bad or guilty about your drinking?”) were high among women with a history of diabetes mellitus (p < 0.05). The results may indicate that women who were diagnosed with diabetes mellitus with problem drinking had a high tendency of having felt that they ought to cut down on their drinking and felt guilty of their drinking behavior. A study previously reported that evacuees experienced difficulty in accessing medication, treatment, and clinical services [37]. Particularly, the women evacuees diagnosed with diabetes mellitus might have encountered difficulty in seeking treatment for their drinking problems as they felt guilty for their behavior.
Thus, this study analyzed factors that prevented the development of problem drinking from FY 2012 to FY 2017 for both genders. Unfortunately, the current results did not reveal any specific protective factor. However, it was found that trauma symptoms and alcohol consumption prevented recovery.
Therefore, the LSN-6 may be a key protective factor for evacuees with problem drinking. Research has also presented disaster research on the Great East Japan Earthquake, suggesting that continuous intervention for evacuees with alcoholism who lived alone in temporary housing helped them recover from their drinking problems [38]. Thus, instead of isolating evacuees suffering from drinking problems, it is important to provide continuous support.
Based on current knowledge, this is the first study to examine risk and protective factors for problem drinking among evacuees affected by the Great East Japan Earthquake between FY 2012 and FY 2017. Particularly, this study compared the risk factors for problem drinking between the period from FY 2012 to FY 2013 and FY 2012 to FY 2017 among men and women. Consequently, problem drinking was found to be caused by physical, psychological, and economic crises, and risk factors increased substantially between FY 2012 and FY 2017. This suggests that medical practitioners should implement long-term interventions to support evacuees with problem drinking habits.
Meta-analyses and population-based studies have demonstrated how alcohol consumption changes after a traumatic event and/or with risk factors [8,39]. However, some studies have examined both problem drinking and alcohol consumption vis-à-vis risk factors after compound disasters in the long term. Therefore, this is the first study to examine how alcohol consumption and the main risk factors, such as socio-demographic variables, sleep insufficiency, psychological distress (K6), trauma symptoms (PCSL-S), and alcohol consumption, culminate in problem drinking.
This study has several limitations. First, the response rate was 19.9% in FY 2012. Therefore, the results may have overestimated or underestimated the impact of problem drinking after the Great East Japan Earthquake. Second, a previous study explained that the persistence of feelings such as helplessness and hopelessness due to grief among evacuees was a predictor of increased drinking [32]. However, as these factors were not evaluated in the present study, there may be confounding unadjusted latent factors that contribute to the risk of problem drinking. Finally, this study used Cox analysis to identify risk and protective factors from FY 2012 to FY 2017. Thus, the individual changes in the CAGE scores were not analyzed. Thirdly, problem drinking was assessed in this study using a standard questionnaire, CAGE, while sleep was assessed solely based on participants’ subjective symptoms
5. Conclusions
This study found that recovery from heavy alcohol consumption and alleviation of trauma symptoms are key factors in enabling recovery from problem drinking among evacuees. It contributes to the literature by identifying risk and protective factors for problem drinking in the long term. Understanding these factors can shape effective long-term intervention strategies to physically and psychologically support evacuees. The practitioners are required to continue to have long-term, large-scale surveys, to conduct follow-up interventions for the evacuees who have suffered from a drinking problem.
Therefore, the government needs funding to provide long-term support for evacuees recovering from alcohol addiction.
Author Contributions
Y.U., F.H., T.O., M.M., S.Y., M.S., H.N., H.Y. and K.K. Analysis of interpretation of data: Y.U., F.H., T.O., S.Y., I.M., S.I., M.S. Drafting of the manuscript: Y.U. Revising the manuscript for intellectual content: F.H., T.O., M.M., S.Y., M.S., H.Y., K.K. Final approval of the completed article: All authors. All authors have read and agreed to the published version of the manuscript.
Funding
This survey was supported by the National Health Fund for Children and Adults Affected by the Nuclear Incident.
Institutional Review Board Statement
This study protocol was approved by the Fukushima Medical University Ethics Committee (approval no. 2020-239).
Informed Consent Statement
A questionnaire was mailed to the participants stating the purpose of the study: by returning the questionnaire, the participants were considered to have given their written consent to participate.
Data Availability Statement
The datasets analyzed during the present study are not publicly available because the data from the Fukushima Health Management Survey belongs to the government of Fukushima Prefecture, and can only be used within the organization.
Acknowledgments
We express our deep gratitude to the staff of the Radiation Medical Science Center for Fukushima Health Management Survey (kenkan@fmu.ac.jp (F.H.M.S.) Membership of the Mental Health Group of the Fukushima Health Management Survey: Masaharu Maeda, Atsushi Takahashi, Maho Momoi, Saori Goto, Tetsuya Ohira, Mitsuaki Hosoya, Michio Shimabukuro, Hirooki Yabe, Tomoaki Tamaki, Kanae Takase, Itaru Miura, Hajime Iwasa, Shuntaro Itagaki, Mayumi Harigane, Naoko Horikoshi, Seiji Yasumura and Hitoshi Ohto. The findings and conclusions of this article are solely the responsibility of the authors and do not represent the official views of the Fukushima Prefecture government.
Conflicts of Interest
The authors declare no conflict of interest.
Appendix A
Table A1.
Characteristics of participants without problem drinking in FY 2012 but who subsequently developed problem drinking.
Table A1.
Characteristics of participants without problem drinking in FY 2012 but who subsequently developed problem drinking.
| Total | 2012; CAGE < 2→2014–2017; CAGE < 2 | % | 2012; CAGE < 2→2014–2017; CAGE >= 2 | % | p | |
|---|---|---|---|---|---|---|
| Sex | 13,412 | |||||
| Men | 7953 | 6487 | 56.6 | 1466 | 75.2 | <0.0001 |
| Women | 5459 | 4976 | 43.4 | 483 | 24.8 | |
| Age | ||||||
| 20–49 years | 4855 | 4078 | 35.6 | 777 | 39.9 | 0.000 |
| 50–64 years | 4798 | 4109 | 35.8 | 689 | 35.4 | |
| ≥ 65 years | 3759 | 3276 | 28.6 | |||
| Subjective health condition | ||||||
| Very good–Good | 3002 | 2651 | 23.7 | 351 | 18.6 | <0.0001 |
| Normal | 8222 | 7022 | 62.7 | 1200 | 63.6 | |
| Poor–Very poor | 1857 | 1522 | 13.6 | 335 | 17.8 | |
| History of diagnosed mental illness | ||||||
| No | 12,357 | 1061 | 94.1 | 1747 | 91.8 | 0.000 |
| Yes | 828 | 671 | 5.9 | 157 | 8.2 | |
| Diagnosed with high blood pressure | ||||||
| No | 7228 | 6313 | 55.5 | 915 | 47.5 | <0.0001 |
| Yes | 6070 | 5059 | 44.5 | 1011 | 52.5 | |
| Diagnosed with diabetes mellitus | ||||||
| No | 10,418 | 9005 | 79.9 | 1413 | 74.4 | <0.0001 |
| Yes | 2757 | 2271 | 20.1 | 486 | 25.6 | |
| Diagnosed with hyperlipidemia | ||||||
| No | 7909 | 6796 | 60.3 | 1113 | 58.3 | 0.089 |
| Yes | 5265 | 4468 | 39.7 | 797 | 41.7 | |
| Exercise | ||||||
| Every day | 1944 | 1637 | 14.5 | 307 | 16.0 | 0.3151 |
| 2–4 times a week | 3015 | 2587 | 22.9 | 428 | 22.4 | |
| Once a week | 2159 | 1859 | 16.4 | 300 | 15.7 | |
| None | 6105 | 5227 | 46.2 | 878 | 45.9 | |
| Sleep insufficiency | ||||||
| Satisfied | 5095 | 4439 | 39.8 | 656 | 34.6 | <0.0001 |
| A little dissatisfied | 5953 | 5092 | 45.6 | 861 | 45.4 | |
| Very dissatisfied to quite problematic | 2014 | 1636 | 14.7 | 378 | 19.9 | |
| Employment change | ||||||
| Yes | 811 | 666 | 5.8 | 145 | 7.4 | 0.005 |
| No | 12,601 | 10,797 | 94.2 | 1804 | 92.6 | |
| Family finances | ||||||
| Severe | 1935 | 1533 | 14.2 | 402 | 21.9 | <0.0001 |
| Below average | 3893 | 3298 | 30.5 | 595 | 32.5 | |
| Average | 6343 | 5564 | 51.4 | 779 | 42.5 | |
| Not severe | 490 | 434 | 4.0 | 56 | 3.1 | |
| Psychological distress | ||||||
| K6 < 13 | 11,888 | 10,230 | 92.3 | 1658 | 88.9 | <0.0001 |
| K6 ≥ 13 | 1065 | 859 | 7.7 | 206 | 11.1 | |
| Trauma symptoms | ||||||
| PCL < 44 | 11,023 | 9557 | 87.6 | 1466 | 79.2 | <0.0001 |
| PCL ≥ 44 | 1741 | 1357 | 12.4 | 384 | 20.8 | |
| Social network | ||||||
| LSN_6 < 12 | 4879 | 4103 | 37.1 | 776 | 41.2 | 0.001 |
| LSN_6 ≥ 12 | 8055 | 6948 | 62.9 | 1107 | 58.8 | |
| Alcohol consumption (drinks) | ||||||
| <4 | 10,713 | 9438 | 85.6 | 1275 | 68.9 | <0.0001 |
| ≥4 | 2160 | 1584 | 14.4 | 576 | 31.1 |
CAGE: Cutting down, Annoyed by criticism, Guilt, and Eye-opener questionnaire; LSN: Lubben Social Network Scale; PCL: PTSD Checklist-specific; K6: Kessler psychological distress scale.
Table A2.
Crude hazard ratios and 95% confidence intervals for the occurrence of problem drinking from FY 2012 to FY 2017.
Table A2.
Crude hazard ratios and 95% confidence intervals for the occurrence of problem drinking from FY 2012 to FY 2017.
| All | Men | Women | ||||
|---|---|---|---|---|---|---|
| HR | 95%CI | HR | 95%CI | HR | 95%CI | |
| Sex (Reference: Women) | ||||||
| Men | 2.11 | 1.90–2.34 | ||||
| Age (Reference: ≥65 years) | ||||||
| 20–49 years | 1.03 | 0.92–1.16 | 0.87 | 0.76–1.01 | 1.48 | 1.17–1.87 |
| 50–64 years | 0.98 | 0.90–1.08 | 0.97 | 0.86–1.08 | 1.05 | 0.82–1.35 |
| Subjective health condition (Reference: Very good–Good) | ||||||
| Normal | 1.33 | 1.18–1.50 | 1.29 | 1.13–1.48 | 1.48 | 1.14–1.91 |
| Poor–Very poor | 1.72 | 1.48–2.00 | 1.67 | 1.41–1.99 | 1.93 | 1.41–2.65 |
| Exercise (Reference: Every day) | ||||||
| 2–4 times a week | 0.96 | 0.83–1.11 | 1.00 | 0.85–1.18 | 0.80 | 0.57–1.14 |
| Once a week | 0.98 | 0.83–1.15 | 1.03 | 0.86–1.24 | 0.82 | 0.57–1.19 |
| None | 1.06 | 0.93–1.22 | 1.07 | 0.92–1.25 | 0.98 | 0.71–1.35 |
| History of diagnosed mental illness (Reference: No) | ||||||
| Yes | 1.50 | 1.28–1.77 | 1.47 | 1.21–1.79 | 1.62 | 1.20–2.17 |
| Diagnosed with high blood pressure (Reference: None) | ||||||
| Yes | 1.19 | 1.08–1.32 | 1.20 | 1.07–1.35 | 1.17 | 0.94–1.46 |
| Diagnosed with diabetes mellitus (Reference: No) | ||||||
| Yes | 1.21 | 1.09–1.35 | 1.15 | 1.02–1.29 | 1.53 | 1.19–1.97 |
| Sleep insufficiency (Reference: Satisfied) | ||||||
| A little dissatisfied | 1.24 | 1.12–1.37 | 1.28 | 1.14–1.44 | 1.16 | 0.93–1.44 |
| Very dissatisfied to quite problematic | 1.73 | 1.52–1.96 | 1.76 | 1.52–2.05 | 1.70 | 1.32–2.19 |
| Employment change (Reference: No) | ||||||
| Yes | 1.31 | 1.10–1.55 | 1.29 | 1.05–1.58 | 1.36 | 0.99–1.86 |
| Family finances (Reference: Average) | ||||||
| Severe | 1.74 | 1.54–1.96 | 1.72 | 1.5–1.98 | 1.84 | 1.44–2.35 |
| Below average | 1.24 | 1.11–1.38 | 1.19 | 1.05–1.34 | 1.38 | 1.12–1.71 |
| Not severe | 0.90 | 0.69–1.18 | 0.80 | 0.58–1.12 | 1.23 | 0.77–1.97 |
| Psychological distress (Reference: K6 < 13) | ||||||
| K6 ≥ 13 | 1.64 | 1.42–1.90 | 1.71 | 1.44–2.03 | 1.56 | 1.20–2.02 |
| Trauma symptom (Reference: PCL < 44) | ||||||
| PCL ≥ 44 | 1.90 | 1.70–2.13 | 1.88 | 1.65–2.15 | 2.02 | 1.63–2.51 |
| Social network (Reference: LSN_6 ≥ 12) | ||||||
| LSN_6 < 12 | 1.20 | 1.09–1.32 | 1.2 | 1.08–1.34 | 1.22 | 1.01–1.47 |
| Alcohol consumption (Reference: <4 drinks) | ||||||
| ≥4 drinks | 1.97 | 1.78–2.18 | 1.84 | (1.65–2.05 | 3.08 | 2.37–4.01 |
CAGE: Cutting down, Annoyed by criticism, Guilt, and Eye―opener questionnaire; LSN: Lubben Social Network Scale; PCL: PTSD Checklist―specific; K6: Kessler psychological distress scale; FY: Fiscal year; HR: Hazard ratio; CI: Confidence interval.
Table A3.
Multivariate―adjusted hazard ratios and 95% confidence intervals for the occurrence of problem drinking from FY 2012 to FY 2017.
Table A3.
Multivariate―adjusted hazard ratios and 95% confidence intervals for the occurrence of problem drinking from FY 2012 to FY 2017.
| All | Men | Women | ||||
|---|---|---|---|---|---|---|
| HR | 95%CI | HR | 95%CI | HR | 95%CI | |
| Sex (Reference: Women) | ||||||
| Men | 1.87 | 1.67–2.09 | ||||
| Age (Reference: ≥65 years) | ||||||
| 20–49 years | 1.07 | 0.93–1.24 | 0.89 | 0.75–1.06 | 1.57 | 1.16–2.13 |
| 50–64 years | 0.93 | 0.83–1.04 | 0.92 | 0.81–1.05 | 1.06 | 0.81–1.39 |
| Subjective health condition (Reference: Very good–Good) | ||||||
| Normal | 1.16 | 1.03–1.32 | 1.13 | 0.98–1.30 | 1.27 | 0.97–1.67 |
| Poor–Very poor | 1.13 | 0.95–1.34 | 1.10 | 0.90–1.35 | 1.19 | 0.83–1.71 |
| History of diagnosed mental illness (Reference: No) | ||||||
| Yes | 1.16 | 0.97–1.38 | 1.12 | 0.91–1.38 | 1.31 | 0.95–1.79 |
| Diagnosed with high blood pressure (Reference: No) | ||||||
| Yes | 1.03 | 0.93–1.15 | 1.07 | 0.95–1.21 | 0.91 | 0.71–1.16 |
| Diagnosed with diabetes mellitus (Reference: No) | ||||||
| Yes | 1.11 | 0.99–1.25 | 1.05 | 0.93–1.20 | 1.47 | 1.11–1.94 |
| Sleep insufficiency (Reference: Satisfied) | ||||||
| A little dissatisfied | 1.13 | 1.02–1.2 | 1.17 | 1.04–1.32 | 1.05 | 0.84–1.31 |
| Very dissatisfied to quite problematic | 1.29 | 1.12–1.49 | 1.32 | 1.11–1.57 | 1.28 | 0.97–1.70 |
| Employment change (Reference: No) | ||||||
| Yes | 1.25 | 1.05–1.49 | 1.26 | 1.02–1.55 | 1.26 | 0.91–1.73 |
| Family finances (Reference: Average) | ||||||
| Severe | 1.36 | 1.19–1.55 | 1.36 | 1.17–1.58 | 1.39 | 1.07–1.82 |
| Below average | 1.10 | 0.99–1.23 | 1.07 | 0.95–1.22 | 1.21 | 0.98–1.51 |
| Not severe | 0.97 | 0.74–1.28 | 0.86 | 0.62–1.20 | 1.37 | 0.85–2.20 |
| Psychological distress (Reference: K6 < 13) | ||||||
| K6 ≥ 13 | 0.97 | 0.81–1.15 | 1.02 | 0.83–1.26 | 0.87 | 0.63–1.20 |
| Trauma (Reference: PCL < 44) | ||||||
| PCL ≥ 44 | 1.51 | 1.31–1.73 | 1.48 | 1.26–1.73 | 1.61 | 1.24–2.10 |
| Social network (Reference: LSN_6 ≥ 12) | ||||||
| LSN_6 < 12 | 1.08 | 0.98–1.19 | 1.10 | 0.98–1.23 | 1.05 | 0.86–1.27 |
| Alcohol consumption (Reference: <4 drinks) | ||||||
| ≥4 drinks | 1.94 | 1.75–2.15 | 1.81 | 1.62–2.02 | 3.06 | 2.35–3.99 |
CAGE: Cutting down, Annoyed by criticism, Guilt, and Eye―opener questionnaire; LSN: Lubben Social Network Scale; PCL: PTSD Checklist―specific; K6: Kessler psychological distress scale; FY: Fiscal year; HR: Hazard ratio; CI: Confidence interval. Multivariate analysis adjusted for sex and age.
Table A4.
Characteristics of problem drinkers in FY 2012 by subsequent recovery excluded in FY 2013.
Table A4.
Characteristics of problem drinkers in FY 2012 by subsequent recovery excluded in FY 2013.
| Total | Maintaing Problem Drinkers CAGE >= 2 in 2012→ 2014–2017; CAGE >= 2 | % | Recovery Problem Drinkers CAGE >= 2 in 2012→ 2014–2017;CAGE < 2 | % | p | |
|---|---|---|---|---|---|---|
| Sex | ||||||
| Men | 20,021 | 600 | 81.1 | 1401 | 80.1 | 0.5567 |
| Women | 489 | 140 | 18.9 | 349 | 19.9 | |
| Age | ||||||
| 20–49 years | 880 | 212 | 28.6 | 668 | 38.2 | |
| 50–64 years | 947 | 304 | 41.1 | 643 | 36.7 | <0.0001 |
| ≥ 65 years | 663 | 224 | 30.3 | 439 | 25.1 | |
| Subjective health condition | ||||||
| Very good–Good | 395 | 86 | 12.1 | 309 | 18.0 | <0.0001 |
| Normal | 1471 | 417 | 58.8 | 1054 | 61.2 | |
| Poor–Very poor | 564 | 206 | 29.1 | 358 | 20.8 | |
| History of diagnosed mental illness | ||||||
| No | 2181 | 627 | 87.6 | 1554 | 91.1 | 0.0083 |
| Yes | 24 | 89 | 12.4 | 152 | 8.9 | |
| Diagnosed with high blood pressure | ||||||
| No | 1094 | 326 | 44.8 | 768 | 44.3 | 0.820 |
| Yes | 1365 | 401 | 55.2 | 964 | 55.7 | |
| Diagnosed with diabetes mellitus | ||||||
| No | 1762 | 528 | 73.5 | 1234 | 72.2 | 0.4887 |
| Yes | 666 | 190 | 26.5 | 476 | 27.8 | |
| Diagnosed with hyperlipidemia | ||||||
| No | 1399 | 419 | 58.8 | 980 | 57.3 | 0.4946 |
| Yes | 1022 | 293 | 41.2 | 729 | 42.7 | |
| Exercise | ||||||
| Every day | 361 | 93 | 12.8 | 268 | 15.6 | 0.0748 |
| 2–4 times a week | 504 | 140 | 19.2 | 364 | 21.1 | |
| Once a week | 413 | 119 | 16.3 | 294 | 17.1 | |
| None | 1172 | 376 | 51.6 | 796 | 46.2 | |
| Sleep insufficiency | ||||||
| Satisfied | 770 | 186 | 25.8 | 584 | 34.4 | <0.0001 |
| A little dissatisfied | 1130 | 331 | 45.8 | 799 | 47.1 | |
| Very dissatisfied to quite problematic | 518 | 205 | 28.4 | 313 | 18.5 | |
| Employment change | ||||||
| Yes | 185 | 67 | 9.1 | 118 | 6.7 | 0.0435 |
| No | 2304 | 672 | 90.9 | 1632 | 93.3 | |
| Family finances | ||||||
| Severe | 493 | 182 | 26.3 | 311 | 19.1 | <0.0001 |
| Below average | 844 | 259 | 37.4 | 585 | 36.0 | |
| Average | 914 | 229 | 33.1 | 685 | 42.1 | |
| Not severe | 67 | 22 | 3.2 | 45 | 2.8 | |
| Psychological distress | ||||||
| K6 < 13 | 1968 | 545 | 76.3 | 1423 | 85.3 | <0.0001 |
| K6 ≥ 13 | 414 | 169 | 23.7 | 245 | 14.7 | |
| Trauma symptoms | ||||||
| PCL < 44 | 1726 | 461 | 66.3 | 1265 | 76.5 | <0.0001 |
| PCL ≥ 44 | 622 | 234 | 33.7 | 388 | 23.5 | |
| Social network | ||||||
| LSN_6 < 12 | 1027 | 335 | 47.4 | 692 | 41.1 | 0.0049 |
| LSN_6 ≥ 12 | 1362 | 372 | 53 | 990 | 58.9 | |
| Alcohol consumption (drinks) | ||||||
| <4 | 1391 | 348 | 49.2 | 1043 | 62.3 | <0.0001 |
| ≥4 | 990 | 360 | 50.8 | 630 | 37.7 |
CAGE: Cutting down, Annoyed by criticism, Guilt, and Eye-opener questionnaire; LSN: Lubben Social Network Scale; PCL: PTSD Checklist-specific; K6: Kessler psychological distress scale.
Table A5.
Crude hazard ratios and 95% confidence intervals for problem drinking recovery from FY 2012 to FY 2017 excluded in FY 2013.
Table A5.
Crude hazard ratios and 95% confidence intervals for problem drinking recovery from FY 2012 to FY 2017 excluded in FY 2013.
| All | Men | Women | ||||
|---|---|---|---|---|---|---|
| HR | 95%CI | HR | 95%CI | HR | 95%CI | |
| Sex (Reference: Women) | ||||||
| Men | 0.93 | 0.82–1.06\ | ||||
| Age (Reference: ≥65 years old) | ||||||
| 20–49 years old | 0.74 | 0.65–0.84 | 0.77 | 0.66–0.89 | 0.67 | 0.49–0.91 |
| 50–64 years old | 0.77 | 0.69–0.85 | 0.76 | 0.68–0.86 | 0.77 | 0.55–1.07 |
| Subjective health condition (Reference: Very good–Good) | ||||||
| Normal | 0.87 | 0.76–0.99 | 0.88 | 0.76–1.02 | 0.82 | 0.62–1.08 |
| Poor–Very poor | 0.71 | 0.61–0.83 | 0.72 | 0.61–0.85 | 0.68 | 0.49–0.96 |
| History of diagnosed mental illness (Reference: No) | ||||||
| Yes | 0.80 | 0.67–0.94 | 0.79 | 0.65–0.96 | 0.79 | (0.57–1.10 |
| Sleep insufficiency (Reference: Satisfied) | ||||||
| A little dissatisfied | 0.88 | 0.79–0.99 | 0.87 | 0.77–0.97 | 1.00 | 0.75–1.33 |
| Very dissatisfied to quite problematic | 0.69 | 0.60–0.79 | 0.65 | 0.56–0.77 | 0.84 | (0.62–1.15 |
| Employment change (Reference: No) | ||||||
| Yes | 0.86 | 0.71–1.04 | 0.97 | 0.77–1.21 | 0.65 | 0.45–0.93 |
| Family finances (Reference: Average) | ||||||
| Severe | 0.76 | 0.66–0.87 | 0.73 | 0.63–0.85 | 0.95 | 0.69–1.29 |
| Below average | 0.88 | 0.79–0.99 | 0.93 | 0.82–1.05 | 0.74 | 0.58–0.94 |
| Not severe | 0.90 | 0.66–1.21 | 0.93 | 0.67–1.31 | 0.95 | 0.69–1.29 |
| Psychological distress (Reference: K6 < 13) | ||||||
| K6 ≥ 13 | 0.72 | 0.63–0.82 | 0.72 | 0.61–0.84 | 0.72 | 0.55–0.93 |
| Trauma symptom (Reference: PCL < 44) | ||||||
| PCL ≥ 44 | 0.73 | 0.65–0.8 | 0.73 | 0.64–0.83 | 0.71 | 0.56–0.90 |
| Social network (Reference: LSN_6 ≥ 12) | ||||||
| LSN_6 < 12 | 0.91 | 0.82–1.00 | 0.90 | 0.8–1.00 | 0.97 | 0.78–1.20 |
| Alcohol consumption (Reference: <4 drinks) | ||||||
| ≥4 drinks | 0.76 | 0.69–0.84 | 0.76 | 0.68–0.85 | 0.77 | 0.6–1.00 |
CAGE: Cutting down, Annoyed by criticism, Guilt, and Eye―opener questionnaire; LSN: Lubben Social Network Scale; PCL: PTSD Checklist―specific; K6: Kessler psychological distress scale; FY: Fiscal year; HR: Hazard ratio; CI: Confidence interval. Multivariate analysis adjusted for sex and age.
Table A6.
Multivariate Cox proportional hazard model: Possible risk factors for problem drinking according to increase in CAGE score.
Table A6.
Multivariate Cox proportional hazard model: Possible risk factors for problem drinking according to increase in CAGE score.
| All | Men | Women | ||||
|---|---|---|---|---|---|---|
| HR | 95%CI | HR | 95%CI | HR | 95%CI | |
| Sex (Reference:\Women) | ||||||
| Men | 0.96 | 0.84–1.09 | ||||
| Age (Reference: ≥65 years) | ||||||
| 20–49 years | 0.80 | 0.70–0.93 | 0.84 | 0.71–0.99 | 0.70 | 0.48–1.01 |
| 50–64 years | 0.81 | 0.72–0.91 | 0.81 | 0.72–0.92 | 0.75 | 0.52–1.08 |
| Subjective health condition (Reference: Very good–Good) | ||||||
| Normal | 0.94 | 0.82–1.07 | 0.96 | 0.83–1.11 | 0.77 | 0.57–1.04 |
| Poor–Very poor | 0.89 | (0.75–1.06 | 0.91 | 0.75–1.09 | 0.79 | 0.53–1.19 |
| History of diagnosed mental illness (Reference: No) | ||||||
| Yes | 0.90 | 0.75–1.07 | 0.90 | 0.74–1.11 | 0.87 | 0.61–1.24 |
| Sleep insufficiency (Reference: Satisfied) | ||||||
| A little dissatisfied | 0.93 | 0.83–1.04 | 0.91 | 0.80–1.03 | 1.17 | 0.87–1.59 |
| Very dissatisfied to quite problematic | 0.82 | 0.70–0.96 | 0.77 | 0.64–0.92 | 1.16 | 0.81–1.65 |
| Family finances (Reference: Average) | ||||||
| Severe | 0.93 | 0.80–1.07 | 0.89 | 0.76–1.05 | 1.16 | 0.83–1.63 |
| Below average | 0.97 | 0.86–1.08 | 1.01 | 0.89–1.14 | 0.79 | 0.61–1.03 |
| Not severe | 0.86 | 0.64–1.17 | 0.90 | (0.64–1.26 | 0.69 | 0.34–1.39 |
| Psychological distress (Reference: K6 < 13) | ||||||
| K6 ≥ 13 | 0.91 | 0.77–1.07 | 0.93 | 0.77–1.13 | 0.85 | 0.62–1.17 |
| Trauma (Reference: PCL < 44) | ||||||
| PCL ≥ 44 | 0.84 | 0.73–0.96 | 0.85 | 0.73–0.99 | 0.79 | (0.58–1.06 |
| Alcohol consumption (Reference: <4 drinks) | ||||||
| ≥4 drinks | 0.77 | 0.69–0.85 | 0.76 | 0.68–0.85 | 0.80 | 0.61–1.04 |
CAGE: Cutting down, Annoyed by criticism, Guilt, and Eye―opener questionnaire; LSN: Lubben Social Network Scale; PCL: PTSD Checklist―specific; K6: Kessler psychological distress scale.
References
- Simons, J.S.; Simons, R.M.; Keith, J.A.; Grimm, K.J.; Stoltenberg, S.F.; O’Brien, C.; Andal, K. PTSD symptoms and alcohol-related problems among veterans: Temporal associations and vulnerability. J. Abnorm. Psychol. 2018, 127, 733–780. [Google Scholar] [CrossRef] [PubMed]
- Flory, K.; Hankin, B.L.; Cheely, C.; Turecki, G. Alcohol and cigarette use and misuse among Hurricane Katrina survivors: Psychosocial risk and protective factors. Subst. Use Misuse 2009, 44, 1711–1724. [Google Scholar] [CrossRef] [PubMed]
- Fullerton, C.S.; Mckibben, J.B.A.; Reissman, D.B.; Scharf, T.; Kowalski-Trakofler, K.M.; Shultz, J.M.; Ursano, R.J. Posttraumatic stress disorder, depression, and alcohol and tobacco use in public health workers after the 2004 Florida Hurricane. Disaster Med. Public Health Prep. 2019, 7, 89–95. [Google Scholar] [CrossRef] [PubMed]
- Welch, A.E.; Caramanica, K.; Maslow, C.; Cone, J.E.; Farfel, M.R.; Keyes, K.M.; Stellman, S.D.; Hasin, D.S. Frequent binge drinking five to six years after exposure 9/11: Findings from the World Trade Center Health Registry. Drug. Alcohol. Depend. 2014, 1, 1–7. [Google Scholar] [CrossRef]
- Garrey, S.K.; Welch, A.E.; Jacobson, M.H.; Brackbill, R.M.; Gargano, L.M. The International self-medication of 9/11-Related PTSD symptoms with alcohol: 15 years after the disasters. Int. J. Env. Res. Public Health 2020, 17, 5327. [Google Scholar] [CrossRef] [PubMed]
- Adams, R.; Boscarino, J.A.; Galea, S. Social and psychological resources and health outcomes after the World Trade Center disaster. Soc. Sci. Med. 2006, 62, 176–188. [Google Scholar] [CrossRef]
- Chilcoat, H.D.; Meneard, C. Epidemiological Investigation: Comorbidity of posttraumatic stress disorder and substance use disorder. In Trauma and Substance Abuse: Causes, Consequences and Treatment of Comorbid Disorders; Ouimette, P., Brown, P.J., Eds.; American Psychological Publishing: Washington, DC, USA, 2003; pp. 9–28. [Google Scholar]
- DiMaggio, C.; Sandra, G.; Li, G. Substance use and misuse in the aftermath of terrorism. A Bayesian meta-analysis. Addiction 2008, 104, 894–904. [Google Scholar] [CrossRef]
- Stewart, S.S.; Mitchell, T.L.; Wright, K.D.; Loba, P. The relations of PTSD symptoms to alcohol use and coping drinking in volunteers who responded to the Swissair Flight 111 airline disaster. J. Anxiety Disord. 2004, 18, 51–68. [Google Scholar] [CrossRef]
- Osaki, Y.; Maesato, H.; Minobe, R.; Kinjo, A.; Kuwabara, Y.; Imamoto, A.; Myoga, Y.; Matsushita, S.; Higuchi, S. Changes in smoking behavior among victims after the great East Japan earthquake and tsunami. Environ. Health Prev. Med. 2020, 25, 19. [Google Scholar] [CrossRef]
- Zhang, W.; Ohira, T.; Maeda, M.; Nakano, H.; Iwasa, H.; Yasumura, S.; Ohtsuru, A.; Harigane, M.; Suzuki, Y.; Horikoshi, N.; et al. The association between self-reported sleep dissatisfaction after the Great East Japan Earthquake, and a deteriorated socioeconomic status in the evacuation area: The Fukushima Health Management Survey. Sleep Med. 2020, 68, 63–70. [Google Scholar] [CrossRef]
- Ueda, Y.; Yabe, H.; Maeda, M.; Ohira, T.; Fujii, S.; Niwa, S.I.; Ohtsuru, A.; Mashiko, H.; Harigane, M.; Yasumura, S.; et al. Health Management Survey Group. Drinking behavior and mental illness among evacuees in Fukushima following the Great East Japan: The Fukushima Health Management Survey. Alcohol. Clin. Exp. Res. 2016, 40, 623–630. [Google Scholar] [CrossRef] [PubMed]
- Ueda, Y.; Michio, M.; Maeda, M.; Yabe, H.; Suzuki, Y.; Orui, M.; Yasumura, S.; Ohira, T. Fukushima Health Management Survey Group. Risk factors for problem drinking among evacuees in Fukushima following the Great East Japan Earthquake: The Fukushima Health Management Survey. Tohoku J. Exp. Med. 2019, 248, 239–252. [Google Scholar] [CrossRef] [PubMed]
- Boscarino, J.A.; Kirchner, H.L.; Hoffman, S.N.; Sartorius, J.; Adams, R.E. PTSD and alcohol use after the World Trade Center attacks: A longitudinal study. J. Trauma. Stress 2019, 24, 515–525. [Google Scholar] [CrossRef] [PubMed]
- Yasumura, S.; Hosoya, M.; Yamashita, S.; Kamiya, K.; Abe, M.; Akashi, M.; Kodama, K.; Ozasa, K. Study protocol for the Fukushima Health Management Survey. J. Epidemiol. 2012, 22, 375–383. [Google Scholar] [CrossRef]
- Yabe, H.; Suzuki, Y.; Mashiko, H.; Nakayama, Y.; Hisata, M.; Niwa, S.; Yasumura, S.; Yamashita, S.; Kamiya, K.; Abe, M. Mental Health Group of the Fukushima Health Management Survey. Psychological distress after the great east Japan earthquake and Fukushima Daiichi nuclear power plant accident: Results of a mental and lifestyle survey through the Fukushima Health Management Survey in FY 2011 and FY 2012. Fukushima J. Med. Sci. 2014, 60, 57–67. [Google Scholar] [PubMed]
- Ministry of Health, Labour and Welfare (2019) Alcohol. Available online: https://www.mhlw.go.jp/www1/topics/kenko21_11/b5.html (accessed on 19 May 2022). (In Japanese)
- Castells, M.A.; Furlanetto, L.M. Validity of the CAGE questionnaire for screening alcohol dependent inpatients on hospital wards. Rev. Bras. Psiquiatr. 2004, 27, 54–57. [Google Scholar] [CrossRef]
- Ewing, J.A. Detecting alcoholism. The CAGE questionnaire. JAMA 1984, 252, 1905–1907. [Google Scholar] [CrossRef]
- Boscarino, J.A.; Adams, R.E.; Galea, S. Alcohol use in New York after the terrorist attacks: A study of the effects of psychological trauma on drinking behavior. Addict. Behav. 2006, 31, 606–621. [Google Scholar] [CrossRef]
- Gray, J.; Kim, J.; Ciesla, J.; Yao, P. Rasch analysis of the Lubben Social Network Scale-6 (LSNS-6). J. Appl. Gerontol. 2016, 35, 508–528. [Google Scholar] [CrossRef]
- Lubben, J.; Blozik, E.; Gillmann, G.; Iliffe, S.; von Renteln Kruse, W.; Beck, J.C.; Stuck, A.E. Performance of an Abbreviated version of the Lubben Social Network Scale among three European community-dwelling older adult populations. Gerontologist 2006, 46, 503–513. [Google Scholar] [CrossRef]
- Nordløkken, A.; Pape, H.; Heir, T. Alcohol consumption in the aftermath of a natural disaster: A longitudinal study. Public Health 2016, 132, 33–39. [Google Scholar] [CrossRef] [PubMed]
- Lavie, P. Sleep disturbances in the wake of traumatic events. N. Engl. J. Med. 2001, 345, 1825–1832. [Google Scholar] [CrossRef] [PubMed]
- Kessler, R.C.; Barker, P.R.; Colpe, L.J.; Epstein, J.F.; Gfroerer, J.C.; Hiripi, E.; Howes, M.J.; Normand, S.L.; Manderscheid, R.W.; Walters, E.E.; et al. Screening for serious mental illness in the general population. Arch. Gen. Psych. 2003, 60, 184–189. [Google Scholar] [CrossRef] [PubMed]
- Kessler, R.C.; Galea, S.; Jones, R.T.; Parker, H. A Mental illness and suicidality after Hurricane Katrina. Bull. World Health Org. 2006, 84, 930–939. [Google Scholar] [CrossRef] [PubMed]
- Furukawa, T.A.; Kawakami, N.; Saitoh, M.; Ono, Y.; Nakane, Y.; Nakamura, Y.; Tachimori, H.; Iwata, N.; Uda, H.; Nakane, H.; et al. The performance of the Japanese version of the K6 and K10 in the World Mental Health Survey Japan. Int. J. Methods Psychiatr. Res. 2008, 17, 152–158. [Google Scholar] [CrossRef] [PubMed]
- Locke, S.; Maithy-Angela, N.; Friedman, L.; Gargano, L. Change in binge drinking behavior after Hurricane Sandy among persons exposed to the 9/11 World Trade Center disaster. Prev. Med. Rep. 2020, 19, 101144. [Google Scholar] [CrossRef]
- Blanchard, E.B.; Jones-Alexander, J.; Buckley, T.C.; Forneris, C.A. Psychometric properties of the PTSD Checklist (PCL). Behav. Res. 1996, 34, 669–673. [Google Scholar] [CrossRef]
- Iwase, H.; Suzuki, Y.; Shiga, T.; Maeda, M.; Yabe, H.; Yasumura, S.; Mental Health Group of the Fukushima Health Management Survey. Psychometric evaluation of the Japanese version of the posttraumatic stress disorder checklist in community dwellers following the Fukushima Daiichi Nuclear Power Plant Incident: The Fukushima Health Management Survey. SAGE Open 2016, 6, 1–11. [Google Scholar] [CrossRef]
- Suzuki, Y.; Yabe, H.; Horikoshi, N.; Yasumura, S.; Kawakami, N.; Ohtsuru, A.; Mashiko, H.; Maeda, M.; Mental Health Group of the Fukushima Health Management Survey. Diagnostic accuracy of Japanese posttraumatic stress measures after a complex disaster: The Fukushima Health Management Survey. Asia-Pac. Psychiatry 2017, 9, e12248. [Google Scholar] [CrossRef]
- Pfefferbaum, B.; Doughty, D.E. Increased alcohol use in a treatment sample of Oklahoma City bombing victims. Psychiatry 2001, 64, 296–303. [Google Scholar] [CrossRef]
- Vlahov, D.; Galea, S.; Resnick, H.; Ahern, J.; Boscarino, J.A.; Bucuvalas, M.; Gold, J.; Kilpatrick, D. Increased use of cigarettes, alcohol, and marijuana among Manhattan, New York, residents after the September 11th terrorist attacks. Am. J. Epidemiol. 2002, 155, 988–996. [Google Scholar] [CrossRef] [PubMed]
- Nordløkken, A.; Pape, H.; Wentzel-Larsen, T.; Heir, T. Changes in alcohol consumption after a natural disaster: A study of Norwegian survivors after the 2004 Southeast Asia tsunami. BMC Public Health 2013, 13, 58. [Google Scholar] [CrossRef] [PubMed]
- Brower, K.J.; Alderich, M.S.; Robinson, E.A.R.; Zucker, R.; Greden, J.F. Insomnia, self-medication, and relapse to alcoholism. Am. J. Psychiatry 2001, 158, 399–404. [Google Scholar] [CrossRef] [PubMed]
- Zhabenko, N.; Wonjnar, M.; Brower, K.J. Prevalence and corelates of insomnia in a Polish sample of alcohol-dependent patients. Alcohol. Clin. Exp. Res. 2012, 36, 1600–1607. [Google Scholar] [CrossRef] [PubMed]
- Burger, J.; Gochfeld, M.; Lacy, C. Ethnic differences in risk: Experience, medical needs, and access to care after Hurricane Sandy in New Jersey. Toxicol. Envron. Health A 2019, 82, 128–141. [Google Scholar] [CrossRef]
- Orui, M.; Fukasawa, M.; Horikoshi, N.; Suzuki, Y.; Kawakami, N. Development and evaluation of a gatekeeper training program regarding anxiety about radiation health effects following a nuclear power plant accident: A Single-Arm intervention pilot trail. Int. J. Env. Res. Public Health 2020, 17, 4594. [Google Scholar] [CrossRef]
- North, C.S.; Ringwalt, C.L.; Downs, D.; Derzon, J.; Galvin, D. Postdisaster course of alcohol use disorders in systematically studied survivors of 10 disasters. Arch. Gen. Psychiatry 2011, 68, 173–180. [Google Scholar] [CrossRef]


Disclaimer/Publisher’s Note: The statements, opinions and data contained in all publications are solely those of the individual author(s) and contributor(s) and not of MDPI and/or the editor(s). MDPI and/or the editor(s) disclaim responsibility for any injury to people or property resulting from any ideas, methods, instructions or products referred to in the content. |
© 2022 by the authors. Licensee MDPI, Basel, Switzerland. This article is an open access article distributed under the terms and conditions of the Creative Commons Attribution (CC BY) license (https://creativecommons.org/licenses/by/4.0/).