
Multi-Risk Assessment of Mine Lithium Battery Fire Based on Quantitative Factor Characterization


Abstract
:1. Introduction
2. Materials and Methods
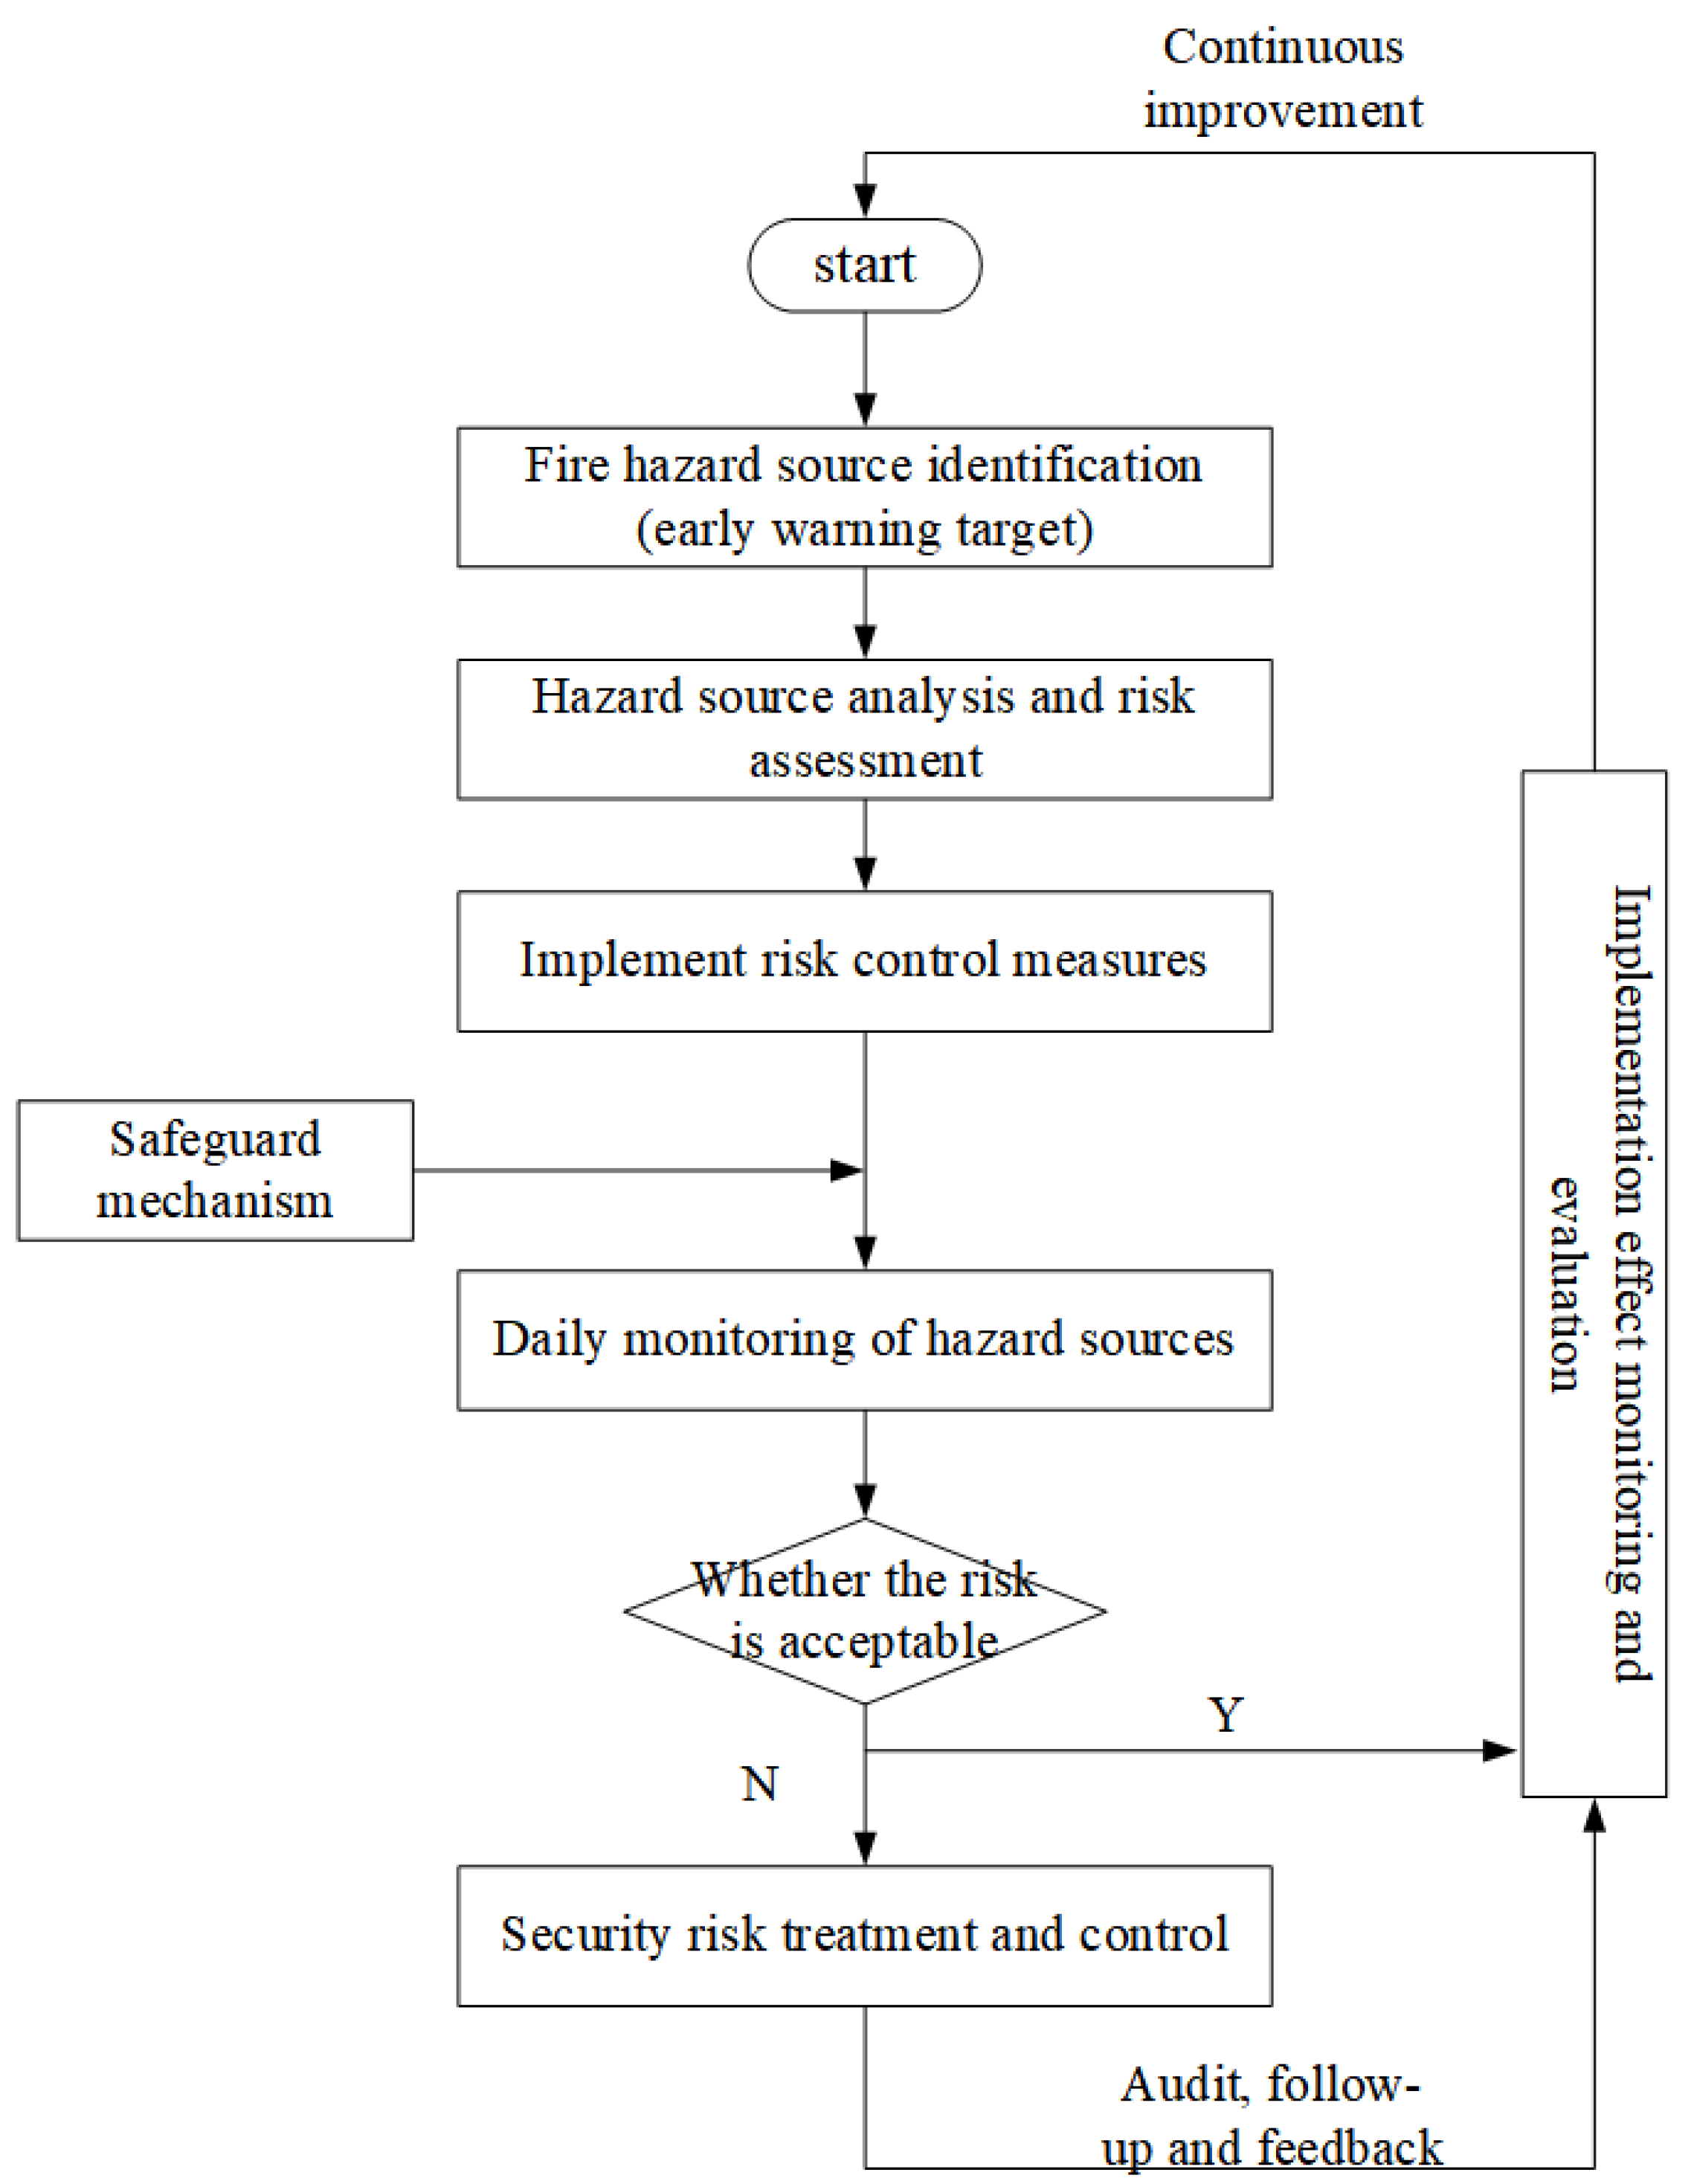
2.1. Risk Management Process
- (1)
- Risk identification
- (2)
- Risk assessment [20]
- (3)
- Risk response
2.2. Identification Method of Fire Risk
2.3. Quantification of Risk Indicators
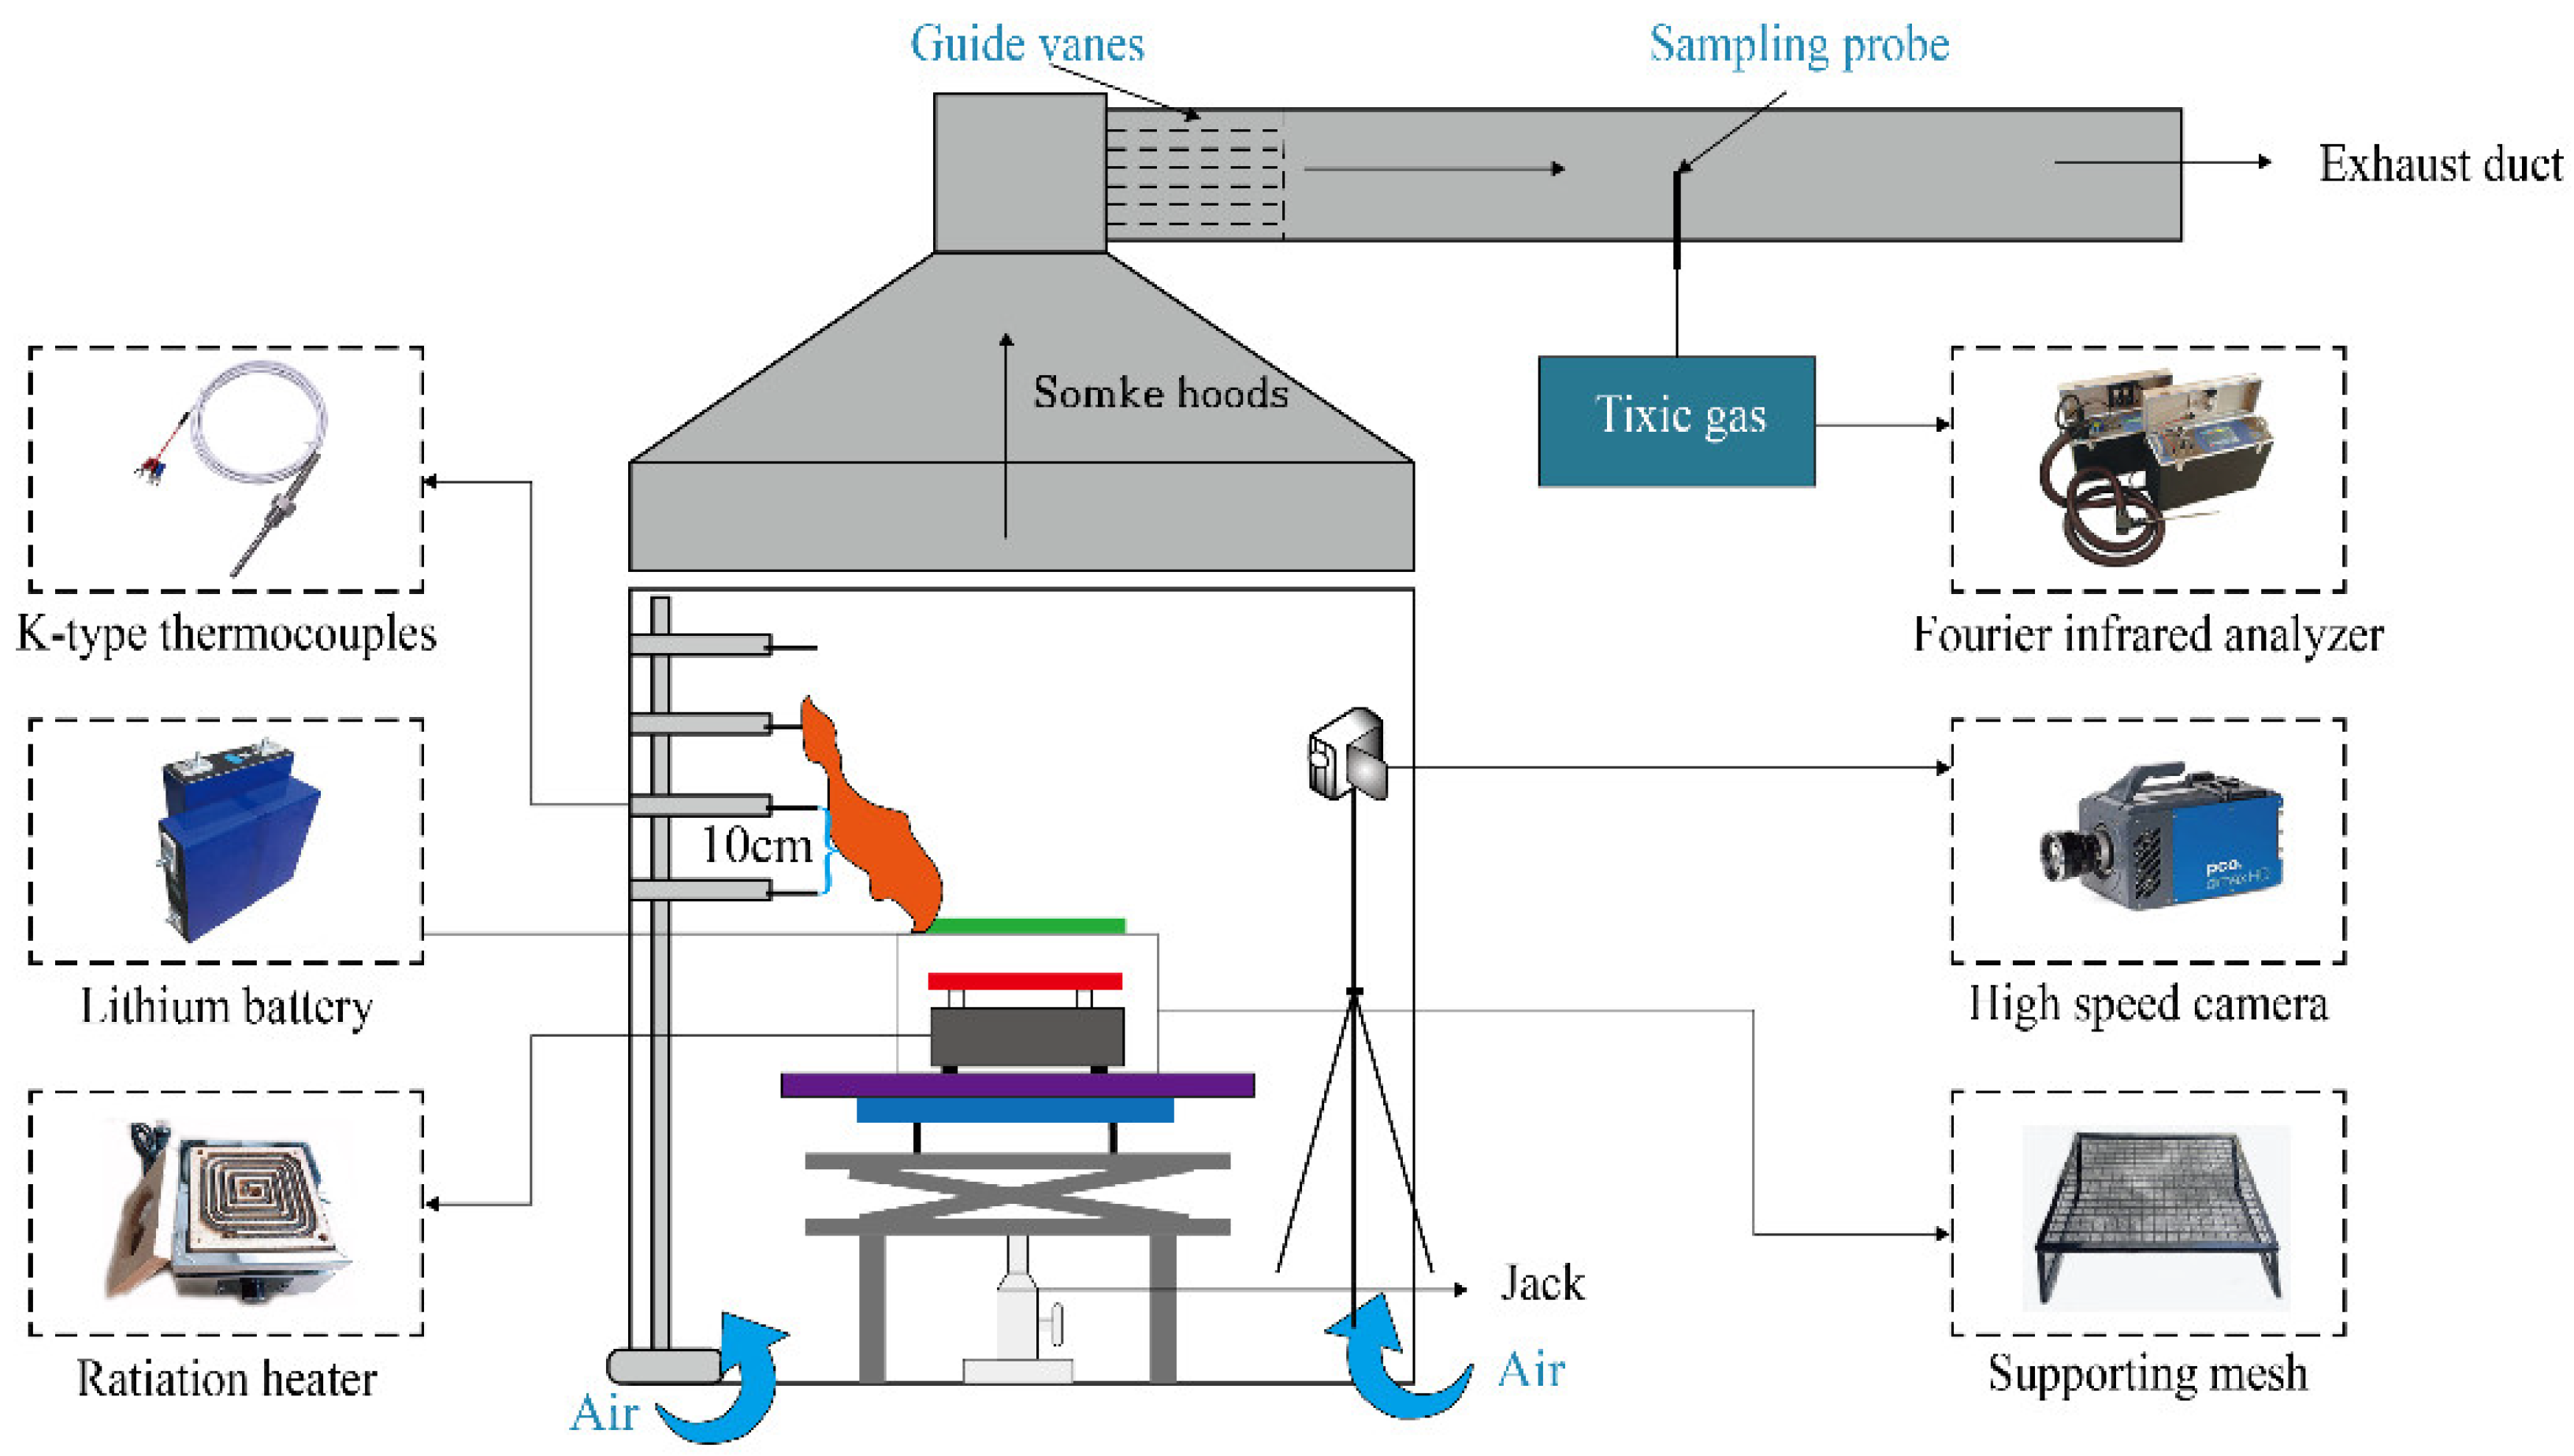
2.3.1. Experiment Setup
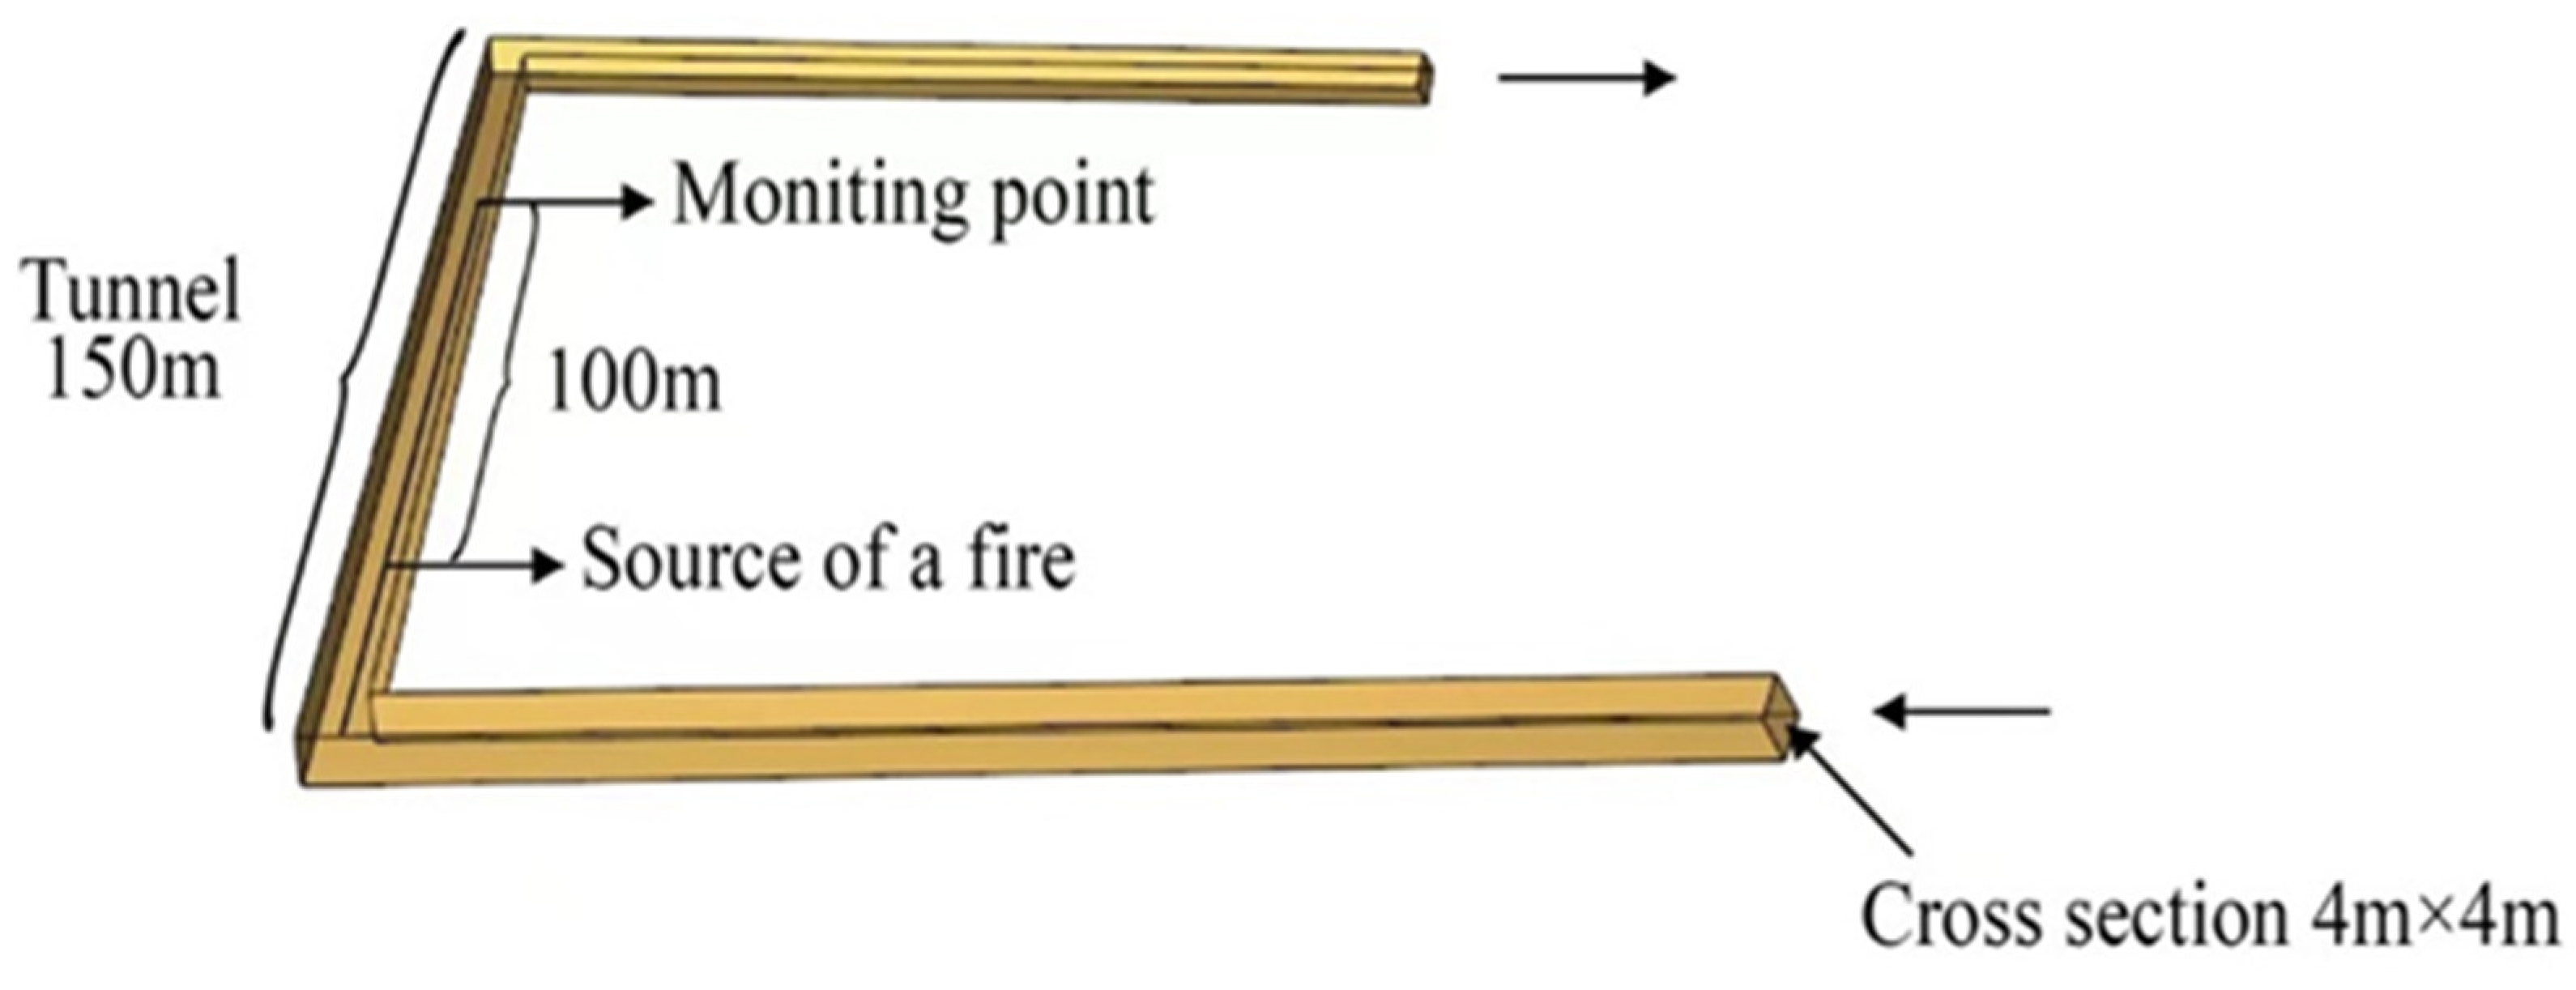
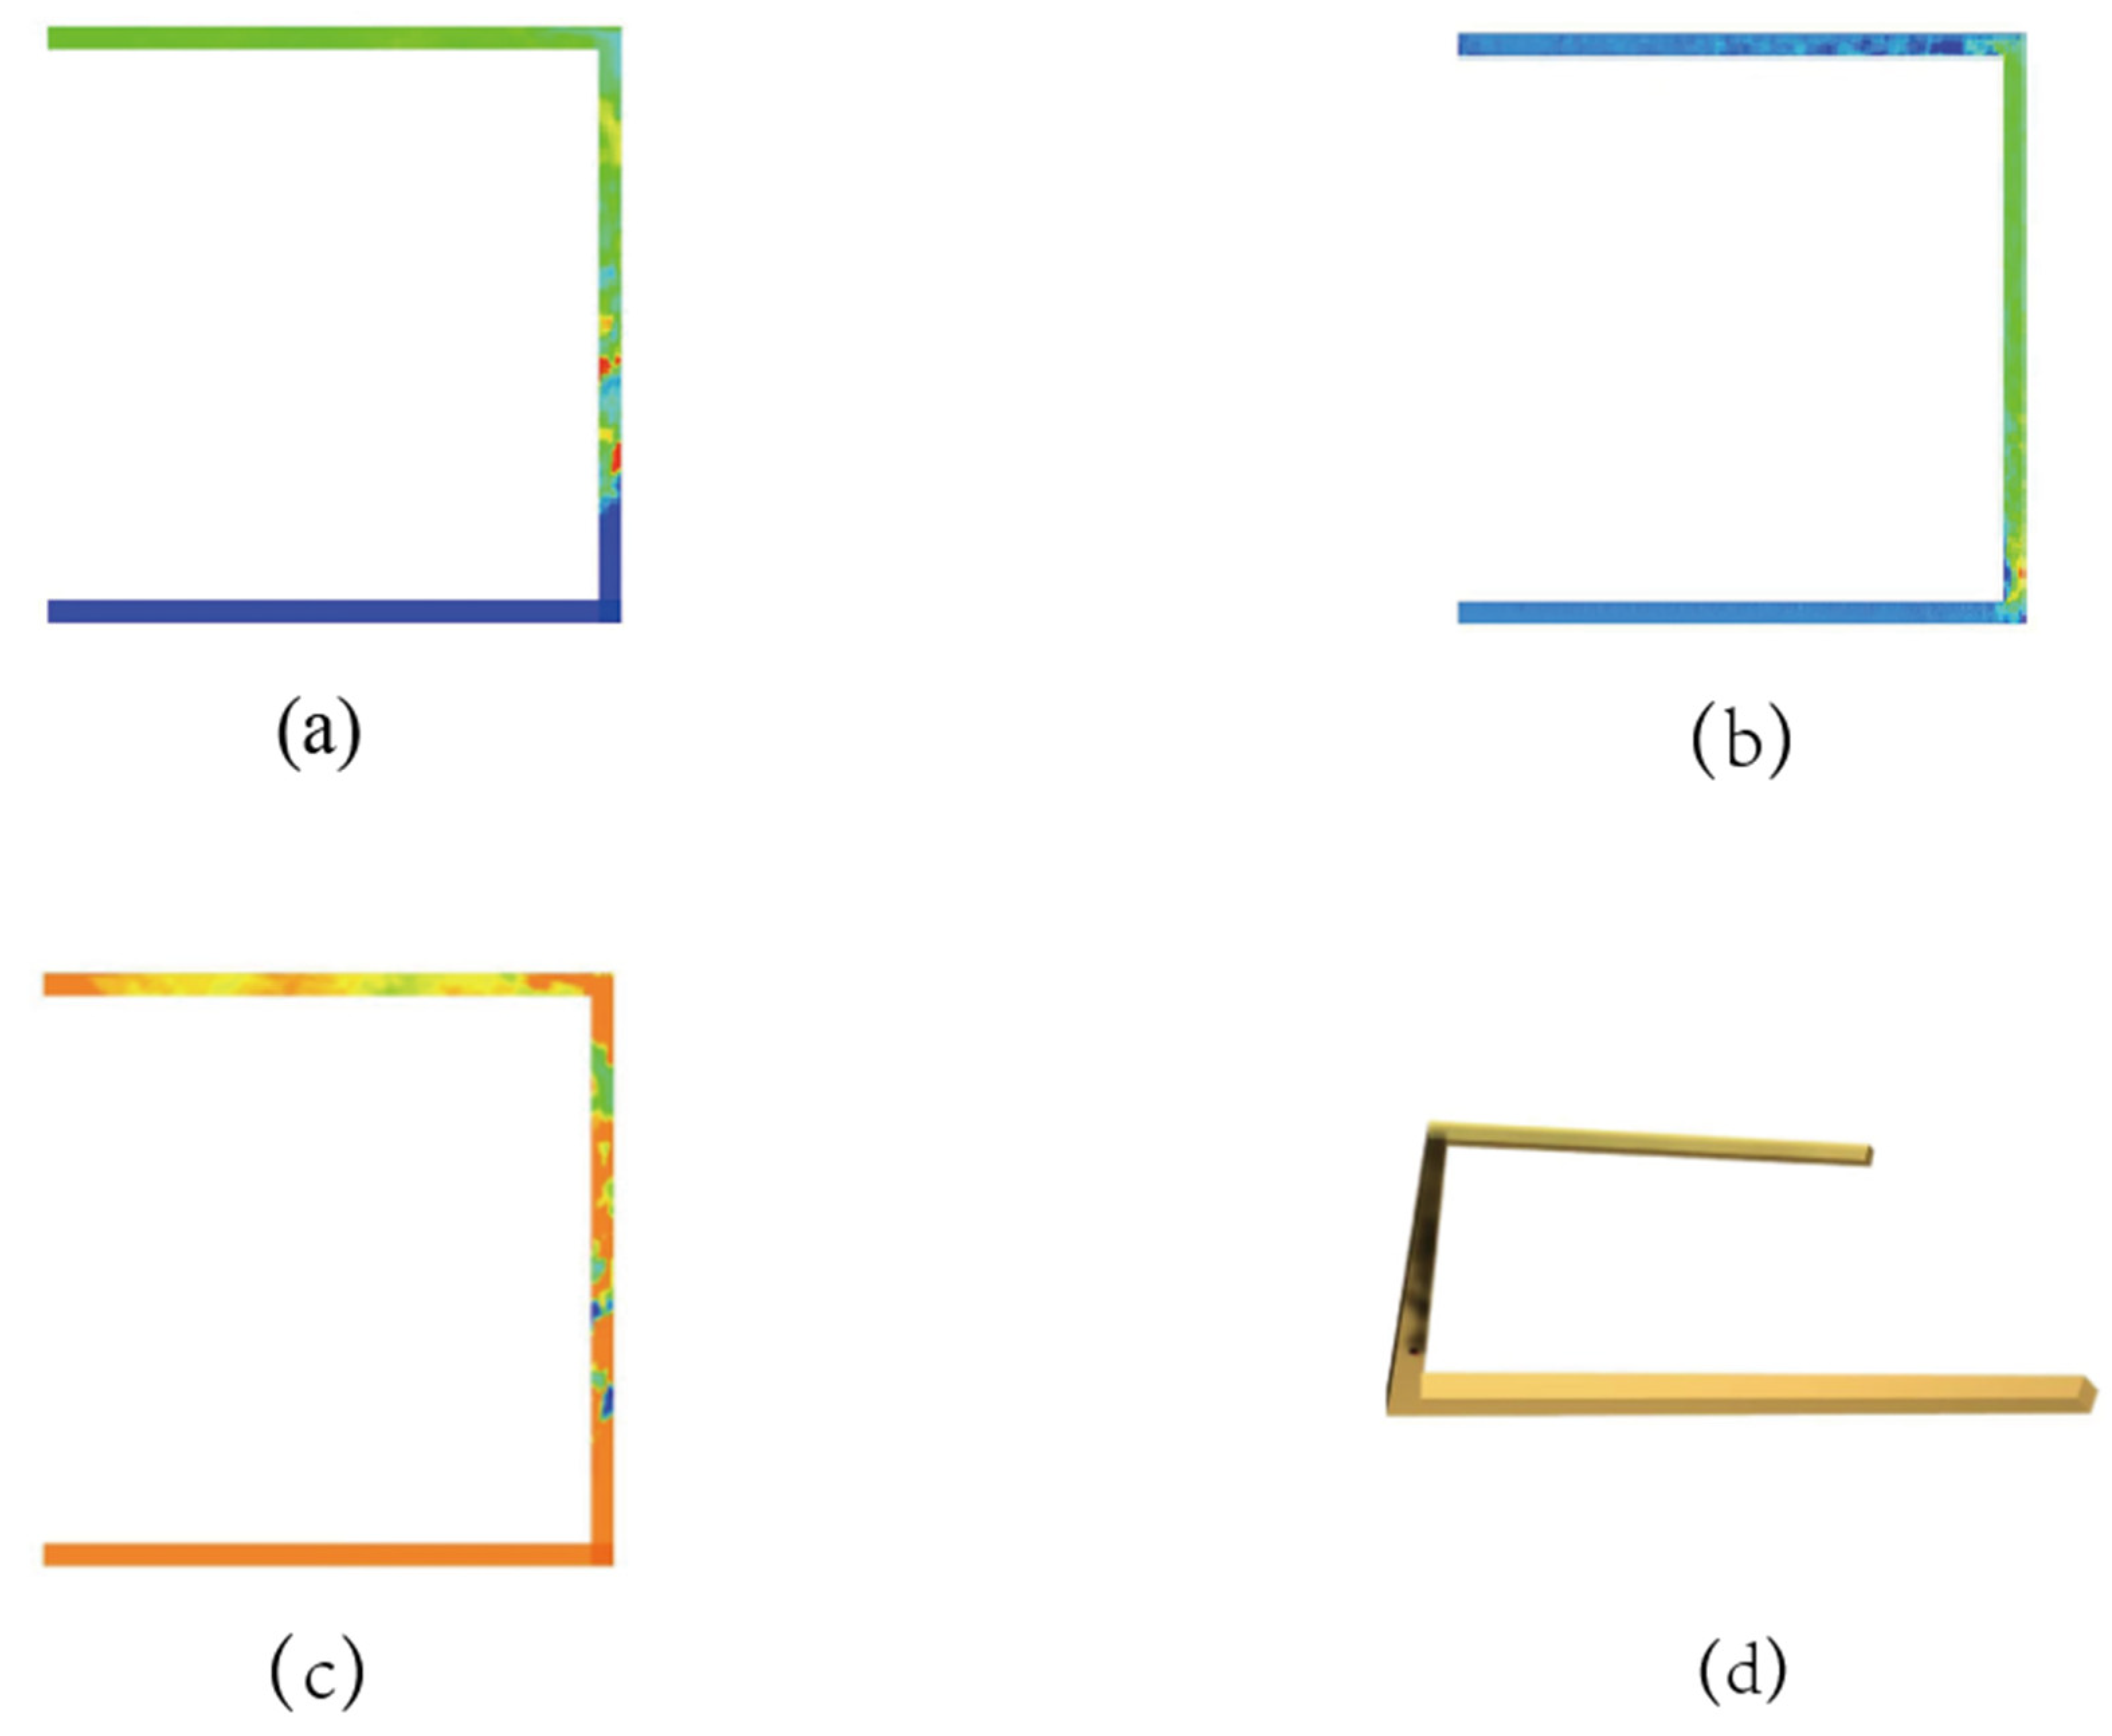
2.3.2. Simulation Model
3. Risk Assessment Model
3.1. Risk Factor Contribution Calculation
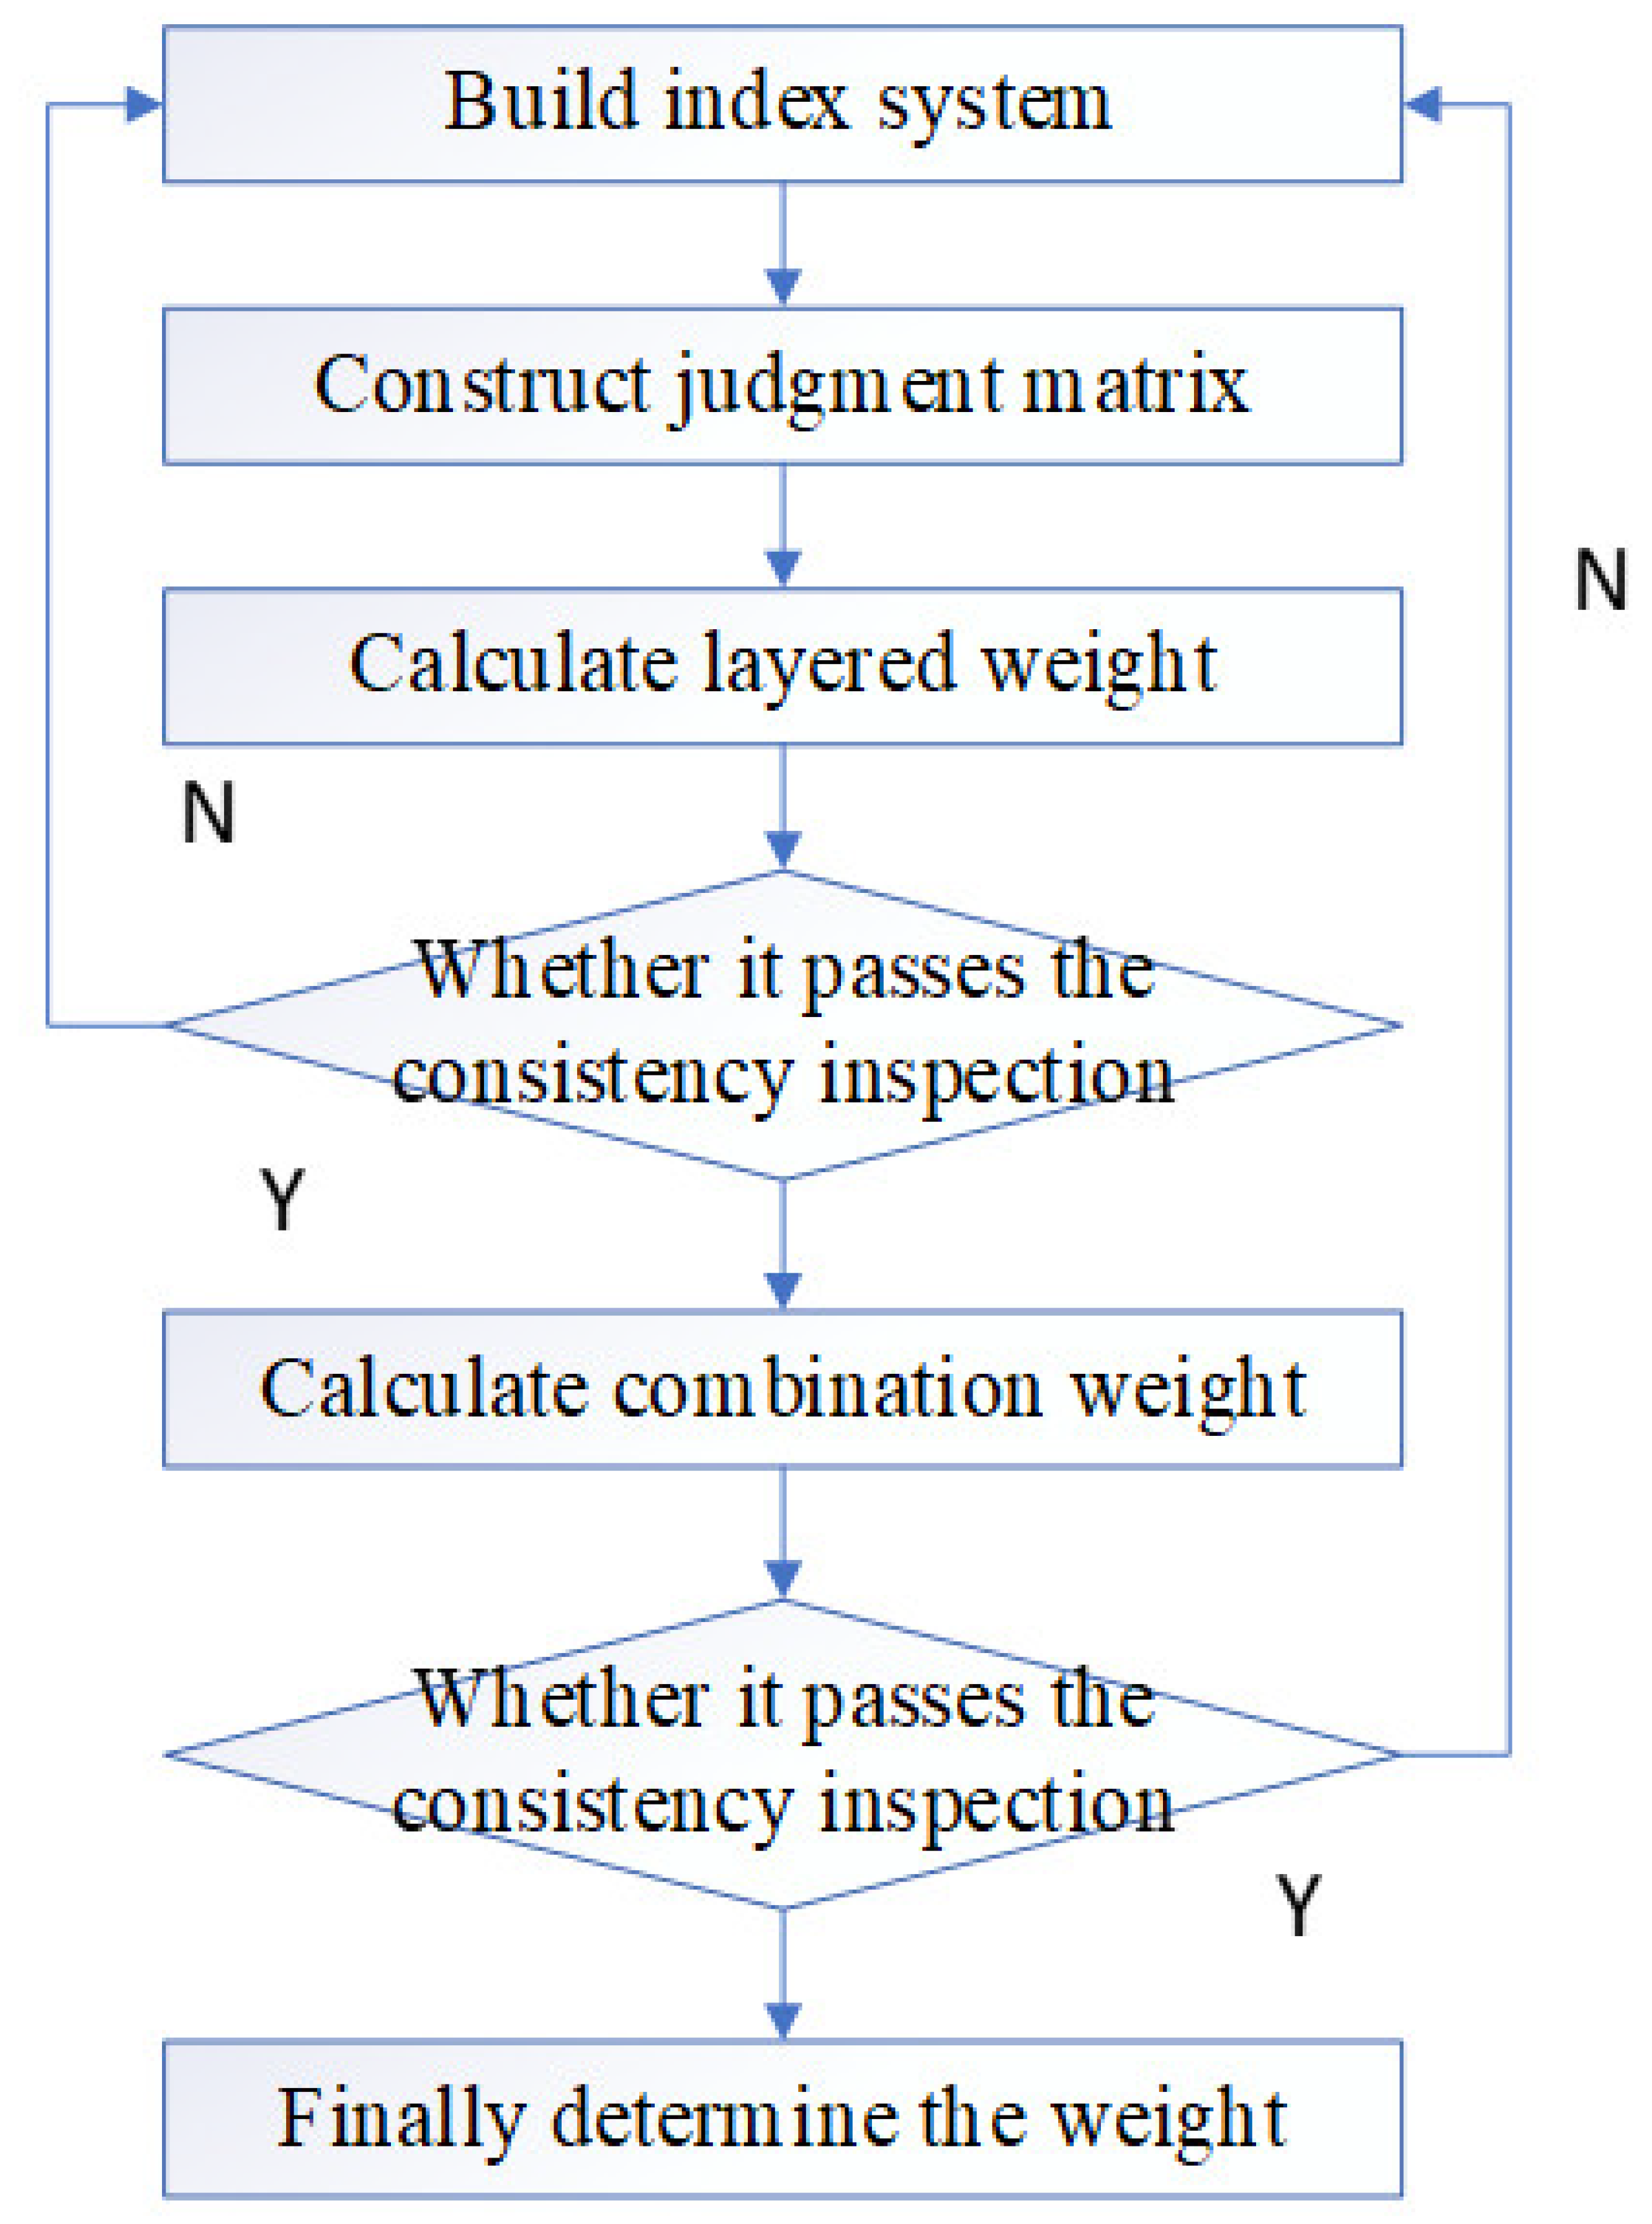
3.2. FAHP Model
- (1)
- Analyzed the relationship between the risk factors, divided the risk factors into different levels, and finally built the risk evaluation index system;
- (2)
- The importance of each index at the same level with respect to a criterion at the previous level were compared in pairs, and the pairwise comparison judgment matrix was constructed;
- (3)
- According to the judgment matrix, calculated the relative weight of each index to the index of the first level;
- (4)
- Ranked the risk weights and conducted a consistency test to eliminate the impact of logical errors on the evaluation results;
- (5)
- Determined the impact path and degree of each risk factor on the evaluation results;
- (6)
- Invited a certain number of experts to judge the impact of various risk factors on the evaluation results. Then, the evaluation judgment matrix was constructed;
- (7)
- The final evaluation value was obtained by comprehensive evaluation judgment matrix and weight set and fuzzy comprehensive calculation.
3.2.1. Calculation Matrixes
- (1)
- Definition of fuzzy matrix
- (2)
- Definition of Fuzzy Complementary Judgment Matrix
- (3)
- Establish weight judgment matrix
3.2.2. Weight Calculation
- (1)
- Step 1: Calculate the product of each line of the judgment matrix ;
- (2)
- Step 2: calculate the value Y of the n-th root of Mi;
- (3)
- Step 3: Normalize the root of the n-th power, is the obtained eigenvector, that is, the weight of the element;
- (4)
- Step 4: Calculate the maximum eigenvalue: λ max.
3.2.3. Consistency Inspection
3.3. FCE Medol
4. Results and Discussion
4.1. Indicators Identification of Mine Battery Fire
4.2. Quantitative Study of Risk Factors
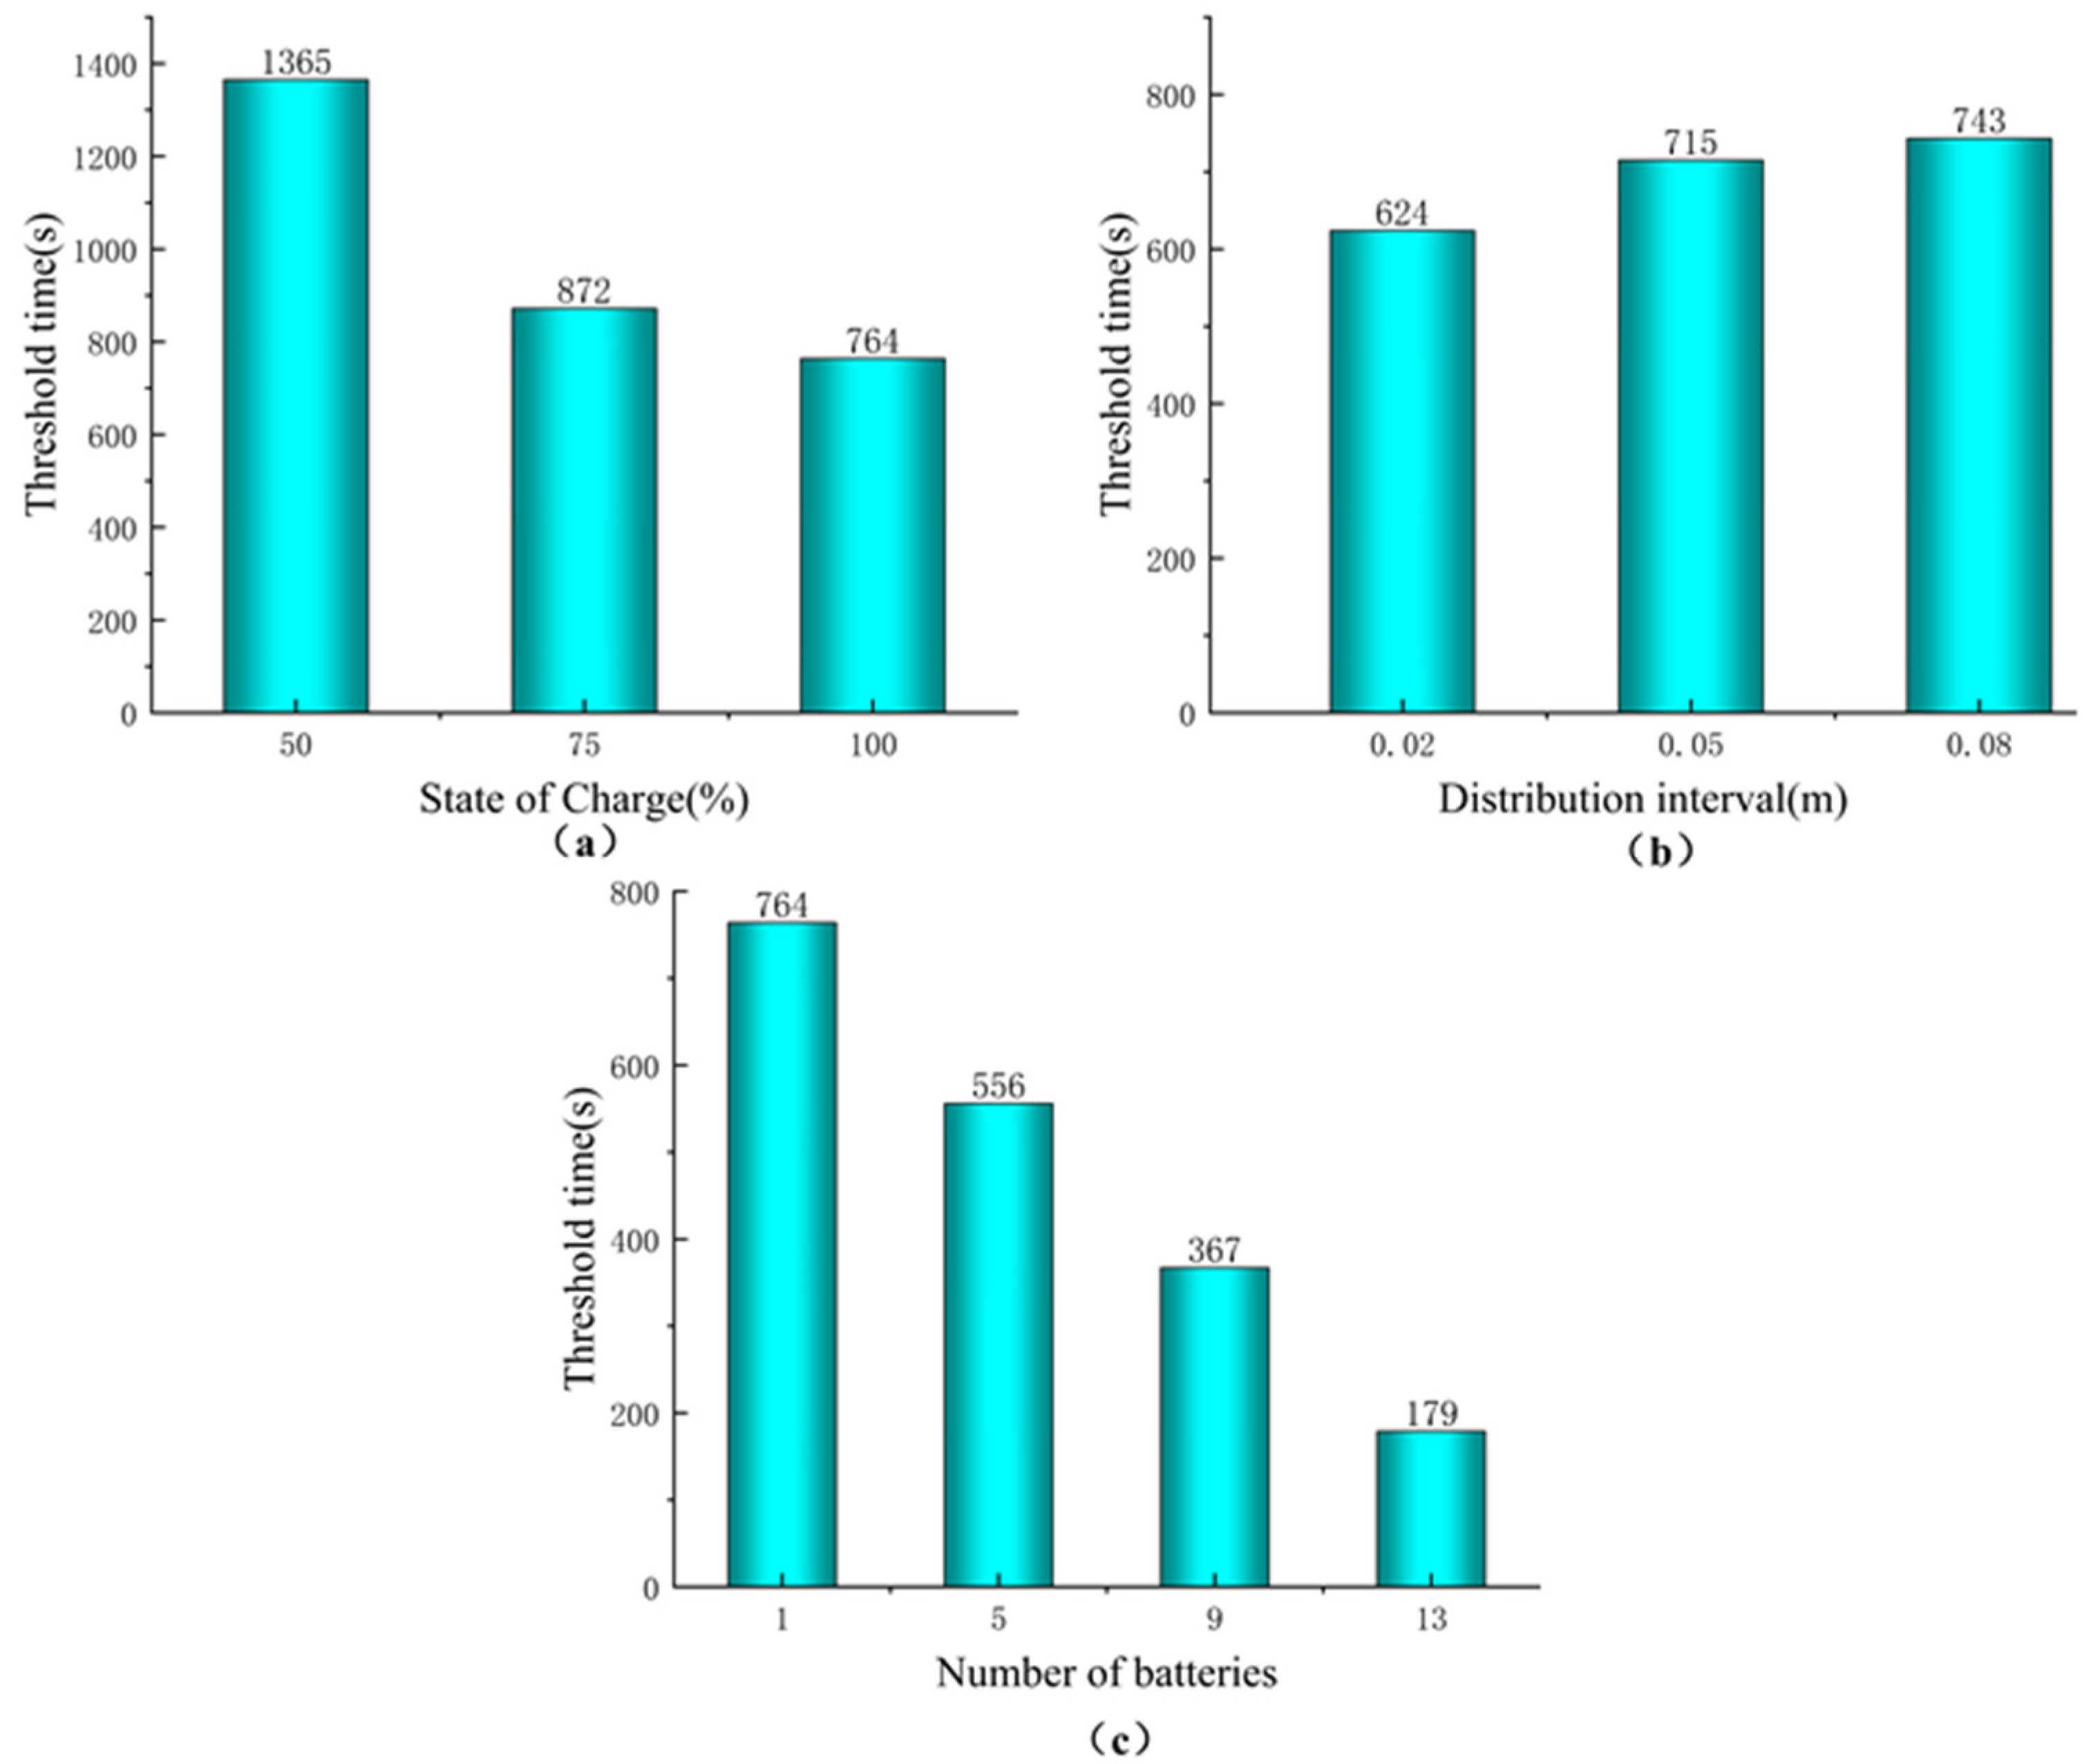
4.2.1. Risk Source Factors of Lithium Battery Fire
4.2.2. Working Environmental Factors
4.3. Quantitative Characterization of Indicators Weight
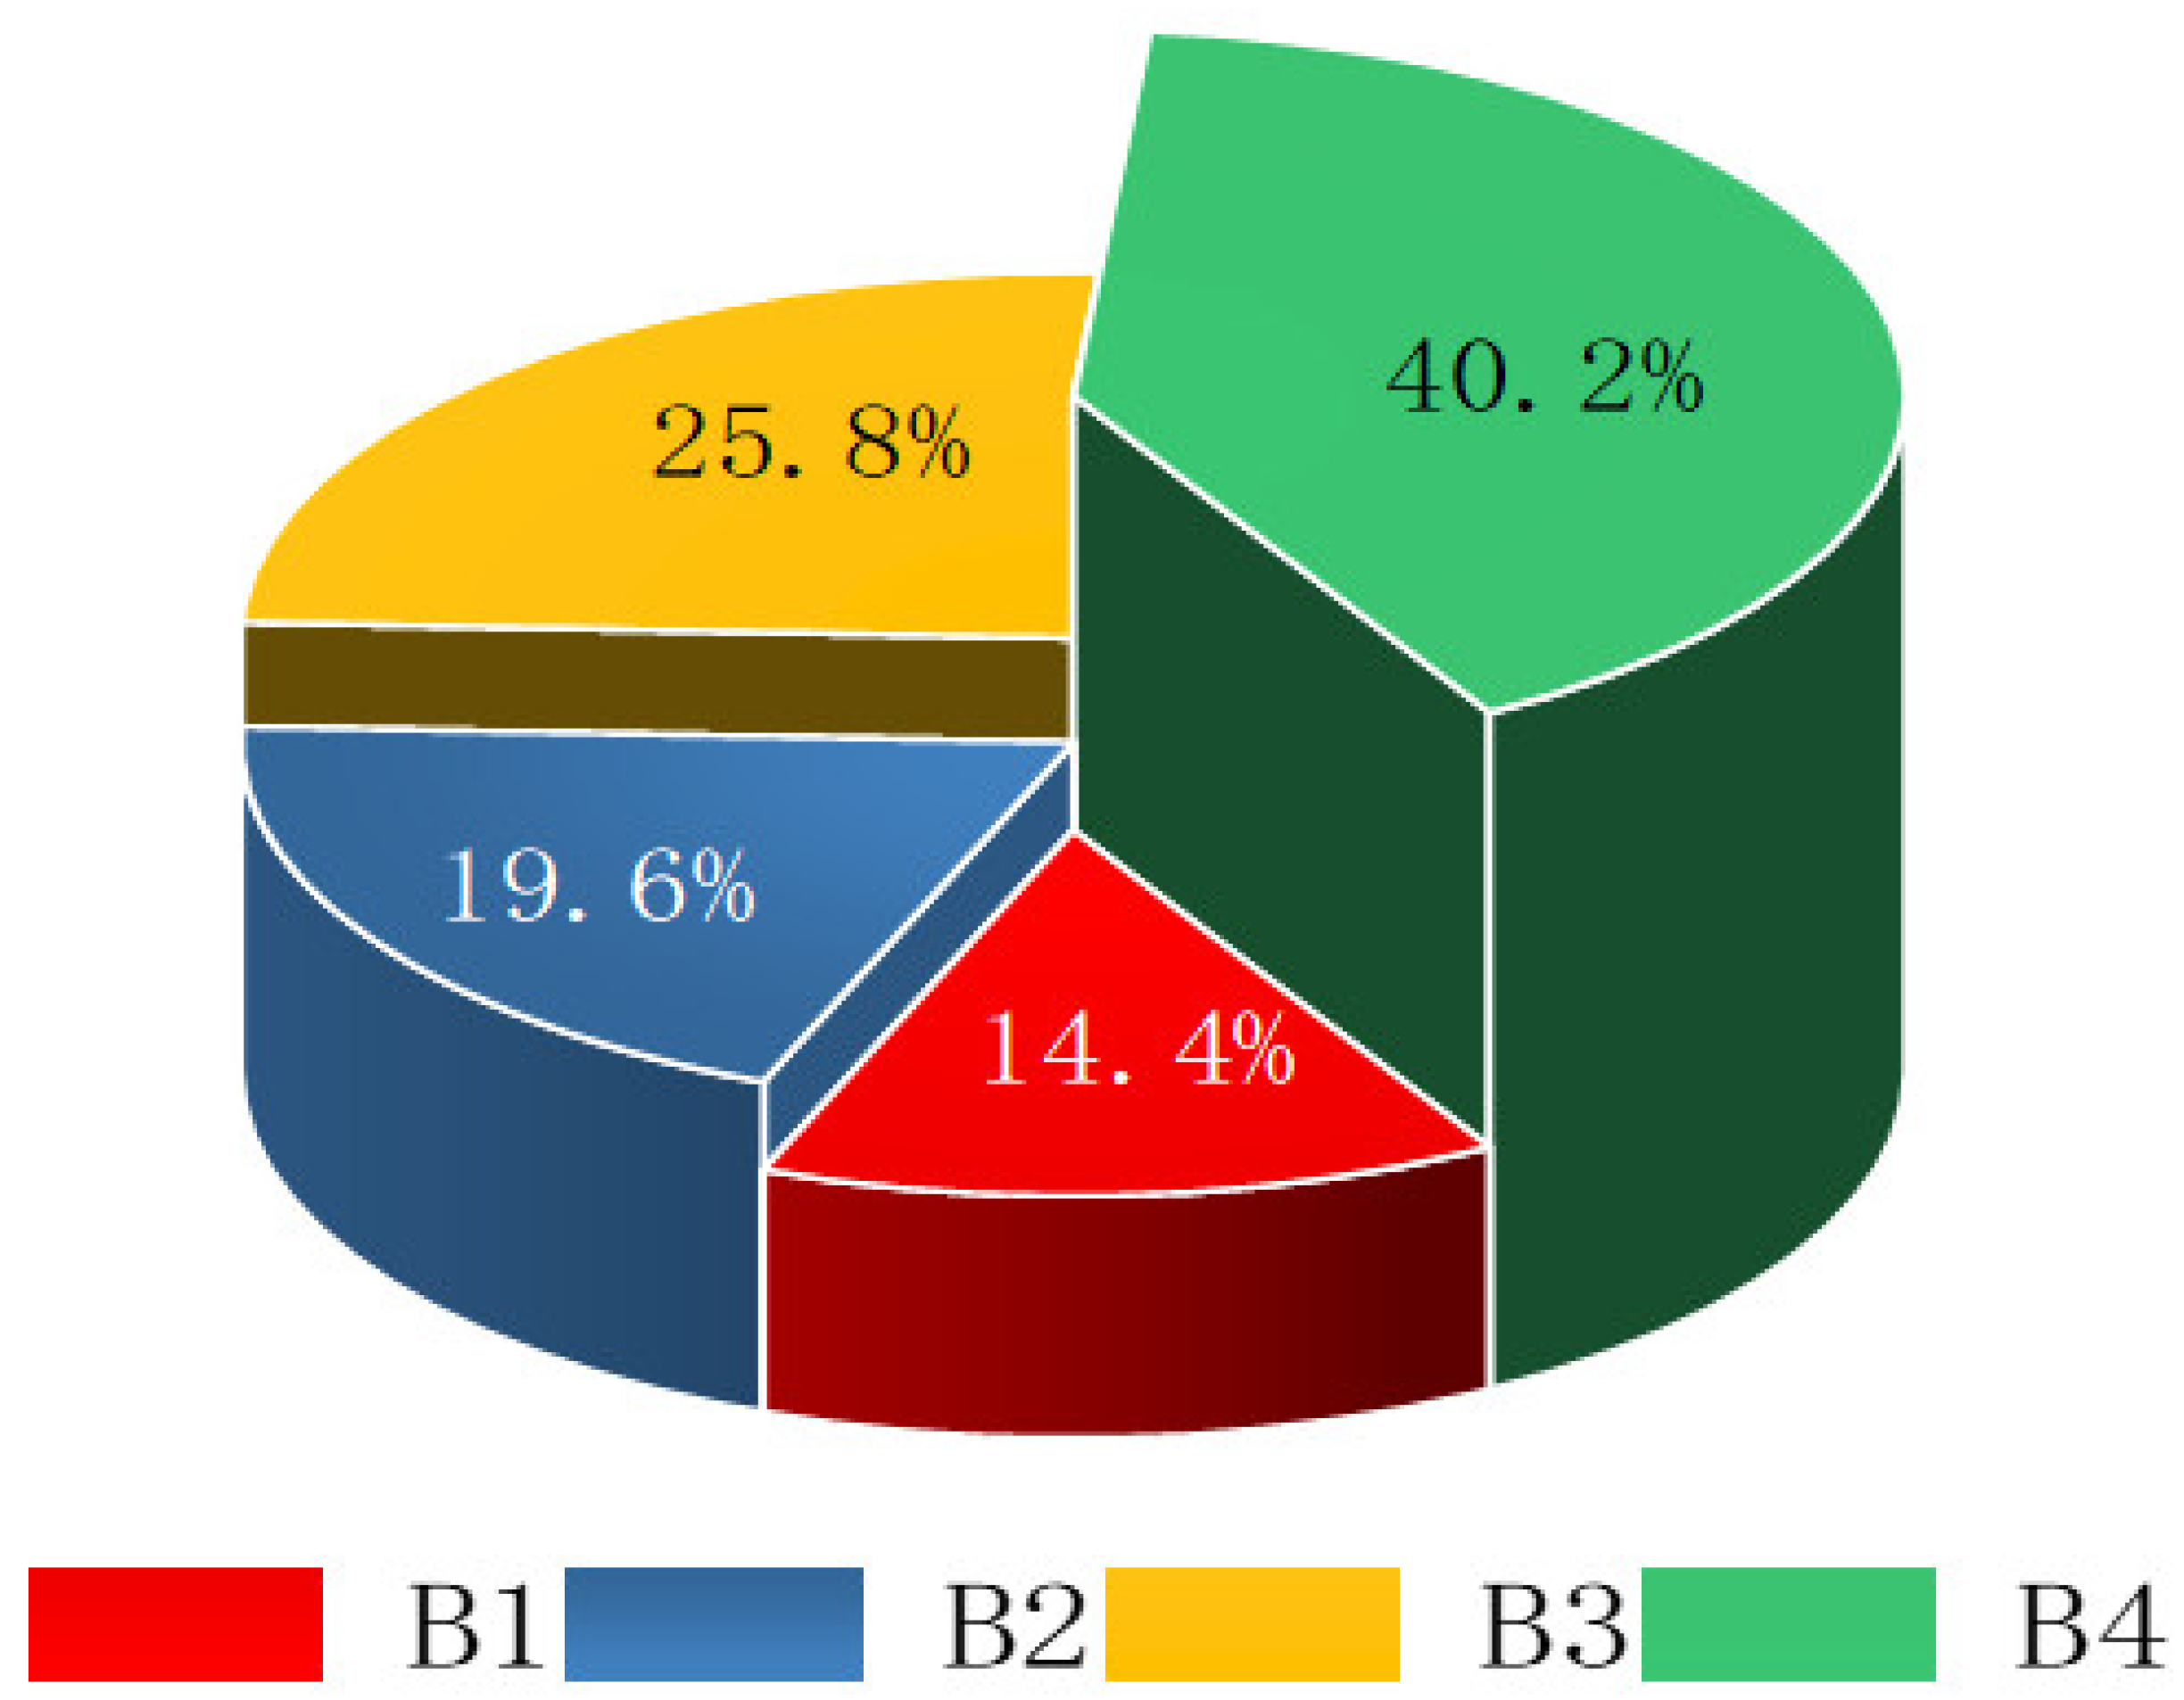
4.3.1. Primary Indicators
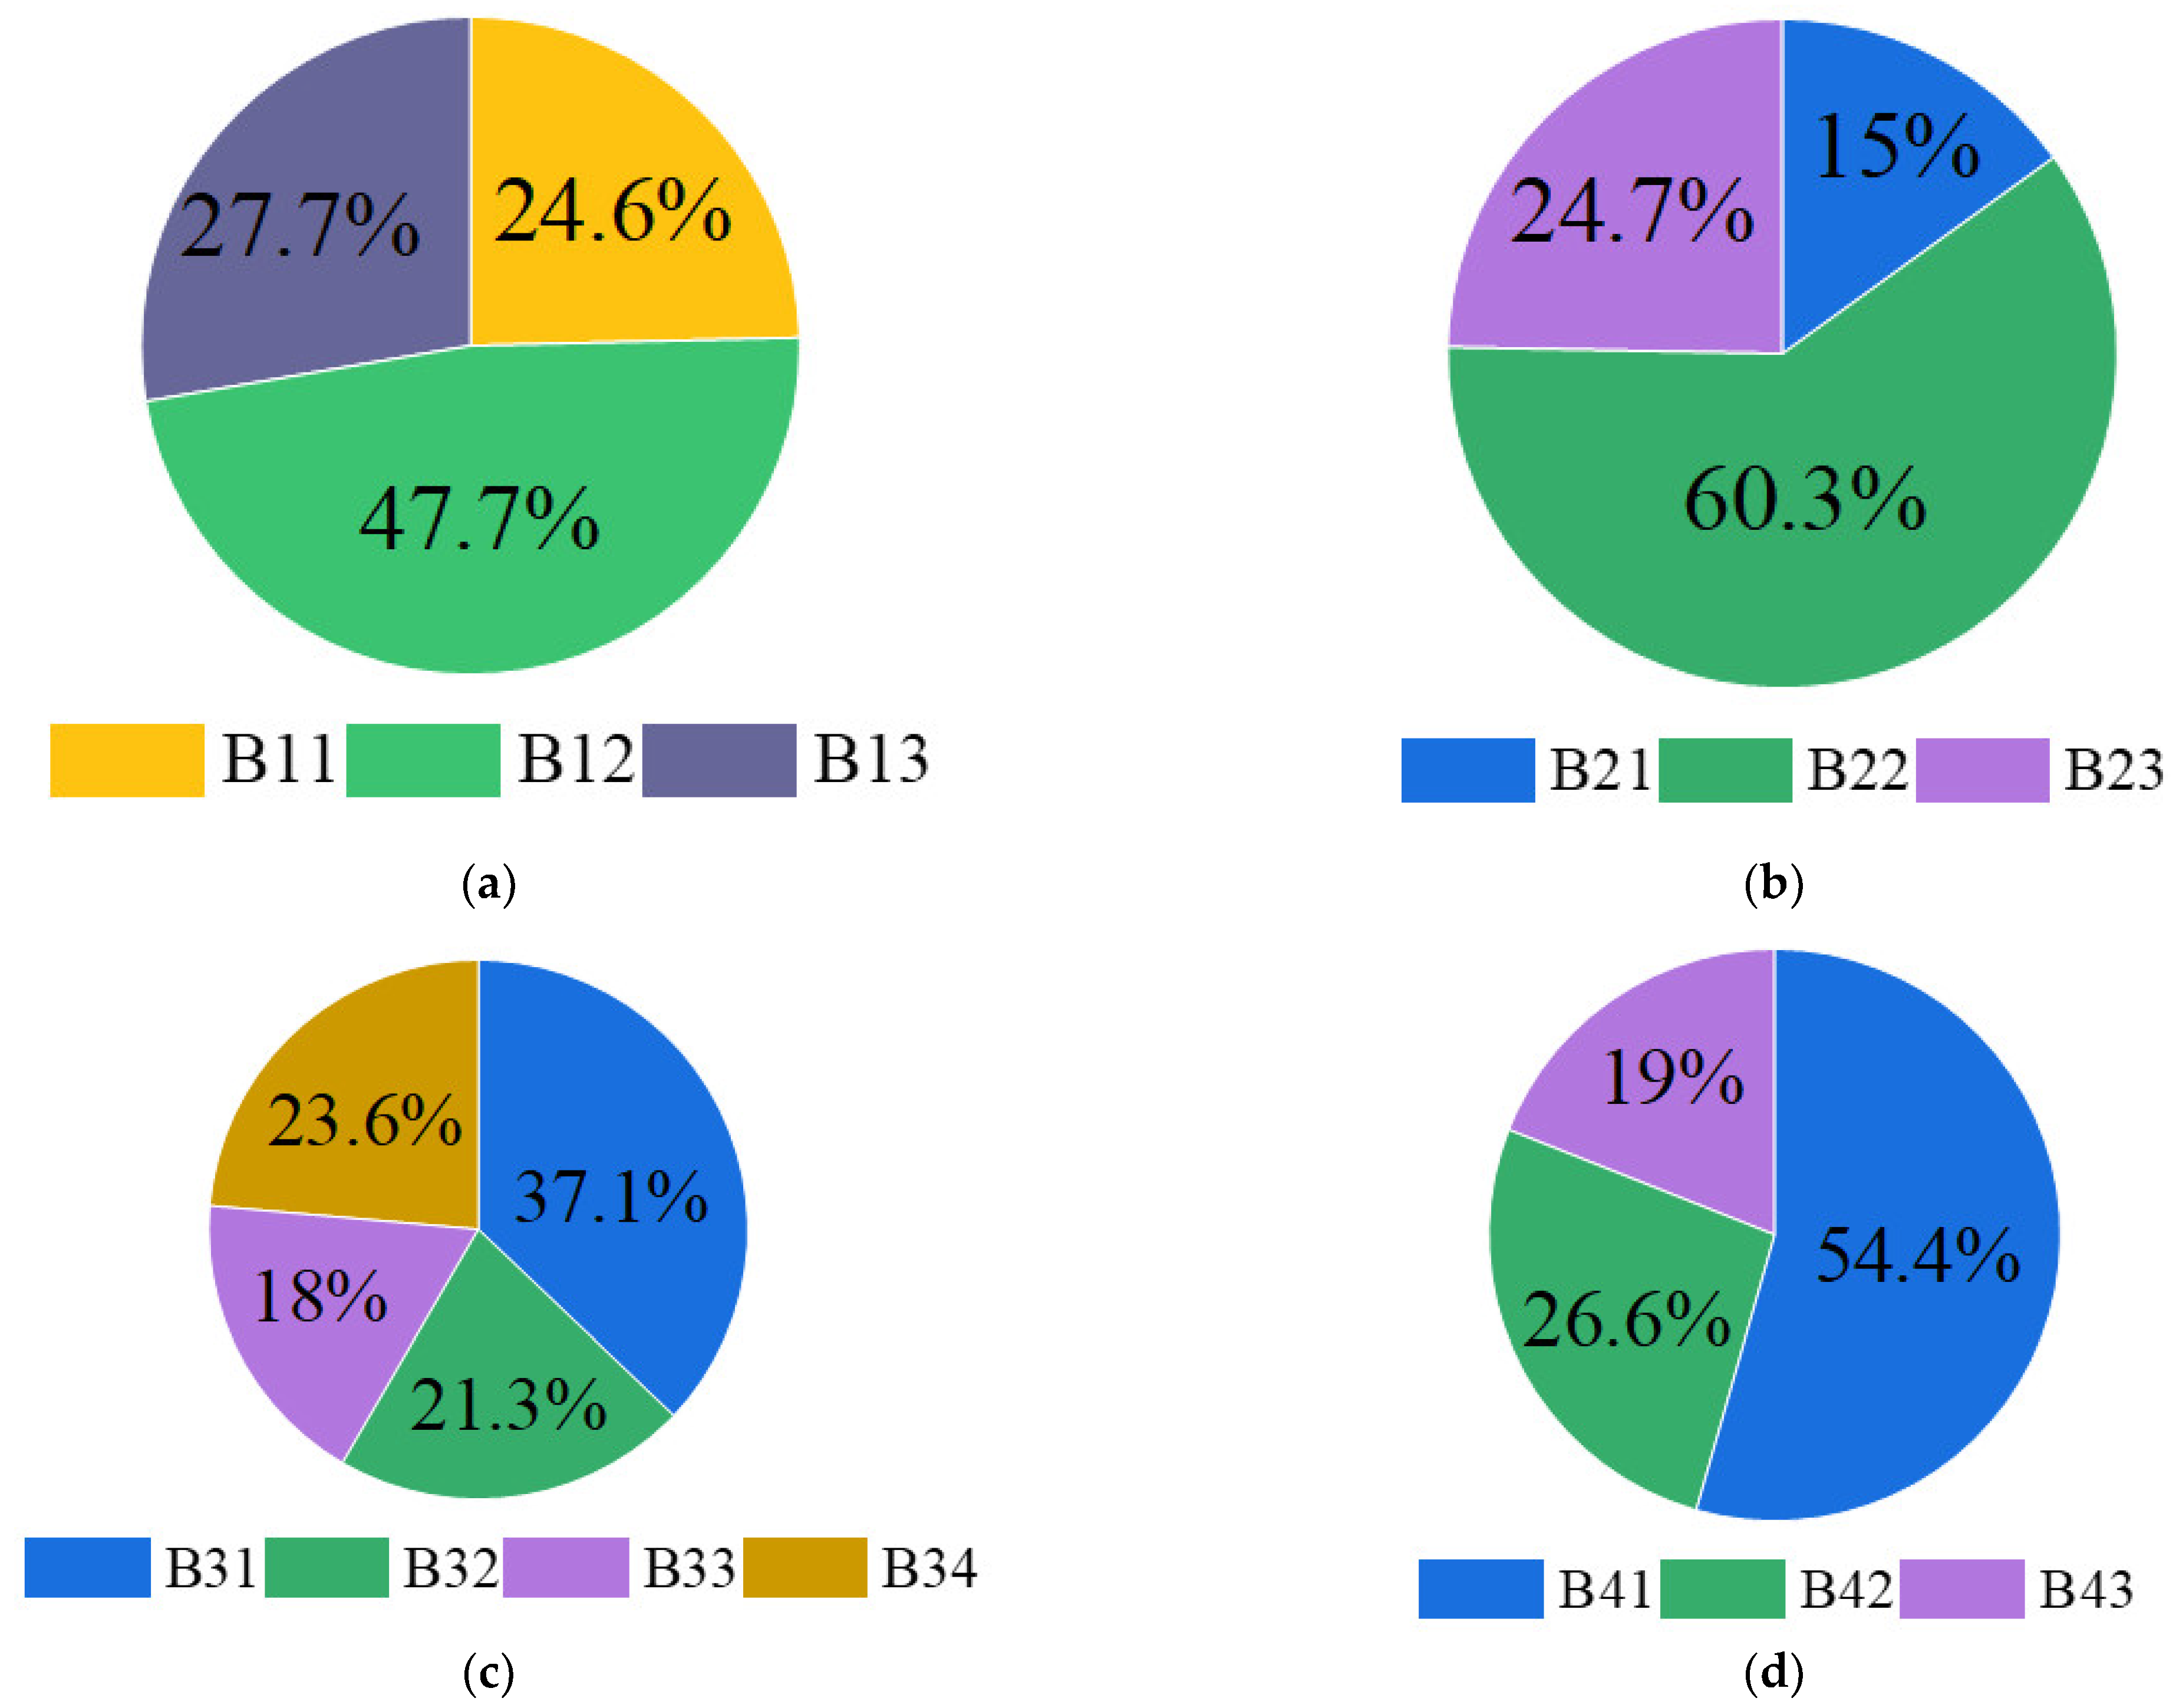
4.3.2. Secondary Indicators
4.4. Risk Evaluation
= 0.237 × 100 + 0.236 × 85+0.272 × 70+0.162 × 55+0.094 × 40
= 75.37
4.5. Fire risk Response
4.5.1. Fire Preventing Measures
4.5.2. Risk Management Implementation
4.5.3. Risk Factor Control
5. Conclusions
Author Contributions
Funding
Institutional Review Board Statement
Informed Consent Statement
Data Availability Statement
Conflicts of Interest
Appendix A
| Risk Indicators (Indicator Level P) | Expert 1 | Expert 2 | Expert 3 | Expert 4 | Expert 5 | Expert 6 | Expert 7 | Expert 8 | Expert 9 | Expert 10 |
| Safety consciousnessB11 | 1 | 2 | 3 | 1 | 2 | 1 | 2 | 1 | 1 | 2 |
| Emergency capacity B12 | 2 | 3 | 3 | 3 | 4 | 3 | 3 | 4 | 3 | 3 |
| Knowledge and skills B13 | 3 | 2 | 1 | 2 | 1 | 2 | 2 | 1 | 2 | 2 |
| State of Charge B21 | 1 | 3 | 3 | 2 | 3 | 1 | 1 | 2 | 2 | 1 |
| Number of batteries B22 | 3 | 3 | 3 | 3 | 5 | 4 | 5 | 5 | 3 | 4 |
| Distribution interval B23 | 2 | 3 | 1 | 2 | 2 | 1 | 2 | 3 | 3 | 3 |
| Reserve capacity B31 | 3 | 3 | 4 | 4 | 2 | 4 | 4 | 2 | 3 | 4 |
| Reducing force B32 | 2 | 1 | 1 | 3 | 2 | 2 | 2 | 2 | 1 | 3 |
| Reactivity B33 | 1 | 2 | 1 | 2 | 2 | 1 | 2 | 1 | 2 | 2 |
| Resilience B34 | 2 | 3 | 2 | 2 | 1 | 2 | 3 | 2 | 3 | 1 |
| Ventilation conditions B41 | 3 | 2 | 3 | 4 | 4 | 3 | 3 | 5 | 3 | 2 |
| Secondary hazard B42 | 2 | 1 | 2 | 3 | 2 | 2 | 2 | 1 | 3 | 1 |
| Geographical conditions B43 | 1 | 1 | 1 | 2 | 1 | 1 | 1 | 3 | 2 | 2 |
| Risk indicators (indicator level B) | Expert 1 | Expert 2 | Expert 3 | Expert 4 | Expert 5 | Expert 6 | Expert 7 | Expert 8 | Expert 9 | Expert 10 |
| Personnel factor B1 | 1 | 2 | 1 | 2 | 1 | 2 | 1 | 2 | 1 | 1 |
| Risk source factor B2 | 1 | 1 | 2 | 3 | 1 | 2 | 2 | 2 | 2 | 3 |
| Crisis management factor B3 | 3 | 2 | 3 | 2 | 3 | 1 | 3 | 4 | 2 | 2 |
| Environmental factor B4 | 4 | 4 | 5 | 5 | 3 | 4 | 3 | 4 | 3 | 4 |
References
- Lecocq, A.; Eshetu, G.G.; Grugeon, S.; Martin, N.; Laruelle, S.; Marlair, G. Scenario-based prediction of Li-ion batteries fire-induced toxicity. J. Power Sources 2016, 316, 197–206. [Google Scholar] [CrossRef]
- Diaz, F.; Wang, Y.; Weyhe, R.; Friedrich, B. Gas generation measurement and evaluation during mechanical processing and thermal treatment of spent Li-ion batteries. Waste Manag. 2019, 84, 102–111. [Google Scholar] [CrossRef] [PubMed]
- Stec, A.A.; Hull, T.R. Assessment of the fire toxicity of building insulation materials. Energy Build. 2011, 43, 498–506. [Google Scholar] [CrossRef]
- Ghiji, M.; Edmonds, S.; Moinuddin, K. A review of experimental and numerical studies of lithium-ion battery fires. Appl. Sci. 2021, 11, 1247. [Google Scholar] [CrossRef]
- Gao, F.; Yang, K.; Li, D.H.; Liu, H.; Su, T.; Wang, L. Evaluation of the combustibility and risk of lithium-ion battery components. China Saf. Sci. J. 2015, 25, 62–67. [Google Scholar]
- Huang, P.F.; Liu, J.L.; Jin, Y.; Fan, Y.L.; Li, K.; Wang, Q.S. Analysis of lithium-ion battery fire accident tree based on fire triangle model. J. Saf. Environ. 2018, 18, 66–69. [Google Scholar]
- Wang, W.H.; He, T.F.; Mi, H.F.; Qin, Y.; Gong, Y.; Wang, Q. Combustion characteristics and fire hazard assessment of 18650 lithium ion battery. J. Saf. Environ. 2019, 19, 729–736. [Google Scholar]
- Zhang, Y.; Bai, W.; Shi, Y.L.; Zhang, Q.S.; Luo, X.N. Safety evaluation method of lithium battery based on thermal runaway risk index. J. Beijing Univ. Aeronaut. Astronaut. 2021, 47, 912–918. [Google Scholar]
- Nigl, T.; Baldauf, M.; Hohenberger, M.; Pomberger, R. Lithium-ion batteries as ignition sources in waste treatment processes—A semi-quantitate risk analysis and assessment of battery-caused waste fires. Processes 2021, 9, 49. [Google Scholar] [CrossRef]
- Huang, F.; Cao, R.R.; Zhang, W.H. Analysis of lithium battery accident triggering factors and risk level assessment. Sci. Technol. Innov. Appl. 2022, 12, 100–102+107. [Google Scholar]
- Kong, B.; Li, Z.; Yang, Y.; Liu, Z.; Yan, D. A review on the mechanism, risk evaluation, and prevention of coal spontaneous combustion in China. Environ. Sci. Pollut. Res. 2017, 24, 23453–23470. [Google Scholar] [CrossRef]
- Zhang, D.; Cen, X.; Wang, W.; Deng, J.; Wen, H.; Xiao, Y.; Shu, C. The graded warning method of coal spontaneous combustion in Tangjiahui Mine. Fuel 2021, 288, 119635. [Google Scholar] [CrossRef]
- Jia, J.Z.; Xiao, L. Analysis of exogenous fire hazards in coal mines based on fuzzy integrated evaluation-set-value statistical method. J. Saf. Environ. 2015, 15, 11–14. [Google Scholar]
- Du, Z.Y.; Yang, S.Q.; Wang, J.; Li, J.N. Mine fire safety evaluation method based on topologizable superiority method. Min. Saf. Environ. Prot. 2013, 40, 107–111. [Google Scholar]
- Sun, Y.; Peng, C.; Zhang, R.W.; Liu, X.; Wang, F.; Zhang, Y. A BP neural network-based safety evaluation method for mine fires evaluation method based on BP neural network. Ind. Saf. Environ. Prot. 2011, 37, 38–40. [Google Scholar]
- Yan, M.R.; Zhang, R.W.; Duan, H.W.; Xu, B.; Liu, H. Fuzzy comprehensive evaluation of exogenous fire hazard in coal mines. Coal Mine Saf. 2009, 40, 90–92. [Google Scholar]
- Chen, M. Multi-Level Fuzzy Comprehensive Evaluation of Fire Hazard Level; Central South University: Changsha, China, 2014. [Google Scholar]
- Deng, J.; Li, B.; Wang, K.; Wang, C. Current situation and prospect of coal fire disaster prevention technology in China. Coal Sci. Technol. 2016, 44, 1–8. [Google Scholar]
- Wan, Y.C.; Sheng, Z.H. Hierarchical analysis based on uncertainty of three values. Syst. Eng. Theor. Pract. Eng. 2004, 24, 89–93. [Google Scholar]
- Gao, P.; Shang, J.; Wu, J.; Mu, Z.; Suo, M.; Fan, J.; Zheng, Y.; Cheng, Y.; Wang, Y. Distribution, risk assessment, and source identification of potentially toxic elements in the sediments of the upper reaches of Zhanghe River, Haihe Basin. Sustainability 2022, 14, 15885. [Google Scholar] [CrossRef]
- Lee, A.H.I.; Chen, W.C.; Chang, C.J. A fuzzy AHP and BSC approach for evaluating performance of IT department in the manufacturing industry in Taiwan. Expert Syst. Appl. 2008, 34, 96–107. [Google Scholar] [CrossRef]
- Li, C.Y.; Zhang, T.T.; Xi, W.; Lian, Z.F. Site selection of urban parks based on fuzzy-analytic hierarchy process (FAHP): A case study of Nanjing, China. Int. J. Environ. Res. Public Health 2022, 19, 13159. [Google Scholar]
- Vahidnia, M.H.; Alesheikh, A.A.; Alimohammadi, A. Hospital site selection using fuzzy AHP and its derivatives. J. Environ. Manag. 2009, 90, 3048–3056. [Google Scholar] [CrossRef] [PubMed]
- Cai, S.; Wei, W.; Chen, D.; Ju, J.; Zhang, Y.; Liu, W.; Zheng, Z. Security Risk Intelligent Assessment of Power Distribution Internet of Things via Entropy-Weight Method and Cloud Model. Sensors 2022, 22, 4663. [Google Scholar] [CrossRef] [PubMed]
- Larsson, F.; Andersson, P.; Blomqvist, P.; Lorén, A.; Mellander, B.E. Characteristics of lithium-ion batteries during fire tests. J. Power Sources 2014, 271, 414–420. [Google Scholar] [CrossRef]
- Andersson, P.; Blomqvist, P.; Lorén, A.; Larsson, F. Using Fourier transform infrared spectroscopy to determine toxic gases in fires with lithium-ion batteries. Fire Mater. 2016, 40, 999–1015. [Google Scholar] [CrossRef]
- ISO 15660-1; Reaction to Fire Tests-Heat Release Smoke Production and Mass Loss Rate Part 1 Heat Release Rate (Cone Calorimeter Method) and Smoke Production Rate (Dynamic Measurement). ISO: Geneva, Switzerland, 2015.
- You, K.; Park, Y.; Lee, J.S. Risk analysis for determination of a tunnel support pattern. Tunn. Undergr. Space Technol. 2005, 20, 479–486. [Google Scholar] [CrossRef]
- Kevin, M.; Simo, H.; Jason, F. Fire Dynamics Simulator Technical Reference Guide Volume 4: Software Quality Assurance, NIST Special Publication 1018-4 Sixth Edition; NIST: Gaithersburg, MD, USA, 21 August 2020. [Google Scholar]
- Cox, G. Fire research in the 21st century. Fire Saf. J. 2004, 32, 203–219. [Google Scholar] [CrossRef]
- ISO 13571; Life-Threatening Components of Fire-Guidelines for the Estimation of Time to Compromised Tenability in Fires. ISO: Geneva, Switzerland, 2012.
- Speitel, L.C. Fractional effective dose model for post-crash aircraft survivability. Toxicology 1996, 115, 167–177. [Google Scholar] [CrossRef]
- Jiang, H.; Eastman, J.R. Application of fuzzy measures in multi-criteria evaluation in GIS. Int. J. Geogr. Inf. Sci. 2000, 14, 173–184. [Google Scholar] [CrossRef]
- Zhang, L.; Wu, X.; Qin, Y.; Skibniewski, M.J.; Liu, W. Towards a fuzzy Bayesian network based approach for safety risk analysis of tunnel-induced pipeline damage. Risk Anal. 2016, 36, 278–301. [Google Scholar] [CrossRef]
- Dashti, S.; Monavari, S.M.; Hosseini, S.M.; Riazi, B.; Momeni, M. Application of GIS, AHP, Fuzzy and WLC in Island Ecotourism Development (Case study of Qeshm Island, Iran). Life Sci. J. 2013, 10, 1274–1282. [Google Scholar]
- Rathore, B.; Gupta, R. A fuzzy based hybrid decision-making framework to examine the safety risk factors of healthcare workers during COVID-19 outbreak. J. Decis. Syst. 2022, 31, 68–101. [Google Scholar] [CrossRef]
- Bathrellos, G.D.; Skilodimou, H.D.; Chousianitis, K.; Youssef, A.M.; Pradhan, B. Suitability estimation for urban development using multi-hazard assessment map. Sci. Total Environ. 2017, 575, 119–134. [Google Scholar] [CrossRef]
- Wang, Q.K.; Kang, X.W.; Zhu, K. Coupling evaluation method of the construction risk for subway deep foundation pit. J. Northeast. Univ. Nat. Sci. 2021, 42, 1152–1158. [Google Scholar]
- Zheng, L. Research on project risk management of power engineering based on Fuzzy Comprehensive Evaluation method. Autom. Control Mechatron. Eng. II 2013, 415, 287–293. [Google Scholar] [CrossRef]
- Zhao, H.; Guo, S. Risk evaluation on UHV power transmission construction project based on AHP and FCE method. Math. Probl. Eng. 2014, 2014, 687568. [Google Scholar] [CrossRef] [Green Version]
- Bao, X.; Man, J.; Wang, Q. Comprehensive evaluation of risks in green building based on the Fuzzy Comprehensive Evaluation. In Applied Mechanics and Materials; Trans Tech Publications Ltd.: Bäch SZ, Switzerland, 2013; Volume 368–370, pp. 1154–1157. [Google Scholar]


| Risk Assessment Method | Advantages and Disadvantages | |
|---|---|---|
| LEC evaluation method (LEC stands for likelihood, risk exposure frequency, consequences) | Advantages | 1. Simple and easy |
| 2. Semi quantitative evaluation method | ||
| Disadvantages | 1. The scores of L, E and C can only represent a certain range | |
| 2. The score judgment is related to the work experience of the evaluators | ||
| MES evaluation method (MES stands for measures, exposure status, severity of consequences) | Advantages | 1. Information collection is easy to obtain |
| 2. High matching degree of construction project pre-assessment | ||
| 3. Qualitative classification | ||
| Disadvantages | 1. High professional requirements | |
| 2. Limitation of application scope | ||
| Index evaluation method | Advantages | 1. Easy to use |
| 2. It is applicable to the fields where multiple disasters coexist, the structure is complex, and the probability of hidden danger is difficult to determine | ||
| Disadvantages | 1. Neglect the function of system security assurance system | |
| 2. Ignore the importance difference between factors | ||
| 3. Poor flexibility and sensitivity | ||
| 4. The scope of additional systems for risk factors is too wide and there are too many compensation items | ||
| Fuzzy comprehensive evaluation method | Advantages | Be good at multi factor index synthesis and multi-index problems |
| Disadvantages | 1. The determination and change of factor weights need to be addressed | |
| 2. The distribution of weights almost depends on manual methods | ||
| Probabilistic risk assessment | Advantages | 1. Perfection of theoretical basis |
| 2. Strong portability | ||
| 3. Objective and accurate description | ||
| 4. Quantitative evaluation method | ||
| Disadvantages | 1. Many uncertain factors | |
| 2. Unclear factor status | ||
| 3. Difficulty in coefficient complete decomposition | ||
| Judgment Scale | Significance |
|---|---|
| 1 | Factor is as important as factor |
| 2 | Importance lies between the upper and lower scales |
| 3 | Factor is more important than factor |
| 4 | Importance lies between the upper and lower scales |
| 5 | Factor is very important than factor |
| Order n | 1 | 2 | 3 | 4 | 5 | 6 | 7 | 8 | 9 |
|---|---|---|---|---|---|---|---|---|---|
| RI value | 0 | 0 | 0.52 | 0.89 | 1.12 | 1.26 | 1.36 | 1.41 | 1.46 |
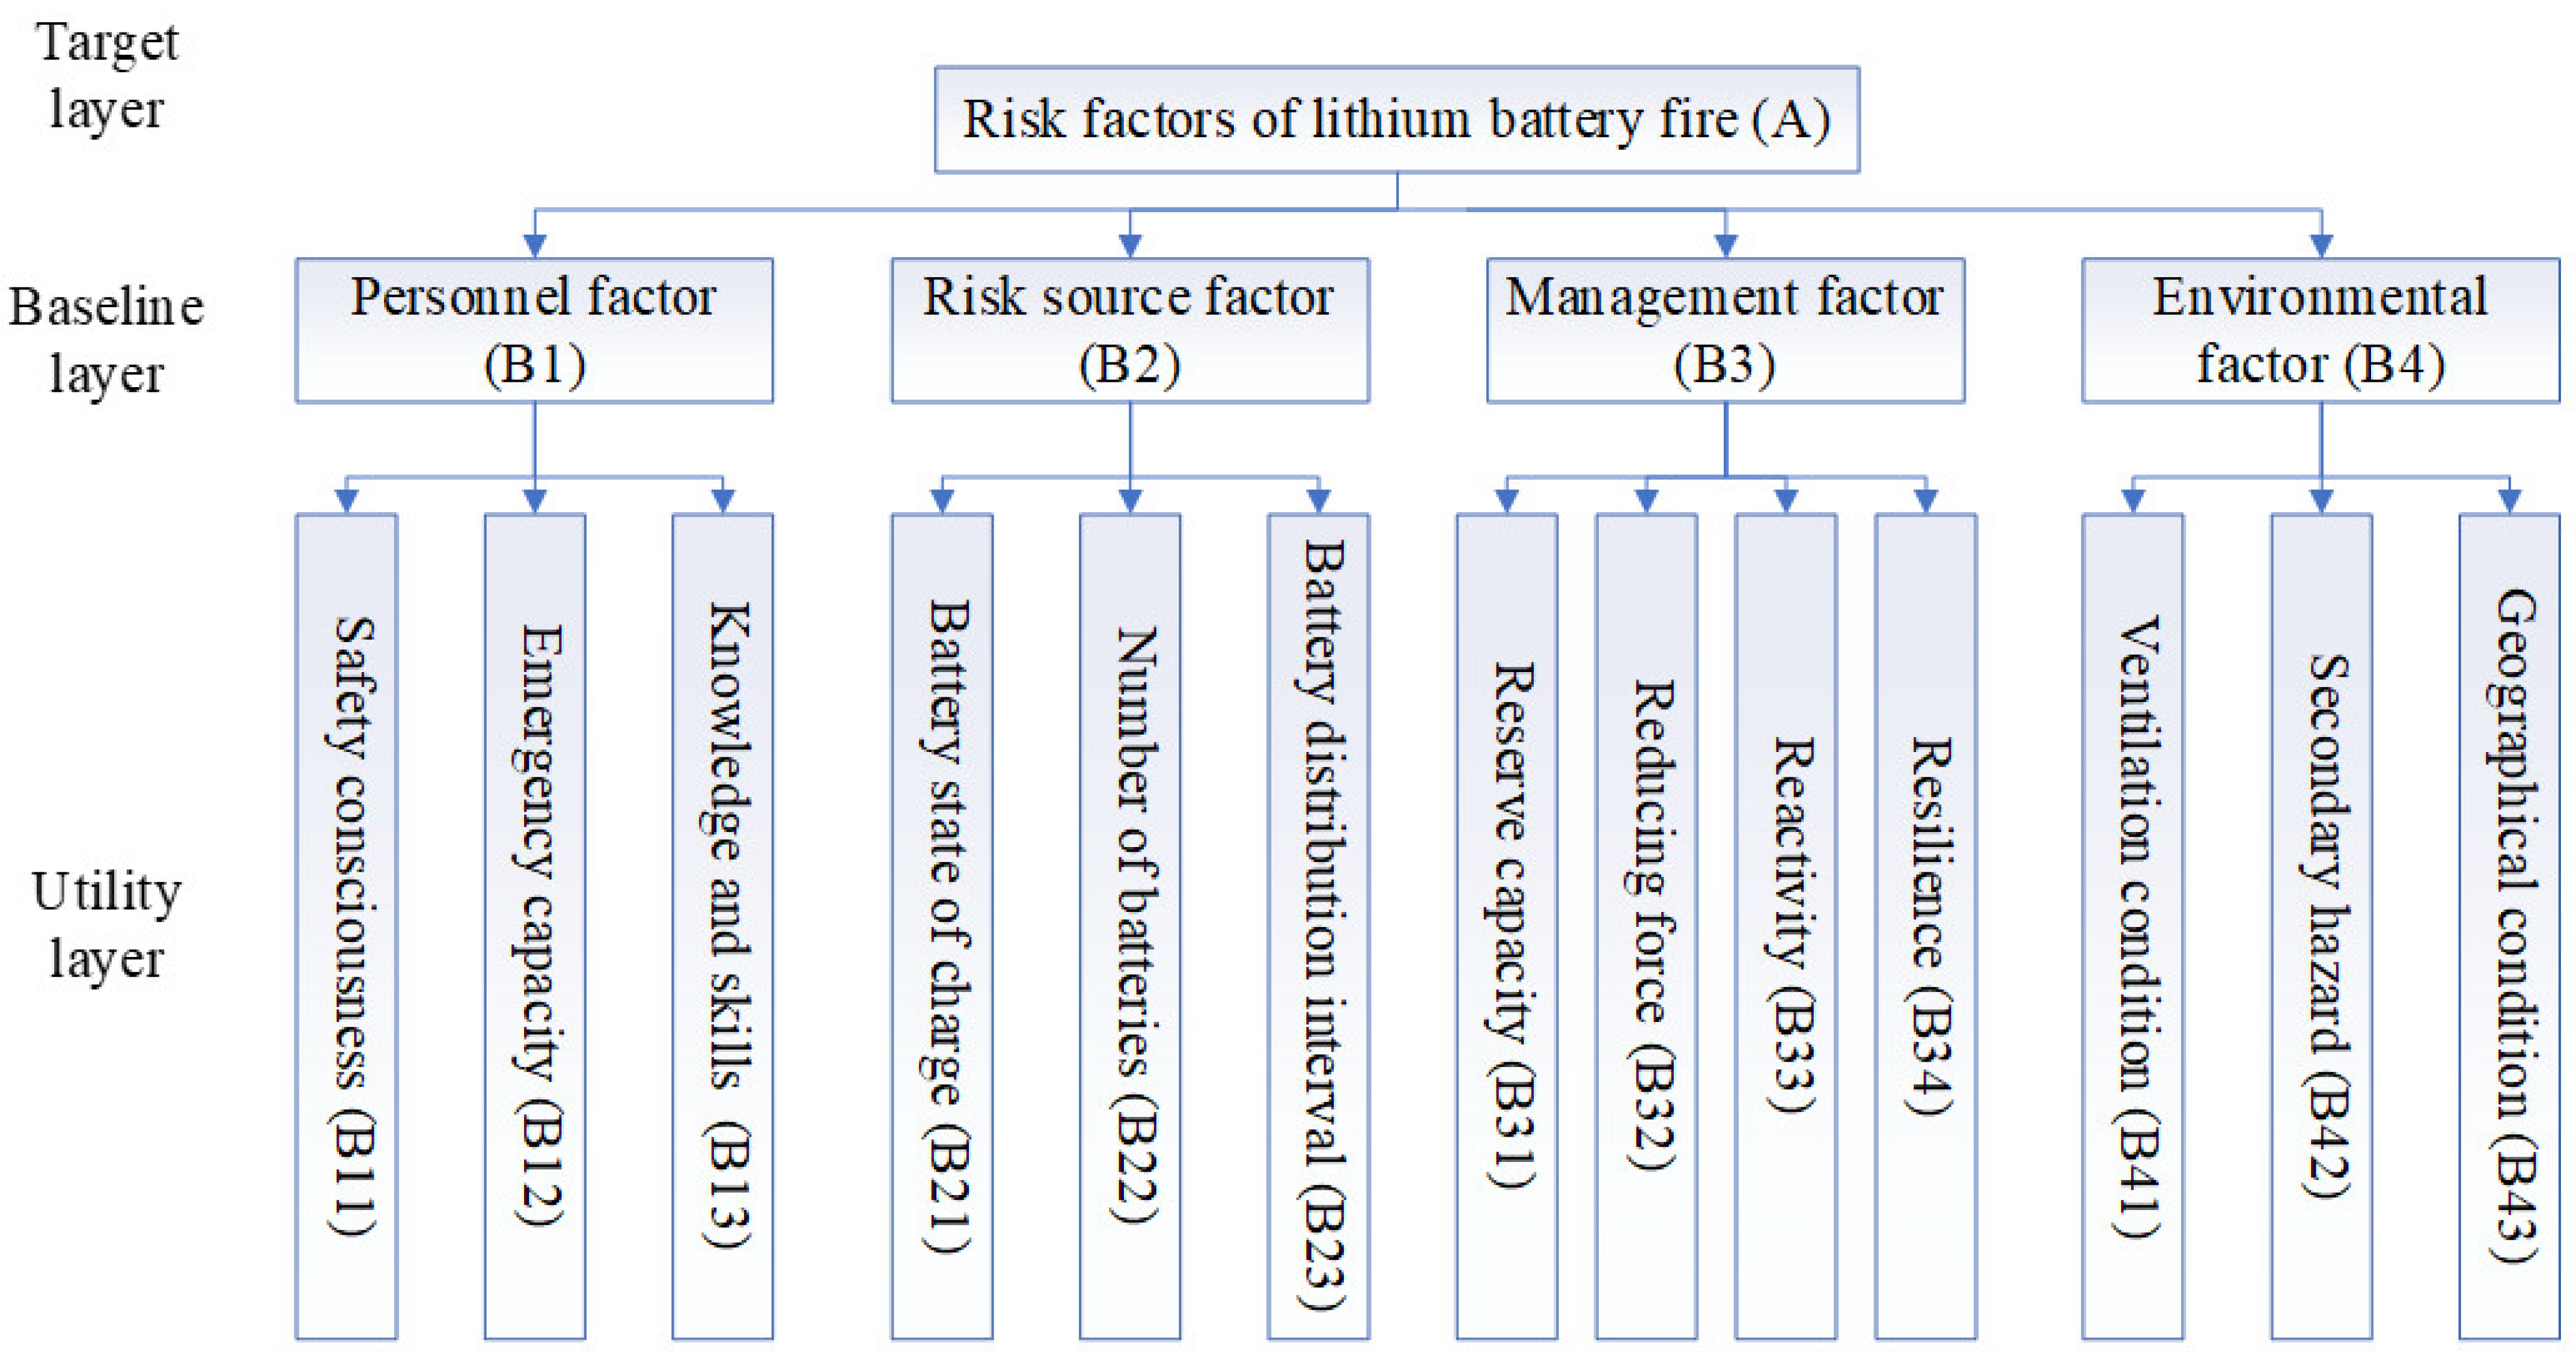
| Level I Indicators | Level II Indicators |
|---|---|
| Personnel factor (B1) | Safety consciousness (B11) |
| Emergency capacity (B12) | |
| Knowledge and skill quality (B13) | |
| Risk source factor (B2) | State of Charge (B21) |
| Number of lithium batteries (B22) | |
| Distribution interval (B23) | |
| Crisis management factor (B3) | Reserve capacity (B31) |
| Reducing force (B32) | |
| Reactivity (B33) | |
| Resilience (B34) | |
| Environmental factor (B4) | Ventilation conditions (B41) |
| Secondary hazard (B42) | |
| Geographical conditions (B43) |
| Average Value | Project | B1 | B2 | B3 | B4 |
|---|---|---|---|---|---|
| 1.400 | B1 | 1 | 0.737 | 0.560 | 0.359 |
| 1.900 | B2 | 1.357 | 1 | 0.760 | 0.487 |
| 2.500 | B3 | 1.786 | 1.358 | 1 | 0.641 |
| 3.900 | B4 | 2.786 | 2.053 | 1.560 | 1 |
| Project | Weight | Maximum Characteristic Value | CI Value |
|---|---|---|---|
| Personnel factors B1 | 0.144 | 4.008 | 0.003 |
| Risk source factors B2 | 0.196 | ||
| Crisis management factors B3 | 0.258 | ||
| Environmental factors B4 | 0.402 |
| Secondary Indicators | Contribution Rate | Weight Distribution |
|---|---|---|
| B21 | 12.02 | 0.150 |
| B22 | 48.73 | 0.603 |
| B23 | 19.83 | 0.247 |
| B41 | 12.33 | 0.544 |
| B42 | 6.43 | 0.266 |
| B43 | 4.60 | 0.190 |
| Target Layer (A) | Criterion Layer (B) | Weight | Decision Makers(P) | Weight | Combination Weight |
|---|---|---|---|---|---|
| A | B1 | 14.4% | B11 | 24.6% | 3.5% |
| B12 | 47.7% | 6.8% | |||
| B13 | 27.7% | 4% | |||
| B2 | 19.6% | B21 | 15% | 2.9% | |
| B22 | 60.3% | 11.8% | |||
| B23 | 24.7% | 4.8% | |||
| B3 | 25.8% | B31 | 37.1% | 9.6% | |
| B32 | 21.3% | 5.5% | |||
| B33 | 18% | 4.6% | |||
| B34 | 23.6% | 6.1% | |||
| B4 | 40.2% | B41 | 54.4% | 21.9% | |
| B42 | 26.6% | 10.8% | |||
| B43 | 19% | 7.7% | |||
| SUM | 1 | ||||
Disclaimer/Publisher’s Note: The statements, opinions and data contained in all publications are solely those of the individual author(s) and contributor(s) and not of MDPI and/or the editor(s). MDPI and/or the editor(s) disclaim responsibility for any injury to people or property resulting from any ideas, methods, instructions or products referred to in the content. |
© 2022 by the authors. Licensee MDPI, Basel, Switzerland. This article is an open access article distributed under the terms and conditions of the Creative Commons Attribution (CC BY) license (https://creativecommons.org/licenses/by/4.0/).
Share and Cite
Li, K.; Wang, Y.; Zhang, Y.; Wang, S.; Zou, X. Multi-Risk Assessment of Mine Lithium Battery Fire Based on Quantitative Factor Characterization. Int. J. Environ. Res. Public Health 2023, 20, 456. https://doi.org/10.3390/ijerph20010456
Li K, Wang Y, Zhang Y, Wang S, Zou X. Multi-Risk Assessment of Mine Lithium Battery Fire Based on Quantitative Factor Characterization. International Journal of Environmental Research and Public Health. 2023; 20(1):456. https://doi.org/10.3390/ijerph20010456
Chicago/Turabian StyleLi, Kuikui, Yanming Wang, Yongchang Zhang, Shasha Wang, and Xiangyu Zou. 2023. "Multi-Risk Assessment of Mine Lithium Battery Fire Based on Quantitative Factor Characterization" International Journal of Environmental Research and Public Health 20, no. 1: 456. https://doi.org/10.3390/ijerph20010456