Abstract
Objective: To identify metabolic factors and inflammatory markers that are predictive of postoperative total knee arthroplasty (TKA) outcome. Method: A systematic search of the existing literature was performed using the electronic databases PubMed, Web of Science and Embase until the 1st of August 2022. Studies that evaluated the influence of metabolic or inflammatory markers (I) on postsurgical outcome (O) in end-stage knee osteoarthritis patients awaiting primary TKA (P) were included in this review. Results: In total, 49 studies were included. Risk of bias of the included studies was low for one study, moderate for 10 studies and high for the remaining 38 studies. Conflicting evidence was found for the influence of body mass index, diabetes, cytokine levels and dyslipidaemia on pain, function, satisfaction and quality of life at more than six months after TKA. Conclusions: Several limitations such as not taking into account known confounding factors, the use of many different outcome measures and a widely varying follow-up period made it challenging to draw firm conclusions and clinical implications. Therefore large-scaled longitudinal studies assessing the predictive value of metabolic and inflammatory factors pre-surgery in addition to the already evidenced risk factors with follow-up of one year after TKA are warranted.
1. Introduction
About 20% of patients undergoing TKA report unfavourable outcomes after surgery, such as chronic postsurgical pain [1,2]. This pain has a major impact on patients and is often associated with functional deficits, worse general health, anxiety, depression, sleep problems and long-term opioid use [3,4]. Unfortunately, it is mostly very difficult to identify the aetiology of chronic pain after TKA, resulting in a significant subset of patients with unexplained persistent pain [5].
Determining risk factors associated with poor postoperative outcome after TKA is of tremendous importance to identify patients at risk. This could result in more accurate patient selection and creating more realistic expectations [6]. Previous systematic reviews have found evidence for a range of modifiable and non-modifiable patient-related preoperative risk factors including female gender, lower age, low socio-economic status, more preoperative pain, comorbidities and psychological factors (depression, anxiety or pain catastrophizing) [7].
Besides these already known risk factors, metabolic factors and inflammatory markers might also influence postoperative TKA outcome. Metabolic disorders such as obesity, diabetes and, by extension, the metabolic syndrome (which is the commonly observed clustering of obesity, hypertension, dyslipidaemia, and insulin resistance) are risk factors for developing knee OA in the first place [8,9,10], but if and how they relate to the development of postoperative chronic pain is still unclear. Recently, it has become clear that OA is more than a “wear-and-tear” disease and that the presence of metabolic factors and inflammatory markers such as C-reactive protein, pro-inflammatory cytokines and chemokines, also playing an important role in diabetes and obesity and the metabolic syndrome [11], cannot be underestimated in the development of OA but also in the modulation of pain processes (24). Research shows that increased systemic inflammation is associated with higher preoperative patient-reported pain levels in patients with knee OA [12]. In addition, systemic inflammation is characterized by high levels of circulating proinflammatory cytokines (such as interleukin-6 (IL-6) and tumour necrosis factor-α (TNFα)), which can sensitize the peripheral and the central nervous system [13,14]. This altered central pain processing may play an essential role in the development and maintenance of chronic pain. Besides being common in patients with OA [15,16], preliminary research suggests that altered central pain processing may even be a determinant of lower long-term benefit from joint replacement surgery. Hence, metabolic factors and inflammatory markers might be related to postoperative outcome.
A better understanding of how metabolic disorders, metabolic factors and inflammatory markers are related to postsurgical TKA outcome might increase our insight into the timing of surgery, patient expectations, patient-surgeon shared decisions and preoperative treatment decisions. Therefore, the aim of this study is to systematically review and critically appraise the existing evidence related to metabolic factors and inflammatory markers predictive of pain, functional disabilities, quality of life (QoL) and patient satisfaction after TKA in patients with knee OA.
2. Methods
2.1. Protocol and Registration
This systematic review is reported following the PRISMA-guidelines (Preferred Reporting Items for Systematic reviews and Meta-Analyses) [17]. This review protocol was prospectively registered at PROSPERO (registration number CRD42022350609).
2.2. Eligibility Criteria
To be included in this review, articles had to report results of studies that evaluated the influence of preoperative metabolic factors or inflammatory markers (I) on postoperative pain, functional disabilities, quality of life or patient satisfaction (O) in end-stage knee OA patients awaiting TKA (P). Full inclusion and exclusion criteria can be found in Table 1.

Table 1.
Inclusion and exclusion criteria.
2.3. Information Sources and Search
A systematic search of the existing literature was performed on the 1 August 2022, using the electronic databases PubMed, Web Of Science and Embase. The search strategy was based on three groups of search terms related to “Knee OA and Total Knee Replacement Surgery (P)”, “Metabolic Factors or inflammatory Markers (I)” and “Postsurgical Outcome (O)”. The construct of the search strategy is available as Appendix A.
2.4. Study Selection
Eligibility assessment was performed independently in a blinded standardized manner by the first and the second author (L.M. and M.M.) using Rayyan [18]. First, all search results were screened based on title and abstract. The full-text article was retrieved if the citation was considered potentially eligible and relevant. In the second phase, each full-text article was again evaluated whether it fulfilled all criteria. If any of the eligibility criteria was not fulfilled, the article was excluded. Disagreements between reviewers were resolved by consensus. If there were any disagreements after discussion, the opinion of the third author (M.M.) was provided.
2.5. Data Collection Process and Data Items
A data extraction sheet was developed and completed by the first author (L.M.). Following data was extracted from the included articles: (1) author, year of publication and study design; (2) characteristics of the study population; (3) specification of the examined preoperative metabolic and/or inflammatory factors; (4) timing of measurements; (5) primary postoperative outcome measures; (6) statistical analysis used (univariate or multivariate); (7) key findings related to the influence of preoperative metabolic and/or inflammatory factors on postoperative outcome(s).
2.6. Risk of Bias (RoB)
The full-text versions of all studies that met the inclusion criteria were retrieved for assessment of RoB using the Quality in Prognosis Studies (QUIPS) tool developed by Hayden et al. (28). This was done by the first author (L.M.). The QUIPS considers six domains of potential biases: (1) study participation; (2) study attrition; (3) prognostic factor measurement; (4) outcome; (5) measurement of and controlling for confounding variables; and (6) analysis approaches. Each criterion was answered using “yes” (criterion fulfilled), “no” (criterion not fulfilled), or “unclear”. For each of the 6 potential biases, a study was rated as having low, moderate, or high RoB per domain. A study was rated as low RoB if all domains were at low RoB or up to one was moderate RoB. A study was scored as moderate RoB when there were at least two domains at moderate, but not at high RoB in any domain. A high risk was judged when at least one domain was at high risk.
Further, levels of evidence of studies were determined with the Evidence Based Guideline Development (EBRO) approach, an initiative of the Dutch Cochrane Center and the Dutch Institute for Healthcare Improvement [19]. In accordance with this methodology, selected studies were classified according to their methodological quality and strength of evidence: A1: systematic review including at least two independent A2 level studies; A2: prospective cohort study of substantial size and sufficiently long follow-up period, adequate control of confounders and minimal chance of selective drop-out during follow-up; B: prospective cohort study, but not having all characteristics of an A2 study, or a retrospective cohort study or case-controlled trial; C: non-comparative study; and D: expert opinion. Finally, levels of conclusion are determined according to the EBRO method [19]. Level 1 evidence is represented by one A1 study or at least two independent A2 studies. Level 2 evidence is represented by one A2 or at least two independent B studies and Level 3 evidence is represented by one B or C study or conflicting results. Finally, level 4 evidence is represented by expert opinion only.
3. Results
3.1. Study Selection and Characteristics
The literature search identified 3.249 studies for screening of which 49 were included in this systematic review (Figure 1). The most important reasons for exclusion were inappropriate study design (e.g., retrospective study), inappropriate postoperative outcome (e.g., follow-up <6 months, outcome other than pain, functional disabilities, QoL, or satisfaction), and non-eligible population (patients with rheumatoid arthritis or unicompartimental knee arthroplasty). Of the 49 included studies, two were RCTs [20,21], two case-control studies [22,23] and 45 prospective observational studies [24,25,26,27,28,29,30,31,32,33,34,35,36,37,38,39,40,41,42,43,44,45,46,47,48,49,50,51,52,53,54,55,56,57,58,59,60,61,62,63,64,65,66,67,68] (of which two were secondary analyses [61,62]). For each study, the characteristics are presented in Table 2. The number of patients ranged from 28 (29) to 11.084 (30) and the follow-up period after surgery ranged from six months [22,24,27,29,30,33,42,43,45,52,55,57,65,67] to 17 years [39].
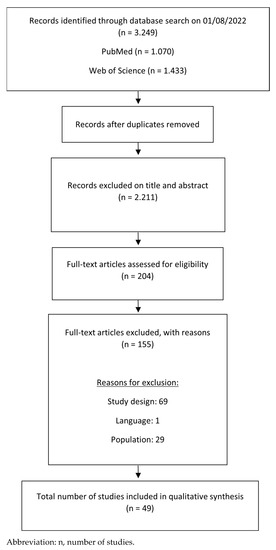
Figure 1.
Flow chart of systematic review.
Table 2.
Characteristics of the included studies.
3.2. Risk of Bias Assessment
The RoB of the reviewed studies is presented in Table 3.
Table 3.
Risk of bias assessment with QUIPS and levels of evidence and conclusion with EBRO.
The overall RoB was low for one study [62], moderate for 10 studies [21,23,29,34,36,38,41,46,52,56], and 38 studies suffered a high RoB [20,22,24,25,26,27,28,30,31,32,33,35,37,39,40,42,43,44,45,47,48,49,50,51,53,54,55,57,58,59,60,61,63,64,65,66,67,68]. RoB was mainly due to lack of information about study attrition and confounding factors. Other reasons were the lack of information or use of obvious valid and reliable prognostic factor measurements. Either no information regarding measurement of the prognostic factor was given or the information was retrieved from patient records. One study [62] had level A2 of evidence and all other studies were at level B of evidence [20,21,22,23,24,25,26,27,28,29,30,31,32,33,34,35,36,37,38,39,40,41,42,43,44,45,46,47,48,49,50,51,52,53,54,55,56,57,58,59,60,61,63,64,65,66,67,68].
3.3. Outcome Measures
An overview of the outcome measures that are used to assess pain, function, QoL and patient satisfaction can be found in Table 4. Function is further divided into impairments and activities/limitations, and gait related impairments and gait related activities/limitations. Gait related outcome measures will be discussed separately in order to keep a clear overview and to summarize findings based on more homogenous outcomes.
Table 4.
Overview of all outcome measures.
Studies reporting change in outcome measures (preoperative vs. postoperative results) will be reported separately from studies reporting absolute postoperative values of the outcome measures.
3.4. Predictive Factors
A summary of the results for the univariate and multivariate analyses can be found in Table 5. The results are described below for each factor and each of the outcome measures.
Table 5.
Predictive factors.
3.4.1. Factor: Body Mass Index
Pain
Relative change in outcome: Two univariate analyses [26,45] and one multivariate analysis [43] showed more pain reduction from baseline to postoperative outcome at six months [43,45] and at one year [26], in favour of obese patients. In contrast, the univariate analysis of Mishra et al. reported less pain reduction in obese patients [65]. In contrast, another multivariate analysis showed similar improvement in pain between non-obese and obese patients two years postoperatively [29].
Absolute outcome: Two univariate [23,44] and four multivariate analyses [29,43,48,52] found that higher BMI was not predictive for more pain six months [43,52], one year [23,48], two years [29] and five years [44] postoperatively. In contrast, one multivariate analysis found that class III obesity was associated with more pain three years postoperatively [47].
Functional Impairment
Four studies examined the influence of BMI on knee ROM [21,40,52,68].
Relative change in outcome: One multivariate analysis reported greater knee ROM improvement in patients with higher BMI [68].
Absolute outcome: One univariate analysis showed that knee ROM in obese patients was significantly lower than in non-obese patients one year and 10.8 years postoperatively [40]. However, the multivariate analysis of Pua et al. did not find BMI to be a predictor of postoperative knee ROM six months postoperatively [52]. In another study of Lampe and colleagues, lower BMI in combination with higher preoperative knee flexion predicted a higher maximal knee flexion one year postoperatively [21].
Two univariate [30,40] and five multivariate studies [32,33,41,44,68] examined the influence of BMI on the KSS knee outcome score.
Relative change in outcome: One study found lower BMI to be associated with better KSS knee outcome scores at nine years [30] contrary to Zhang et al. who found that BMI was not a predictor two years postoperative [68].
Absolute outcome: While one study found lower BMI to be associated with better KSS knee outcome scores 10.8 years [40] postoperatively, four other studies stated that BMI was not a predictor for KSS knee outcome scores at six months [33], at one year [32,33], at two years [33] and at five years [41,44] follow-up.
Two univariate [23,45] and one multivariate [47] studies examined the influence of BMI on WOMAC stiffness.
Relative change in outcome: One univariate analysis found that obese patients showed better WOMAC stiffness scores six months postoperatively [45] while another univariate [23]
Absolute outcome: The multivariate analysis of Nunez et al. showed no effect of BMI on WOMAC stiffness [47].
Functional Activities/Limitations
Relative change in outcome: Three univariate [26,27,59] and two multivariate analysis [29,68] showed a similar gain in function between obese and non-obese patients six months [27], one year [26], two years [29,68] and five years [59] postoperatively. However, Mc Queen et al. (univariate) and Zhang et al. (multivariate) found that obese patients showed more functional gain six months [45] and two years [68] postoperatively and contrary to this, two other univariate analyses found larger functional improvement in non-obese patients 10.8 year [39] and one year [65] postoperatively.
Absolute outcome: Eleven studies, of which one conducted a univariate analysis [23] and 10 multivariate analyses [25,29,32,33,34,44,47,56,61,62], found that BMI was not a predictor for functional outcome at six months [29,33], 1 year [23,32,33,56,61], two years [29,33], three years [34,47] and five years [25,44] postoperatively or for sedentary behaviour one year postoperatively [62]. Thirteen studies, of which five were univariate analyses [30,37,40,44,59] and eight multivariate analyses [20,22,35,41,48,50,55,62] found that non-obese patients had significantly better function than the obese group at six months post-surgery on KOOS ADL and KOS-ADLS [22,55], at one year on WOMAC, OKS, KSS function, reported physical activity [35,37,40,50,62], at five years on KSS [41,59] at nine years on KSS function [30] and at 10.8 years on WOMAC [40].
Gait Impairments
Relative change in outcome: One multivariate analysis found no association between BMI and knee ROM during the gait cycle [26] and Paterson et al. found that gait biomechanics were not influenced by BMI, two years postoperatively [49].
Gait Activities/Limitations
Six multivariate analyses [22,26,42,52,55,60] looked at the influence of BMI on gait related activities/limitations.
Relative change in outcome: One study did not show a significant association between BMI and gait velocity gain one year postoperatively [26].
Absolute outcome: Two other studies confirmed that postoperative walking speed 6 months postoperatively was not predicted by preoperative BMI [42,55]. Pua et al. found that BMI was not predictive of walking limitations at six months post-surgery [52]. In addition, stair climbing speed and TUG at six months postoperative were not influenced by BMI [55], idem for handrail use during stair climbing two years postoperatively [60]. The opposite was found in two other studies where lower BMI predicted better gait outcomes (gait speed and steps/day) [22] and a better stair climbing speed [42] at six months post-surgery.
Satisfaction
Absolute outcome: Four multivariate analyses showed that BMI was not predictive of satisfaction at one year [53,61], two years [29] and five years [63] post-surgery. Two other studies, one conducting univariate analyses [37] and one multivariate analyses [46], showed that less obese patients were more satisfied one year [37] and two years postoperatively [46].
Quality of Life
Relative change in outcome: Eight studies, of which six performed univariate analyses [26,27,31,45,59,65] and only two multivariate analyses [43,68], looked at the role of BMI on gain in QoL. Three studies (including the multivariate analysis) showed a similar gain in QoL between obese and non-obese patients at six months [43], at one year [26] and at five years [59]. Further, two studies showed a larger increase in QoL in favour of non-obese patients one year postoperatively [27], while in contrast two other studies showed a significantly larger QoL gain in favour of obese patients at six months [45] and at one year [31,65]. One multivariate analysis reported no difference in improvement for the Short Form 36 mental composite score (SF-36 MCS) but greater improvement of the Short Form 36 physical composite score (SF-36 PCS) in favour of higher BMI two years postoperative [68].
Absolute outcome: In addition one univariate [44] and three multivariate analyses [34,55,56] showed that BMI was not a predictive factor of QoL six months [55], one year [56], three years [34] and five years post-operatively [44]. In contrast, four other studies (two univariate [37,59] and two multivariate analyses [43,54]) found that greater level of obesity resulted in worse QoL at six months [43], one year [37], two years [54] and at five years [59].
Conclusion
Concerning the influence of BMI on postoperative pain, functional impairments, functional activities/limitations and QoL, both univariate and multivariate studies reported conflicting results. Some results were in favour of obese patients meaning that more obese patients showed less pain, less functional impairments, less functional limitations and better QoL after TKA. Some in favour of non-obese patients meaning that non-obese patients showed less pain, less functional impairments, less functional limitations and better QoL after TKA and some were similar for obese and non-obese patients. Regarding the influence of BMI on gait impairments, gait activities and satisfaction, results were also conflicting, however results were never in favour of obese patients meaning that more obese patients did never show better gait functions or were never more satisfied than less obese patients.
3.4.2. Factor: Diabetes
Pain
Relative change in outcome: In one multivariate analysis, diabetes that impacted routine activities showed less pain reduction at six months [24]. While another multivariate analyses showed that diabetes was and at one year [64] postoperative.
Absolute outcome: According to Pua et al. diabetes was not predictive for pain at six months [52].
Functional Impairment
Relative change in outcome: One multivariate analysis reported that diabetes resulted in poorer improvement two years postoperatively [68].
Absolute outcome: According to one univariate analysis, diabetes was not predictive of knee ROM two years postoperatively [58], while two multivariate analyses found that absence of diabetes was predictive of better knee ROM at six months [52] and at two years postoperatively [68]. One multivariate analysis found no association between diabetes and postoperative knee function at five years [41].
Functional Activities/Limitations
Relative change in outcome: One multivariate analysis also reported less functional improvement at six months in patients with diabetes that impacts routine activities [24]. In contrast, three multivariate analyses found that diabetes did not influence postoperative function at one year [50,64] and at two years [68].
Absolute outcome: One univariate analysis showed that diabetes was associated with worse function two years postoperatively [58]. In contrast, one univariate [66] and three multivariate analyses found that diabetes did not influence postoperative function at one year [28], at three years [34], at 4.79 years [66] and at five years [41].
Gait Activities/Limitations
Relative change in outcome: One multivariate analysis found that diabetes was not predictive of improvement in walking distance one year [64] postoperatively.
Absolute outcome: Another multivariate analysis also found that diabetes was not predictive of walking limitations at six months [52].
Satisfaction
Absolute outcome: One multivariate analysis found that diabetes was associated with lower odds of being satisfied one year postoperatively [64] and one univariate analysis also reported that diabetes was not correlated with satisfaction 4.79 years postoperatively [66].
Quality of Life
Relative change in outcome: One multivariate analysis [68] found no influence of diabetes on QoL (SF-36) at two years [68]. Another multivariate analysis study identified diabetes to be a significant predictor for greater improvement in SF-12 MCS at one year, but not for the SF-12 PCS [28].
Absolute outcome: One univariate analysis stated that diabetes did not influence QoL two years postoperatively [58].
Conclusion
Concerning the influence of diabetes on postoperative pain, functional impairments, functional activities and gait activities, studies reported conflicting results, however results were never in favour of patient with diabetes meaning that patients with diabetes did never show less pain, less functional impairments and limitations or better gait functions compared to patients without diabetes. Two studies describing the influence of diabetes on QoL showed conflicting results, either in favour of diabetes or similar results for both patients with and without diabetes. No studies reported results on gait impairments.
3.4.3. Factor: Cytokine Levels
Outcome Measure: Pain
Relative change in outcome: One multivariate analysis demonstrated that higher synovial fluid concentrations of TNF-a, MMP-13 and IL-6 were independent predictors of less pain improvement two years postoperatively [36]. Another multivariate analysis found that miRNAs were no independent predictors of postoperative pain relief one year postoperatively [38].
Absolute outcome: More severe preoperative synovitis, which is associated with higher levels of proinflammatory cytokines, seems to be associated with less postoperative pain at one year according to the univariate analysis of Petersen et al. [51] and Sideris et al. [67]. Another multivariate analysis found IL-1B and TNF-a to be independent predictors of greater pain development 6 months postoperatively [57].
Conclusion
Five studies examined the influence of cytokines on postoperative pain and their results were inconsistent. No results were found for other outcome measures.
3.4.4. Factor: Dyslipidaemia
Pain
Absolute outcome: Dyslipidaemia was not predictive of postoperative pain at six months according to one multivariate analysis study [52].
Functional Impairment
Absolute outcome: According to the multivariate analysis of Pua et al. dyslipidaemia was not predictive of postoperative knee ROM at six months [52].
Functional Activities/Limitations
Absolute outcome: Hypercholesterolemia seems not predictive for a diminished functional outcome at one year [35].
Gait Activities/Limitations
Absolute outcome: Pua and colleagues found that dyslipidaemia was not predictive for postoperative walking limitations six months postoperatively [52].
Conclusion
The presence of dyslipidaemia appears to have no influence on postoperative TKA outcome according to two multivariate analyses [35,52].
4. Discussion
The present study systematically reviewed the scientific literature regarding the influence of metabolic and inflammatory factors on pain, function (impairments, activities, gait impairments and gait activities), satisfaction and QoL after TKA. Conflicting results (level 3 of conclusion) were found for the role of BMI, diabetes, cytokine levels and dyslipidaemia on postoperative TKA outcome. Possible explanations for these conflicting results will be discussed below.
4.1. Body Mass Index
Conflicting results were found for the role of BMI as an influencing factor on pain, function, satisfaction and QoL. These conflicting results can find their origin in several factors. First, BMI was not measured in a uniform manner. Some studies gathered BMI by self-report, others extracted BMI from patient records and only few studies measured weight and height of the patients themselves. This could possibly result in inaccurate BMI classification of patients. Second, the use of different classification methods for obesity could also have influenced the results. For example, De Leeuw et al. defined patients as non-obese if they had a BMI lower than 25 kg/m2 [31], while Dettoni et al. used a cut-off of 30 kg/m2 [33].
4.2. Diabetes
A possible explanation for the inconsistent results is the diversity in defining diabetes. Some studies relied on self-report, others used medical records, but diabetes was never defined by blood results which could have led to misclassifications. Further, all included studies defined diabetes as a dichotomous variable, and no studies using continuous variables of glycaemic control, for example HbA1C, were found. Next, the functional impact of diabetes on a patient’s life, the duration of diabetes and the presence of diabetic complications (such as neuropathy, nephropathy, etcetera) could also have been useful to consider as influencing factors on TKA outcome [69].
4.3. Cytokine Levels
Two multivariate analyses found greater peripheral blood concentrations of IL-1B and TNF-a [57] and greater synovial fluid concentrations of TNF-a, MMP-13 and IL-6 [36] to be independent predictors of postoperative pain development. This can be explained by the fact that pro-inflammatory cytokines can sensitize the peripheral nerve endings leading to preoperative peripheral and central sensitization [14], which has found to be associated with postoperative pain after TKA [70]. In contrast, the univariate analyses of Petersen et al. and Sideris et al. [67] found that more severe preoperative synovitis was associated with less postoperative pain [51]. However, these contrasting results can be explained by the fact that both studies did not control for other possible influencing preoperative factors.
There was also one study exploring the role of preoperative microRNAs on postoperative outcome [38]. These microRNAs are directly involved in the production of cytokines and are therefore included in this review [71,72]. The study of Giordano et al. found higher levels of certain microRNAs (hsa-miR-146a-5p, hsa-miR-145-5p and hsa-miR-130b-3p) to be associated with lower postoperative pain relief [38]. This was found using t-tests, but when performing linear regression analyses and including preoperative pain intensity in the model, a known risk factor for poor outcome, only a trend to significance (p = 0.06) of hsa-miR-146a-5p was found. Clearly, this points towards the importance of taking into account the already known risk factors. Interestingly, it appears that high levels of TNF-a and IL-1B induce the expression of hsa-miR-146a-5p and this pathway is involved in the pathogenesis of OA [73,74]. Since Giordano et al. did not include these pro-inflammatory cytokines in their regression analyses together with microRNAs [38], it is difficult to assess whether pro-inflammatory cytokines or microRNAs are predictive of poorer postoperative outcome.
4.4. Strengths and Limitations
This study had several strengths. First, a comprehensive set of search terms was used to search three databases for relevant studies. Second, the screening was performed by two independent reviewers. Besides the strengths of the current systematic review, there are also some limitations It was difficult to compare the results, due to heterogeneity in the different studies. Many different outcome measures at different follow up times were used, which might (partly) explain the, sometimes conflicting results. The risk of bias was not scored in a double blinded way. Finally, very limited studies were found concerning the influence of cytokine levels and dyslipidaemia.
4.5. Implications for Further Research and Clinical Practice
A better understanding of specifically the role of BMI, diabetes, inflammation and dyslipidaemia in postsurgical chronic pain, function, QoL and patient satisfaction after TKA is crucial to gain more insights into the timing of surgery, (p)rehabilitation, patient expectations, and patient-surgeon shared decisions. Therefore large-scaled longitudinal studies assessing the predictive value of metabolic and inflammatory factors pre-surgery in addition to the already evidenced risk factors with follow-up of 1 year after TKA are warranted. Retrospective studies could guide future researchers in the selection of these metabolic and inflammatory factors.
This insight could help us to identify those patients most at risk for chronic postoperative pain and disability, so that treatment strategy can be adapted and optimized, and outcome after TKR will be better, e.g., by providing (p)rehabilitation strategies specifically targeting these metabolic and inflammatory factors.
5. Conclusions
Reporting of study findings was challenging, because of the heterogeneity of the included studies. In conclusion, studies reported conflicting results regarding the influence of BMI on postoperative outcome in favour of obese as well as non-obese patients. The influence of diabetes on TKA outcome was also unclear, however results were never in favour of patient with diabetes. There were inconclusive results regarding the influence of cytokines. And finally, the presence of dyslipidaemia appears to have no influence on postoperative TKA outcome. Further research including larger patient cohorts unravelling the predictive role of BMI, diabetes, inflammation and dyslipidaemia in addition to the already known risk factors for poor outcome after TKA is required to identify a more comprehensive insight in possible risk factors and to provide the best possible care for patients with end-stage knee OA, undergoing TKA.
Author Contributions
Conceptualization, L.M., M.M., D.B. and R.J.E.M.S.; Methodology, L.M., M.G.M., M.M., D.B. and R.J.E.M.S.; Software, not applicable; Validation, L.M., M.G.M., M.M., S.V., I.B., D.B., P.V. and R.J.E.M.S.; Formal Analysis, not applicable; Investigation, L.M. and M.G.M.; Resources, Data Curation, Writing—Original Draft Preparation, L.M.; Writing—Review & Editing, L.M., M.G.M., M.M., S.V., I.B., D.B., P.V. and R.J.E.M.S.; Visualization, L.M., M.G.M., M.M., S.V., I.B., D.B., P.V. and R.J.E.M.S.; Supervision, M.M. and R.J.E.M.S.; Project Administration, L.M.; Funding Acquisition, L.M. All authors have read and agreed to the published version of the manuscript.
Funding
Lotte Meert is a PhD research fellow funded by the Research Foundation Flanders (FWO) [11E5720N].
Institutional Review Board Statement
Not applicable.
Informed Consent Statement
Not applicable.
Data Availability Statement
Not applicable, no new data were created.
Conflicts of Interest
The authors declare no conflict of interest.
Appendix A
Appendix A.1. PUBMED (725 Hits)
(((“Osteoarthritis, Knee”[MeSH] OR ((“osteoarthritis”[MeSH Terms] OR “osteoarthritis”[tiab]) AND (“knee”[MeSH Terms] OR “knee”[tiab] OR “knee joint”[MeSH Terms] OR (“knee”[tiab] AND “joint”[tiab]) OR “knee joint”[tiab]))) AND (“Arthroplasty, Replacement, Knee”[MeSH] OR “Knee Prosthesis”[Mesh] OR (“knee prosthesis”[MeSH Terms] OR (“knee”[tiab] AND “prosthesis”[tiab]) OR “knee prosthesis”[tiab] OR “arthroplasty, replacement, knee”[MeSH Terms] OR (“arthroplasty”[tiab] AND “replacement”[tiab] AND “knee”[tiab]) OR “knee replacement arthroplasty”[tiab] OR (“knee”[tiab] AND “prosthesis”[tiab])) OR “knee arthroplasty”[tiab] OR (“arthroplasty, replacement, knee”[MeSH Terms] OR (“arthroplasty”[tiab] AND “replacement”[tiab] AND “knee”[tiab]) OR “knee replacement arthroplasty”[tiab] OR (“knee”[tiab] AND “replacement”[tiab]) OR “knee replacement”[tiab]))) AND (“Overweight”[Mesh] OR (“overweight”[MeSH Terms] OR “overweight”[All Fields]) OR “Obesity”[Mesh] OR (“obesity”[MeSH Terms] OR “obesity”[All Fields]) OR “Diabetes mellitus”[Mesh] OR “Diabetes”[All Fields] OR “Hypertension”[Mesh] OR (“hypertension”[MeSH Terms] OR “hypertension”[All Fields]) OR “blood pressure”[All Fields] OR “Dyslipidemias”[Mesh] OR (“dyslipidemias”[MeSH Terms] OR “dyslipidemias”[All Fields]) OR “Blood Sedimentation”[Mesh] OR (“blood sedimentation”[MeSH Terms] OR (“blood”[All Fields] AND “sedimentation”[All Fields]) OR “blood sedimentation”[All Fields] OR (“erythrocyte”[All Fields] AND “sedimentation”[All Fields]) OR “erythrocyte sedimentation”[All Fields]) OR (“glycated hemoglobin a”[MeSH Terms] OR “glycated hemoglobin a”[All Fields] OR “hba1c”[All Fields]) OR “Sagittal Abdominal Diameter”[Mesh] OR “abdominal circumference”[All Fields] OR “Hyperglycemia”[Mesh] OR (“hyperglycaemia”[All Fields] OR “hyperglycemia”[MeSH Terms] OR “hyperglycemia”[All Fields]) OR ((“blood glucose”[MeSH Terms] OR (“blood”[All Fields] AND “glucose”[All Fields]) OR “blood glucose”[All Fields]) AND level[All Fields]) OR “Cholesterol, LDL”[Mesh] OR “Hypercholesterolemia”[Mesh] OR “Cholesterol”[Mesh] OR (“cholesterol”[MeSH Terms] OR “cholesterol”[All Fields]) OR “C-Reactive Protein”[Mesh] OR “C-Reactive Protein”[All Fields] OR “Leptin”[Mesh] OR (“leptin”[MeSH Terms] OR “leptin”[All Fields]) OR “Cytokines”[Mesh] OR (“cytokines”[MeSH Terms] OR “cytokines”[All Fields]) OR “Interleukins”[Mesh] OR (“interleukins”[MeSH Terms] OR “interleukins”[All Fields]) OR “Body Mass Index”[Mesh] OR BMI[All Fields] OR “Tumor Necrosis Factor-alpha”[Mesh] OR “tumor necrosis factor alpha”[All Fields] OR TNF[All Fields] OR (low-grade[All Fields] AND (“inflammation”[MeSH Terms] OR “inflammation”[All Fields])) AND (“Range of motion, articular” [MeSH] OR “range of motion” OR mobility OR “Pain” [MeSH] OR pain OR “Musculoskeletal Pain” [MeSH] OR “chronic pain” [MeSH] OR “activities of daily living” [MeSH] OR “activities of daily living” OR “Treatment outcome” [MeSH] OR treatment outcome OR “Quality of life” [MeSH] OR QOL OR quality of life OR “Function*” OR “Muscle Strength”[Mesh] OR muscle strength OR “Proprioception”[Mesh] OR proprioception OR “Patient Satisfaction”[Mesh] OR satisfaction)))
Appendix A.2. WOS (981 Hits)
TS = ((“Osteoarthritis, Knee” OR (osteoarthritis AND (knee OR “knee joint” OR (knee AND joint)))) AND (“Arthroplasty, Replacement, Knee” OR “Knee Prosthesis” OR (knee AND prosthesis) OR (arthroplasty AND replacement AND knee) OR “knee replacement arthroplasty” OR “knee arthroplasty” OR (knee AND replacement) OR “knee replacement”) AND (Overweight OR Obesity OR “Diabetes mellitus” OR Hypertension OR “blood pressure” OR Dyslipidemias OR “Blood Sedimentation” OR (blood AND sedimentation) OR (erythrocyte AND sedimentation) OR “erythrocyte sedimentation” OR “glycated hemoglobin a” OR hba1c OR “Sagittal Abdominal Diameter” OR “abdominal circumference” OR Hyperglycemia OR hyperglycaemia OR ((“blood glucose” OR (blood AND glucose)) AND level) OR “Cholesterol, LDL” OR Hypercholesterolemia OR Cholesterol OR “C-Reactive Protein” OR Leptin OR Cytokines OR Interleukins OR “Body Mass Index” OR BMI OR “Tumor Necrosis Factor-alpha” OR “tumor necrosis factor alpha” OR TNF OR “low-grade inflammation” OR (“low-grade” AND inflammation)) AND (“Range of motion, articular” OR (“range” AND “motion” AND “articular”) OR “articular range of motion” OR “mobility” OR “Pain” OR “Musculoskeletal Pain” OR “chronic pain” OR “activities of daily living” OR “Treatment outcome” OR (“treatment” AND “outcome”) OR “Quality of life” OR QOL OR (“quality” AND “life”) OR “Function*” OR “Muscle Strength”OR (“muscle” AND “strength”) OR “Proprioception” OR “Patient Satisfaction” OR “personal satisfaction” OR (“personal” AND “satisfaction”) OR “satisfaction”))
Appendix A.3. EMBASE (468 Hits)
(‘knee osteoarthritis’/exp OR ‘knee osteoarthritis’ OR ‘arthrosis, knee’:ti,ab OR ‘femorotibial arthrosis’:ti,ab OR ‘gonarthrosis’:ti,ab OR ‘knee arthrosis’:ti,ab OR ‘knee joint arthrosis’:ti,ab OR ‘knee joint osteoarthritis’:ti,ab OR ‘knee osteo-arthritis’:ti,ab OR ‘knee osteo-arthrosis’:ti,ab OR ‘knee osteoarthritis’:ti,ab OR ‘knee osteoarthrosis’:ti,ab OR ‘osteoarthritis, knee’:ti,ab OR ‘osteoarthrosis, knee’:ti,ab) AND (‘total knee arthroplasty’/exp OR ‘total knee arthroplasty’ OR ‘knee arthroplasty, total’:ti,ab OR ‘knee replacement, total’:ti,ab OR ‘total knee arthroplasty’:ti,ab OR ‘total knee joint replacement’:ti,ab OR ‘total knee replacement’:ti,ab OR ‘total knee replacement arthroplasty’:ti,ab OR ‘knee prosthesis’/exp OR ‘knee prosthesis’ OR ‘knee joint prosthesis’:ti,ab OR ‘knee prostheses’:ti,ab OR ‘knee prosthesis’:ti,ab OR ‘knee, artificial’:ti,ab OR ‘prostheses, knee’:ti,ab) AND (‘adipose tissue hyperplasia’/exp OR ‘adipose tissue hyperplasia’ OR ‘adipositas’/exp OR ‘adipositas’ OR ‘adiposity’/exp OR ‘adiposity’ OR ‘alimentary obesity’/exp OR ‘alimentary obesity’ OR ‘body weight, excess’/exp OR ‘body weight, excess’ OR ‘corpulency’/exp OR ‘corpulency’ OR ‘fat overload syndrome’/exp OR ‘fat overload syndrome’ OR ‘nutritional obesity’/exp OR ‘nutritional obesity’ OR ‘obesitas’/exp OR ‘obesitas’ OR ‘obesity’/exp OR ‘obesity’ OR ‘overweight’/exp OR ‘overweight’ OR ‘diabetes’/exp OR ‘diabetes’ OR ‘diabetes mellitus’/exp OR ‘diabetes mellitus’ OR ‘diabetic’/exp OR ‘diabetic’ OR ‘htn (hypertension)’/exp OR ‘htn (hypertension)’ OR ‘arterial hypertension’/exp OR ‘arterial hypertension’ OR ‘blood pressure, high’/exp OR ‘blood pressure, high’ OR ‘cardiovascular hypertension’/exp OR ‘cardiovascular hypertension’ OR ‘high blood pressure’/exp OR ‘high blood pressure’ OR ‘hypertension’/exp OR ‘hypertension’ OR ‘hypertensive disease’/exp OR ‘hypertensive disease’ OR ‘secondary hypertension’/exp OR ‘secondary hypertension’ OR ‘systemic hypertension’/exp OR ‘systemic hypertension’ OR ‘dyslipaemia’/exp OR ‘dyslipaemia’ OR ‘dyslipemia’/exp OR ‘dyslipemia’ OR ‘dyslipidaemia’/exp OR ‘dyslipidaemia’ OR ‘dyslipidaemias’/exp OR ‘dyslipidaemias’ OR ‘dyslipidemia’/exp OR ‘dyslipidemia’ OR ‘dyslipidemias’/exp OR ‘dyslipidemias’ OR ‘lipidaemia, dys’/exp OR ‘lipidaemia, dys’ OR ‘lipidemia, dys’/exp OR ‘lipidemia, dys’ OR ‘blood sedimentation’/exp OR ‘blood sedimentation’ OR ‘blood sedimentation rate’/exp OR ‘blood sedimentation rate’ OR ‘erythrocyte sedimentation rate’/exp OR ‘erythrocyte sedimentation rate’ OR ‘sedimentation rate, erythrocyte’/exp OR ‘sedimentation rate, erythrocyte’ OR ‘hb a1c’/exp OR ‘hb a1c’ OR ‘glycated haemoglobin a1c’/exp OR ‘glycated haemoglobin a1c’ OR ‘glycated hemoglobin a1c’/exp OR ‘glycated hemoglobin a1c’ OR ‘glycosylated haemoglobin a1c’/exp OR ‘glycosylated haemoglobin a1c’ OR ‘glycosylated hemoglobin a1c’/exp OR ‘glycosylated hemoglobin a1c’ OR ‘haemoglobin a1c’/exp OR ‘haemoglobin a1c’ OR ‘haemoglobin a 1c’/exp OR ‘haemoglobin a 1c’ OR ‘haemoglobin aic’/exp OR ‘haemoglobin aic’ OR ‘hb a (1c)’/exp OR ‘hb a (1c)’ OR ‘hba 1c’/exp OR ‘hba 1c’ OR ‘hba1c’/exp OR ‘hba1c’ OR ‘hemoglobin a1c’/exp OR ‘hemoglobin a1c’ OR ‘hemoglobin a 1c’/exp OR ‘hemoglobin a 1c’ OR ‘hemoglobin aic’/exp OR ‘hemoglobin aic’ OR ‘abdomen circumference’/exp OR ‘abdomen circumference’ OR ‘abdominal circumference’/exp OR ‘abdominal circumference’ OR ‘circumference, abdominal’/exp OR ‘circumference, abdominal’ OR ‘glucose blood level, elevated’/exp OR ‘glucose blood level, elevated’ OR ‘glycemia, hyper’/exp OR ‘glycemia, hyper’ OR ‘hyperglucemia’/exp OR ‘hyperglucemia’ OR ‘hyperglycaemia’/exp OR ‘hyperglycaemia’ OR ‘hyperglycemia’/exp OR ‘hyperglycemia’ OR ‘high blood glucose index’/exp OR ‘high blood glucose index’ OR ‘cholesteremia’/exp OR ‘cholesteremia’ OR ‘cholesterinemia’/exp OR ‘cholesterinemia’ OR ‘cholesterolemia’/exp OR ‘cholesterolemia’ OR ‘hypercholesteremia’/exp OR ‘hypercholesteremia’ OR ‘hypercholesterinaemia’/exp OR ‘hypercholesterinaemia’ OR ‘hypercholesterinemia’/exp OR ‘hypercholesterinemia’ OR ‘hypercholesterolaemia’/exp OR ‘hypercholesterolaemia’ OR ‘hypercholesterolemia’/exp OR ‘hypercholesterolemia’ OR ‘c reactive protein’/exp OR ‘c reactive protein’ OR ‘c reaction protein’/exp OR ‘c reaction protein’ OR ‘c-reactive protein’/exp OR ‘c-reactive protein’ OR ‘creactive protein’/exp OR ‘creactive protein’ OR ‘crp’/exp OR ‘crp’ OR ‘protein, c reactive’/exp OR ‘protein, c reactive’ OR ‘serum c reactive protein’/exp OR ‘serum c reactive protein’ OR ‘leptin’/exp OR ‘leptin’ OR ‘obese protein’/exp OR ‘obese protein’ OR ‘cytokine’/exp OR ‘cytokine’ OR ‘cytokines’/exp OR ‘cytokines’ OR ‘interleukin’/exp OR ‘interleukin’) AND (‘joint characteristics and functions’/exp OR ‘joint characteristics and functions’ OR ‘range of motion, articular’/exp OR ‘range of motion, articular’ OR ‘pain’/exp OR ‘pain’ OR ‘locomotor pain’/exp OR ‘locomotor pain’ OR ‘musculoskeletal pain’/exp OR ‘musculoskeletal pain’ OR ‘pain, musculoskeletal’/exp OR ‘pain, musculoskeletal’ OR ‘chronic intractable pain’/exp OR ‘chronic intractable pain’ OR ‘chronic pain’/exp OR ‘chronic pain’ OR ‘pain, chronic’/exp OR ‘pain, chronic’ OR ‘adl (activities of daily living)’/exp OR ‘adl (activities of daily living)’ OR ‘activities of daily living’/exp OR ‘activities of daily living’ OR ‘activity, daily living’/exp OR ‘activity, daily living’ OR ‘daily life activity’/exp OR ‘daily life activity’ OR ‘daily living activity’/exp OR ‘daily living activity’ OR ‘clinical outcome’/exp OR ‘clinical outcome’ OR ‘clinical patient outcome’/exp OR ‘clinical patient outcome’ OR ‘clinical therapeutic outcome’/exp OR ‘clinical therapeutic outcome’ OR ‘clinical therapy outcome’/exp OR ‘clinical therapy outcome’ OR ‘clinical treatment outcome’/exp OR ‘clinical treatment outcome’ OR ‘medical futility’/exp OR ‘medical futility’ OR ‘outcome and process assessment (health care)’/exp OR ‘outcome and process assessment (health care)’ OR ‘outcome management’/exp OR ‘outcome management’ OR ‘patient outcome’/exp OR ‘patient outcome’ OR ‘therapeutic outcome’/exp OR ‘therapeutic outcome’ OR ‘therapy outcome’/exp OR ‘therapy outcome’ OR ‘treatment outcome’/exp OR ‘treatment outcome’ OR ‘hrql’/exp OR ‘hrql’ OR ‘health related quality of life’/exp OR ‘health related quality of life’ OR ‘life quality’/exp OR ‘life quality’ OR ‘quality of life’/exp OR ‘quality of life’ OR ‘dynamic strength, muscle’/exp OR ‘dynamic strength, muscle’ OR ‘dynamic strength, muscular’/exp OR ‘dynamic strength, muscular’ OR ‘force, muscle’/exp OR ‘force, muscle’ OR ‘muscle dynamic strength’/exp OR ‘muscle dynamic strength’ OR ‘muscle force’/exp OR ‘muscle force’ OR ‘muscle force velocity relationship’/exp OR ‘muscle force velocity relationship’ OR ‘muscle power’/exp OR ‘muscle power’ OR ‘muscle strength’/exp OR ‘muscle strength’ OR ‘muscular dynamic strength’/exp OR ‘muscular dynamic strength’ OR ‘muscular force’/exp OR ‘muscular force’ OR ‘muscular power’/exp OR ‘muscular power’ OR ‘muscular strength’/exp OR ‘muscular strength’ OR ‘strength, muscle’/exp OR ‘strength, muscle’ OR ‘deep sensitivity’/exp OR ‘deep sensitivity’ OR ‘discrimination, kinaesthetic’/exp OR ‘discrimination, kinaesthetic’ OR ‘discrimination, kinesthetic’/exp OR ‘discrimination, kinesthetic’ OR ‘kinaesthetic discrimination’/exp OR ‘kinaesthetic discrimination’ OR ‘kinaesthetic perception’/exp OR ‘kinaesthetic perception’ OR ‘kinesio perceptual test’/exp OR ‘kinesio perceptual test’ OR ‘kinesthetic discrimination’/exp OR ‘kinesthetic discrimination’ OR ‘kinesthetic perception’/exp OR ‘kinesthetic perception’ OR ‘kinetic tonic pattern’/exp OR ‘kinetic tonic pattern’ OR ‘muscle propriocepsis’/exp OR ‘muscle propriocepsis’ OR ‘perception, kinaesthetic’/exp OR ‘perception, kinaesthetic’ OR ‘perception, kinesthetic’/exp OR ‘perception, kinesthetic’ OR ‘propriocepsis’/exp OR ‘propriocepsis’ OR ‘proprioception’/exp OR ‘proprioception’ OR ‘proprioceptive innervation’/exp OR ‘proprioceptive innervation’ OR ‘proprioceptor’/exp OR ‘proprioceptor’ OR ‘proprioreceptor’/exp OR ‘proprioreceptor’ OR ‘patient satisfaction’/exp OR ‘patient satisfaction’)
References
- Petersen, K.K.; Simonsen, O.; Laursen, M.B.; Nielsen, T.A.; Rasmussen, S.; Arendt-Nielsen, L. Chronic postoperative pain after primary and revision total knee arthroplasty. Clin. J. Pain 2015, 31, 1–6. [Google Scholar] [CrossRef] [PubMed]
- Wylde, V.; Beswick, A.; Bruce, J.; Blom, A.; Howells, N.; Gooberman-Hill, R. Chronic pain after total knee arthroplasty. EFORT Open Rev. 2018, 3, 461–470. [Google Scholar] [CrossRef] [PubMed]
- Wylde, V.; Hewlett, S.; Learmonth, I.D.; Dieppe, P. Persistent pain after joint replacement: Prevalence, sensory qualities, and postoperative determinants. Pain 2011, 152, 566–572. [Google Scholar] [CrossRef] [PubMed]
- Howells, N.; Murray, J.; Wylde, V.; Dieppe, P.; Blom, A. Persistent pain after knee replacement: Do factors associated with pain vary with degree of patient dissatisfaction? Osteoarthr. Cartil. 2016, 24, 2061–2068. [Google Scholar] [CrossRef]
- Preston, S.; Petrera, M.; Kim, C.; Zywiel, M.G.; Gandhi, R. Towards an understanding of the painful total knee: What is the role of patient biology? Curr. Rev. Musculoskelet. Med. 2016, 9, 388–395. [Google Scholar] [CrossRef]
- Santaguida, P.L.; Hawker, G.A.; Hudak, P.L.; Glazier, R.; Mahomed, N.N.; Kreder, H.J.; Coyte, P.C.; Wright, J.G. Patient characteristics affecting the prognosis of total hip and knee joint arthroplasty: A systematic review. Can. J. Surg. 2008, 51, 428–436. [Google Scholar]
- Hernandez, C.; Diaz-Heredia, J.; Berraquero, M.L.; Crespo, P.; Loza, E.; Iban, M.A.R. Pre-operative Predictive Factors of Post-operative Pain in Patients with Hip or Knee Arthroplasty: A Systematic Review. Reumatol. Clin. 2015, 11, 361–380. [Google Scholar] [CrossRef]
- Williams, M.F.; London, D.A.; Husni, E.M.; Navaneethan, S.; Kashyap, S.R. Type 2 diabetes and osteoarthritis: A systematic review and meta-analysis. J. Diabetes Complicat. 2016, 30, 944–950. [Google Scholar] [CrossRef]
- Lee, R.; Kean, W.F. Obesity and knee osteoarthritis. Inflammopharmacology 2012, 20, 53–58. [Google Scholar] [CrossRef]
- Courties, A.; Berenbaum, F.; Sellam, J. The Phenotypic Approach to Osteoarthritis: A Look at Metabolic Syndrome-Associated Osteoarthritis. Jt. Bone Spine 2019, 86, 725–730. [Google Scholar] [CrossRef]
- Esser, N.; Legrand-Poels, S.; Piette, J.; Scheen, A.J.; Paquot, N. Inflammation as a link between obesity, metabolic syndrome and type 2 diabetes. Diabetes Res. Clin. Pr. 2014, 105, 141–150. [Google Scholar] [CrossRef]
- Gandhi, R.; Takahashi, M.; Smith, H.; Rizek, R.; Mahomed, N.N. The synovial fluid adiponectin-leptin ratio predicts pain with knee osteoarthritis. Clin. Rheumatol. 2010, 29, 1223–1228. [Google Scholar] [CrossRef] [PubMed]
- Kawasaki, Y.; Zhang, L.; Cheng, J.K.; Ji, R.R. Cytokine mechanisms of central sensitization: Distinct and overlapping role of interleukin-1beta, interleukin-6, and tumor necrosis factor-alpha in regulating synaptic and neuronal activity in the superficial spinal cord. J. Neurosci. 2008, 28, 5189–5194. [Google Scholar] [CrossRef] [PubMed]
- Schaible, H.G. Nociceptive neurons detect cytokines in arthritis. Arthritis Res. Ther. 2014, 16, 470. [Google Scholar] [CrossRef] [PubMed]
- Suokas, A.K.; Walsh, D.A.; McWilliams, D.F.; Condon, L.; Moreton, B.; Wylde, V.; Arendt-Nielsen, L.; Zhang, W. Quantitative sensory testing in painful osteoarthritis: A systematic review and meta-analysis. Osteoarthr. Cartil. 2012, 20, 1075–1085. [Google Scholar] [CrossRef]
- Woolf, C.J. Central sensitization: Implications for the diagnosis and treatment of pain. Pain 2011, 152, S2–S15. [Google Scholar] [CrossRef] [PubMed]
- Moher, D.; Liberati, A.; Tetzlaff, J.; Altman, D.G.; Group, P. Reprint--preferred reporting items for systematic reviews and meta-analyses: The PRISMA statement. Phys. Ther. 2009, 89, 873–880. [Google Scholar] [CrossRef]
- Ouzzani, M.; Hammady, H.; Fedorowicz, Z.; Elmagarmid, A. Rayyan-a web and mobile app for systematic reviews. Syst. Rev. 2016, 5, 210. [Google Scholar] [CrossRef] [PubMed]
- Kwaliteitsinstituut voor de Gezondheidszorg CBO. Evidence-Based Richtlijnontwikkeling. Handleiding Voor Werkgroepleden; Kwaliteitsinstituut voor de Gezondheidszorg CBO: Utrecht, The Netherlands, 2007. [Google Scholar]
- Lampe, F.; Fiedler, F.; Marques, C.J.; Sufi-Siavach, A.; Matziolis, G. Surgically modifiable factors measured by computer-navigation together with patient-specific factors predict knee society score after total knee arthroplasty. BMC Musculoskelet. Disord. 2016, 17, 78. [Google Scholar] [CrossRef]
- Lampe, F.; Marques, C.J.; Fiedler, F.; Sufi-Siavach, A.; Carita, A.I.; Matziolis, G. Patient-specific and intra-operatively modifiable factors assessed by computer navigation predict maximal knee flexion one year after TKA. Knee Surg. Sport Traumatol. Arthrosc. 2016, 24, 3457–3465. [Google Scholar] [CrossRef]
- Cooper, N.A.; Rakel, B.A.; Zimmerman, B.; Tonelli, S.M.; Herr, K.A.; Clark, C.R.; Noiseux, N.O.; Callaghan, J.J.; Sluka, K.A. Predictors of multidimensional functional outcomes after total knee arthroplasty. J. Orthop. Res. 2017, 35, 2790–2798. [Google Scholar] [CrossRef] [PubMed]
- Nunez, M.; Lozano, L.; Nunez, E.; Sastre, S.; del Val, J.L.; Suso, S. Good Quality of Life in Severely Obese Total Knee Replacement Patients: A Case-Control Study. Obes. Surg. 2011, 21, 1203–1208. [Google Scholar] [CrossRef] [PubMed]
- Amusat, N.; Beaupre, L.; Jhangri, G.S.; Pohar, S.L.; Simpson, S.; Warren, S.; Jones, C.A. Diabetes that impacts on routine activities predicts slower recovery after total knee arthroplasty: An observational study. J. Physiother. 2014, 60, 217–223. [Google Scholar] [CrossRef] [PubMed]
- Abd Razak, H.R.B.; Tan, C.S.; Chen, Y.J.D.; Pang, H.N.; Tay, K.J.D.; Chin, P.L.; Chia, S.L.; Lo, N.N.; Yeo, S.J. Age and Preoperative Knee Society Score Are Significant Predictors of Outcomes Among Asians Following Total Knee Arthroplasty. J. Bone Jt. Surg 2016, 98, 735–741. [Google Scholar] [CrossRef] [PubMed]
- Bonnefoy-Mazure, A.; Martz, P.; Armand, S.; Sagawa, Y.; Suva, D.; Turcot, K.; Miozzari, H.H.; Lubbeke, A. Influence of Body Mass Index on Sagittal Knee Range of Motion and Gait Speed Recovery 1-Year After Total Knee Arthroplasty. J. Arthroplast. 2017, 32, 2404–2410. [Google Scholar] [CrossRef]
- Cankaya, D.; Cakir, Y.; Yoldas, B.; Toprak, A.; Tabak, Y. The influence of social and demographic features on functional level and quality of life after total knee arthroplasty. Turk. J. Phys. Med. Rehabil./Turk. Fiz. Tip Ve Rehabil. Derg 2016, 62, 257–263. [Google Scholar] [CrossRef]
- Clement, N.D.; MacDonald, D.; Burnett, R.; Breusch, S.J. Diabetes does not influence the early outcome of total knee replacement: A prospective study assessing the Oxford knee score, short form 12, and patient satisfaction. Knee 2013, 20, 437–441. [Google Scholar] [CrossRef]
- Collins, J.E.; Donnell-Fink, L.A.; Yang, H.D.Y.; Usiskin, I.M.; Lape, E.C.; Wright, J.; Katz, J.N.; Losina, E. Effect of Obesity on Pain and Functional Recovery Following Total Knee Arthroplasty. J. Bone Jt. Surg. 2017, 99, 1812–1818. [Google Scholar] [CrossRef]
- Collins, R.A.; Walmsley, P.J.; Amin, A.K.; Brenkel, I.J.; Clayton, R.A. Does obesity influence clinical outcome at nine years following total knee replacement? J. Bone Jt. Surg. Br. 2012, 94, 1351–1355. [Google Scholar] [CrossRef]
- de Leeuw, J.M.; Villar, R.N. Obesity and quality of life after primary total knee replacement. Knee 1998, 5, 119–123. [Google Scholar] [CrossRef]
- Deshmukh, R.G.; Hayes, J.H.; Pinder, I.M. Does body weight influence outcome after total knee arthroplasty? A 1-year analysis. J. Arthroplast. 2002, 17, 315–319. [Google Scholar] [CrossRef]
- Dettoni, F.; Maistrelli, G.L.; Stojimirovic, D.; Bonasia, D.E.; Rosso, F.; Cottino, U.; Rossi, R. Obesity and size of the implant influence the early outcome after total knee arthroplasty. Minerva Ortop. E Traumatol. 2018, 69, 39–43. [Google Scholar] [CrossRef]
- Gandhi, R.; Dhotar, H.; Razak, F.; Tso, P.; Davey, J.R.; Mahomed, N.N. Predicting the longer term outcomes of total knee arthroplasty. Knee 2010, 17, 15–18. [Google Scholar] [CrossRef]
- Gandhi, R.; Razak, F.; Davey, J.R.; Mahomed, N.N. Metabolic syndrome and the functional outcomes of hip and knee arthroplasty. J. Rheumatol. 2010, 37, 1917–1922. [Google Scholar] [CrossRef] [PubMed]
- Gandhi, R.; Santone, D.; Takahashi, M.; Dessouki, O.; Mahomed, N.N. Inflammatory predictors of ongoing pain 2 years following knee replacement surgery. Knee 2013, 20, 316–318. [Google Scholar] [CrossRef] [PubMed]
- Giesinger, J.M.; Loth, F.L.; MacDonald, D.J.; Giesinger, K.; Patton, J.T.; Simpson, A.; Howie, C.R.; Hamilton, D.F. Patient-reported outcome metrics following total knee arthroplasty are influenced differently by patients' body mass index. Knee Surg. Sport Traumatol. Arthrosc. 2018, 26, 3257–3264. [Google Scholar] [CrossRef]
- Giordano, R.; Petersen, K.K.; Andersen, H.H.; Lichota, J.; Valeriani, M.; Simonsen, O.; Arendt-Nielsen, L. Preoperative serum circulating microRNAs as potential biomarkers for chronic postoperative pain after total knee replacement. Mol. Pain 2020, 16, 1744806920962925. [Google Scholar] [CrossRef]
- Hakim, J.; Volpin, G.; Amashah, M.; Alkeesh, F.; Khamaisy, S.; Cohen, M.; Ownallah, J. Long-term outcome of total knee arthroplasty in patients with morbid obesity. Int. Orthop. 2020, 44, 95–104. [Google Scholar] [CrossRef] [PubMed]
- Jarvenpaa, J.; Kettunen, J.; Soininvaara, T.; Miettinen, H.; Kroger, H. Obesity has a negative impact on clinical outcome after total knee arthroplasty. Scand. J. Surg. 2012, 101, 198–203. [Google Scholar] [CrossRef] [PubMed]
- Jauregui, J.J.; Issa, K.; Cherian, J.J.; Harwin, S.F.; Given, K.; Mont, M.A. Evaluation of 5-Year Trends in Knee Society Scores Stratified by Comorbidities: A Prospective, Longitudinal Study. J. Knee Surg. 2016, 29, 84–89. [Google Scholar] [CrossRef]
- Lamb, S.E.; Frost, H. Recovery of mobility after knee arthroplasty—Expected rates and influencing factors. J. Arthroplast. 2003, 18, 575–582. [Google Scholar] [CrossRef] [PubMed]
- Li, W.; Ayers, D.C.; Lewis, C.G.; Bowen, T.R.; Allison, J.J.; Franklin, P.D. Functional Gain and Pain Relief After Total Joint Replacement According to Obesity Status. J. Bone Jt. Surg. Am. 2017, 99, 1183–1189. [Google Scholar] [CrossRef] [PubMed]
- Lizaur-Utrilla, A.; Miralles-Munoz, F.A.; Sanz-Reig, J.; Collados-Maestre, I. Cementless total knee arthroplasty in obese patients: A prospective matched study with follow-up of 5-10 years. J. Arthroplast. 2014, 29, 1192–1196. [Google Scholar] [CrossRef] [PubMed]
- McQueen, D.A.; Long, M.J.; Algotar, A.M.; Schurman, J.R., 2nd; Bangalore, V.G. The effect of obesity on quality-of-life improvement after total knee arthroplasty. Am. J. Orthop. 2007, 36, E117–E127. [Google Scholar]
- Merle-Vincent, F.; Couris, C.M.; Schott, A.M.; Conrozier, T.; Piperno, M.; Mathieu, P.; Vignon, E. Factors predicting patient satisfaction 2 years after total knee arthroplasty for osteoarthritis. Jt. Bone Spine 2011, 78, 383–386. [Google Scholar] [CrossRef]
- Nunez, M.; Nunez, E.; del Val, J.L.; Ortega, R.; Segur, J.M.; Hernandez, M.V.; Lozano, L.; Sastre, S.; Macule, F. Health-related quality of life in patients with osteoarthritis after total knee replacement: Factors influencing outcomes at 36 months of follow-up. Osteoarthr. Cartil. 2007, 15, 1001–1007. [Google Scholar] [CrossRef]
- Overgaard, A.; Lidgren, L.; Sundberg, M.; Robertsson, O.; W-Dahl, A. Patient-reported 1-year outcome not affected by body mass index in 3327 total knee arthroplasty patients. Acta Orthop. 2019, 90, 360–365. [Google Scholar] [CrossRef]
- Paterson, K.L.; Sosdian, L.; Bennell, K.L.; Metcalf, B.R.; Wrigley, T.V.; Kasza, J.; Dowsey, M.M.; Choong, P.F.; Hinman, R.S. The influence of sex and pre-operative obesity on biomechanics two years after total knee arthroplasty: A longitudinal cohort study. Gait Posture 2020, 76, 74–84. [Google Scholar] [CrossRef]
- Paxton, E.W.; Torres, A.; Love, R.M.; Barber, T.C.; Sheth, D.S.; Inacio, M.C. Total joint replacement: A multiple risk factor analysis of physical activity level 1–2 years postoperatively. Acta Orthop. 2016, 87 (Suppl. S1), 44–49. [Google Scholar] [CrossRef]
- Petersen, K.K.; Arendt-Nielsen, L.; Vela, J.; Skou, S.T.; Eld, M.; Al-Mashkur, N.M.; Boesen, M.; Riis, R.G.C.; Simonsen, O. Less Severe Preoperative Synovitis is Associated with Higher Self-reported Pain Intensity 12 Months after Total Knee Arthroplasty-an Exploratory Prospective Observational Study. Clin. J. Pain 2020, 36, 34–40. [Google Scholar] [CrossRef]
- Pua, Y.H.; Poon, C.L.; Seah, F.J.; Thumboo, J.; Clark, R.A.; Tan, M.H.; Chong, H.C.; Tan, J.W.; Chew, E.S.; Yeo, S.J. Predicting individual knee range of motion, knee pain, and walking limitation outcomes following total knee arthroplasty. Acta Orthop. 2019, 90, 179–186. [Google Scholar] [CrossRef] [PubMed]
- Scott, C.E.; Oliver, W.M.; MacDonald, D.; Wade, F.A.; Moran, M.; Breusch, S.J. Predicting dissatisfaction following total knee arthroplasty in patients under 55 years of age. Bone Jt. J. 2016, 98, 1625–1634. [Google Scholar] [CrossRef] [PubMed]
- Steinhaus, M.E.; Buller, L.T.; Romero, J.A.; Lee, Y.Y.; Figgie, M.P.; McLawhorn, A.S. Body Mass Index Classification Is Independently Associated with Health-Related Quality of Life after Primary Total Knee Arthroplasty: An Institutional Registry-Based Study. J. Knee Surg. 2019, 33, 399–409. [Google Scholar] [CrossRef] [PubMed]
- Stevens-Lapsley, J.E.; Petterson, S.C.; Mizner, R.L.; Snyder-Mackler, L. Impact of body mass index on functional performance after total knee arthroplasty. J. Arthroplast. 2010, 25, 1104–1109. [Google Scholar] [CrossRef] [PubMed]
- Sveikata, T.; Porvaneckas, N.; Kanopa, P.; Molyte, A.; Klimas, D.; Uvarovas, V.; Venalis, A. Age, Sex, Body Mass Index, Education, and Social Support Influence Functional Results After Total Knee Arthroplasty. Geriatr. Orthop. Surg. Rehabil. 2017, 8, 71–77. [Google Scholar] [CrossRef] [PubMed]
- Tchetina, E.V.; Glemba, K.E.; Markova, G.A.; Naryshkin, E.A.; Taskina, E.A.; Makarov, M.A.; Lila, A.M. Development of Postoperative Pain in Patients with End-Stage Knee Osteoarthritis Is Associated with Upregulation of Genes Related to Extracellular Matrix Degradation, Inflammation, and Apoptosis Measured in the Peripheral Blood before Knee Surgery. Life 2020, 10, 224. [Google Scholar] [CrossRef]
- Teo, B.J.X.; Chong, H.C.; Yeo, W.; Tan, A.H.C. The Impact of Diabetes on Patient Outcomes After Total Knee Arthroplasty in an Asian Population. J. Arthroplast. 2018, 33, 3186–3189. [Google Scholar] [CrossRef]
- Torres-Claramunt, R.; Hinarejos, P.; Leal-Blanquet, J.; Sanchez-Soler, J.F.; Mari-Molina, R.; Puig-Verdie, L.; Monllau, J.C. Does Obesity Influence on the Functional Outcomes of a Total Knee Arthroplasty? Obes. Surg. 2016, 26, 2989–2994. [Google Scholar] [CrossRef]
- Zeni, J.A.; Snyder-Mackler, L. Preoperative Predictors of Persistent Impairments During Stair Ascent and Descent after Total Knee Arthroplasty. JBJS 2010, 92, 1130–1136. [Google Scholar] [CrossRef]
- Christensen, J.; Peters, C.; Gililland, J.; Stoddard, G.; Pelt, C. Physical activity, pain interference and comorbidities relate to PROMIS physical function in younger adults following total knee arthroplasty. Disabil. Rehabil. 2021, 43, 3741–3747. [Google Scholar] [CrossRef]
- Hodges, A.; Harmer, A.R.; Dennis, S.; Nairn, L.; March, L.; Crawford, R.; Parker, D.; Fransen, M. Prevalence and determinants of physical activity and sedentary behaviour before and up to 12 months after total knee replacement: A longitudinal cohort study. Clin. Rehabil. 2018, 32, 1271–1283. [Google Scholar] [CrossRef] [PubMed]
- Ayers, D.C.; Yousef, M.; Zheng, H.; Yang, W.Y.; Franklin, P.D. The Prevalence and Predictors of Patient Dissatisfaction 5-years Following Primary Total Knee Arthroplasty. J. Arthroplast. 2022, 37, S121–S128. [Google Scholar] [CrossRef] [PubMed]
- King, L.K.; Waugh, E.J.; Jones, C.A.; Bohm, E.; Dunbar, M.; Woodhouse, L.; Noseworthy, T.; Marshall, D.A.; Hawker, G.A. Comorbidities do not limit improvement in pain and physical function after total knee arthroplasty in patients with knee osteoarthritis: The BEST-Knee prospective cohort study. BMJ Open 2021, 11, e047061. [Google Scholar] [CrossRef] [PubMed]
- Mishra, A.K.; Vaish, A.; Vaishya, R. Effect of Body Mass Index on the outcomes of primary Total Knee Arthroplasty up to one year—A prospective study. J. Clin. Orthop. Trauma 2022, 27, 101829. [Google Scholar] [CrossRef] [PubMed]
- Rissolio, L.; Sabatini, L.; Risitano, S.; Bistolfi, A.; Galluzzo, U.; Massè, A.; Indelli, P.F. Is it the surgeon, the patient, or the device? A comprehensive clinical and radiological evaluation of factors influencing patient satisfaction in 648 total knee arthroplasties. J. Clin. Med. 2021, 10, 2599. [Google Scholar] [CrossRef]
- Sideris, A.; Malahias, M.A.; Birch, G.; Zhong, H.; Rotundo, V.; Like, B.J.; Otero, M.; Sculco, P.K.; Kirksey, M. Identification of biological risk factors for persistent postoperative pain after total knee arthroplasty. Reg. Anesth. Pain Med. 2022, 47, 161–166. [Google Scholar] [CrossRef] [PubMed]
- Zhang, S.Y.; Chong, M.R.; Lau, B.P.H.; Ng, Y.H.; Wang, X.Y.; Chua, W.L. Do Patients With Diabetes Have Poorer Improvements in Patient-Reported Outcomes After Total Knee Arthroplasty? J. Arthroplast. 2021, 36, 2486–2491. [Google Scholar] [CrossRef]
- Papatheodorou, K.; Banach, M.; Bekiari, E.; Rizzo, M.; Edmonds, M. Complications of Diabetes 2017. J. Diabetes Res. 2018, 2018, 3086167. [Google Scholar] [CrossRef]
- Petersen, K.K.; Graven-Nielsen, T.; Simonsen, O.; Laursen, M.B.; Arendt-Nielsen, L. Preoperative pain mechanisms assessed by cuff algometry are associated with chronic postoperative pain relief after total knee replacement. Pain 2016, 157, 1400–1406. [Google Scholar] [CrossRef]
- Bali, K.K.; Kuner, R. Noncoding RNAs: Key molecules in understanding and treating pain. Trends Mol. Med. 2014, 20, 437–448. [Google Scholar] [CrossRef]
- Zhao, J.; Lee, M.C.; Momin, A.; Cendan, C.M.; Shepherd, S.T.; Baker, M.D.; Asante, C.; Bee, L.; Bethry, A.; Perkins, J.R.; et al. Small RNAs control sodium channel expression, nociceptor excitability, and pain thresholds. J. Neurosci. 2010, 30, 10860–10871. [Google Scholar] [CrossRef] [PubMed]
- Yang, B.; Kang, X.; Xing, Y.; Dou, C.; Kang, F.; Li, J.; Quan, Y.; Dong, S. Effect of microRNA-145 on IL-1beta-induced cartilage degradation in human chondrocytes. FEBS Lett. 2014, 588, 2344–2352. [Google Scholar] [CrossRef] [PubMed]
- Hu, G.; Zhao, X.; Wang, C.; Geng, Y.; Zhao, J.; Xu, J.; Zuo, B.; Zhao, C.; Wang, C.; Zhang, X. MicroRNA-145 attenuates TNF-alpha-driven cartilage matrix degradation in osteoarthritis via direct suppression of MKK4. Cell Death Dis. 2017, 8, e3140. [Google Scholar] [CrossRef] [PubMed]

Disclaimer/Publisher’s Note: The statements, opinions and data contained in all publications are solely those of the individual author(s) and contributor(s) and not of MDPI and/or the editor(s). MDPI and/or the editor(s) disclaim responsibility for any injury to people or property resulting from any ideas, methods, instructions or products referred to in the content. |
© 2023 by the authors. Licensee MDPI, Basel, Switzerland. This article is an open access article distributed under the terms and conditions of the Creative Commons Attribution (CC BY) license (https://creativecommons.org/licenses/by/4.0/).