Abstract
Shift work requires round-the-clock readiness to perform professional duties, and the workers’ performance highly depends on their sleepiness level, which can be underestimated during a shift. Various factors, including the time of day, can influence sleepiness in shift workers. The objective of this study was to explore the dynamics of sleepiness-related conditions assessed through heart rate variability analysis, starting from the biological evening and continuing in vivo (at home), without the need for artificial alertness support. The participants solely performed regular evening household duties. A total of 32 recordings were collected from the Subjective Sleepiness Dynamics Dataset for analysis. At 8:00 p.m. and every 30 min thereafter, the participants completed cyclic sleepiness scales (the KSS and the SSS) until the time they went to bed, while their heart rate was recorded. The results of the study indicated that during the biological evening, high sleepiness is associated with a ‘stressed’ condition characterized by higher sympathetic activation. Later on, it is associated with a ‘drowsy’ condition characterized by higher parasympathetic activation and a decline in heart rate variability. Our findings provide evidence that the type of condition experienced during high sleepiness depends on the biological time. This should be taken into account when managing work regimes in shift work and developing alertness detectors.
1. Introduction
There are numerous professions that require round-the-clock readiness to perform duties. They are usually organized as shift work. In most cases, shift work involves professional activities not only during the day but also in the evening and at night. It is worth noting that shift work is often used in emergency response services and in complex industries where a high level of worker vigilance is important to eliminate errors due to human factors. Research shows that there are differences in a person’s conditions during day and night shifts [1,2,3].
These differences are associated with the natural dynamics of sleepiness levels throughout the day: regardless of sleep time, sleepiness gradually decreases in the morning and gradually increases towards the evening, reaching its peak at night [4,5]. Sleepiness is defined as a natural biological function determined by the likelihood of falling asleep [6] and the tendency to doze off or fall asleep when a person intends to be awake [7]. Subjective sleepiness is usually measured using the Stanford Sleepiness Scale (SSS) [8] and the Karolinska Sleepiness Scale (KSS) [9].
Increased sleepiness is associated with the occurrence of critical errors in activity, including those leading to accidents, such as driving a car [10]. During the study of a person’s conditions during night shifts, a decrease in psychomotor vigilance [2] and sensitivity to visual search [11] has been identified. This suggests that peaks and dips in subjective sleepiness ratings coincide with objective indicators of impaired performance [12]. Night shifts have been shown to result in decreased productivity, manifested by increased reaction time [1] and an increase in serious errors [3]. Similar trends persist across different professions: helicopter pilots [13], fishermen [3], healthcare workers [2,11], and metallurgists [1]. Subjective vigilance and neurobehavioral indicators are also impaired in simulated night shift conditions [14]. Subjective sleepiness is associated with a loss of productivity: subjective sleepiness levels increased 2–3 h before a loss of performance and 4–6 h before physiological sleepiness signs [15].
Various factors can influence sleepiness in shift workers. In a night schedule, there is a tendency for maximum levels of subjective sleepiness and low subjective vigilance on the first night of work [1,11,13]. However, other studies show that on subsequent nights, participants were unable to detect a decrease in vigilance, although objective factors indicated its loss [2]. The environment in which people are situated also affects their condition. For example, sleepiness and physical fatigue levels in fishermen were dependent on the nature of the vessel’s movement [3], and regulating the level of illumination helped shift the timing of the steady urge to sleep [14]. Age is also a significant factor: in drowsy conditions, elderly drivers did not increase the number of errors as much as young drivers, who were 11 times more likely to be involved in dangerous situations leading to accidents compared to when they were alert [10]. Another important factor is the time of day. The evening serves as a natural transitional time between low and high sleepiness and, therefore, performance levels [5]. Thus, this period of the day allows for the observation and identification of markers indicating transitions between different conditions. This can provide data for optimizing work and rest schedules in accordance with the tasks and internal regulations of each industry, where employee performance is crucial due to the high cost of human errors [2].
One of the common solutions related to monitoring a person’s condition is the use of technologies that involve the collection and analysis of heart-related data. Portable wearable sensors allow for the recording of electrocardiographic signals and provide insights into a person’s condition [16]. The advantage of methods related to heart activity monitoring in assessing a person’s condition lies in their greater accuracy in detection, as they directly analyze physiological indicators. Moreover, modern solutions based on wearable sensors enable conducting long-term studies in natural activity settings, such as during emergency response training [17], heavy industry work [18], and investigating occupational stress among healthcare personnel during their work shifts [19].
Various heart rate variability (HRV) indices are calculated in studies focusing on sleepiness or drowsiness, including those in the time, frequency, and non-linear domains. The latter ones are employed in applied research to develop fatigue detectors [20] or drowsiness detectors [21]. A significant portion of research is conducted within the context of driving tasks. During simulated driving [22,23] and real driving situations [23], the variance in HRV in the low-frequency (LF) to high-frequency band (HF) ratio (i.e., the sympatho-vagal index) was lower in drowsy conditions compared to awake conditions, as detected by an external observer. In a study involving continuous and monotonous driving, fatigue was accompanied by a decrease in the LH to HF ratio [24]. However, other studies have reported inverse patterns. Resisting sleep to maintain the driving task resulted in an increase in the LH to HF ratio [25]. In a highway driving task characterized by a monotonous environment and a constant speed, a positive correlation was found between the LH to HF ratio and subjective sleepiness (as measured by the KSS) [26]. The inconsistencies in the results of different studies can be attributed to variations in experimental protocols, leading to different intentions and motivations among the subjects. According to a hypothetical classification of subject conditions based on LF and HF power band analysis [23], a high intent to stay awake during sleepiness may result in a ‘stressed’ condition, characterized by high LF band power and low HF band power. Consequently, this leads to high sympatho-vagal index values (LF to HF ratio).
The aforementioned logic aligns with the perspective that sleep deprivation acts as a stressor [27] and that the intention to perform activities requires heightened sympathetic activation [28,29] and reduced parasympathetic activation [29]. Sleep deprivation, whether partial or total, is a commonly employed protocol in the study of sleepiness, drowsiness, and fatigue.
During a partial sleep deprivation period, where participants slept only 3 h per day while carrying out their daily activities, measures of cardiac parasympathetic activity such as square root of the mean of the sum of the squares of differences between adjacent NN intervals (rMSSD) and HF band power decreased, while KSS scores and normalized LF band power increased over a span of three days [30]. In a 40-h study involving total sleep deprivation, KSS scores, standard deviation of the NN intervals (SDNN), variance in HRV in the very low-frequency band (VLF), and LF were positively correlated with vigilance lapses in the Psychomotor Vigilance Test (PVT) [31]. Hence, in a condition of diminished vigilance, LF was higher. This observation suggests that participants exhibited a strong motivation to mobilize themselves, leading to heightened sympathetic activation and a ‘stressed’ condition [23]. This proposition finds support in the results of another study [32], where the authors found a positive correlation between LF to HF ratio and subjective alertness within the first 13 h of sleep deprivation, and a positive correlation with PVT reaction time (indicating a decline in performance) within 14–43 h of sleep deprivation. Regardless, high motivation and the desire to appear alert result in an increased sympatho-vagal index. However, after an extended period of sleep deprivation (14 h or more), the body may lack the necessary resources to sustain optimal performance.
In a separate study involving shift work with an average duration of 13.8 h among wildland firefighters, inverse correlations were identified between HRV (rMSSD) and sleepiness and fatigue [33]. Therefore, heightened subjective sleepiness was associated with reduced parasympathetic activation, indicating that attempting to work under conditions of sleepiness primarily leads to increased sympathetic activation rather than parasympathetic activation (prior to the ‘critical’ 14-h sleep deprivation period).
Shift work involves working outside the typical daytime hours of approximately 8 a.m. to 6 p.m., which disrupts normal circadian rhythms [34]. During work shifts, individuals may strive to maintain alertness artificially, depleting their resources. However, motivation to remain alert during a work shift is always present, even though resources are finite. Hence, it is crucial to examine the body’s functioning outside the explicit motivation to stay alert, specifically in a natural environment when individuals voluntarily construct their evening routines (outside of work shifts). In work shift scenarios, individuals may unknowingly underestimate their subjective sleepiness, as they believe they are alert, potentially skewing the results of sleepiness-related studies. By investigating the body’s performance at different time points in the evening in relation to varying levels of subjective sleepiness, we can obtain more objective data about performance at different sleepiness levels. If the study is conducted at home, without the influence of an experimenter, there is less inclination to distort the assessment of sleepiness.
To conduct such a study, it is needed to choose an experimental timeline. Shift work encompasses any work conducted outside the standard daytime hours of approximately 8 a.m. to 6 p.m. [35], and it is widely acknowledged that shift work disrupts the circadian system [34]. Within the circadian rhythm framework, two distinct stages can be identified: daytime (6 a.m.–8 p.m.) and nighttime (8 p.m.–6 a.m.) [36], separated by the transitional point of the biological evening, occurring around 8 p.m. [37,38,39]. Thus, 8 p.m. can be considered as the time when the body transitions from an active to a passive regime. Considering the definition of shift work mentioned earlier [35], it can be inferred that shift workers frequently engage in their professional activities at 8 p.m. Despite the fact that shift work may result in sleep-related disorders and negative health outcomes [40], shift work does not alter the ‘internal circadian machinery’ [41].
We proposed a hypothesis that at the end of the biological daytime period (around 8 P.M.), the intention to resist sleepiness requires increased sympathetic activation. Conversely, after a biological evening, high sleepiness should be accompanied by parasympathetic activation, as the circadian system allows the body not to resist sleepiness. Building upon Vicente’s et al. (2016) hypothesis regarding four conditions based on the distribution of LF and HF band powers (‘drowsy,’ ‘fatigued,’ ‘awake,’ and ‘stressed’), we argue that high subjective sleepiness during the biological evening should activate the ‘stressed’ condition, while later, high sleepiness should lead to the ‘drowsy’ condition.
The objective of this study was to explore the dynamics of sleepiness-related conditions, starting from the biological evening and continuing at home, without the need for artificial alertness support, i.e., solely performing regular evening household duties.
2. Materials and Methods
2.1. Study Sample
Recordings for analysis were collected from the Subjective Sleepiness Dynamics Dataset (SSDD [42]). By the time of this paper’s preparation, the total count of participants in the SSDD was equal to 226. One of the inclusion criteria was that people worked on the day of the experiment from 8 a.m. to 6 p.m. or from 9 a.m. to 7 p.m. These were individuals whose professional duties primarily involved computer work and interacting with people outside the home, without significant physical exertion.
Since we wanted to minimize the influence of the factor of going to sleep time, only those participants’ recordings were selected who went to bed between 10:30 p.m. and 11:00 p.m. Also, we selected only those recordings where the time of cyclic tests (the KSS and the SSS) filling out differed no more than 15 min at each time point from the needed time (08:00 p.m., 08:30 p.m., 09:00 p.m., 09:30 p.m., and 10:00 p.m.). And the last criterion was the quality of heart rate data. We selected only those recordings where there was at least a 4 min breakless heart rate recording at each time of cyclic tests. Finally, for the purpose of the current study, 32 recordings from the SSDD were collected for the analysis. All 32 recordings were collected in November–December 2023, and these participants reside in the same region.
As there were 32 selected participants, and each of them had heart rate metrics and KSS/SSS scores for five time points, the entire dataset for analysis consisted of 32 × 5 = 160 observations. During the analysis of the research results, grouping and selection of observations were applied based on time and the level of subjective sleepiness, as indicated in the relevant sections of Section 3.
2.2. Apparatus and Web Application
To collect sociodemographic information and data on sleepiness, a web application UnnCyberpsy was developed. UnnCyberpsy was developed using the PHP programming language and was based on the modern microframework ‘CodeIgniter’ version 4 (British Columbia Institute of Technology, British Columbia, Canada). MariaDB RDBMS was selected as the tool for data storage.
For recording the sequence of heart rate intervals, the Polar H10 sensor (Polar Electro Oy, Kempele, Finland), along with the Pro Strap belt (Polar Electro Oy, Kempele, Finland), was utilized. The validity of the Polar H10 sensor has been demonstrated in several studies (e.g., [43,44]). The Polar Sensor Logger App v. 0.25 (Jukka Happonen, Helsinki, Finland), which is based on the Polar SDK, was installed on a Samsung A23 smartphone. This app was used to receive the signal via Bluetooth from the Polar H10 sensor. The collected data was stored on the smartphone and then transferred to a laptop for further analysis.
2.3. Study Design
To attract participants for the study, information about the planned research was sent to regional news portals. Interested individuals submitted applications through a Google Form, where they provided their contact information, age, and gender. Subsequently, the timing of their visit to the laboratory for equipment distribution and instructions was coordinated with the participants.
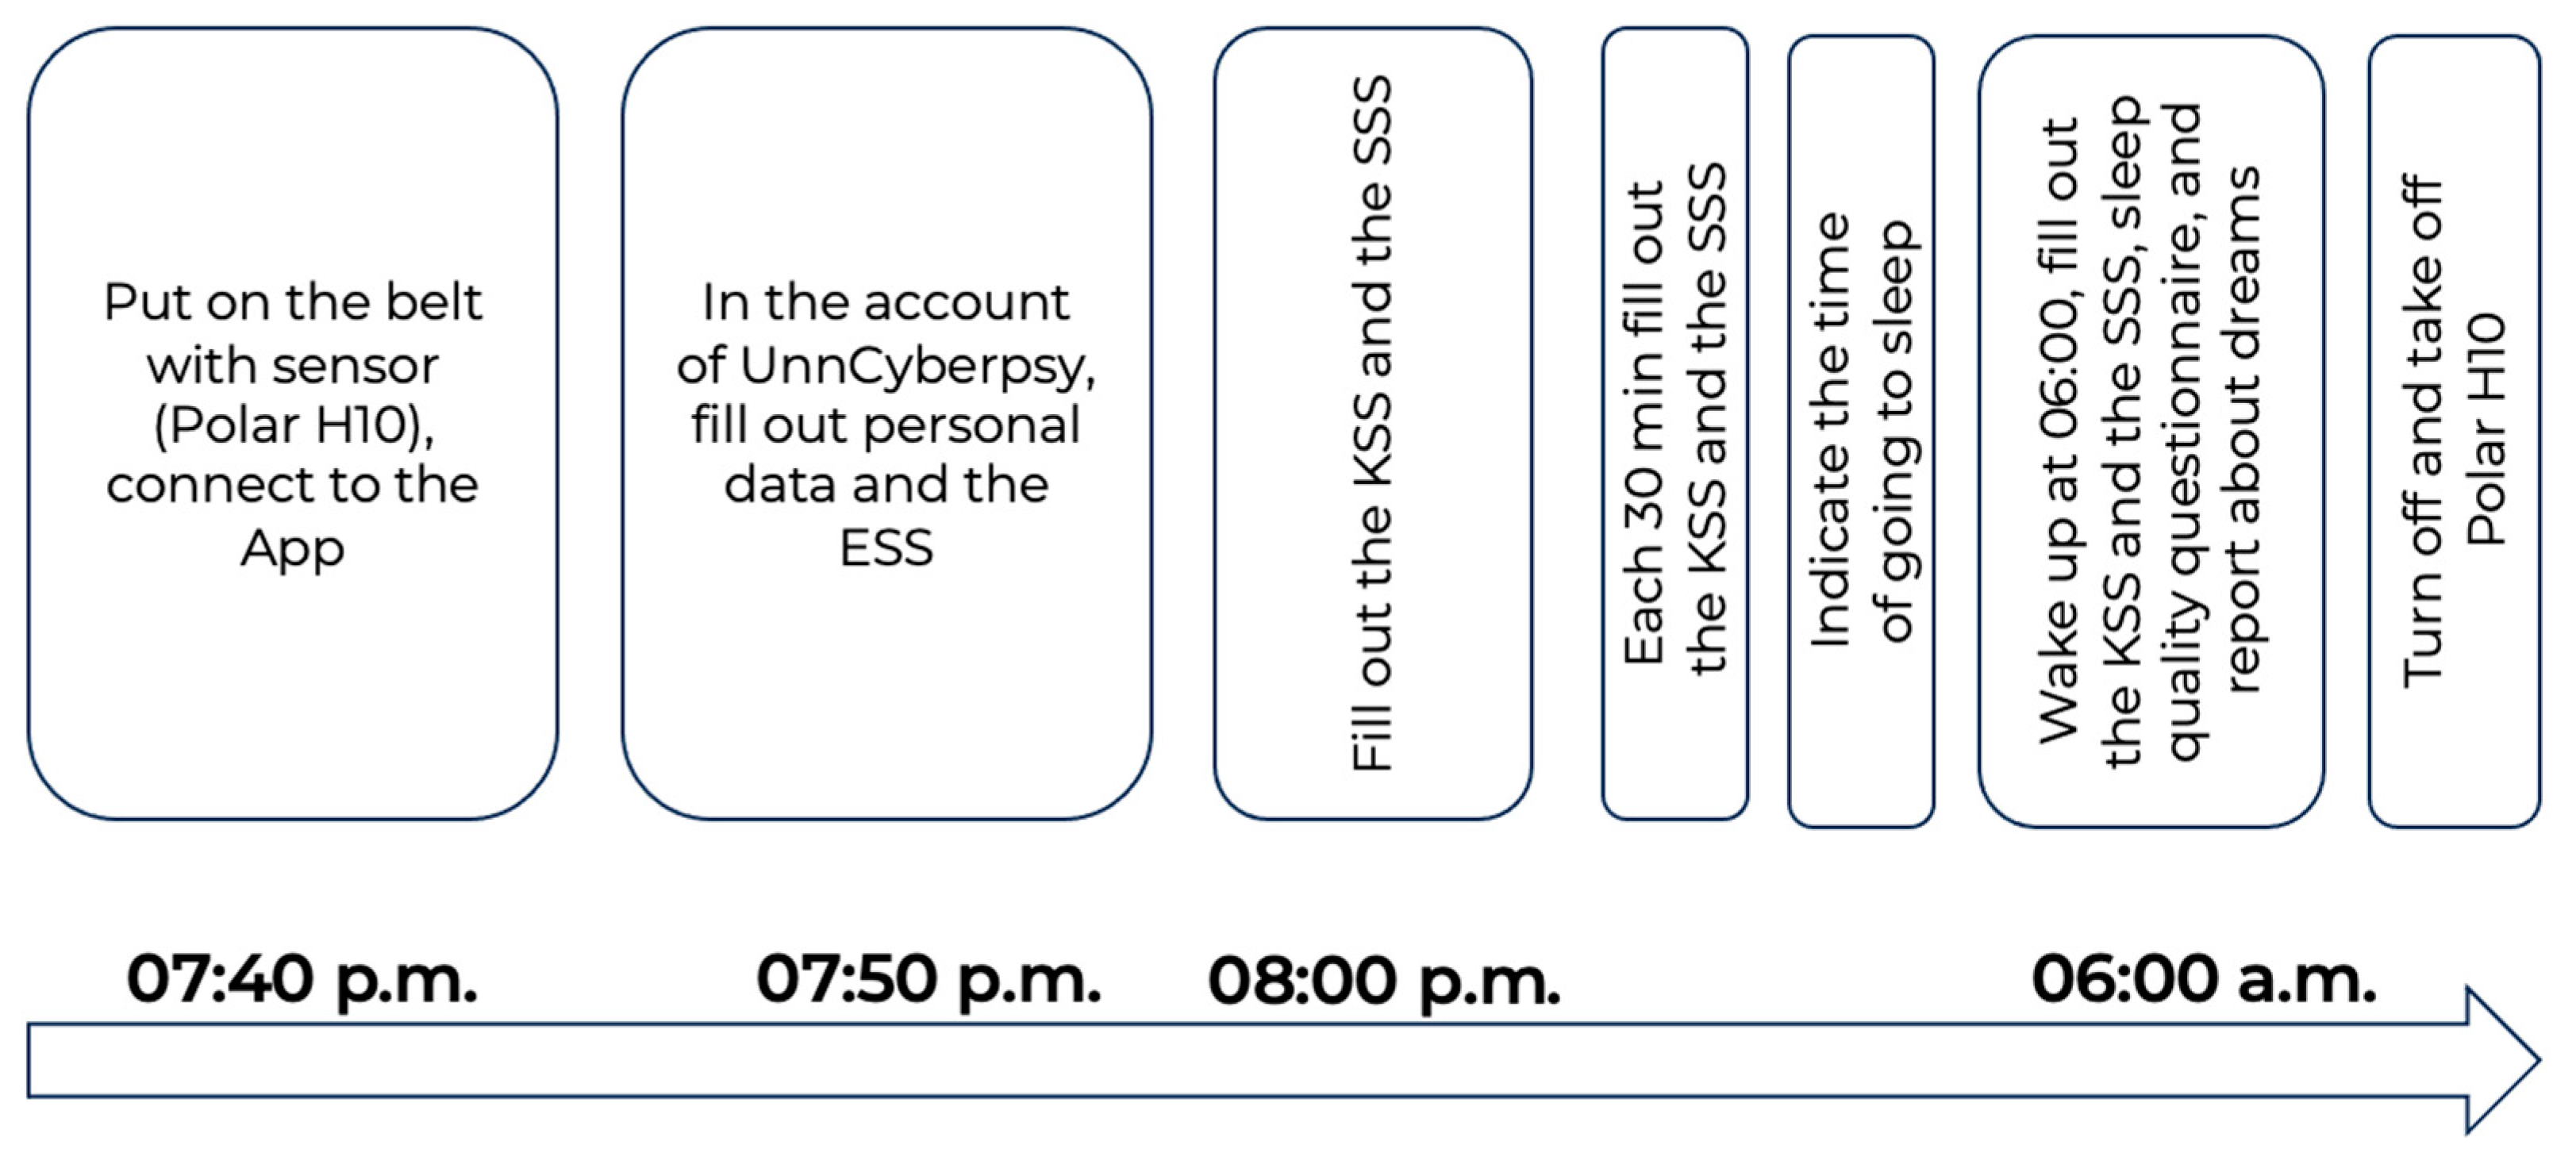
The full description of the study design is provided in [42] and demonstrated in Figure 1.
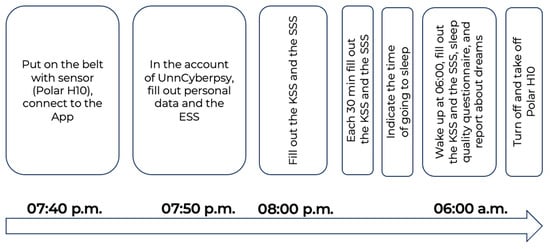
Figure 1.
Experimental design.
The participants connected the Polar H10 sensor to the Polar Sensor Logger App at 07:40 p.m. Then, they filled out personal information and some questionnaires. At 08:00 p.m., and each 30 min further, they filled out cyclic tests (the KSS and the SSS) until the time they went to bed. Participants of the study were instructed that after the start of the experiment, they should remain at home, carry out their regular household duties, and refrain from engaging in any physical exercises.
2.4. Data Analysis
Data was preprocessed in the Jupyter Notebook within the Anaconda 2020.07 (Python 3.8.3 64-bit) distribution (Anaconda Inc., Austin, TX, USA). For the purpose of data filtering, NN intervals with duration below 400 msec and above 1300 msec, as well as the ones differing more than 70% of the median of 5 intervals before were removed from the analysis. 4 min heart rate recordings (NN intervals) were selected for each time point for each participant. The ‘hrv-analysis’ module was used to calculate the time- (mean_nni, sdnn, sdsd, nni_50, pnni_50, nni_20, pnni_20, rmssd, median_nni, range_nni, cvsd, cvnni, mean_hr, max_hr, min_hr, std_hr) and frequency-domain metrics (lf, hf, lf_hf_ratio, lfnu, hfnu, total_power, vlf), as well as non-linear-domain ones (csi, cvi, Modified_csi, sampen), at each time point (08:00 p.m., 08:30 p.m., 09:00 p.m., 09:30 p.m., and 10:00 p.m.). The description of metrics is provided in Table A1 (Appendix A).
Statistical analysis was performed using the ‘scipy.stats’ module in the Jupyter Notebook. The independent t-test was used to assess differences in heart rate metrics between different levels of subjective sleepiness, as measured by the KSS and the SSS. The Mann-Whitney U test was used to assess differences in heart rate metrics between different levels of subjective sleepiness within different time points. The Pearson criterion was used to calculate the correlations between heart rate metrics and KSS and SSS scores at each time point. The choice of non-parametric criteria was justified by the small size of the subsamples, which were suitable for the selected statistical methods.
3. Results
3.1. General Data Description
Out of 32 participants, 24 were females. The detailed age–sex distribution of participants is presented in Table 1.

Table 1.
Age and sex distribution of the dataset.
Despite the fact that the sample was not balanced by age and sex, this did not contradict the purpose of the study as we wanted to examine some general effects of subjective sleepiness on heart rate data.
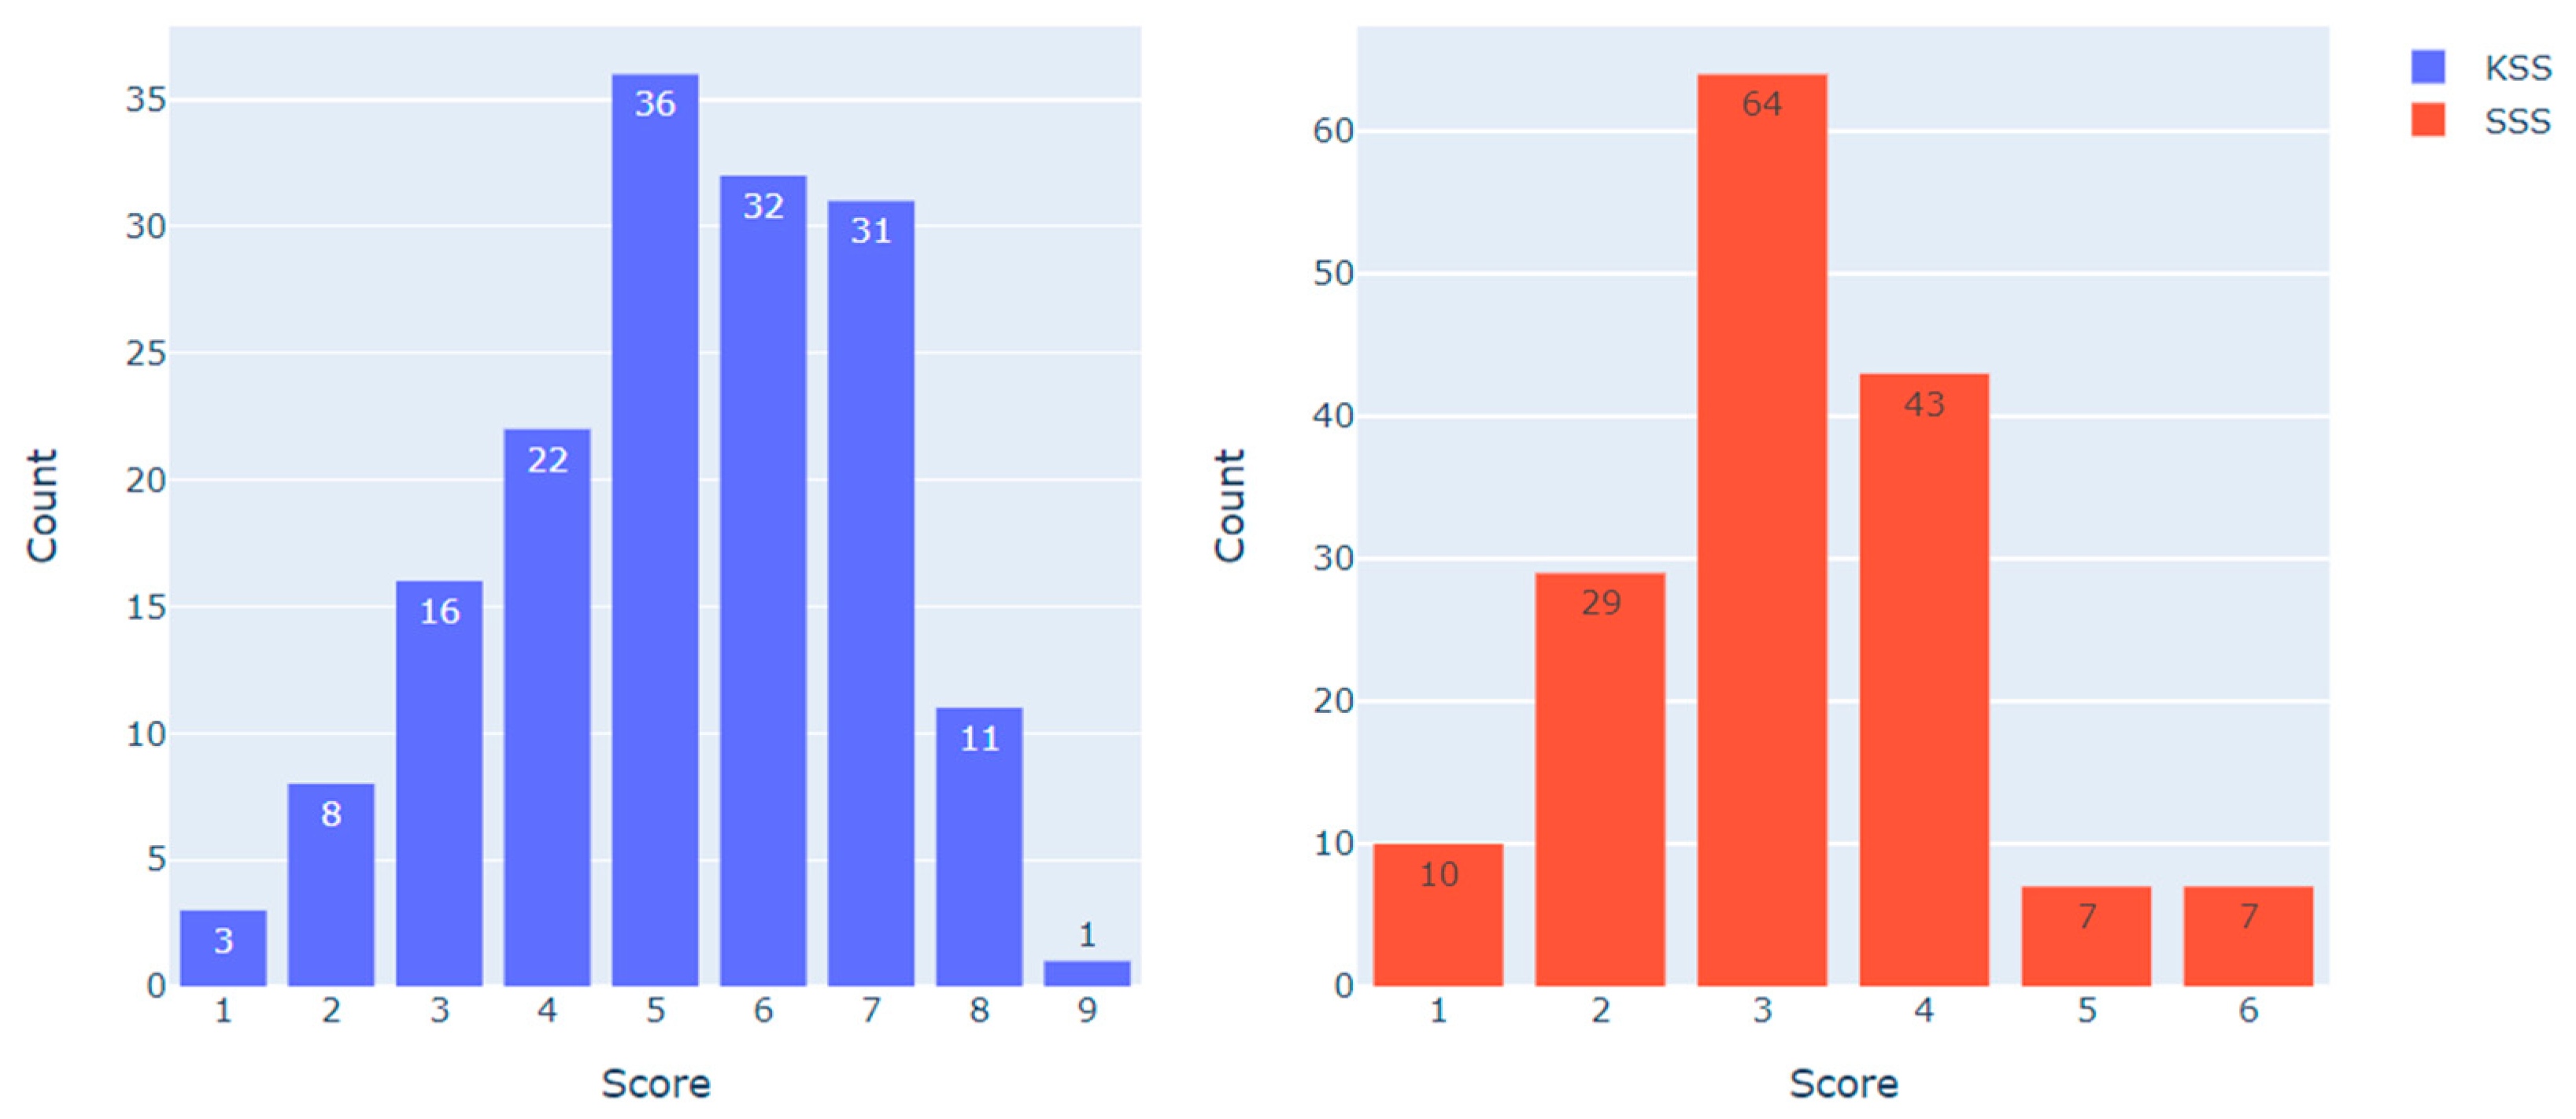
Figure 2 demonstrates the distribution of KSS and SSS scores in the dataset (N = 160).
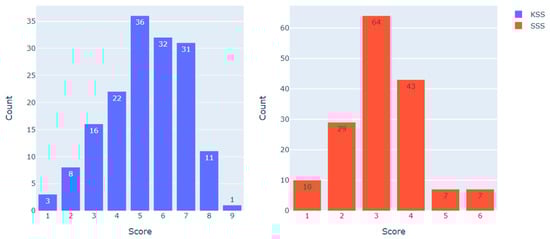
Figure 2.
KSS and SSS scores distribution in the dataset.
To examine the heart rate metrics associated with different scores on the KSS and the SSS, the following data sampling approach was employed. For the KSS, observations with less than 5 points (indicating ‘low’ sleepiness, N = 49) and more than 6 points (indicating ‘high’ sleepiness, N = 43) were compared. For the SSS, observations with less than 3 points (indicating ‘low’ sleepiness, N = 39) and more than 3 points (indicating ‘high’ sleepiness, N = 57) were compared. Observations with scores of 5–6 on the KSS (N = 68) and 3 on the SSS (N = 64) were excluded from the analysis, as they represented the category of ‘medium sleepiness’. The resulting distribution is presented in Table 2.
Table 2.
The distribution of selected observations according to time points and sleepiness levels.
3.2. Heart Rate Metrics Comparison in Different Levels of Subjective Sleepiness
First, we analyzed the difference in HRV metrics between ‘low’ and ‘high’ sleepiness, independent of time. These data were subsequently compared with the time-associated data.
Table 3 and Table 4 represent significant differences and trends found for heart rate metrics for the KSS and SSS, respectively.
Table 3.
Heart rate metrics mean values in different levels of subjective sleepiness, as measured by the KSS (t—the value of independent t-test, p—p-value).
Table 4.
Heart rate metrics mean values in different levels of subjective sleepiness, as measured by the SSS (t—the value of independent t-test, p—p-value).
The data presented in Table 3 indicate that there was a significant difference in nni_20 between ‘high’ and ‘low’ sleepiness (t = 2.37; p = 0.020), as assessed by the KSS. Additionally, certain trends were observed: nni_50 (t = 1.68; p = 0.097) and pnni_20 (t = 1.71; p = 0.091) showed lower values, while lf_hf_ratio (t = 1.69; p = 0.094) exhibited higher values in ‘high’ sleepiness compared to ‘low’ sleepiness.
The data presented in Table 4 indicate that the lf_hf_ratio was found to be higher in ‘high’ sleepiness compared to ‘low’ sleepiness (t = 2.03; p = 0.045), as measured by the SSS. Additionally, a trend towards lower nni_20 was observed for ‘high’ sleepiness compared to ‘low’ sleepiness (t = 1.89; p = 0.062).
3.3. Heart Rate Metrics Comparison in Different Levels of Subjective Sleepiness within Different Time Points
To further specify the characteristics of HRV metrics during ‘low’ and ‘high’ sleepiness, we conducted a comparative analysis taking into account the factor of time (at each time point: 08:00 p.m., 08:30 p.m., 09:00 p.m., 09:30 p.m., and 10:00 p.m.).
Significant differences and trends in heart rate metrics between ‘low’ and ‘high’ sleepiness were observed specifically at the 08:30 p.m. and 09:00 p.m. time points. Table 5 and Table 6 present the significant differences and trends identified for heart rate metrics at these specific time points for the KSS and SSS, respectively.
Table 5.
Heart rate metrics mean values in different levels of subjective sleepiness within time point 08:30 p.m., as measured by the KSS (U—the value of Mann-Whitney criterion, p—p-value).
Table 6.
Heart rate metrics in different levels of subjective sleepiness within time points 08:00 p.m. and 08:30 p.m., as measured by the SSS (U—the value of Mann-Whitney criterion, p—p-value).
The data presented in Table 5 indicate that at the 08:30 p.m. time point, heart rate variability metrics were lower in ‘high’ sleepiness, as measured by the KSS. Specifically, the minimum heart rate (min_hr) was higher in ‘high’ sleepiness (U = 12; p = 0.049). As for frequency domain metrics, lf (U = 5; p = 0.004), total_power (U = 2; p = 0.001), and vlf (U = 2; p = 0.001) appeared to be significantly lower in ‘high’ sleepiness. Additionally, the following trends were observed: lf_hf_ratio and lfnu were lower (U = 15; p = 0.095 for both), while hfnu was higher (U = 50; p = 0.095) in ‘high’ sleepiness. Significant differences were also found for non-linear domain metrics, with modified_csi and cvi being lower (U = 6; p = 0.007 for modified_csi, U = 9; p = 0.019 for cvi), and samplen being higher (U = 5; p = 0.004) in ‘high’ sleepiness.
Regarding the SSS, significant differences or trends were observed at two time points (08:00 p.m. and 08:30 p.m.), as shown in Table 6. At 08:00 p.m., only frequency domain metrics were found to be sensitive to the level of sleepiness: lf_hf_ratio (U = 28; p = 0.091) and lfnu (U = 28; p = 0.091) were higher, while hfnu (U = 28; p = 0.091) was lower in ‘high’ sleepiness. At 08:30 p.m., various domain metrics were identified as sensitive to the level of sleepiness. Total_power (U = 15; p = 0.027) and cvi (U = 4.49; p = 4.2) were lower in ‘high’ sleepiness. There was also a trend towards lower vlf values in ‘high’ sleepiness.
3.4. Heart Rate Metrics Correlations with Sleepiness Scores within Different Time Points
To conduct a more detailed analysis of the relationship between HRV metrics and subjective sleepiness, we performed a correlation analysis between them. No significant correlations were found for the whole dataset.
For a more in-depth exploration of the relationship between HRV metrics and subjective sleepiness, we examined their correlations at each of the time points. The results of correlation analysis within different time points are presented in Table 7.
Table 7.
Heart rate metrics significant correlations with KSS and SSS scores within different time points (p—p-value).
Thus, significant correlations were found only at 08:30 p.m. and at 09:00 p.m. At 08:30 p.m., range_nni was negatively correlated with KSS score (R = −0.392; p = 0.027) and with SSS score (R = −0.382; p = 0.031). KSS score was negatively correlated with lf (R = −0.350; p = 0.049), total_power (R = −0.357; p = 0.045), and vlf (R = −0.385; p = 0.029). At 09:00 p.m., hf was positively correlated with KSS score (R = 0.394; p = 0.026).
4. Discussion
Our data analysis revealed that during the biological evening (8 p.m.), only frequency domain metrics showed a tendency to differ between levels of subjective sleepiness. Specifically, lf and lfnu tended to be higher, while hfnu tended to be lower in ‘high’ sleepiness compared to ‘low’ sleepiness. In the introduction, we hypothesized that high subjective sleepiness during the biological evening would activate a ‘stressed’ condition because the body perceives this time as being awake. Resisting sleepiness at 8 p.m. would require self-control. The fact that only frequency domain metrics were correlated with sleepiness can be explained by previous findings that fMRI activity in brain regions, including the dorsolateral prefrontal cortex, is correlated with cardiovagal activity (HF) [45], and that stimulation of the dorsolateral prefrontal cortex affects muscle sympathetic nerve activity [46]. Moreover, the dorsolateral prefrontal cortex is involved in self-control [47]. Thus, our results indirectly support the idea that resisting sleepiness at 8 p.m. requires self-control. In ‘high’ sleepiness at 8 p.m., sympathetic activation (lhnu) increased, parasympathetic activation (fhnu) decreased, and the sympatho-vagal index (lf_hf_ratio) increased, indicating a ‘stressed’ condition [23].
Starting at 8:30 p.m. (after the biological evening), our analysis revealed that ‘high’ sleepiness was associated with a ‘drowsy’ condition [23]. Sympathetic activation (lf and lfnu) decreased, as did parasympathetic activation (hf and hfnu). Additionally, our results showed that at 8:30 p.m., ‘high’ subjective sleepiness was accompanied by lower time-domain metrics, indicating a decrease in heart rate variability. This finding is consistent with previous research linking reduced variability metrics to sleepiness, fatigue [33], and lack of vigilance [31]. Moreover, non-linear domain metrics (cvi, Modified_csi, and samplen) demonstrated sensitivity to the level of subjective sleepiness at 8:30 p.m., which is noteworthy as these metrics are seldom calculated in fundamental sleepiness research. For example, cvi has been observed to decrease during inhalant anesthesia and increase upon regaining consciousness [48], suggesting its association with metabolic demands [49]. Therefore, in our study, a decrease in cvi in ‘high’ sleepiness after the biological evening might indicate the unconscious body’s effort to perform vital functions. Similarly, Modified_csi, commonly used in detecting epileptic seizures [50,51], is considered an indicator of sympathetic ‘overdrive’ [52]. In our study, Modified_csi was lower in ‘high’ sleepiness after the biological evening, aligning with the decrease in lf. Furthermore, samplen, associated with poor performance during PVT [53], was higher in ‘high’ sleepiness after the biological evening, indicating reduced vigilance.
At 9:00 p.m., only the correlation analysis yielded significant results. Parasympathetic activation (hf) exhibited a positive correlation with the SSS score. This suggests that sympathetic activation had already decreased, and the increase in the ‘drowsy’ condition at 9:00 p.m. was primarily driven by an elevation in vagal activation. This finding can be utilized to further refine approaches that differentiate types of ‘drowsy’ conditions based on the level of parasympathetic activation, building upon Vincent et al.’s prior work [23].
After 9:00 p.m. until 10:00 p.m., no significant results were revealed, neither in correlation nor in differences analysis. Perhaps after 9:00 p.m., the participants transitioned to a nighttime regimen, and they were all sufficiently sleepy and prepared for falling asleep. In our previous study [42], we demonstrated that starting at 9:00 p.m., there was a significant increase in subjective sleepiness across all the SSDD. Other studies have reported similar sleepiness dynamics. A study of sleepiness dynamics in helicopter pilots showed a steady increase in subjective sleepiness after 8:00 p.m. (KSS) [13]. The level of subjective sleepiness in fishermen of different vessel types increased towards the evening [3]. The level of subjective sleepiness in fishermen of different types of vessels increased in the evening [54]. Thus, our suggestions and results align with the findings of other studies.
Within the current study, high sleepiness at 08:00 p.m. was considered as a ‘stressed’ condition and ‘high’ sleepiness at 08:30 p.m. and at 09:00 p.m. as a ‘drowsy’ condition. In Table 8, we accumulate the results of the current study by distinguishing heart rate metrics associated with ‘high’ sleepiness in ‘stressed’ and ‘drowsy’ conditions. These results should be taken into account while researching sleepiness, fatigue, or vigilance in shift workers.
Table 8.
Heart rate metrics dynamics related to ‘high’ subjective sleepiness in ‘stressed’ and ‘drowsy’ conditions.
Additionally, it is necessary to discuss the results of comparing heart rate metrics without considering the specific time points. The findings indicated a decrease in time-domain variability metrics and an increase in the sympatho-vagal index (lf_hf_ratio) in ‘high’ sleepiness. The observed dynamics of time-domain variability metrics align with those reported in other studies [31,33]. However, regarding the sympatho-vagal index, our results contradict the findings in [22,24] but support the results reported in [25,26]. This suggests that subjective sleepiness alone cannot fully describe the condition, and other domains, such as the circadian clock, should be considered in research on shift work conditions. Such a conclusion is supported by the evidence that drowsiness-related brain responses were affected by the time of the day [55]. For accurate and objective condition detection in shift workers, it is crucial to take into account circadian rhythms.
The obtained results could be utilized for the development of automated solutions to monitor the condition of shift workers. For the creation of precise algorithms, it’s important to take into account the biological time and the fact that high subjective sleepiness can be associated with different conditions—both ‘stressed’ and ‘drowsy’. We demonstrated that at 8 p.m., individuals are more resistant to sleepiness, and in such cases, high sleepiness is accompanied by a ‘stressed’ condition. Later, high sleepiness leads to a ‘drowsy’ condition, which involves different physiological correlates.
5. Limitations
The primary limitation of this study is linked to the small sample sizes used for comparative and correlational analysis within different time points. Nevertheless, we made an effort to address this limitation by employing non-parametric statistics. This study was exploratory, and in the future, we plan to incorporate a larger portion of data from the dataset to facilitate a more complex analysis.
Additionally, we intend to apply machine learning methods to develop a heartbeat-based drowsiness detector. We have not yet taken into account the types of professional activities of the selected participants in the study. However, we focused on those whose professional activities were similar in terms of activity levels.
Within our study, we divided our sample into sleepiness levels without relying on any pre-established classification. However, the decision to divide sleepiness based on KSS and SSS scores was made considering the distribution of the data. Our goal was to ensure a relatively equal count of ‘low’ and ‘high’ sleepiness data that would be suitable for analysis.
Another limitation is that we did not account for within-subject effects and instead conducted independent tests during the comparison. However, our intention was to capture general effects without considering individual variations.
The aim of the current study was to investigate sleepiness-related conditions in people in general, but we are directing our findings towards shift workers. Of course, having a separate sample of shift workers would be valuable, and we intend to do so in the near future. However, considering that shift work itself does not influence the ‘internal circadian machinery,’ we believe that our findings can be taken into account while studying sleepiness-related conditions in shift workers.
6. Conclusions
Subjective sleepiness may be accompanied by different conditions. At the time of biological evening, high sleepiness was associated with a ‘stressed’ condition with higher sympathetic activation, while later, it was associated with a ‘drowsy’ condition with higher parasympathetic activation and a decline in variability in heart rate. Our results provide evidence that condition type in high sleepiness depends on biological time. This should be taken into account in managing work regimes in shift work and while creating alertness detectors.
Author Contributions
Conceptualization, V.D. and I.Z.; methodology, V.D.; software, V.V.; formal analysis, M.Z., E.S. and E.T.; data curation, V.D. and M.Z.; writing—original draft preparation, M.Z., E.S. and E.T.; writing—review and editing, V.D., V.V. and I.Z.; project administration, V.D. All authors have read and agreed to the published version of the manuscript.
Funding
This research was funded by the Russian Science Foundation, grant number 22-28-20509.
Institutional Review Board Statement
The study was conducted according to the guidelines of the Declaration of Helsinki and approved by the Institutional Review Board of Faculty of Social Sciences of Lobachevsky State University (Protocol No. 4 from 21 November 2022).
Informed Consent Statement
Informed consent was obtained from all subjects involved in the study.
Data Availability Statement
The data presented in this study are available on request from the corresponding author. The data are not publicly available due to their containing information that could compromise the privacy of research participants.
Conflicts of Interest
The authors declare no conflict of interest.
Appendix A
Table A1.
The description of heart rate variability metrics (partially taken from [21]).
Table A1.
The description of heart rate variability metrics (partially taken from [21]).
| Domain | Metrics | Description |
|---|---|---|
| Time | mean_nni | mean of the NN intervals |
| sdnn | standard deviation of the NN intervals | |
| sdsd | standard deviation of differences between adjacent NN intervals | |
| nni_50 | intervals’ number differences of successive NN intervals greater than 50 ms | |
| pnni_50 | derived proportion by dividing nni_50 by the NN intervals’ total number. | |
| nni_20 | intervals’ number differences of successive NN intervals greater than 20 ms | |
| pnni_20 | derived proportion by dividing nni_20 by the r–r intervals’ total number | |
| rmssd | square root of the mean of the sum of the squares of differences between adjacent NN intervals | |
| median_nni | median of the NN intervals | |
| range_nni | difference between the maximum and the minimum of the NN intervals | |
| cvsd | rmssd divided mean_nni | |
| cvnni | sdnn divided by mean_nni | |
| mean_hr | heart rate mean | |
| max_hr | heart rate maximum | |
| min_hr | heart rate minimum | |
| std_hr | standard deviation of the heart rate | |
| Frequency | lf | variance in hrv in the low-frequency band (0.03–0.15 Hz) |
| hf | variance in hrv in the high-frequency band (0.18–0.45 Hz) | |
| lf_hf_ratio | lf to hf ratio, sympatho-vagal index | |
| lfnu | derived proportion by dividing lf by the sum of lf and hf | |
| hfnu | derived proportion by dividing hf by the sum of lf and hf | |
| total_power | total power density spectral | |
| vlf | variance in hrv in the very low-frequency band (0.00–0.03 Hz) | |
| Non-Linear | csi | cardiac sympathetic index |
| cvi | cadiac vagal index | |
| modified_csi | modified csi | |
| sampen | sample entropy |
References
- Baulk, S.D.; Fletcher, A.; Kandelaars, K.J.; Dawson, D.; Roach, G.D. A field study of sleep and fatigue in a regular rotating 12-h shift system. Appl. Ergon. 2009, 40, 694–698. [Google Scholar] [CrossRef] [PubMed]
- Ganesan, S.; Magee, M.; Stone, J.E.; Mulhall, M.D.; Collins, A.; Howard, M.E.; Sletten, T.L. The impact of shift work on sleep, alertness and performance in healthcare workers. Sci. Rep. 2019, 9, 1–13. [Google Scholar] [CrossRef] [PubMed]
- Abrahamsen, A.; Weihe, P.; Debes, F.; van Leeuwen, W.M. Sleep, sleepiness, and fatigue on board Faroese fishing vessels. Nat. Sci. Sleep 2022, 14, 347. [Google Scholar] [CrossRef] [PubMed]
- Åkerstedt, T.; Axelsson, J.; Lekander, M.; Orsini, N.; Kecklund, G. The daily variation in sleepiness and its relation to the preceding sleep episode-a prospective study across 42 days of normal living. J. Sleep Res. 2012, 22, 258–265. [Google Scholar] [CrossRef]
- Shochat, T.; Santhi, N.; Herer, P.; Dijk, D.; Skeldon, A.C. Sleepiness is a signal to go to bed: Data and model simulations. Sleep 2021, 44, zsab123. [Google Scholar] [CrossRef]
- Bendaoud, I.; Etindele Sosso, F.A. Socioeconomic Position and Excessive Daytime Sleepiness: A Systematic Review of Social Epidemiological Studies. Clocks Sleep 2022, 4, 240–259. [Google Scholar] [CrossRef] [PubMed]
- Yu, Y.-K.; Yao, Z.-Y.; Wei, Y.-X.; Kou, C.-G.; Yao, B.; Sun, W.-J.; Li, S.-Y.; Fung, K.; Jia, C.-X. Depressive Symptoms as a Mediator between Excessive Daytime Sleepiness and Suicidal Ideation among Chinese College Students. Int. J. Environ. Res. Public Health 2022, 19, 16334. [Google Scholar] [CrossRef]
- Carskadon, M.A.; Dement, W.C. Sleepiness and Sleep State on a 90-Min Schedule. Psychophysiology 1977, 14, 127–133. [Google Scholar] [CrossRef]
- Åkerstedt, T.; Gillberg, M. Subjective and objective sleepiness in the active individual. Int. J. Neurosci. 1990, 52, 29–37. [Google Scholar] [CrossRef]
- Cai, A.W.; Manousakis, J.E.; Singh, B.; Kuo, J.; Jeppe, K.J.; Francis-Pester, E.; Anderson, C. On-road driving impairment following sleep deprivation differs according to age. Sci. Rep. 2021, 11, 1–13. [Google Scholar] [CrossRef]
- Santhi, N.; Horowitz, T.S.; Duffy, J.F.; Czeisler, C.A. Acute Sleep Deprivation and Circadian Misalignment Associated with Transition onto the First Night of Work Impairs Visual Selective Attention. PLoS ONE 2007, 2, e1233. [Google Scholar] [CrossRef] [PubMed]
- Muck, R.A.; Hudson, A.N.; Honn, K.A.; Gaddameedhi, S.; Van Dongen, H.P.A. Working around the Clock: Is a Person’s Endogenous Circadian Timing for Optimal Neurobehavioral Functioning Inherently Task-Dependent? Clocks Sleep 2022, 4, 23–36. [Google Scholar] [CrossRef]
- Flaa, T.A.; Bjorvatn, B.; Pallesen, S.; Zakariassen, E.; Harris, A.; Gatterbauer-Trischler, P.; Waage, S. Sleep and sleepiness measured by diaries and actigraphy among Norwegian and Austrian helicopter emergency medical service (HEMS) pilots. Int. J. Environ. Res. Public Health 2022, 19, 4311. [Google Scholar] [CrossRef]
- Sunde, E.; Mrdalj, J.; Pedersen, T.; Thun, E.; Bjorvatn, B.; Grønli, J.; Pallesen, S. Role of nocturnal light intensity on adaptation to three consecutive night shifts: A counterbalanced crossover study. Occup. Environ. Med. 2020, 77, 249–255. [Google Scholar] [CrossRef]
- Manousakis, J.E.; Mann, N.; Jeppe, K.J.; Anderson, C. Awareness of sleepiness: Temporal dynamics of subjective and objective sleepiness. Psychophysiology 2021, 58, e13839. [Google Scholar] [CrossRef] [PubMed]
- Rogers, B.; Schaffarczyk, M.; Gronwald, T. Estimation of Respiratory Frequency in Women and Men by Kubios HRV Software Using the Polar H10 or Movesense Medical ECG Sensor during an Exercise Ramp. Sensors 2022, 22, 7156. [Google Scholar] [CrossRef] [PubMed]
- Koizumi, N.; Ogata, H.; Negishi, Y.; Nagayama, H.; Kaneko, M.; Kiyono, K.; Omi, N. Energy Expenditure of Disaster Relief Operations Estimated Using a Tri-Axial Accelerometer and a Wearable Heart Rate Monitor. Int. J. Environ. Res. Public Health 2023, 20, 5742. [Google Scholar] [CrossRef]
- Delling, A.C.; Jakobsmeyer, R.; Coenen, J.; Christiansen, N.; Reinsberger, C. Home-Based Measurements of Nocturnal Cardiac Parasympathetic Activity in Athletes during Return to Sport after Sport-Related Concussion. Sensors 2023, 23, 4190. [Google Scholar] [CrossRef]
- Hamidi Shishavan, H.; Garza, J.; Henning, R.; Cherniack, M.; Hirabayashi, L.; Scott, E.; Kim, I. Continuous physiological signal measurement over 24-hour periods to assess the impact of work-related stress and workplace violence. Appl. Ergon. 2023, 108, 103937. [Google Scholar] [CrossRef]
- Nasirzadeh, F.; Mir, M.; Hussain, S.; Tayarani Darbandy, M.; Khosravi, A.; Nahavandi, S.; Aisbett, B. Physical Fatigue Detection Using Entropy Analysis of Heart Rate Signals. Sustainability 2020, 12, 2714. [Google Scholar] [CrossRef]
- Antunes, A.R.; Braga, A.C.; Gonçalves, J. Drowsiness Transitions Detection Using a Wearable Device. Appl. Sci. 2023, 13, 2651. [Google Scholar] [CrossRef]
- Awais, M.; Badruddin, N.; Drieberg, M. A hybrid approach to detect driver drowsiness utilizing physiological signals to improve system performance and wearability. Sensors 2017, 17, 1991. [Google Scholar] [CrossRef]
- Vicente, J.; Laguna, P.; Bartra, A.; Bailon, R. Drowsiness detection using heart rate variability. Med. Biol. Eng. Comput. 2016, 54, 927–937. [Google Scholar] [CrossRef]
- Patel, M.; Lal, S.K.L.; Kavanagh, D.; Rossiter, P. Applying neural network analysis on heart rate variability data to assess driver fatigue. Expert Syst. Appl. 2011, 38, 7235–7242. [Google Scholar] [CrossRef]
- Furman, G.D.; Baharav, A.; Cahan, C.; Akselrod, S. Early detection of falling asleep at the wheel: A Heart Rate Variability approach. In Proceedings of the IEEE Computers in Cardiology, Bologna, Italy, 14–17 September 2008; pp. 1109–1112. [Google Scholar] [CrossRef]
- Zhang, N.; Fard, M.; Bhuiyan, M.H.U.; Verhagen, D.; Azari, M.F.; Robinson, S.R. The effects of physical vibration on heart rate variability as a measure of drowsiness. Ergonomics 2018, 61, 1259–1272. [Google Scholar] [CrossRef] [PubMed]
- McEwen, B.S.; Karatsoreos, I.N. Sleep Deprivation and Circadian Disruption: Stress. Allostasis, and Allostatic Load. Sleep Med. Clin. 2015, 10, 1–10. [Google Scholar] [CrossRef]
- Zhong, X.; Hilton, H.J.; Gates, G.J.; Jelic, S.; Stern, Y.; Bartels, M.N. Increased sympathetic and decreased parasympathetic cardiovascular modulation in normal humans with acute sleep deprivation. J. Appl. Physiol. 1985, 98, 2024–2032. [Google Scholar] [CrossRef] [PubMed]
- Morales, J.; Yáñez, A.; Fernández-González, L.; Montesinos-Magraner, L.; Marco-Ahulló, A.; Solana-Tramunt, M. Stress and autonomic response to sleep deprivation in medical residents: A comparative cross-sectional study. PLoS ONE 2019, 14, e0214858. [Google Scholar] [CrossRef]
- Bourdillon, N.; Jeanneret, F.; Nilchian, M.; Albertoni, P.; Ha, P.; Millet, G.P. Sleep Deprivation Deteriorates Heart Rate Variability and Photoplethysmography. Front. Neurosci. 2021, 15, 642548. [Google Scholar] [CrossRef]
- Chua, E.C.P. Heart rate variability can be used to estimate sleepiness-related decrements in psychomotor vigilance during total sleep deprivation. Sleep 2012, 35, 325–334. [Google Scholar] [CrossRef]
- Citi, L. Point process heart rate variability assessment during sleep deprivation. In Proceedings of the IEEE Computing in Cardiology, Belfast, UK, 26–29 September 2010. [Google Scholar]
- Jeklin, A.T.; Perrotta, A.S.; Davies, H.W.; Bredin, S.S.D.; Paul, D.A.; Warburton, D.E.R. The association between heart rate variability, reaction time, and indicators of workplace fatigue in wildland firefighters. Int. Arch. Occup. Environ. Health 2021, 94, 823–831. [Google Scholar] [CrossRef] [PubMed]
- Boivin, D.B.; Boudreau, P.; Kosmadopoulos, A. Disturbance of the Circadian System in Shift Work and Its Health Impact. J. Biol. Rhythm. 2021, 37, 3–28. [Google Scholar] [CrossRef]
- Rivera, A.S.; Akanbi, M.; O’Dwyer, L.C.; McHugh, M. Shift work and long work hours and their association with chronic health conditions: A systematic review of systematic reviews with meta-analyses. PLoS ONE 2020, 15, e0231037. [Google Scholar] [CrossRef]
- Reid, K.J.; Santostasi, G.; Baron, K.G.; Wilson, J.; Kang, J.; Zee, P.C. Timing and intensity of light correlate with body weight in adults. PLoS ONE 2014, 9, e92251. [Google Scholar] [CrossRef]
- Scheer, F.A.; Morris, C.J.; Shea, S.A. The internal circadian clock increases hunger and appetite in the evening independent of food intake and other behaviors. Obesity 2013, 21, 421–423. [Google Scholar] [CrossRef] [PubMed]
- Morris, C.J.; Garcia, J.I.; Myers, S.; Yang, J.N.; Trienekens, N.; Scheer, F.A. The Human Circadian System Has a Dominating Role in Causing the Morning/Evening Difference in Diet-Induced Thermogenesis. Obesity 2015, 23, 2053–2058. [Google Scholar] [CrossRef] [PubMed]
- Noh, J. The Effect of Circadian and Sleep Disruptions on Obesity Risk. J. Obes. Metab. Syndr. 2018, 27, 78–83. [Google Scholar] [CrossRef]
- Jehan, S.; Zizi, F.; Pandi-Perumal, S.R.; Myers, A.K.; Auguste, E.; Jean-Louis, G.; McFarlane, S.I. Shift Work and Sleep: Medical Implications and Management. Sleep Med. Disord. Int. J. 2017, 1, 00008. [Google Scholar]
- Folkard, S. Do permanent night workers show circadian adjustment? A review based on the endogenous melatonin rhythm. Chronobiol. Int. 2008, 25, 215–224. [Google Scholar] [CrossRef]
- Demareva, V.; Viakhireva, V.; Zayceva, I.; Isakova, I.; Okhrimchuk, Y.; Zueva, K.; Demarev, A.; Nazarov, N.; Edeleva, J. Temporal dynamics of subjective sleepiness: A convergence analysis of two scales. Biol. Rhythm Res. 2023, 54, 369–384. [Google Scholar] [CrossRef]
- Schaffarczyk, M.; Rogers, B.; Reer, R.; Gronwald, T. Validity of the Polar H10 Sensor for Heart Rate Variability Analysis during Resting State and Incremental Exercise in Recreational Men and Women. Sensors 2022, 22, 6536. [Google Scholar] [CrossRef]
- Skála, T.; Vícha, M.; Rada, M.; Vácha, J.; Flašík, J.; Táborský, M. Feasibility of evaluation of Polar H10 chest-belt ECG in patients with a broad range of heart conditions. Cor Vasa 2022, 64, 411–422. [Google Scholar] [CrossRef]
- Napadow, V.; Dhond, R.; Conti, G.; Makris, N.; Brown, E.N.; Barbieri, R. Brain correlates of autonomic modulation: Combining heart rate variability with fMRI. NeuroImage 2008, 42, 169–177. [Google Scholar] [CrossRef]
- Sesa-Ashton, G.; Wong, R.; McCarthy, B.; Datta, S.; Henderson, L.A.; Dawood, T.; Macefield, V.G. Stimulation of the dorsolateral prefrontal cortex modulates muscle sympathetic nerve activity and blood pressure in humans. Cereb. Cortex Commun. 2022, 3, tgac017. [Google Scholar] [CrossRef] [PubMed]
- Kirk, U.; Harvey, A.; Montague, P.R. Domain expertise insulates against judgment bias by monetary favors through a modulation of ventromedial prefrontal cortex. Proc. Natl. Acad. Sci. USA 2011, 108, 10332–10336. [Google Scholar] [CrossRef]
- Donchin, Y.; Feld, J.; Porges, S. Respiratory Sinus Arrhythmia during Recovery from Isoflurane—Nitrous Oxide Anesthesia. Anesth. Analg. 1985, 64, 811–815. [Google Scholar] [CrossRef] [PubMed]
- Porges, S.W. Cardiac vagal tone: A physiological index of stress. Neurosci. Biobehav. Rev. 1995, 19, 225–233. [Google Scholar] [CrossRef]
- Jeppesen, J.; Beniczky, S.; Johansen, P.; Sidenius, P.; Fuglsang-Frederiksen, A. Using Lorenz plot and Cardiac Sympathetic Index of heart rate variability for detecting seizures for patients with epilepsy. In Proceedings of the Annual International Conference of the IEEE Engineering in Medicine and Biology Society, Chicago, IL, USA, 26–30 August 2014. [Google Scholar]
- Jeppesen, J.; Beniczky, S.; Johansen, P.; Sidenius, P.; Fuglsang-Frederiksen, A. Detection of epileptic seizures with a modified heart rate variability algorithm based on Lorenz plot. Seizure 2015, 24, 1–7. [Google Scholar] [CrossRef] [PubMed]
- Jeppesen, J.; Fuglsang-Frederiksen, A.; Johansen, P. Seizure detection based on heart rate variability using a wearable electrocardiography device. Epilepsia 2019, 60, 2105–2113. [Google Scholar] [CrossRef]
- Lin, C.T.; Nascimben, M.; King, J.T.; Wang, Y.K. Task-related EEG and HRV entropy factors under different real-world fatigue scenarios. Neurocomputing 2018, 311, 24–31. [Google Scholar] [CrossRef]
- Hoddes, E.; Zarcone, V.; Smythe, H.; Phillips, R.; Dement, W.C. Quantification of Sleepiness: A New Approach. Psychophysiology 1973, 10, 431–436. [Google Scholar] [CrossRef] [PubMed]
- Brown, T.; Johnson, R.; Milavetz, G. Identifying periods of drowsy driving using EEG. Ann. Adv. Automot. Med. 2013, 57, 99–108. [Google Scholar] [PubMed]
Disclaimer/Publisher’s Note: The statements, opinions and data contained in all publications are solely those of the individual author(s) and contributor(s) and not of MDPI and/or the editor(s). MDPI and/or the editor(s) disclaim responsibility for any injury to people or property resulting from any ideas, methods, instructions or products referred to in the content. |
© 2023 by the authors. Licensee MDPI, Basel, Switzerland. This article is an open access article distributed under the terms and conditions of the Creative Commons Attribution (CC BY) license (https://creativecommons.org/licenses/by/4.0/).