

A Systematic Literature Review of the Impact of Climate Change on the Global Demand for Psychiatric Services
 , and
, and
Abstract
:1. Introduction
- To investigate the demand for mental health services caused by CC worldwide—hospital admissions (HA), emergency department visits (EDV), outpatient consultations, and ambulance dispatch—due to psychiatric symptoms, disorders, or mortality.
- To identify which of these disorders are responsible for the consultations, in the aftermath of CC variables.
- To compare health services use in low- and middle-income countries to that in high-income countries and examine how these populations are undertreated for having less access to healthcare services.
2. Materials and Methods
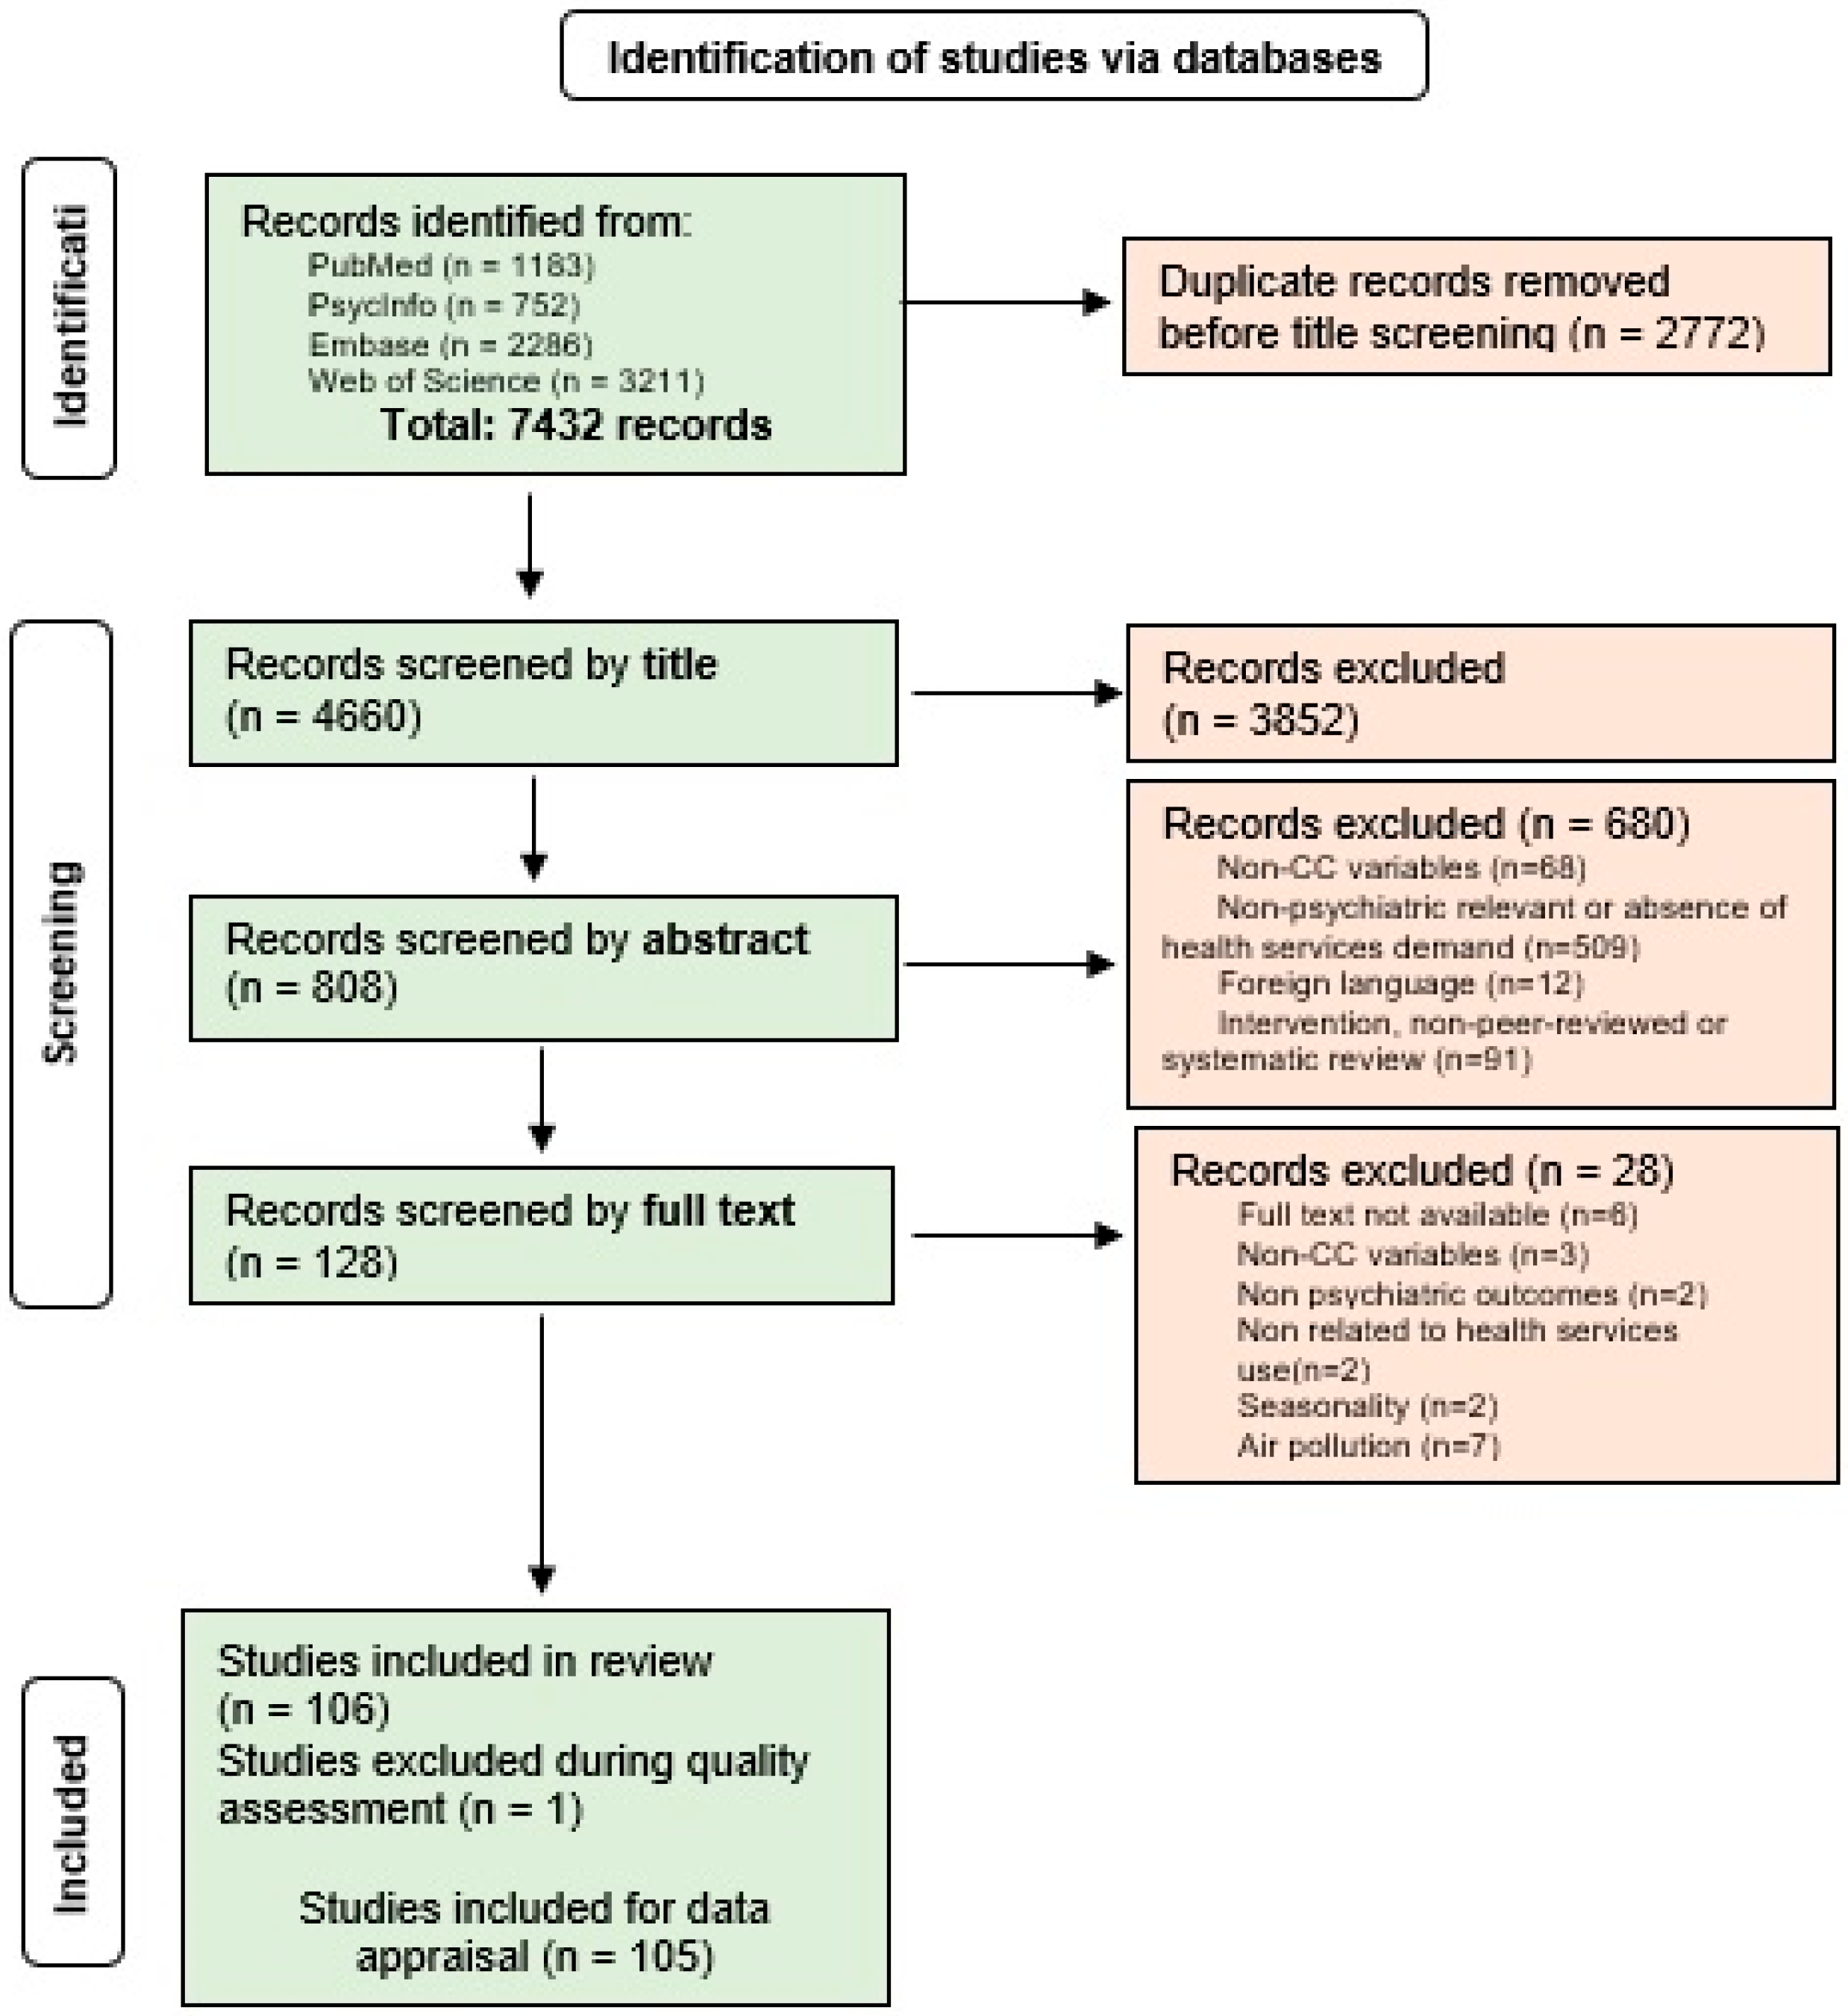
2.1. Studies Selection and Quality Assessment
2.2. Data Appraisal
3. Results
3.1. Extreme Events (n = 12)
- (i)
- Suicide behavior (n = 9)
- (ii)
- Mood disorders (n = 4)
- (iii)
- Neurotic disorders (n = 4)
- (iv)
- Substance misuse (n = 2)
- (v)
- Schizophrenia (n = 1)
- (vi)
- Behavioral disorders (n = 1)
3.2. Meteorological Factors (n = 93)
- (i)
- Suicide behavior (n = 33)
- (ii)
- Schizophrenia (n = 24)
- (iii)
- Mood disorders (n = 23)
- (iv)
- Organic disorders (n = 17)
- (v)
- Substance misuse (n = 16)
- (vi)
- Neurotic and anxiety disorders (n = 14)
- (vii)
- Behavioral and emotional disorders with onset during childhood/adolescence (n = 4)
- (viii)
- Disorders of psychological development (n = 2)
4. Discussion
5. Conclusions
6. Strengths and Limitations
Supplementary Materials
Author Contributions
Funding
Institutional Review Board Statement
Informed Consent Statement
Data Availability Statement
Conflicts of Interest
References
- Reay, D.; Sabine, C.; Smith, P.; Hymus, G. Fourth Assessment Report: Intergovernmental Panel on Climate Change. In Intergovernmental Panel on Climate Change; Cambridge University Press: Cambridge, UK, 2007. [Google Scholar] [CrossRef]
- Masson-Delmotte, V.; Zhai, P.; Pirani, A.; Connors, S.L.; Péan, C.; Berger, S.; Caud, N.; Chen, Y.; Goldfarb, L.; Gomis, M.I.; et al. IPCC: Climate Change 2021: The Physical Science Basis. Available online: https://www.ipcc.ch/report/ar6/wg1/ (accessed on 5 February 2022).
- Pachauri, R.K.; Reisinger, A. Climate Change 2007. Synthesis Report. Contribution of Working Groups I, II and III to the Fourth Assessment Report. In Proceedings of the Intergovernmental Panel on Climate Change (IPCC), Geneva, Switzerland, 31 August–4 September 2008; Available online: https://www.ipcc.ch/site/assets/uploads/2018/02/ar4_syr_full_report.pdf (accessed on 10 October 2022).
- WMO. Provisional State of the Global Climate; WMO: Geneva, Switzerland, 2022. [Google Scholar]
- NOAA National Centers for Environmental Information. State of the Climate: Global Climate Report for January 2021, Pub-lished online February 2021. Available online: https://www.ncdc.noaa.gov/sotc/global/202101/supplemental/page-1 (accessed on 11 May 2021).
- Perkins-Kirkpatrick, S.E.; Lewis, S.C. Increasing trends in regional heatwaves. Nat. Commun. 2020, 11, 1–8. [Google Scholar] [CrossRef]
- United Nations Environment Programme Copenhagen Climate Change (UNEP-CCC). Emissions Gap Report 2021: The Heat Is On—A World of Climate Promises Not Yet Delivered; UNEP-CCC: Nairobi, Kenya, 2021; Available online: https://wedocs.unep.org/20.500.11822/36990 (accessed on 10 October 2022).
- WMO. The state of greenhouse gases in the atmosphere based on global observations through 2021. WMO Greenh. Gas Bull. 2022, 18, 1. [Google Scholar]
- Verner, G.; Schütte, S.; Knop, J.; Sankoh, O.; Sauerborn, R. Health in climate change research from 1990 to 2014: Posi-tive trend, but still underperforming. Glob. Health Action 2016, 9, 30723. [Google Scholar] [CrossRef] [Green Version]
- Cianconi, P.; Betrò, S.; Janiri, L. The impact of climate change on mental health: A systematic descriptive re-view. Front. Psychiatry 2020, 11, 74. [Google Scholar] [CrossRef]
- Page, L.A.; Hajat, S.; Kovats, S.; Howard, L. Temperature-related deaths in people with psychosis, dementia and substance misuse. Br. J. Psychiatry 2012, 200, 485–490. [Google Scholar] [CrossRef] [Green Version]
- Hermesh, H.; Shiloh, R.; Epstein, Y.; Manaim, H.; Weizman, A.; Munitz, H. Heat Intolerance in Patients With Chronic Schizophrenia Maintained With Antipsychotic Drugs. Am. J. Psychiatry 2000, 157, 1327–1329. [Google Scholar] [CrossRef]
- Cusack, L.; De Crespigny, C.; Athanasos, P. Heatwaves and their impact on people with alcohol, drug and mental health conditions: A discussion paper on clinical practice considerations. J. Adv. Nurs. 2011, 67, 915–922. [Google Scholar] [CrossRef]
- Vos, T.; Allen, C.; Arora, M.; Barber, R.M.; Bhutta, Z.A.; Brown, A.; Boufous, S. Global, regional, and national incidence, prevalence, and years lived with disability for 310 diseases and injuries, 1990–2015: A systematic analysis for the Global Burden of Disease Study 2015. Lancet 2016, 388, 1545–1602. [Google Scholar] [CrossRef] [Green Version]
- Merikangas, K.R.; He, J.-P.; Burstein, M.; Swanson, S.A.; Avenevoli, S.; Cui, L.; Benjet, C.; Georgiades, K.; Swendsen, J. Lifetime Prevalence of Mental Disorders in U.S. Adolescents: Results from the National Comorbidity Survey Replication–Adolescent Supplement (NCS-A). J. Am. Acad. Child Adolesc. Psychiatry 2010, 49, 980–989. [Google Scholar] [CrossRef] [Green Version]
- Kessler, R.C.; Angermeyer, M.; Anthony, J.C.; De Graaf RO, N.; Demyttenaere, K.; Gasquet, I.; Üstün, T.B. Lifetime prevalence and age-of-onset distributions of mental disorders in the World Health Organization’s World Mental Health Survey Initiative. World Psychiatry 2007, 6, 168. [Google Scholar]
- Vigo, D.; Thornicroft, G.; Atun, R. Estimating the true global burden of mental illness. Lancet Psychiatry 2016, 3, 171–178. [Google Scholar] [CrossRef] [PubMed]
- Wang, Y.; Liu, Y.; Ye, D.; Li, N.; Bi, P.; Tong, S.; Wang, Y.; Cheng, Y.; Li, Y.; Yao, X. Temperatures and health costs of emergency department visits: A multisite time series study in China. Environ. Res. 2021, 197, 111023. [Google Scholar] [CrossRef] [PubMed]
- Phillippi, S.W.; Beiter, K.; Thomas, C.L.; Sugarman, O.K.; Wennerstrom, A.; Wells, K.B.; Trapido, E. Medicaid Utilization Before and After a Natural Disaster in the 2016 Baton Rouge–Area Flood. Am. J. Public Health 2019, 109, S316–S321. [Google Scholar] [CrossRef] [PubMed]
- World Health Organization. 2018 Global Reference List of 100 Core Health Indicators (Plus Health-Related SDGs); World Health Organization: Geneva, Switzerland, 2018; Volume 1, pp. 123–127. Available online: https://apps.who.int/iris/handle/10665/259951 (accessed on 10 October 2022).
- Campbell-Lendrum, D.; Corvalán, C.; Neiraa, M. Global climate change: Implications for international public health policy. Bull World Health Organ. 2007, 85, 235–237. [Google Scholar] [CrossRef] [PubMed]
- Stansbury, J.P.; Ried, L.D.; Velozo, C.A. Unidimensionality and Bandwidth in the Center for Epidemiologic Studies Depression (CES–D) Scale. J. Pers. Assess. 2006, 86, 10–22. [Google Scholar] [CrossRef]
- Funk, M.; Drew, N.; Knapp, M.; Knapp, M. Mental health, poverty and development. J. Public Ment. Health 2012, 11, 166–185. [Google Scholar] [CrossRef] [Green Version]
- Hong, Y.C. Climate Change and Human Health. J. Korean Med. Assoc. 2008, 51, 764. [Google Scholar] [CrossRef] [Green Version]
- Charlson, F.; Ali, S.; Benmarhnia, T.; Pearl, M.; Massazza, A.; Augustinavicius, J.; Scott, J.G. Climate change and mental health: A scoping review. Int. J. Environ. Res. Public Health 2021, 18, 4486. [Google Scholar] [CrossRef]
- Lai, B.S.; La Greca, A.M.; Brincks, A.; Colgan, C.A.; D’Amico, M.P.; Lowe, S.; Kelley, M.L. Trajectories of post-traumatic stress in youths after natural disasters. JAMA Netw. Open 2021, 4, e2036682. [Google Scholar] [CrossRef]
- Mason, H.; King, J.C.; Peden, A.E.; Franklin, R.C. Systematic review of the impact of heatwaves on health service demand in Australia. BMC Health Serv. Res. 2022, 22, 1–13. [Google Scholar] [CrossRef]
- Page, M.J.; Moher, D.; Bossuyt, P.M.; Boutron, I.; Hoffmann, T.C.; Mulrow, C.D.; Shamseer, L.; Tetzlaff, J.M.; Akl, E.A.; Brennan, S.E.; et al. PRISMA 2020 explanation and elaboration: Updated guidance and exemplars for reporting systematic reviews. BMJ 2021, 372, n160. [Google Scholar] [CrossRef]
- International Prospective Register of Systematic Reviews 2018. Available online: https://www.crd.york.ac.uk/prospero/ (accessed on 18 July 2018).
- Thompson, R.; Hornigold, R.; Page, L.; Waite, T. Associations between high ambient temperatures and heat waves with mental health outcomes: A systematic review. Public Health 2018, 161, 171–191. [Google Scholar] [CrossRef]
- Centers for Disease Control and Prevention. International Classification of Diseases—10th Revision. Available online: https://www.cdc.gov/nchs/icd/icd10.htm (accessed on 10 June 2022).
- Ouzzani, M.; Hammady, H.; Fedorowicz, Z.; Elmagarmid, A. Rayyan—A web and mobile app for systematic reviews. Syst. Rev. 2016, 5, 210. [Google Scholar] [CrossRef] [Green Version]
- National Heart, Lung, and Blood Institute (NHLBI) Quality Assessment Tool for Observational Cohort and Cross-Sectional Studies. Available online: https://www.nhlbi.nih.gov/health-topics/study-quality-assessment-tools (accessed on 23 February 2022).
- Lee, S.; Lee, H.; Myung, W.; Kim, E.J.; Kim, H. Mental disease-related emergency admissions attributable to hot tem-peratures. Sci. Total Environ. 2018, 616, 688–694. [Google Scholar] [CrossRef]
- Chan, E.Y.; Lam, H.C.; So, S.H.; Goggins, W.B., III; Ho, J.Y.; Liu, S.; Chung, P.P. Association between ambient temperatures and mental disorder hospitalizations in a subtropical city: A time-series study of Hong Kong special administra-tive region. Int. J. Environ. Res. Public Health 2018, 15, 754. [Google Scholar] [CrossRef] [Green Version]
- Zhang, S.; Yang, Y.; Xie, X.; Li, H.; Han, R.; Hou, J.; Sun, J.; Qian, Z.; Wu, S.; Huang, C.; et al. The effect of temperature on cause-specific mental disorders in three subtropical cities: A case-crossover study in China. Environ. Int. 2020, 143, 105938. [Google Scholar] [CrossRef]
- Nori-Sarma, A.; Sun, S.; Sun, Y.; Spangler, K.R.; Oblath, R.; Galea, S.; Wellenius, G.A. Association between ambi-ent heat and risk of emergency department visits for mental health among US adults, 2010 to 2019. JAMA Psychiatry 2022, 79, 341–349. [Google Scholar] [CrossRef]
- Trang, P.M.; Rocklöv, J.; Giang, K.B.; Kullgren, G.; Nilsson, M. Heatwaves and hospital admissions for mental dis-orders in northern Vietnam. PLoS ONE 2016, 11, e0155609. [Google Scholar] [CrossRef]
- Trang, P.M.; Rocklöv, J.; Giang, K.B.; Nilsson, M. Seasonality of hospital admissions for mental disorders in Hanoi, Vietnam. Glob. Health Action 2016, 9, 32116. [Google Scholar] [CrossRef] [PubMed] [Green Version]
- Basu, R.; Gavin, L.; Pearson, D.; Ebisu, K.; Malig, B. Examining the Association Between Apparent Temperature and Mental Health-Related Emergency Room Visits in California. Am. J. Epidemiol. 2017, 187, 726–735. [Google Scholar] [CrossRef] [Green Version]
- Yoo, E.-H.; Eum, Y.; Gao, Q.; Chen, K. Effect of extreme temperatures on daily emergency room visits for mental disorders. Environ. Sci. Pollut. Res. 2021, 28, 39243–39256. [Google Scholar] [CrossRef] [PubMed]
- Hansen, A.; Bi, P.; Nitschke, M.; Ryan, P.; Pisaniello, D.; Tucker, G. The Effect of Heat Waves on Mental Health in a Temperate Australian City. Environ. Health Perspect. 2008, 116, 1369–1375. [Google Scholar] [CrossRef] [PubMed] [Green Version]
- Middleton, J.; Cunsolo, A.; Pollock, N.; Jones-Bitton, A.; Wood, M.; Shiwak, I.; Flowers, C.; Harper, S.L. Temperature and place associations with Inuit mental health in the context of climate change. Environ. Res. 2021, 198, 111166. [Google Scholar] [CrossRef]
- Vida, S.; Durocher, M.; Ouarda, T.B.M.J.; Gosselin, P. Relationship Between Ambient Temperature and Humidity and Visits to Mental Health Emergency Departments in Québec. Psychiatr. Serv. 2012, 63, 1150–1153. [Google Scholar] [CrossRef]
- Wang, X.; Lavigne, E.; Ouellette-kuntz, H.; Chen, B.E. Acute impacts of extreme temperature exposure on emergen-cy room admissions related to mental and behavior disorders in Toronto, Canada. J. Affect. Disord. 2014, 155, 154–161. [Google Scholar] [CrossRef]
- Niu, Y.; Gao, Y.; Yang, J.; Qi, L.; Xue, T.; Guo, M.; Zheng, J.; Lu, F.; Wang, J.; Liu, Q. Short-term effect of apparent temperature on daily emergency visits for mental and behavioral disorders in Beijing, China: A time-series study. Sci. Total. Environ. 2020, 733, 139040. [Google Scholar] [CrossRef] [PubMed]
- Liu, X.; Liu, H.; Fan, H.; Liu, Y.; Ding, G. Influence of Heat Waves on Daily Hospital Visits for Mental Illness in Jinan, China—A Case-Crossover Study. Int. J. Environ. Res. Public Health 2018, 16, 87. [Google Scholar] [CrossRef] [Green Version]
- Sun, S.; Weinberger, K.R.; Nori-Sarma, A.; Spangler, K.R.; Sun, Y.; Dominici, F.; Wellenius, G.A. Ambient heat and risks of emergency department visits among adults in the United States: Time stratified case crossover study. BMJ 2021, 375, e065653. [Google Scholar] [CrossRef]
- Shiue, I.; Perkins, D.R.; Bearman, N. Physically equivalent temperature and mental and behavioural disorders in Germany in 2009–2011. J. Ment. Health 2015, 25, 148–153. [Google Scholar] [CrossRef]
- Settineri, S.; Mucciardi, M.; Leonardi, V.; Schlesinger, S.; Florio, M.G.; Famà, F.; Muscatello, M.A.; Mento, C. Metereological conditions and psychiatric emergency visits in Messina, Italy. Int. J. Psychol. Res. 2016, 9, 72–82. [Google Scholar] [CrossRef] [Green Version]
- Yoo, E.-H.; Eum, Y.; Roberts, J.E.; Gao, Q.; Chen, K. Association between extreme temperatures and emergency room visits related to mental disorders: A multi-region time-series study in New York, USA. Sci. Total. Environ. 2021, 792, 148246. [Google Scholar] [CrossRef] [PubMed]
- Peng, Z.; Wang, Q.; Kan, H.; Chen, R.; Wang, W. Effects of ambient temperature on daily hospital admissions for mental disorders in Shanghai, China: A time-series analysis. Sci. Total. Environ. 2017, 590–591, 281–286. [Google Scholar] [CrossRef] [PubMed]
- Schmeltz, M.T.; Gamble, J.L. Risk characterization of hospitalizations for mental illness and/or behavioral disorders with concurrent heat-related illness. PLoS ONE 2017, 12, e0186509. [Google Scholar] [CrossRef] [PubMed]
- Min, M.; Shi, T.; Ye, P.; Wang, Y.; Yao, Z.; Tian, S.; Zhang, Y.; Liang, M.; Qu, G.; Bi, P.; et al. Effect of apparent temperature on daily emergency admissions for mental and behavioral disorders in Yancheng, China: A time-series study. Environ. Health 2019, 18, 1–12. [Google Scholar] [CrossRef] [Green Version]
- Bundo, M.; de Schrijver, E.; Federspiel, A.; Toreti, A.; Xoplaki, E.; Luterbacher, J.; Franco, O.H.; Müller, T.; Vicedo-Cabrera, A.M. Ambient temperature and mental health hospitalizations in Bern, Switzerland: A 45-year time-series study. PLoS ONE 2021, 16, e0258302. [Google Scholar] [CrossRef]
- Xu, Z.; FitzGerald, G.; Guo, Y.; Jalaludin, B.; Tong, S. Assessing heatwave impacts on cause-specific emergency de-partment visits in urban and rural communities of Queensland, Australia. Environ. Res. 2019, 168, 414–419. [Google Scholar] [CrossRef]
- Wondmagegn, B.Y.; Xiang, J.; Dear, K.; Williams, S.; Hansen, A.; Pisaniello, D.; Bi, P. Impact of heatwave intensi-ty using excess heat factor on emergency department presentations and related healthcare costs in Adelaide, South Australia. Sci. Total Environ. 2021, 781, 146815. [Google Scholar] [CrossRef]
- Nitschke, M.; Tucker, G.R.; Bi, P. Morbidity and mortality during heatwaves in metropolitan Adelaide. Med. J. Aust. 2007, 187, 662–665. [Google Scholar] [CrossRef] [Green Version]
- Dang, T.N.; Vy, N.T.T.; Thuong, D.T.H.; Phung, D.; Van Dung, D.; Le An, P. Main and added effects of heat-waves on hospitalizations for mental and behavioral disorders in a tropical megacity of Vietnam. Environ. Sci. Pollut. Res. 2022, 29, 59094–59103. [Google Scholar] [CrossRef]
- Carlsen, H.K.; Oudin, A.; Steingrimsson, S.; Åström, D.O. Ambient Temperature and Associations with Daily Visits to a Psychiatric Emergency Unit in Sweden. Int. J. Environ. Res. Public Health 2019, 16, 286. [Google Scholar] [CrossRef] [Green Version]
- Khalaj, B.; Lloyd, G.; Sheppeard, V.; Dear, K. The health impacts of heat waves in five regions of New South Wales, Australia: A case-only analysis. Int. Arch. Occup. Environ. Health 2010, 83, 833–842. [Google Scholar] [CrossRef] [PubMed]
- Williams, S.; Nitschke, M.; Sullivan, T.; Tucker, G.R.; Weinstein, P.; Pisaniello, D.L.; Parton, K.A.; Bi, P. Heat and health in Adelaide, South Australia: Assessment of heat thresholds and temperature relationships. Sci. Total. Environ. 2012, 414, 126–133. [Google Scholar] [CrossRef] [PubMed]
- Calkins, M.M.; Isaksen, T.B.; Stubbs, B.A.; Yost, M.G.; Fenske, R.A. Impacts of extreme heat on emergency medical service calls in King County, Washington, 2007–2012: Relative risk and time series analyses of basic and advanced life support. Environ. Health 2016, 15, 1–13. [Google Scholar] [CrossRef] [PubMed] [Green Version]
- Wei, Y.; Wang, Y.; Lin, C.K.; Yin, K.; Yang, J.; Shi, L.; Schwartz, J.D. Associations between seasonal temperature and dementia-associated hospitalizations in New England. Environ. Int. 2019, 126, 228–233. [Google Scholar] [CrossRef]
- Culqui, D.R.; Linares, C.; Ortiz, C.; Carmona, R.; Díaz, J. Association between environmental factors and emergency hospital admissions due to Alzheimer’s disease in Madrid. Sci. Total Environ. 2017, 592, 451–457. [Google Scholar] [CrossRef]
- Xu, Z.; Tong, S.; Cheng, J.; Zhang, Y.; Wang, N.; Zhang, Y.; Hu, W. Heatwaves, hospitalizations for Alzheimer’s disease, and postdischarge deaths: A population-based cohort study. Environ. Res. 2019, 178, 108714. [Google Scholar] [CrossRef]
- Gong, J.; Part, C.; Hajat, S. Current and future burdens of heat-related dementia hospital admissions in England. Environ. Int. 2022, 159, 107027. [Google Scholar] [CrossRef]
- Zhang, Y.; Nitschke, M.; Krackowizer, A.; Dear, K.; Pisaniello, D.; Weinstein, P.; Bi, P. Risk factors of direct heat-related hospital admissions during the 2009 heatwave in Adelaide, Australia: A matched case–control study. BMJ Open 2016, 6, e010666. [Google Scholar] [CrossRef] [Green Version]
- Pan, R.; Wang, Q.; Yi, W.; Wei, Q.; Cheng, J.; Su, H. Temporal trends of the association between extreme tempera-tures and hospitalisations for schizophrenia in Hefei, China from 2005 to 2014. Occup. Environ. Med. 2021, 78, 364–370. [Google Scholar] [CrossRef]
- Zhao, D.; Zhang, X.; Xie, M.; Cheng, J.; Zhang, H.; Wang, S.; Su, H. Is greater temperature change within a day associated with increased emergency admissions for schizophrenia? Sci. Total Environ. 2016, 566, 1545–1551. [Google Scholar] [CrossRef]
- Yi, W.; Zhang, X.; Gao, J.; Wei, Q.; Pan, R.; Duan, J.; Su, H. Examining the association between apparent tempera-ture and admissions for schizophrenia in Hefei, China, 2005–2014: A time-series analysis. Sci. Total Environ. 2019, 672, 1–6. [Google Scholar] [CrossRef] [PubMed]
- Pan, R.; Zhang, X.; Gao, J.; Yi, W.; Wei, Q.; Xu, Z.; Su, H. Impacts of heat and cold on hospitalizations for schizo-phrenia in Hefei, China: An assessment of disease burden. Sci. Total Environ. 2019, 694, 133582. [Google Scholar] [CrossRef] [PubMed]
- Pan, R.; Yao, Z.; Yi, W.; Wei, Q.; He, Y.; Tang, C.; Liu, X.; Son, S.; Ji, Y.; Song, J.; et al. Temporal trends of the association between temperature variation and hospitalizations for schizophrenia in Hefei, China from 2005 to 2019: A time-varying distribution lag nonlinear model. Environ. Sci. Pollut. Res. 2021, 29, 5184–5193. [Google Scholar] [CrossRef]
- Zhao, D.; Zhang, X.; Xu, Z.; Cheng, J.; Xie, M.; Zhang, H.; Su, H. Impact of short-term temperature variability on emergency hospital admissions for schizophrenia stratified by season of birth. Int. J. Biometeorol. 2017, 61, 589–599. [Google Scholar] [CrossRef]
- Tang, C.; Ji, Y.; Li, Q.; Yao, Z.; Cheng, J.; He, Y.; Su, H. Effects of different heat exposure patterns (accumulated and transient) and schizophrenia hospitalizations: A time-series analysis on hourly temperature basis. Environ. Sci. Pollut. Res. 2021, 28, 69160–69170. [Google Scholar] [CrossRef]
- Sung, T.I.; Chen, M.J.; Lin, C.Y.; Lung, S.C.; Su, H.J. Relationship between mean daily ambient temperature range and hospital admissions for schizophrenia: Results from a national cohort of psychiatric inpatients. Sci. Total Environ. 2011, 410, 41–46. [Google Scholar] [CrossRef]
- Shiloh, R.; Shapira, A.; Potchter, O.; Hermesh, H.; Popper, M.; Weizman, A. Effects of climate on admission rates of schizophrenia patients to psychiatric hospitals. Eur. Psychiatry 2005, 20, 61–64. [Google Scholar] [CrossRef]
- Wang, S.; Zhang, X.; Xie, M.; Zhao, D.; Zhang, H.; Zhang, Y.; Su, H. Effect of increasing temperature on daily hospital admissions for schizophrenia in Hefei, China: A time-series analysis. Public Health 2018, 159, 70–77. [Google Scholar] [CrossRef]
- Chen, N.T.; Lin, P.H.; Guo, Y.L.L. Long-term exposure to high temperature associated with the incidence of major depressive disorder. Sci. Total Environ. 2019, 659, 1016–1020. [Google Scholar] [CrossRef]
- Parker, G.B.; Hadzi-Pavlovic, D.; Graham, R.K. Examining for any impact of climate change on the association between seasonality and hospitalization for mania. J. Affect. Disord. 2017, 208, 431–435. [Google Scholar] [CrossRef]
- Medici, C.R.; Vestergaard, C.H.; Hadzi-Pavlovic, D.; Munk-Jørgensen, P.; Parker, G. Seasonal variations in hospital admissions for mania: Examining for associations with weather variables over time. J. Affect. Disord. 2016, 205, 81–86. [Google Scholar] [CrossRef] [PubMed]
- Volpe, F.M.; Del Porto, J.A. Seasonality of admissions for mania in a psychiatric hospital of Belo Horizonte, Brazil. J. Affect. Disord. 2006, 94, 243–248. [Google Scholar] [CrossRef]
- Shapira, A.; Shiloh, R.; Potchter, O.; Hermesh, H.; Popper, M.; Weizman, A. Admission rates of bipolar depressed patients increase during spring/summer and correlate with maximal environmental temperature. Bipolar Disord. 2004, 6, 90–93. [Google Scholar] [CrossRef]
- Volpe, F.M.; da Silva, E.M.; dos Santos, T.N.; de Freitas, D.E.G. Further evidence of seasonality of mania in the tropics. J. Affect. Disord. 2010, 124, 178–182. [Google Scholar] [CrossRef]
- Medici, C.R.; Vestergaard, C.H.; Hadzi-Pavlovic, D.; Munk-Jørgensen, P.; Parker, G. The impact of climate on risk of mania. Eur. Psychiatry 2016, 33, S74. [Google Scholar] [CrossRef]
- Zanobetti, A.; O’Neill, M.S.; Gronlund, C.J.; Schwartz, J.D. Susceptibility to mortality in weather extremes: Effect modification by personal and small area characteristics in a multi-city case-only analysis. Epidemiology 2013, 24, 809. [Google Scholar] [CrossRef] [Green Version]
- Ho, H.C.; Wong, M.S. Urban environmental influences on the temperature–mortality relationship associated mental disorders and cardiorespiratory diseases during normal summer days in a subtropical city. Environ. Sci. Pollut. Res. 2019, 26, 24272–24285. [Google Scholar] [CrossRef]
- Stivanello, E.; Chierzi, F.; Marzaroli, P.; Zanella, S.; Miglio, R.; Biavati, P.; Pandolfi, P. Mental health disorders and summer temperature-related mortality: A case crossover study. Int. J. Environ. Res. Public Health 2020, 17, 9122. [Google Scholar] [CrossRef]
- Oudin Åström, D.; Schifano, P.; Asta, F.; Lallo, A.; Michelozzi, P.; Rocklöv, J.; Forsberg, B. The effect of heat waves on mortality in susceptible groups: A cohort study of a mediterranean and a northern European City. Environ. Health 2015, 14, 1–8. [Google Scholar] [CrossRef] [Green Version]
- Kim, C.T.; Lim, Y.H.; Woodward, A.; Kim, H. Heat-attributable deaths between 1992 and 2009 in Seoul, South Korea. PLoS ONE 2015, 10, e0118577. [Google Scholar] [CrossRef] [Green Version]
- Rey, G.; Jougla, E.; Fouillet, A.; Pavillon, G.; Bessemoulin, P.; Frayssinet, P.; Hémon, D. The impact of major heat waves on all-cause and cause-specific mortality in France from 1971 to 2003. Int. Arch. Occup. Env.-Ment. Health 2007, 80, 615–626. [Google Scholar] [CrossRef] [PubMed]
- Rocklöv, J.; Forsberg, B.; Ebi, K.; Bellander, T. Susceptibility to mortality related to temperature and heat and cold wave duration in the population of Stockholm County, Sweden. Glob. Health Action 2014, 7, 22737. [Google Scholar] [CrossRef] [PubMed] [Green Version]
- Bark, N. Deaths of psychiatric patients during heat waves. Psychiatr. Serv. 1998, 49, 1088–1090. [Google Scholar] [CrossRef] [PubMed]
- De’Donato, F.K.; Stafoggia, M.; Rognoni, M.; Poncino, S.; Caranci, N.; Bisanti, L.; Perucci, C.A. Airport and city-centre temperatures in the evaluation of the association between heat and mortality. Int. J. Biometeorology 2008, 52, 301–310. [Google Scholar] [CrossRef] [PubMed]
- Kollanus, V.; Tiittanen, P.; Lanki, T. Mortality risk related to heatwaves in Finland–Factors affecting vulnerabil-ity. Environ. Res. 2021, 201, 111503. [Google Scholar] [CrossRef]
- Gu, S.; Zhang, L.; Sun, S.; Wang, X.; Lu, B.; Han, H.; Wang, A. Projections of temperature-related cause-specific mortality under climate change scenarios in a coastal city of China. Environ. Int. 2020, 143, 105889. [Google Scholar] [CrossRef] [PubMed]
- Florido Ngu, F.; Kelman, I.; Chambers, J.; Ayeb-Karlsson, S. Correlating heatwaves and relative humidity with sui-cide (fatal intentional self-harm). Sci. Rep. 2021, 11, 1–9. [Google Scholar] [CrossRef]
- Kubo, R.; Ueda, K.; Seposo, X.; Honda, A.; Takano, H. Association between ambient temperature and intentional injuries: A case-crossover analysis using ambulance transport records in Japan. Sci. Total Environ. 2021, 774, 145511. [Google Scholar] [CrossRef]
- Santurtún, M.; Sanchez-Lorenzo, A.; Del Real, Á.; Zarrabeitia, M.T.; Santurtún, A. Association between suicide and environmental variables in the north of Spain: A 14-year analysis. Cult. Med. Psychiatry 2018, 42, 647–653. [Google Scholar] [CrossRef]
- Williams, M.N.; Hill, S.R.; Spicer, J. Do hotter temperatures increase the incidence of self-harm hospitalisa-tions? Psychol. Health Med. 2016, 21, 226–235. [Google Scholar] [CrossRef]
- Grjibovski, A.M.; Kozhakhmetova, G.; Kosbayeva, A.; Menne, B. Associations between air temperature and daily suicide counts in Astana, Kazakhstan. Medicina 2013, 49, 59. [Google Scholar] [CrossRef]
- Bär, S.; Bundo, M.; de Schrijver, E.; Müller, T.; Vicedo Cabrera, A.M. Suicides and ambient temperature in Switzer-land: A nationwide time-series analysis. Swiss Med. Wkly. 2022, 152, w30115. [Google Scholar] [CrossRef]
- Chau, P.H.; Yip PS, F.; Lau EH, Y.; Ip, Y.T.; Law FY, W.; Ho RT, H.; Woo, J. Hot Weather and Suicide Deaths among Older Adults in Hong Kong, 1976–2014: A Retrospective Study. Int. J. Environ. Res. Public Health 2020, 17, 3449. [Google Scholar] [CrossRef]
- Lin, H.C.; Chen, C.S.; Xirasagar, S.; Lee, H.C. Seasonality and climatic associations with violent and nonviolent suicide: A population-based study. Neuropsychobiology 2008, 57, 32–37. [Google Scholar] [CrossRef]
- Helama, S.; Holopainen, J.; Partonen, T. Temperature-associated suicide mortality: Contrasting roles of climatic warming and the suicide prevention program in Finland. Environ. Health Prev. Med. 2013, 18, 349–355. [Google Scholar] [CrossRef] [Green Version]
- Ruuhela, R.; Hiltunen, L.; Venäläinen, A.; Pirinen, P.; Partonen, T. Climate impact on suicide rates in Finland from 1971 to 2003. Int. J. Biometeorol. 2009, 53, 167–175. [Google Scholar] [CrossRef]
- Aguglia, A.; Giacomini, G.; Montagna, E.; Amerio, A.; Escelsior, A.; Capello, M.; Amore, M. Meteorological vari-ables and suicidal behavior: Air pollution and apparent temperature are associated with high-lethality suicide attempts and male gender. Front. Psychiatry 2021, 12, 653390. [Google Scholar] [CrossRef] [PubMed]
- Barve, S.; Kumar, K.K.; Viswanathan, B. Weather Variability, Agricultural Productivity, And Farmer Suicides In India. Clim. Change Econ. 2021, 12, 2150005. [Google Scholar] [CrossRef]
- Akkaya-Kalayci, T.; Vyssoki, B.; Winkler, D.; Willeit, M.; Kapusta, N.D.; Dorffner, G.; Özlü-Erkilic, Z. The effect of seasonal changes and climatic factors on suicide attempts of young people. BMC Psychiatry 2017, 17, 1–7. [Google Scholar] [CrossRef] [Green Version]
- Müller, H.; Biermann, T.; Renk, S.; Reulbach, U.; Ströbel, A.; Kornhuber, J.; Sperling, W. Higher environmental temperature and global radiation are correlated with increasing suicidality—A localized data analysis. Chronobiol. Int. 2011, 28, 949–957. [Google Scholar] [CrossRef]
- Pan, R.; Honda, Y.; Minakuchi, E.; Kim, S.E.; Hashizume, M.; Kim, Y. Ambient temperature and external causes of death in Japan from 1979 to 2015: A time-stratified case-crossover analysis. Environ. Health Perspect. 2022, 130, 047004. [Google Scholar] [CrossRef] [PubMed]
- Burke, M.; González, F.; Baylis, P.; Heft-Neal, S.; Baysan, C.; Basu, S.; Hsiang, S. Higher temperatures increase sui-cide rates in the United States and Mexico. Nat. Clim. Chang. 2018, 8, 723–729. [Google Scholar] [CrossRef] [Green Version]
- Preti, A.; Lentini, G.; Maugeri, M. Global warming possibly linked to an enhanced risk of suicide: Data from Italy, 1974–2003. J. Affect. Disord. 2007, 102, 19–25. [Google Scholar] [CrossRef]
- Kim, Y.; Kim, H.; Gasparrini, A.; Armstrong, B.; Honda, Y.; Chung, Y.; Hashizume, M. Suicide and ambient temperature: A multi-country multi-city study. Environ. Health Perspect. 2019, 127, 117007. [Google Scholar] [CrossRef] [PubMed]
- Hu, J.; Wen, Y.; Duan, Y.; Yan, S.; Liao, Y.; Pan, H.; Jiang, H. The impact of extreme heat and heat waves on emergency ambulance dispatches due to external cause in Shenzhen, China. Environ. Pollut. 2020, 261, 114156. [Google Scholar] [CrossRef] [PubMed]
- Cheng, S.; Plouffe, R.; Nanos, S.M.; Qamar, M.; Fisman, D.N.; Soucy, J.P.R. The effect of average temperature on suicide rates in five urban California counties, 1999–2019: An ecological time series analysis. BMC Public Health 2021, 21, 1–9. [Google Scholar] [CrossRef] [PubMed]
- Page, L.A.; Hajat, S.; Kovats, R.S. Relationship between daily suicide counts and temperature in England and Wales. Br. J. Psychiatry 2007, 191, 106–112. [Google Scholar] [CrossRef]
- Casas, L.; Cox, B.; Nemery, B.; Deboosere, P.; Nawrot, T.S. High temperatures trigger suicide mortality in Brussels, Belgium: A case-crossover study (2002–2011). Environ. Res. 2022, 207, 112159. [Google Scholar] [CrossRef]
- Sim, K.; Kim, Y.; Hashizume, M.; Gasparrini, A.; Armstrong, B.; Sera, F.; Chung, Y. Nonlinear temperature-suicide association in Japan from 1972 to 2015: Its heterogeneity and the role of climate, demographic, and socioeconomic factors. Environ. Int. 2020, 142, 105829. [Google Scholar] [CrossRef]
- Gaxiola-Robles, R.; Celis de la Rosa, A.D.J.; Labrada-Martagón, V.; Díaz-Castro, S.C.; Zenteno-Savín, T. Incremento de la temperatura ambiental y su posible asociación al suicidio en Baja California Sur (BCS) 1985–2008. Salud Ment. 2013, 36, 421–427. [Google Scholar] [CrossRef] [Green Version]
- Yarza, S.; Vodonos, A.; Hassan, L.; Shalev, H.; Novack, V.; Novack, L. Suicide behavior and meteorological charac-teristics in hot and arid climate. Environ. Res. 2020, 184, 109314. [Google Scholar] [CrossRef] [PubMed]
- Likhvar, V.; Honda, Y.; Ono, M. Relation between temperature and suicide mortality in Japan in the presence of other confounding factors using time-series analysis with a semiparametric approach. Environ. Health Prev. Med. 2011, 16, 36–43. [Google Scholar] [CrossRef] [PubMed] [Green Version]
- Deisenhammer, E.A.; Kemmler, G.; Parson, P. Association of meteorological factors with suicide. Acta Psychiatrica Scandinavica 2003, 108, 455–459. [Google Scholar] [CrossRef] [PubMed]
- Holopainen, J.; Helama, S.; Partonen, T. Does diurnal temperature range influence seasonal suicide mortality? Assessment of daily data of the Helsinki metropolitan area from 1973 to 2010. Int. J. Biometeorol. 2014, 58, 1039–1045. [Google Scholar] [CrossRef]
- Bozsonyi, K.; Lester, D.; Fulop, A.N.D.R.E.A.; Zonda, T.; Balint, L. The effects of sunshine duration and ambient temperature on suicides in Hungary. Neuropsychopharmacol. Hung. 2020, 22, 23–28. [Google Scholar]
- Begum, T.F.; Lin, Z.; Primeau, M.; Lin, S. Assessing short-term and long-term mental health effects among older adults after Hurricane Sandy. Sci. Total Environ. 2022, 825, 153753. [Google Scholar] [CrossRef]
- Wu, Y.; Yao, Z.; Ma, G.; Cheng, J.; Xu, H.; Qin, W.; Su, H. Effects of extreme precipitation on hospitalization risk and disease burden of schizophrenia in urban and rural Lu’an, China, from 2010 to 2019. Environ. Sci. Pollut. Res. 2022, 29, 19176–19184. [Google Scholar] [CrossRef]
- Reifels, L.; Bassilios, B.; Spittal, M.J.; King, K.; Fletcher, J.; Pirkis, J. Patterns and predictors of primary mental health service use following bushfire and flood disasters. Disaster Med. Public Health Prep. 2015, 9, 275–282. [Google Scholar] [CrossRef] [Green Version]
- Shih, H.I.; Chao, T.Y.; Huang, Y.T.; Tu, Y.F.; Wang, J.D.; Chang, C.M. Increased incidence of stress-associated illnesses among elderly after Typhoon Morakot. J. Formos. Med. Assoc. 2021, 120, 337–345. [Google Scholar] [CrossRef]
- Krug, E.G.; Kresnow, M.J.; Peddicord, J.P.; Dahlberg, L.L.; Powell, K.E.; Crosby, A.E.; Annest, J.L. Suicide after natural disasters. New Engl. J. Med. 1998, 338, 373–378. [Google Scholar] [CrossRef]
- Matsubayashi, T.; Sawada, Y.; Ueda, M. Natural disasters and suicide: Evidence from Japan. Soc. Sci. Med. 2013, 82, 126–133. [Google Scholar] [CrossRef] [PubMed]
- Lee, H.; Jung, J.; Myung, W.; Baek, J.H.; Kang, J.M.; Kim, D.K.; Kim, H. Association between dust storm occur-rence and risk of suicide: Case-crossover analysis of the Korean national death database. Environ. Int. 2019, 133, 105146. [Google Scholar] [CrossRef] [PubMed]
- Richardson, R.A.; Harper, S.; Weichenthal, S.; Nandi, A.; Mishra, V.; Jha, P. Extremes in water availability and suicide: Evidence from a nationally representative sample of rural Indian adults. Environ. Res. 2020, 190, 109969. [Google Scholar] [CrossRef] [PubMed]
- Alam, I.; Otani, S.; Nagata, A.; Khan, M.S.; Masumoto, T.; Amano, H.; Kurozawa, Y. Short-and Long-Term Effects of Drought on Selected Causes of Mortality in Northern Bangladesh. Int. J. Environ. Res. Public Health 2022, 19, 3425. [Google Scholar] [CrossRef]
- Hanigan, I.C.; Butler, C.D.; Kokic, P.N.; Hutchinson, M.F. Suicide and drought in new South Wales, Australia, 1970–2007. Proc. Natl. Acad. Sci. USA 2012, 109, 13950–13955. [Google Scholar] [CrossRef] [PubMed] [Green Version]
- Horney, J.A.; Karaye, I.M.; Abuabara, A.; Gearhart, S.; Grabich, S.; Perez-Patron, M. The impact of natural disas-ters on suicide in the United States, 2003–2015. Crisis 2021, 42, 328–334. [Google Scholar] [CrossRef]
- WMO. Emissions Gap Report 2019; WMO: Geneva, Switzerland, 2019. [Google Scholar]
- Climate Action Tracker. 2100 Warming Projections: Emissions and expected warming based on pledges and current policies. November 2022. Available online: https://climateactiontracker.org/global/temperatures/ (accessed on 25 October 2022).
- Malik, A.; Lenzen, M.; McAlister, S.; McGain, F. The carbon footprint of Australian health care. Lancet Planet. Health 2018, 2, e27–e35. [Google Scholar] [CrossRef]
- Pörtner, H.-O.; Roberts, D.; Tignor, M.; Poloczanska, E.; Mintenbeck, K.; Alegría, A.; Craig, M.; Langsdorf, S.; Löschke, S.; Möller, V.; et al. IPCC, 2022: Climate Change 2022: Impacts, Adaptation and Vulnerability. Contribution of Working Group II to the Sixth Assessment Report of the Intergovernmental Panel on Climate Change; Cambridge University Press: Cambridge, UK, 2022; p. 3056. [Google Scholar]
- Koop, L.K.; Tadi, P. Physiology, Heat Loss. In StatPearls; StatPearls Publishing: Treasure Island, FL, USA, 2019. [Google Scholar]


| Inclusion Criteria | Exclusion Criteria |
|---|---|
| Literature and Population | |
|
|
| Exposures | |
|
|
| |
| Outcomes | |
|
|
| Exposure | MH Outcome | MH Service Demand | |||||||||||||||||||||||
|---|---|---|---|---|---|---|---|---|---|---|---|---|---|---|---|---|---|---|---|---|---|---|---|---|---|
| Warmer than average | Heatwave | Other weather variables * | Diurnal Temperature Range (DTR) | Extreme events | MH in general | Organic disorders | Substance misuse | Schizophrenia | Mood disorders | Neurotic disorders | Behavioural disorders | Personality disorders | Mental retardation | Autism spectrum | Behavioural disorders w/onset during childhood/adolescence | Suicide behavior | Emergency department visit | Hospital admission | Ambulance dispatch | Outpatient visits | Suicide | Mortality | Phone calls or services in general | Measure of outcome | |
| No. of studies (n) | 70 | 18 | 11 | 5 | 12 | 38 | 17 | 18 | 25 | 27 | 18 | 6 | 5 | 4 | 2 | 4 | 42 | 20 | 34 | 3 | 1 | 34 | 15 | 6 | |
| Lee et al. (2018), South Korea [34] | x | x | x | x | x | x | x | Relative risk | |||||||||||||||||
| Chan et al. (2018), Japan [35] | x | x | x | x | Relative risk | ||||||||||||||||||||
| Zhang et al. (2020), China [36] | x | x | x | x | x | x | Odds ratio | ||||||||||||||||||
| Nori-Sarma et al. (2022), USA [37] | x | x | x | x | x | x | x | x | x | x | Incidence rate ratio | ||||||||||||||
| Trang et al. (2016), Vietnam [38] | x | x | x | x | x | x | x | x | x | x | x | Relative risk | |||||||||||||
| Trang et al. (2016), Vietnam [39] | x | x | x | x | Relative risk | ||||||||||||||||||||
| Basu et al. (2017), USA [40] | x | x | x | x | x | x | % change | ||||||||||||||||||
| Yoo et al. (2021), USA [41] | x | x | x | x | x | x | x | x | Relative risk | ||||||||||||||||
| Hansen et.al. (2008), Australia [42] | x | x | x | x | x | x | x | x | x | x | x | x | x | x | x | Incidence rate ratio | |||||||||
| Middleton et al. (2021), Canada [43] | x | x | x | x | x | Incidence rate ratio | |||||||||||||||||||
| Vida et al. (2012), Canada [44] | x | x | x | Incidence rate ratio | |||||||||||||||||||||
| Wang et al. (2013), Canada [45] | x | x | x | x | x | x | x | Relative risk | |||||||||||||||||
| Niu et al. (2020), China [46] | x | x | x | x | x | x | x | Relative risk | |||||||||||||||||
| Liu et al. (2018), China [47] | x | x | x | Odds ratio | |||||||||||||||||||||
| Sun et al. (2021), USA [48] | x | x | x | Excess relative risk | |||||||||||||||||||||
| Shiue et al. (2016), Germany [49] | x | x | x | x | x | x | x | x | Correlation | ||||||||||||||||
| Settineri et al. (2016), Italy [50] | x | x | x | x | x | x | x | Correlation | |||||||||||||||||
| Yoo et al. (2021), USA [51] | x | x | x | x | x | x | x | x | Relative risk | ||||||||||||||||
| Peng et al. (2017), China [52] | x | x | x | Relative risk | |||||||||||||||||||||
| Schmeltz et al. (2017), USA [53] | x | x | x | x | x | x | x | x | x | x | x | Risk ratio | |||||||||||||
| Min et al. (2019), China [54] | x | x | x | x | Relative risk | ||||||||||||||||||||
| Bundo et al. (2021), Switzerland [55] | x | x | x | x | x | x | x | x | x | x | x | x | x | x | Relative risk | ||||||||||
| Xu et al. (2018), Australia [56] | x | x | x | Relative risk | |||||||||||||||||||||
| Wondmagegn et al. (2021), Australia [57] | x | x | x | Attributable risk | |||||||||||||||||||||
| Nitschke et al. (2007), Australia [58] | x | x | x | x | x | Incidence rate ratio | |||||||||||||||||||
| Dang et al. (2022), Vietnam [59] | x | x | x | x | x | x | Relative risk | ||||||||||||||||||
| Carlsen et al. (2019), Sweden [60] | x | x | x | %change | |||||||||||||||||||||
| Khalaj et al. (2010), Australia [61] | x | x | x | Relative odds | |||||||||||||||||||||
| Williams et al. (2011), Australia [62] | x | x | x | x | Incidence rate ratio | ||||||||||||||||||||
| Calkins et al. (2016), USA [63] | x | x | x | x | Relative risk | ||||||||||||||||||||
| Wei et al. (2019), USA [64] | x | x | x | x | Razard ratio | ||||||||||||||||||||
| Culqui et al. (2017), Spain [65] | x | x | x | Relative risk | |||||||||||||||||||||
| Xu et al. (2019), Australia [66] | x | x | x | x | Relative risk | ||||||||||||||||||||
| Gong et al. (2022), England [67] | x | x | x | Relative risk | |||||||||||||||||||||
| Zhang et al. (2016), Australia [68] | x | x | x | Odds ratio | |||||||||||||||||||||
| Pan et al. (2021), China [69] | x | x | x | x | Relative risk | ||||||||||||||||||||
| Zhao et al. (2016), China [70] | x | x | x | Relative risk | |||||||||||||||||||||
| Yi et al. (2019), China [71] | x | x | x | Relative risk | |||||||||||||||||||||
| Pan et al. (2019), China [72] | x | x | x | Attributable and relative risk | |||||||||||||||||||||
| Pan et al. (2021), China [73] | x | x | x | Relative risk | |||||||||||||||||||||
| Zhao et al. (2016), China [74] | x | x | x | x | Relative risk | ||||||||||||||||||||
| Tang et al. (2021), China [75] | x | x | x | Relative risk | |||||||||||||||||||||
| Sung et al. (2011), Taiwan [76] | x | x | x | x | Relative risk | ||||||||||||||||||||
| Shiloh et al. (2004), Israel [77] | x | x | x | Correlation | |||||||||||||||||||||
| Wang et al. (2018), China (135) [78] | x | x | x | Relative risk | |||||||||||||||||||||
| Chen et al. (2018), Taiwan [79] | x | x | x | Hazard ratio | |||||||||||||||||||||
| Parker et al. (2016), Australia [80] | x | x | x | Correlation | |||||||||||||||||||||
| Medici et al. (2016), Denmark [81] | x | x | x | Regression correlation | |||||||||||||||||||||
| Volpe et al. (2006), Brazil [82] | x | x | x | Correlation | |||||||||||||||||||||
| Shapira et al. (2004), Israel [83] | x | x | x | Correlation | |||||||||||||||||||||
| Volpe et al. (2010), Brazil [84] | x | x | x | x | Correlation | ||||||||||||||||||||
| Medici et al. (2016), Denmark [85] | x | x | x | Correlation | |||||||||||||||||||||
| Zanobetti et al. (2013), USA [86] | x | x | x | Odds ratio | |||||||||||||||||||||
| Ho C. H. & Wong M. S. (2019), China [87] | x | x | x | Incidence risk ratio | |||||||||||||||||||||
| Stivanello et al. (2020), Italy [88] | x | x | x | Odds ratio | |||||||||||||||||||||
| Åström et al. (2015), Italy and Sweden [89] | x | x | x | Relative risk | |||||||||||||||||||||
| Kim et al. (2015), South Korea [90] | x | x | x | x | x | x | x | x | Relative risk | ||||||||||||||||
| Rey et al. (2007), France [91] | x | x | x | Relative mortality ratio | |||||||||||||||||||||
| Page et al. (2012), England [11] | x | x | x | x | Relative risk | ||||||||||||||||||||
| Rocklov et al. (2014), Sweden [92] | x | x | x | Odds ratio | |||||||||||||||||||||
| Bark, Nigel (1998), USA [93] | x | x | x | Relative risk | |||||||||||||||||||||
| de’Donato et al. (2007), Italy [94] | x | x | x | %change | |||||||||||||||||||||
| Kollanus et al. (2021), Finland [95] | x | x | x | %change | |||||||||||||||||||||
| Gu et al. (2020), China [96] | x | x | x | Relative risk | |||||||||||||||||||||
| Florido Ngu et al. (2021), 60 countries [97] | x | x | x | Incidence risk ratio | |||||||||||||||||||||
| Kubo et al. (2021), Japan [98] | x | x | x | Relative risk | |||||||||||||||||||||
| Santurtún et al. (2018), Spain [99] | x | x | x | %change | |||||||||||||||||||||
| Williams et al. (2015), New Zealand [100] | x | x | x | Increase in incidence | |||||||||||||||||||||
| Grjibovski et al. (2013), Kazakhstan [101] | x | x | x | %change | |||||||||||||||||||||
| Bär et al. (2022), Switzerland [102] | x | x | x | Relative risk | |||||||||||||||||||||
| Chau et al. (2020), China [103] | x | x | x | Bayesian information criterion | |||||||||||||||||||||
| Lin et al. (2008), Taiwan [104] | x | x | x | Correlation | |||||||||||||||||||||
| Warmer than average | Heatwave | Other weather variables * | Diurnal Temperature Range (DTR) | Extreme events | MH in general | Organic disorders | Substance misuse | Schizophrenia | Mood disorders | Neurotic disorders | Behavioural disorders | Personality disorders | Mental retardation | Autism spectrum | Behavioural disorders w/onset during childhood/adolescence | Suicide behavior | Emergency department visit | Hospital admission | Ambulance dispatch | Outpatient visits | Suicide | Mortality | Phone calls or services in general | Measure of outcome | |
| Helama et al. (2013), Finland [105] | x | x | x | Correlation | |||||||||||||||||||||
| Ruuhela et al. (2009), Finland [106] | x | x | x | Regression coefficient | |||||||||||||||||||||
| Aguglia et al. (2021), Italy [107] | x | x | x | Correlation | |||||||||||||||||||||
| Barve et al. (2021), India [108] | x | x | x | %change | |||||||||||||||||||||
| Akkaya-Kalayci et al. (2017), Turkey [109] | x | x | x | Correlation | |||||||||||||||||||||
| Mueller et al. (2011), Germany [110] | x | x | x | %change | |||||||||||||||||||||
| Pan et al. (2022), Japan [111] | x | x | x | Relative risk | |||||||||||||||||||||
| Burke et al. (2018), USA and Mexico [112] | x | x | x | %change | |||||||||||||||||||||
| Preti et al. (2007), Italy [113] | x | x | x | Correlation | |||||||||||||||||||||
| Kim et al. (2018), 12 countries [114] | x | x | x | Relative risk | |||||||||||||||||||||
| Hu et al. (2020), China [115] | x | x | x | Relative risk | |||||||||||||||||||||
| Cheng et al. (2021), USA [116] | x | x | x | Incidence risk ratio | |||||||||||||||||||||
| Page et al. (2007), England and Wales [117] | x | x | x | x | %change | ||||||||||||||||||||
| Casas et al. (2021), Belgium [118] | x | x | x | Risk ratio | |||||||||||||||||||||
| Sim et al. (2020), Japan [119] | x | x | x | Relative risk | |||||||||||||||||||||
| Gaxiola-Robles et al. (2013), Mexico [120] | x | x | x | Coefficient of determination | |||||||||||||||||||||
| Yarza et al. (2020), Israel [121] | x | x | x | Odds ratio | |||||||||||||||||||||
| Likhvar et al. (2010), Japan [122] | x | x | x | Risk estimate | |||||||||||||||||||||
| Deisenhammer et al. (2003), Austria [123] | x | x | x | Relative risk | |||||||||||||||||||||
| Holopainen et al. (2014), Finland [124] | x | x | x | Correlation | |||||||||||||||||||||
| Bozsonyi et al. (2020), Hungary [125] | x | x | x | Stationary R squared | |||||||||||||||||||||
| Begum et al. (2022), USA [126] | x | x | x | x | x | x | x | x | Risk Ratio | ||||||||||||||||
| Phillippi et al. (2019), USA [19] | x | x | x | x | x | x | Descriptive comparison | ||||||||||||||||||
| Wu et al. (2021), China-Lu’na [127] | x | x | x | Relative risk | |||||||||||||||||||||
| Reifels et al. (2015), Australia [128] | x | x | x | x | Incidence Rate Ratio | ||||||||||||||||||||
| Shih et al. (2020), Taiwan [129] | x | x | x | x | x | x | %increase in incidence | ||||||||||||||||||
| Krug et al. (1998), USA [130] | x | x | x | %change | |||||||||||||||||||||
| Matsubayashi et al. (2012), Japan [131] | x | x | x | %increase in incidence | |||||||||||||||||||||
| Lee et al. (2019), South Korea [132] | x | x | x | Relative risk | |||||||||||||||||||||
| Richardson et al. (2020), India [133] | x | x | x | Relative risk | |||||||||||||||||||||
| Alam et al. (2022), India [134] | x | x | x | Relative risk | |||||||||||||||||||||
| Hanigan et al. (2012), Australia [135] | x | x | x | Relative risk | |||||||||||||||||||||
| Horney et al. (2022), USA [134,136] | x | x | x | %change and rate difference | |||||||||||||||||||||
| Disorder Group | N. | Main Results (* CI 95%) | |
|---|---|---|---|
| EDV | MH in general | 1 | Risk ratio 1.32 * (1.24–1.40)—hurricane [126] |
| Substance misuse | 1 | Risk ratio 1.44 * (1.23–1.65)—hurricane [126] | |
| Mood disorders | 1 | Risk ratio 1.59 * (1.39–1.80)—hurricane [126] | |
| Neurotic disorders | 2 | Risk ratio 0.79 * (0.72–0.86)—hurricane [126]|Risk ratio 0.80 * (0.73–0.87)—hurricane [126] | |
| Suicide behavior | 1 | Risk ratio 1.76 * (1.72–1.80) [126] | |
| HA | MH in general | 1 | Risk ratio 1.08 * (1.05, 1.10)—hurricane [126] |
| Substance misuse | 1 | Risk ratio 1.12 * (1.04–1.21)—hurricane [126] | |
| Schizophrenia | 1 | RR 1.056 * (1.003–1.110)—extreme precipitation [127] | |
| Mood disorders | 1 | Risk ratio 1.67 * (1.47–1.87)—hurricane [126] | |
| Neurotic disorders | 2 | Risk ratio 1.26 * (1.21–1.31)—hurricane [126]|Risk ratio 0.85 * (0.77–0.94)—hurricane [126] | |
| Suicide behavior | 1 | Risk ratio 0.68 * (0.62–0.63)—hurricane [126] | |
| Substance misuse | 1 | Increase in number of visits + 66%—flood [19] | |
| Health services in general | Mood disorders | 3 | IRR 2.57 * (1.60, 4.14)—bushfire and flood [126]|%increase in incidence 308%—hurricane [129]|Increase in number of visits + 44%—flood [19] |
| Neurotic disorders | 3 | IRR 2.06 * (1.21, 3.49)—bushfire and flood [126]|%increase in incidence 307%—hurricane [129]|Increase in number of visits +62%—flood [19] | |
| Behavioral disorders | 1 | %Increase in incidence 356%—hurricane [129] | |
| Suicide behavior | 1 | %Increase in incidence 18.8%—hurricane [129] | |
| Suicide | Suicide behavior | 6 | RR 1.15 * (1.08–1.22)—extreme dry weather [135]|RR 4.23 * (1.28–13.93)—drought [134]|%change 18.7% *—extremely wet [133]|RR 1.198 * (1.065–1.347)—Asian dust storm [132]|Increase in incidence 0.6% *—different extreme events [131]|%change 14.8% * (5.4–24.2)—different extreme events [130] |
| Disorder Group | N | Main Results (* CI 95%) | |
|---|---|---|---|
| EDV | MH in general | 3 | RR 1.158 * (1.092–1.227) [34]|IRR 1.08 * (1.07–1.09) [37]|%change 4.8% * (3.6–6.0) [40] |
| Organic disorders | 3 | RR 1.045 * (1.029–1.061) [67]|RR 1.31 * (1.22–1.41) [51] | |
| Substance misuse | 4 | IRR 1.08 * (1.07–1.10) [37]|RR 1.30 * (1.18–1.42) [51]|RR 1.14 * (1.03–1.32) [45]|RR 3.021 * (1.601–5.703) [46] | |
| Schizophrenia | 3 | IRR 1.05 * (1.03–1.07) [37]|RR 2.49 * (1.69–3.69) [45]|RR 1.27 * (1.17–1.38) [51] | |
| Mood disorders | 5 | IRR 1.07 * (1.05–1.09) [37]|RR 1.05 * (1.01–1.09) (39)|RR 1.68 * (1.17–2.40) [45]|RR 1.33 * (1.03–1.71) [51] | |
| Neurotic disorders | 5 | IRR 1.07 * (1.05–1.09) [37]|%change 5.7% * (3.8–7.6) [40]|RR 1.12 * (1.00–1.27) [45]|correlation r = 0.1947* [50]|RR 1.27 * (1.19–1.36) [51] | |
| Disorders w/onset during childhood/adolescence | 2 | IRR 1.11 * (1.05–1.18) [37] | |
| Suicide behaviour | 2 | IRR 1.06 * (1.01–1.12) [37]|%change 5.8% * (4.5–7.1) [40] | |
| HA | MH in general | 4 | RR 1.09 * (1.03–1.15) [35]|RR 1.266 * (1.074–1.493) [52]|RR 1.04 * (1.02–1.07) [55]|RR 1.62 * (1.36–1.93) [59] |
| Organic disorders | 6 | RR 1.84 * (1.66–2.03) [53]|HR 1.12 * (1.09–1.15) [64]|RR: 1.30 * (1.12–1.52) [65]|RR 1.51 * (1.02–1.126) [66]|OR 8.33 * [68]|IRR 1.213 * (1.091–1.349) [42] | |
| Substance misuse | 3 | RR 1.13 * (1.00, 1.27) [35]|RR 1.38 * (1.30–1.47) [53]|RR 2.21 * (1.55–3.15) [59] | |
| Schizophrenia | 15 | RR 1.10 * (1.04–1.15) [55]|RR 1.50 * (1.20–1.86) [59]|RR 1.195 * (1.041–1.372)# [69]|RR 1.021 * (1.007–1.035)% [69]|RR 1.319 * (1.129–1.540)$ [70]|RR 1.187 * (1.057–1.332)# [70]|RR 1.07 * (1.04–1.11) [78]|RR 1.373 * (1.168–1.614) [71]|RR 1.005* (1.003–1.008) [72]|RR 1.38 * (1.13–1.69) [73]|RR 1.159 * (1.050–1.279)# [74]|RR 1.111 * (1.002–1.231)$ [75]|RR 1.189* (1.051–1.279)! [75]|RR 1.08 * (1.04–1.11) [76]|Correlation r 0.35 * [77] | |
| Mood disorders | 4 | RR 1.34 * (1.05 1.71) [35]|IRR 1.034 * (1.009–1.05) [62]|Regression coefficient 0.12 * [81]|Pearson’s correlation r: 0.27 * [83]|IRR 1.091 * (1.004–1.185) [42] | |
| Neurotic disorders | 1 | IRR 1.097 * (1.018–1.181) [42] | |
| Disorders of psychological development | 1 | IRR 1.641 * (1.086–2.480) [42] | |
| Disorders with onset during childhood/adolescence | 1 | RR 1.29 * (1.09–1.54) [55]|IRR 0.578 * (0.349–0.955) [42] | |
| Suicide behavior | 1 | %change 0.7% * (0.003–0.011) [100] | |
| Mortality | MH in general | 9 | IRR 1.033 * (1.004–1.062) [87]|OR 1.055 * (1.024–1.086) [88]|RR 1.33 * (1.10–1.61) [89]|RR 1.04 * (1.01–1.07) [90]|RMR 1.23 * [91]|RR 1.049 * (1.02–1.078) [11]]|OR 1.099 * (1.027, 1.175) [92]|RR 1.38* [93]|%change 29.7% * (21.3–38.6) [95] |
| Organic disorders | 3 | Alzheimer’s disease OR 1.08 * (1.04–1.12) [86]|Dementia OR 1.04 * (1.02–1.09) [86]|RR 1.03 * (1.00–1.07) [11]|RR 269% * (76–665%) [66] | |
| Substance misuse | 2 | RR 1.07 * (1.02–1.13) [90]|RR 1.20 * (1.08 1.35) [11] | |
| Mood disorders | 2 | OR 1.083 * [88]|%change 166% * (35–424) [94] | |
| Suicide | Suicide behavior | 24 | RR 0.97 * (0.95–0.99) [90]|IRR 1.035 * [97]|IRR 0.932 * [97]|%change 2.1% * (0.4–3.8%) [101]|RR 1.34 * (1.19–1.52) [102]|association 0.2012 * [104]; Pearson’s correlation 0.617 * [105]|regression coefficient 0.829 * [106]|correlation 0.75 * [107]; Spearman correlation 0.213 * [109]|%change 0.9% * [110]|RR 1.35 * (1.26–1.45) [111]|%change 0.68% * (0.53%–0.83%) [112]|%change 2.1% * (1.2–3.0%) [112]|correlation coefficient 0.55 * [113]|RR 1.33* (1.30–1.36) [114]|IRR 1.0082 * (1.0025–1.0140) [116]|%change 46.9% (15.6–86.8) [117]|risk ratio 2.16 * (1.28–3.63) [118]|RR 1.26 * (1.22–1.29) [119]|coefficient of determination R2 0.64 * [120]|OR 1.59 * (1.22–2.08) [121]|risk estimate 0.0435 * [122]|RR 1.12 * (1.02–1.24) [123]|Pearson’s correlation 0.428 * [124] |
| Ambulance dispatch | Suicide attempt | 2 | RR: 1.11* (1.07–1.15) [98]|RR 4.53* (1.23–16.68) [115] |
Disclaimer/Publisher’s Note: The statements, opinions and data contained in all publications are solely those of the individual author(s) and contributor(s) and not of MDPI and/or the editor(s). MDPI and/or the editor(s) disclaim responsibility for any injury to people or property resulting from any ideas, methods, instructions or products referred to in the content. |
© 2023 by the authors. Licensee MDPI, Basel, Switzerland. This article is an open access article distributed under the terms and conditions of the Creative Commons Attribution (CC BY) license (https://creativecommons.org/licenses/by/4.0/).
Share and Cite
Corvetto, J.F.; Helou, A.Y.; Dambach, P.; Müller, T.; Sauerborn, R. A Systematic Literature Review of the Impact of Climate Change on the Global Demand for Psychiatric Services. Int. J. Environ. Res. Public Health 2023, 20, 1190. https://doi.org/10.3390/ijerph20021190
Corvetto JF, Helou AY, Dambach P, Müller T, Sauerborn R. A Systematic Literature Review of the Impact of Climate Change on the Global Demand for Psychiatric Services. International Journal of Environmental Research and Public Health. 2023; 20(2):1190. https://doi.org/10.3390/ijerph20021190
Chicago/Turabian StyleCorvetto, Julia Feriato, Ammir Yacoub Helou, Peter Dambach, Thomas Müller, and Rainer Sauerborn. 2023. "A Systematic Literature Review of the Impact of Climate Change on the Global Demand for Psychiatric Services" International Journal of Environmental Research and Public Health 20, no. 2: 1190. https://doi.org/10.3390/ijerph20021190