Abstract
(1) Background: Recognising the full spatial and temporal distribution of PM2.5 is important in order to understand the formation, evolution and impact of pollutants. The high temporal resolution satellite, Himawari-8, providing an hourly AOD dataset, has been used to predict real-time hourly PM2.5 concentrations in China in previous studies. However, the low observation frequency of the AOD due to long-term cloud/snow cover or high surface reflectance may produce high uncertainty in characterizing diurnal variation in PM2.5. (2) Methods: We fill the missing Himawari-8 AOD with MERRA-2 AOD, and drive the random forest model with the gap-filled AOD (AODH+M) and Himawari-8 AOD (AODH) to estimate hourly PM2.5 concentrations, respectively. Then we compare AODH+M-derived PM2.5 with AODH-derived PM2.5 in detail. (3) Results: Overall, the non-random missing information of the Himawari-8 AOD will bring large biases to the diurnal variations in regions with both a high polluted level and a low polluted level. (4) Conclusions: Filling the gap with the MERRA-2 AOD can provide reliable, full spatial and temporal PM2.5 predictions, and greatly reduce errors in PM2.5 estimation. This is very useful for dynamic monitoring of the evolution of PM2.5 in China.
1. Introduction
PM2.5 (particulate matter with an aerodynamic equivalent diameter less than or equal to 2.5 μm) emitted from anthropogenic and natural sources has a great adverse effect on human health, the climate and the environment [1,2,3]. China has suffered seriously from PM2.5 pollution in recent decades with rapid urbanization and industrialization [4,5,6]. Under the strategy of air pollution control, a ground-based observation network has been established to monitor air pollution in real time. Although it provides high-quality PM2.5 measurements every hour, there is a huge limitation in its spatial coverage due to the sparse and uneven distribution of monitoring stations. Therefore, satellite-based aerosol optical depth (AOD) has been widely used to estimate PM2.5 due to its strong relationship with ground-level PM2.5 [7,8,9]. Owing to the convenience of obtaining observations from monitoring stations in recent years, statistical approaches that combine satellite-retrieved AOD data with PM2.5 observations have become the main method to produce spatial continuous PM2.5 concentrations. These include the linear mixed effect (LME) model [10], generalized additive models (GAM) [11], geographically weighted regression (GWR)-related models [12,13] and hybrid models [10]. In essence, these statistical methods are still dominated by linear methods. With the development of deep learning, lots of novel machine learning methods such as random forest (RF), the deep neural network (DNN), the Extreme Gradient Boosting (XGBoost) and the Light Gradient Boosting Machine (LightGBM) have been induced to produce high accuracy PM2.5 concentrations over China [14,15,16].
In addition to the predicting model, the large rate of non-random missing information from AOD retrieval is an important factor that may lead to inevitably biases in monthly or yearly ground-level PM2.5 calculations [7,17,18]. Therefore, some researches tried to fill the gap in AOD retrieval to obtain full coverage ground-level PM2.5 concentrations. Xiao et al. combined Multi-Angle Implementation of Atmospheric Correction (MAIAC) with chemical transport model simulations through a multiple imputation method to fill the missing AOD [19]. Chen et al. developed a two-step interpolation method to replace the missing values in AOD [20]. Tuygun et al. merged MODIS, AERONET and MERRA-2 data to estimate PM10 concentrations.
These studies mainly paid attention to filling the gap of AOD products obtained from polar-orbiting satellites to estimate daily PM2.5 concentrations. The geostationary orbit satellite such as Himawari-8 equipped with the Advanced Himawari Imager (AHI) can provide a high temporal resolution AOD product that is useful for the diurnal variation investigation of air pollution. Recently, some researches have begun to estimate real-time hourly ground-level PM2.5 from the Himawari-8 AOD product [15,20,21,22]. However, most of these studies have focused on PM2.5 estimation models but not the essential relation between PM2.5 and AOD [23]. Xu et al. conducted a comprehensive investigation of the relationship between PM2.5 and the Himawari-8 AOD for the period of 2016–2018 in China, and found that due to different meteorological conditions, dominant aerosol type and AOD availability, the correlation between PM2.5 and the AOD fluctuate in different regions. Furthermore, cloud cover, land surface and the degree of pollution are different in major populated areas in China, such as Beijing–Tianjin–Hebei (BTH), the Pearl River Delta (PRD), the Yangtze River Delta (YRD) and Chengdu–Chongqing (CY). The error and missing rate in satellite-retrieved AODs due to these factors may introduce huge biases in hourly PM2.5 estimation and misunderstanding of the diurnal variation in PM2.5.
Focusing on the above issues, we fill the gaps of the Himawari-8 AOD with MERRA-2 AODs, and employ a RF model to estimate hourly ground-level PM2.5 in China from March 2017 to February 2018. After that, we present a comprehensive comparison of PM2.5 estimation based on the gap-filled AOD with that based on the non-gap-filled AOD, and then investigate the influence of the missing AOD on diurnal variation in densely populated regions including BTH, YRD, PRD and CY. This study provides full coverage of hourly PM2.5 predictions across China, which is helpful to obtain accurate diurnal variations in PM2.5 and reduce errors in exposure assessments to air pollution.
2. Materials and Methods
2.1. Data Source
2.1.1. PM2.5 and AOD Data
The Environmental Protection Agency of China have published real-time hourly PM2.5 concentrations for the major cities in China on website (http://106.37.208.233:20035/) since January 2013. Ground-level hourly PM2.5 concentrations from 1441 monitoring stations in mainland China during March 2017 to February 2018 were collected from this website. The PM2.5 concentrations were measured by tapered element oscillating microbalance (TEOM) with the same ambient quality control standard.
The AHI sensor onboard Himawari-8 has provided hourly AOD (AODH) at a 5 km resolution since 2014, and the coverage is 80° E–160° W and 60° N–60° S, which includes most regions of China. The validation of Himawari-8 AOD retrieval shows that Himawari-8 AOD has a high correlation with AERONET and Sun-Sky radiometer observation network over China [24]. We downloaded the L3 hourly AOD data from FTP address (ftp.ptree.jaxa.jp) provided by Japan Aerospace Exploration Agency (JAXA), and selected reliable AOD values through quality assurance flag that marked as ‘very good’ and ‘good’.
NASA’s Global Modeling and Assimilation Office (GMAO) produced the new atmospheric reanalysis product, namely, the Modern-Era Retrospective Analysis for Research and Applications, version 2 (MERRA-2) in 2017 [25]. MERRA-2 provides multi-decadal reanalysis of aerosol products that assimilate millions of aerosol observations from satellites and surface monitoring stations. Zhang et al. systematically evaluated the performance of Himawari-8 AODs and two reanalysis AOD datasets offered by MERRA-2 and Copernicus Atmosphere Monitoring Service (CAMS) over China [26]. They found that Himawari-8 and MERRA-2 AODs showed similar accuracies overall, and both presented significant diurnal variations. However, the accuracy of AOD products could be affected by pollution level, pollution distribution patterns and meteorological conditions. Recently, the accuracy of MERRA-2 AOD in China has been evaluated in many researches [27,28], and the results show that MERRA-2 AOD is in high agreement with both the Aerosol Robotic Network (AERONET) AOD and satellited-retrieved AOD. Studies have confirmed that the use of MERRA-2 AOD combined with machine learning models can estimate PM2.5 concentrations with reasonable accuracy [29]. Therefore, we selected MERRA-2 AODs to fill the gap of Himawari-8 AODs to obtain hourly full coverage AODs. The hourly MERRA-2 aerosol diagnostic dataset (AODM) at the spatial resolution of 0.625° × 0.5° was used to fill gap of Himawari-8 AOD in this study.
2.1.2. Auxiliary Data
The commonly used variables in previous researches including meteorological factors, normalized difference vegetation index (NDVI), population density, road network data, NO2 concentrations and DEM were selected as covariates in this study [30,31]. Meteorological data such as hourly air temperature, wind speed, specific humidity, surface pressure, total precipitation and boundary layer height were obtained from the Goddard Earth Observing System Assimilation System GEOS-5 Forward Processing (https://fluid.nccs.nasa.gov/weather/) at a spatial resolution of 0.25° × 0.3125°. NDVI data at 1 km spatial resolution was provided by MODIS 16-day global NDVI dataset (MOD13A2). The road length and density in a 5 km grid that represent vehicle emissions was calculated based on road network data from OpenStreetMap (https://openstreetmap.org/). The population distribution was collected from WorldPop at 1 km spatial resolution population density dataset (https://www.worldpop.org/). Integrated column concentrations of NO2 at a spatial resolution of 0.25° × 0.25° obtained from Ozone Monitoring Instrument (OMI) was used as a prediction variable as NO2 is an important precursor of PM2.5. The Shuttle Rader Topography Mission (SRTM) 90 m digital elevation model (DEM) product was used to characterize the influence of topography. All these datasets (Table 1) were resampled to the 5 km × 5 km Himawari-8 AOD grid covering the study region.

Table 1.
Details of the data source used in this study.
2.2. Model Development and Validation
The workflow of this study is shown in Figure 1. First, we resampled the AODM to the grid of AODH, and used the resampled AODM to fill the missing AODH. Second, the gap-filled AOD (AODH+M) and other datasets including meteorology, NO2, NDVI, road network, population density and coordinates were integrated to the unified grid through spatial–temporal collocating. Finally, a random forest model derived by these predictor variables was used to predict ground PM2.5 concentrations.
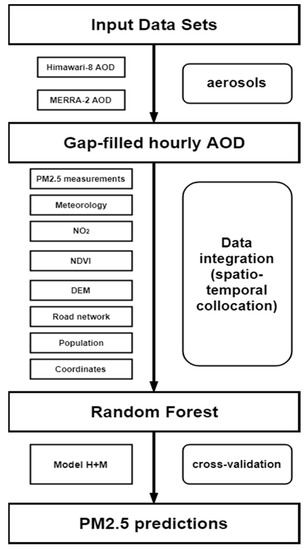
Figure 1.
The workflow of PM2.5 estimation in this study.
Random forest model is an effective and relatively new machine learning method based on decision tree [32]. It is an ensemble of decision trees, and each sub-decision tree is constructed by sub-data drawn from a training set with replacement. The prediction results of random forests can be obtained by averaging the results of sub-decision trees. It is easy to evaluate the importance of each feature during the classification and reduce risk of overfitting. Compared with other deep learning algorithms, the random forest model is much simpler because there are only a few parameters needed to achieve optimal performance. Furthermore, the results can be more interpretable due to this model providing variable importance measures [33].
In this study, a random forest model was implemented by R package ‘Ranger’, a fast implementation of random forests. Two most important parameters in package ‘range’ are the number of trees (ntree) and the number of variables that can possibly be split in each node (mtry). We set ntree as 500 and mtry as 6 to obtain the balance of computing time and prediction accuracy after comparing results generated by different settings. Ten-fold cross-validation (CV) method based on all the data samples was used to ensure the robustness of the RF model in this study. Some stat metrics including the determination coefficient (R2), mean absolute error (MAE), relative prediction error (RPE), the root mean square error (RMSE) and index of agreement (IA) are often used to evaluate the accuracy of models [34,35]. We selected three commonly used statistical indicators (R2, RMSE, MAE) for PM2.5 estimation accuracy assessment. Here, we compared two RF models derived by AODH and the gap-filled AODH+M dataset to investigate the model performance after filling the gap of the Himawari-8 AOD with MERRA-2.
3. Results
3.1. Model Fitting and Validation
Figure 2 shows the scatterplots of the model fitting and cross-validation of hourly PM2.5, as produced by the RF models using AODH (a,b) and AODH+M (c,d), respectively. According to the model-fitting results, both RF models performed well with R2 values of 0.88 and 0.82, and RMSE values of 13.92 μg/m3 and 16.67 μg/m3, respectively. After performing cross-validation, the R2 values dropped slightly (0.79 and 0.66) and the RMSEs rose slightly (17.81 μg/m3 and 21.66 μg/m3). The results proved that the RF models work well in estimating PM2.5 concentrations with a little overfitting, whereas, after filling the gap of the Himawari-8 AOD with AODM, the valid records of PM2.5-AOD rose from 701,262 to 4,795,604, and the accuracy of the model improved greatly. These results suggest that using AODH+M in the prediction model greatly reduces the uncertainty in the ground-level PM2.5 concentrations’ estimation overall.
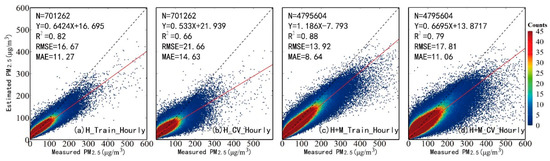
Figure 2.
Density scatterplots of model fitting and 10-fold cross-validation for evaluating the model performance.
To further investigate the performance of the models, the valid observed frequency (N), CV MAE, R2 and RMSE of individuals site across China were calculated and are shown in Figure 3. Figure 3a–d show the stat metrics of the AODH-derived model, and Figure 3e–h show those of the AODH+M-derived model. The observation frequency of hourly AODH varies greatly over regions due to the retrieval algorithm and cloud cover, and it is at its highest (~35%) in North China Plain, is lower (~16%) in central China and at its lowest in southwest China (~10%). After filling the gap of AODH with MERRA-2, the observation frequencies of most of the monitoring sites were up to 100%, except for a few sites where the measurements were missing. As the results show in Figure 3a–h, the accuracy of the AODH+M-derived model improved significantly. At most of the monitoring stations across China, the site-specific CV R2 increased from ~0.6 to ~0.8, the RMSE decreased (5~10) μg/m3 and the values of MAE were below 5 μg/m3.
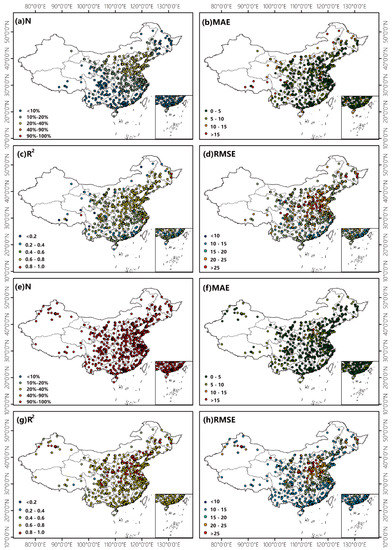
Figure 3.
The valid observed frequency, CV RMSE, R2 and MAE of individual site across China produced by the RF model using AODH (a–d) and AODH+M (e–h), respectively.
Although the overall accuracy of the model is reliable, the performance varies greatly in the typically populated regions. The values of CV R2 and RMSE are highest in the North China Plain, which has a dense network of monitoring sites and high PM2.5 concentrations. Before the AOD was gap filled with MERRA-2, the site-specific cross-validation accuracy was poor with an R2 value of 0.2~0.4 and RMSE value of 15~20 μg/m3 in southern China where it is constantly cloudy. However, the accuracy of estimation improved significantly with a CV R2 of 0.4~0.6 and a CV RMSE of 10~15 μg/m3 after the AODH gap was filled. The site-specific cross-validation result further suggests that using AODH+M in an RF model can improve estimation accuracy effectively, especially in long-term cloudy regions.
3.2. Performance of the Estimation Model on Temporal Scale
The spatial variation in model performance is large due to the network density of monitoring sites, cloud cover, polluted degree, meteorological conditions, etc. How estimation errors vary over different timescales in different regions still requires further study. Figure 4 shows the temporal dependence of CV R2 and RMSE in hourly AODH- and AODH+M-derived PM2.5 (R2_H, RMSE_H, R2_H+M, RMSE_H+M) over China and four typical regions. The AODH-derived model has reliable accuracy over China from 8:00~17:00 (CV R2_H: 0.6~0.7, RMSE_H: 15~25 μg/m3), and its performance varies over time obviously. As the observation frequency of AODH increases from 10:00~15:00, the overall CV R2_H improves and the CV RMSE_H increases.
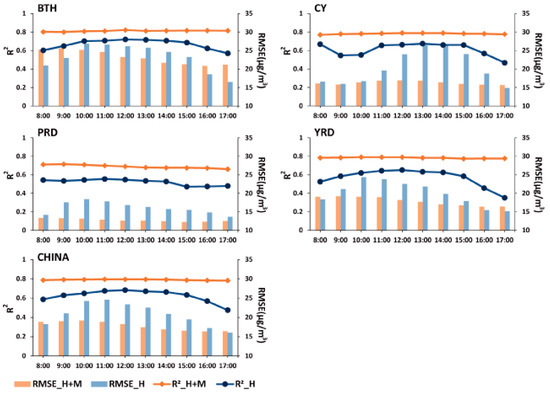
Figure 4.
The temporal variation in CV R2 and RMSE values in hourly AODH- and AODH+M-derived PM2.5 over China and four typical regions.
The hourly error stat metrics (R2 and RMSE) of the AODH-derived and AODH+M-derived models varied greatly in different regions. Generally, the hourly CV R2 increased significantly and RMSE decreased over China after filling the gap of the Himawari-8 AOD with MERRA-2, but the degree of decline varied a lot at different times and in different spaces. As the most polluted region in China, BTH has high values of PM2.5 concentrations and a dense network of monitoring sites; the values of hourly CV R2 (R2_H is ~0.7, R2_H+M is ~0.8) and RMSE (RMSE_H and RMSE_H+M are both 15~25 μg/m3) are higher than other regions. The hourly RMSE values declined significantly (5–15 μg/m3) in PRD, CY and YRP where there is a high AOD missing rate (8~20%), but only declined a little in BTH (<5 μg/m3) from 10:00~15:00 after the AOD gap was filled. A previous study demonstrated that even though the PM2.5 model has a high accuracy of PM2.5 estimation overall, it performs relatively poorly in PRD, possibly due to the significant reduction in AOD observation caused by long-term cloud cover [21]. Our result suggests that using the MEERA-2 AOD to fill the gap of AODH can significantly reduce the uncertainty of PM2.5 estimation caused by the missing AOD.
To evaluate the model performance in different temporal scales, the cross-validated hourly PM2.5 estimated by AODH and AODH+M was used to predict daily, monthly, seasonal and annual average concentrations (Figure 5). The AODH+M model has very different R2 (0.95–0.99), RMSE (4.24–12.6 μg/m3) and MAE (3.43–7.85 μg/m3) values than the AODH model on four types of temporal scale (daily, monthly, seasonal and annual). The scatter plots of Figure 5a,e suggest that at a daily level, the accuracy of the AODH+M-derived model (with values of R2, RMSE and MAE of 0.95, 12.6 μg/m3 and 7.85 μg/m3, respectively) is much higher than that of the AODH+M-derived model (with values of R2, RMSE and MAE are 0.83, 18.64 μg/m3 and 12.56 μg/m3, respectively). These results indicate that the AODH+M-derived PM2.5 model can capture PM2.5 variations more accurately on the daily scale. After averaging the hourly PM2.5 values to seasonal or annual averages, the differences in the statistical indicators (R2, RMSE and MAE) become smaller, as shown in Figure 5c,d,g,h.
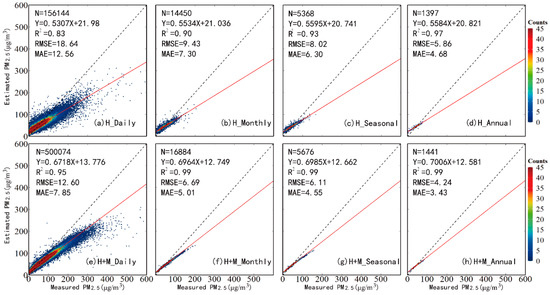
Figure 5.
Density scatterplots of cross-validation result of hourly PM2.5 estimates derived by AODH and AODH+M, respectively, for (a,e) daily, (b,f) monthly, (c,g) seasonal, (d,h) annual.
4. Discussion
Full spatial–temporal coverage of PM2.5 concentrations can provide valuable information to interpret the formation, transport and removal process of pollutants. Usually, CV R2, RMSE and MAE values are used to assess the performance of a PM2.5 estimation model. Although most researches have similar R2 and RMSE values, they may differ significantly in the spatial and temporal distribution of PM2.5, which is also an important evaluation indicator of model performance. Figure 6 shows the spatial distributions of the AODH+M-derived and ground-measured PM2.5 concentrations. The AODH+M-derived PM2.5 concentrations agree well with ground-level observations, and the spatial patterns of the AODH+M-derived PM2.5 concentrations are similar to the results reported in previous studies, especially in the typical regions such as BTH, YRD, PRD and CY [9,12]. The values of MAE are below 5 μg/m3 over most monitoring stations across China. The most polluted regions in China are Hebei, Shanxi, Henan and Shandong with annual mean PM2.5 concentrations of 70~80 μg/m3. Moreover, PM2.5 estimations in these places are highly biased, roughly in the range of 5–10 μg/m3. Under the long-term strict emission reduction policies from 2012, the PM2.5 concentrations have declined a lot in north China. The PM2.5 concentrations are distributed at ~40 μg/m3 in Xizang, and there may be high uncertainty due to the sparse distribution of the monitoring sites.
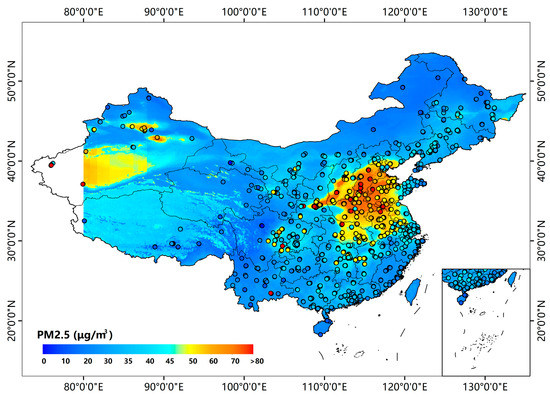
Figure 6.
AODH+M-derived annual PM2.5 concentrations and measurements of monitoring sites.
Some studies have suggested that the non-random missing AOD data may result in serious underestimation of the annual PM2.5 in BTH [7,19]. However, the influence of the observation frequencies in regions with relatively lower PM2.5 concentrations, such as PRD, CY and YRD, has been paid little attention. To further investigate the influence of the missing rate of the Himawari-8 AOD on PM2.5 diurnal variation, we first calculated the hourly observations from 8:00–17:00 of all monitoring sites (PM2.5_ALL), then calculated the hourly PM2.5 observations matched with AODH (PM2.5_H) and AODH+M (PM2.5_H+M). We compared the average hourly PM2.5 derived by AODH (PM2.5_H_CV) and AODH+M (PM2.5_H+M_CV) with PM2.5_ALL, PM2.5_H and PM2.5_H+M over the whole of China and four the typical regions shown in Figure 7. PM2.5_H is higher than PM2.5_ALL by about (5~10) μg/m3 from 9:00 to 16:00 across China, and this indicates that the model may overestimate the annual PM2.5 concentrations over China due to the missing AOD. These biases vary considerably in different regions due to their different pollution backgrounds. The average hourly PM2.5 concentration is underestimated in BTH because AOD is missing in some heavily polluted scenarios, while in less polluted regions such as PRD, CY and YRD, it is overestimated due to many clean scenarios being excluded when there is cloud cover. These biases may lead to huge misunderstandings of the diurnal variations in PM2.5 in China. After filling the gap of Himawari-8 AOD with MERRA-2 AOD, the values of hourly PM2.5_H+M_CV approached the true diurnal variations that were better than the PM2.5_H_CV values.
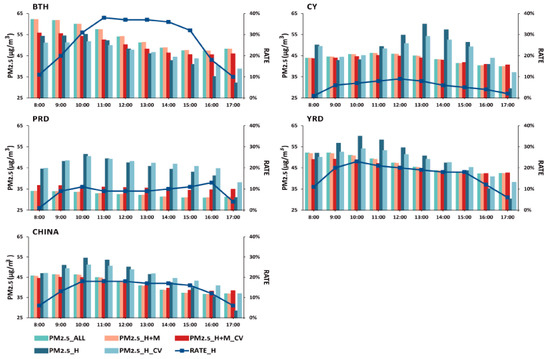
Figure 7.
Time series of PM2.5 concentrations of all monitoring sites (PM_ALL), PM2.5 observations matched with AODH (PM2.5_H), AODH+M (PM2.5_H+M), AODH-derived (PM2.5_H_CV), AODH+M-derived PM2.5 (PM2.5_H+M_CV) and observation rates of Himawari-8 in China and four typical regions.
5. Conclusions
PM2.5 has a great influence on the atmospheric environment and health in China. Knowing the diurnal variation is important to understand the formation and evolution mechanism of PM2.5. Many studies have used hourly AOD products of geostationary satellites, including Himawari-8/AHI, to estimate hourly PM2.5 concentrations. However, due to cloud cover and surface characteristics, the non-random missing of Himawari-8 AODs may lead to misunderstandings and errors. In this study, the MERRA-2 AOD dataset is used to fill the gaps of the Himawari-8 AOD. Then, based on the gap-filled AOD and other auxiliary data, the RF model is used to predict hourly ground-level PM2.5 concentrations. PM2.5 concentrations derived from AODH+M and AODH are compared using different spatial and temporal scales. The impact of missing AOD on ground PM2.5 daily variation varies hugely in different regions. Annual hourly PM2.5 concentrations derived from AODH in the daytime (8:00–19:00) are lower than observations in heavily polluted BTH and much higher than those of less polluted regions such as PRD, CY and YRD. However, by filling the gaps of the Himawari-8 AOD with the MERRA-2 data, the accuracy of the estimating model and the ability to estimate diurnal variations of ground PM2.5 are greatly improved. This is very useful for dynamic monitoring of the evolution of PM2.5 in China.
Author Contributions
Z.L.: investigation, editing, funding acquisition writing—original draft; Q.X.: data curation, validation, formal analysis; R.L.: conceptualization, data curation, supervision, resources, writing—review and editing. All authors have read and agreed to the published version of the manuscript.
Funding
This research was funded by Spark Program of Earthquake Sciences, China Earthquake Administration(Grant No.XH21022), and funded by Open Fund of Wuhan, Gravitation and Solid Earth Tides, National Observation and Research Station (Grant No.WHYWZ202212)
Institutional Review Board Statement
Not applicable.
Informed Consent Statement
Not applicable.
Data Availability Statement
The Environmental Protection Agency of China has published real-time hourly PM2.5 concentration for the major cities in China on website (http://106.37.208.233:20035/) since January 2013. The L3 hourly AOD data from FTP address (ftp.ptree.jaxa.jp) is provided by Japan Aerospace Exploration Agency (JAXA). Meteorological data such as hourly air temperature, wind speed, specific humidity, surface pressure, total precipitation and boundary layer height are obtained from the Goddard Earth Observing System Assimilation System GEOS-5 Forward Processing (https://fluid.nccs.nasa.gov/weather/) at a spatial resolution of 0.25° × 0.3125°. NDVI data at 1 km spatial resolution is provided by the MODIS 16-day global NDVI dataset (MOD13A2). The road length and density in a 5 km grid that represent vehicle emissions is calculated based on road network data from OpenStreetMap (https://openstreetmap.org/). The population distribution is collected from WorldPop at 1 km spatial resolution population density dataset (https://www.worldpop.org/).
Acknowledgments
This research was funded by Spark Program of Earthquake Sciences, China Earthquake Administration(Grant No.XH21022), and funded by Open Fund of Wuhan, Gravitation and Solid Earth Tides, National Observation and Research Station(Grant No.WHYWZ202212). We appreciate the Himawari-8 and MERRA-2 team for the aerosol products used.
Conflicts of Interest
The authors declare no conflict of interest.
References
- Peters, A.; Dockery, D.W.; Muller, J.E.; Mittleman, M.A. Increased Particulate Air Pollution and the Triggering of Myocardial Infarction. Circulation 2001, 103, 2810–2815. [Google Scholar] [CrossRef]
- Pope, C.A., III; Dockery, D.W. Health Effects of Fine Particulate Air Pollution: Lines that Connect. J. Air Waste Manag. Assoc. 2006, 56, 709–742. [Google Scholar] [CrossRef]
- Ramanathan, V.; Feng, Y. Air pollution, greenhouse gases and climate change: Global and regional perspectives. Atmos. Environ. 2009, 43, 37–50. [Google Scholar] [CrossRef]
- An, Z.; Huang, R.J.; Zhang, R.; Tie, X.; Li, G.; Cao, J.; Zhou, W.; Shi, Z.; Han, Y.; Gu, Z.; et al. Severe haze in northern China: A synergy of anthropogenic emissions and atmospheric processes. Proc. Natl. Acad. Sci. USA 2019, 116, 8657–8666. [Google Scholar] [CrossRef]
- Ma, Z.; Liu, R.; Liu, Y.; Bi, J. Effects of air pollution control policies on PM2.5 pollution improvement in China from 2005 to 2017: A satellite-based perspective. Atmos. Chem. Phys. 2019, 19, 6861–6877. [Google Scholar] [CrossRef]
- Zhang, Q.; Zheng, Y.; Tong, D.; Shao, M.; Wang, S.; Zhang, Y.; Xu, X.; Wang, J.; He, H.; Liu, W.; et al. Drivers of improved PM2.5 air quality in China from 2013 to 2017. Proc. Natl. Acad. Sci. USA 2019, 116, 24463–24469. [Google Scholar] [CrossRef]
- Li, R.; Mei, X.; Chen, L.; Wang, Z.; Jing, Y.; Wei, L. Influence of Spatial Resolution and Retrieval Frequency on Applicability of Satellite-Predicted PM2.5 in Northern China. Remote Sens. 2020, 12, 736. [Google Scholar] [CrossRef]
- Liu, Y.; Sarnat, J.A.; Kilaru, V.; Jacob, D.J.; Koutrakis, P. Estimating Ground-Level PM2.5 in the Eastern United States Using Satellite Remote Sensing. Environ. Sci. Technol. 2005, 39, 3269–3278. [Google Scholar] [CrossRef]
- Wei, J.; Li, Z.; Cribb, M.; Huang, W.; Xue, W.; Sun, L.; Guo, J.; Peng, Y.; Li, J.; Lyapustin, A.; et al. Improved 1 km resolution PM2.5 estimates across China using enhanced space–time extremely randomized trees. Atmos. Chem. Phys. 2020, 20, 3273–3289. [Google Scholar] [CrossRef]
- Ma, Z.; Hu, X.; Sayer, A.M.; Levy, R.; Zhang, Q.; Xue, Y.; Tong, S.; Bi, J.; Huang, L.; Liu, Y. Satellite-Based Spatiotemporal Trends in PM 2.5 Concentrations: China, 2004–2013. Environ. Health Perspect. 2016, 124, 184–192. [Google Scholar] [CrossRef]
- Liu, Y.; Paciorek, C.J.; Koutrakis, P. Estimating Regional Spatial and Temporal Variability of PM 2.5 Concentrations Using Satellite Data, Meteorology, and Land Use Information. Environ. Health Perspect. 2009, 117, 886–892. [Google Scholar] [CrossRef]
- He, Q.; Huang, B. Satellite-based mapping of daily high-resolution ground PM2.5 in China via space-time regression modeling. Remote Sens. Environ. 2018, 206, 72–83. [Google Scholar] [CrossRef]
- Liu, N.; Zou, B.; Li, S.; Zhang, H.; Qin, K. Prediction of PM2.5 concentrations at unsampled points using multiscale geographically and temporally weighted regression. Environ. Pollut. 2021, 284, 117116. [Google Scholar] [CrossRef]
- Li, T.; Shen, H.; Yuan, Q.; Zhang, X.; Zhang, L. Estimating Ground-Level PM2.5 by Fusing Satellite and Station Observations: A Geo-Intelligent Deep Learning Approach. Geophys. Res. Lett. 2017, 44, 11985–11993. [Google Scholar] [CrossRef]
- Sun, J.; Gong, J.; Zhou, J. Estimating hourly PM2.5 concentrations in Beijing with satellite aerosol optical depth and a random forest approach. Sci. Total. Environ. 2021, 762, 144502. [Google Scholar] [CrossRef]
- Xiao, Q.; Chang, H.H.; Geng, G.; Liu, Y. An Ensemble Machine-Learning Model To Predict Historical PM2.5 Concentrations in China from Satellite Data. Environ. Sci. Technol. 2018, 52, 13260–13269. [Google Scholar] [CrossRef] [PubMed]
- Chen, Z.; Zhang, T.-H.; Zhang, R.; Zhu, Z.-M.; Ou, C.-Q.; Guo, Y. Estimating PM2.5 concentrations based on non-linear exposure-lag-response associations with aerosol optical depth and meteorological measures. Atmos. Environ. 2018, 173, 30–37. [Google Scholar] [CrossRef]
- Zheng, Y.; Zhang, Q.; Liu, Y.; Geng, G.; He, K. Estimating ground-level PM2.5 concentrations over three megalopolises in China using satellite-derived aerosol optical depth measurements. Atmos. Environ. 2016, 124, 232–242. [Google Scholar] [CrossRef]
- Xiao, Q.; Wang, Y.; Chang, H.H.; Meng, X.; Geng, G.; Lyapustin, A.; Liu, Y. Full-coverage high-resolution daily PM2.5 estimation using MAIAC AOD in the Yangtze River Delta of China. Remote Sens. Environ. 2017, 199, 437–446. [Google Scholar] [CrossRef]
- Chen, J.; Yin, J.; Zang, L.; Zhang, T.; Zhao, M. Stacking machine learning model for estimating hourly PM2.5 in China based on Himawari 8 aerosol optical depth data. Sci. Total. Environ. 2019, 697, 134021. [Google Scholar] [CrossRef]
- Wei, J.; Li, Z.; Pinker, R.T.; Wang, J.; Sun, L.; Xue, W.; Li, R.; Cribb, M. Himawari-8-derived diurnal variations in ground-level PM2.5 pollution across China using the fast space-time Light Gradient Boosting Machine (LightGBM). Atmos. Chem. Phys. 2021, 21, 7863–7880. [Google Scholar] [CrossRef]
- Zhang, T.; Zang, L.; Wan, Y.; Wang, W.; Zhang, Y. Ground-level PM2.5 estimation over urban agglomerations in China with high spatiotemporal resolution based on Himawari-8. Sci. Total. Environ. 2019, 676, 535–544. [Google Scholar] [CrossRef]
- Xu, Q.; Chen, X.; Yang, S.; Tang, L.; Dong, J. Spatiotemporal relationship between Himawari-8 hourly columnar aerosol optical depth (AOD) and ground-level PM2.5 mass concentration in mainland China. Sci. Total. Environ. 2021, 765, 144241. [Google Scholar] [CrossRef]
- Zang, L.; Mao, F.; Guo, J.; Gong, W.; Wang, W.; Pan, Z. Estimating hourly PM1 concentrations from Himawari-8 aerosol optical depth in China. Environ. Pollut. 2018, 241, 654–663. [Google Scholar] [CrossRef] [PubMed]
- Randles, C.A.; Da Silva, A.M.; Buchard, V.; Colarco, P.R.; Darmenov, A.; Govindaraju, R.; Smirnov, A.; Holben, B.; Ferrare, R.; Hair, J.; et al. The MERRA-2 Aerosol Reanalysis, 1980 Onward. Part I: System Description and Data Assimilation Evaluation. J. Clim. 2017, 30, 6823–6850. [Google Scholar] [CrossRef] [PubMed]
- Zhang, T.; Zang, L.; Mao, F.; Wan, Y.; Zhu, Y. Evaluation of Himawari-8/AHI, MERRA-2, and CAMS Aerosol Products over China. Remote Sens. 2020, 12, 1684. [Google Scholar] [CrossRef]
- Ma, J.; Xu, J.; Qu, Y. Evaluation on the surface PM2.5 concentration over China mainland from NASA’s MERRA-2. Atmos. Environ. 2020, 237, 117666. [Google Scholar] [CrossRef]
- Song, Z.; Fu, D.; Zhang, X.; Wu, Y.; Xia, X.; He, J.; Han, X.; Zhang, R.; Che, H. Diurnal and seasonal variability of PM2.5 and AOD in North China plain: Comparison of MERRA-2 products and ground measurements. Atmos. Environ. 2018, 191, 70–78. [Google Scholar] [CrossRef]
- Gupta, P.; Zhan, S.; Mishra, V.; Aekakkararungroj, A.; Markert, A.; Paibong, S.; Chishtie, F. Machine Learning Algorithm for Estimating Surface PM2.5 in Thailand. Aerosol Air Qual. Res. 2021, 21, 210105. [Google Scholar] [CrossRef]
- Feng, L.; Li, Y.; Wang, Y.; Du, Q. Estimating hourly and continuous ground-level PM2.5 concentrations using an ensemble learning algorithm: The ST-stacking model. Atmos. Environ. 2020, 223, 117242. [Google Scholar] [CrossRef]
- Xue, T.; Zheng, Y.; Tong, D.; Zheng, B.; Li, X.; Zhu, T.; Zhang, Q. Spatiotemporal continuous estimates of PM2.5 concentrations in China, 2000–2016: A machine learning method with inputs from satellites, chemical transport model, and ground observations. Environ. Int. 2019, 123, 345–357. [Google Scholar] [CrossRef]
- Breiman, L. Random forests. Mach. Learn. 2001, 45, 5–32. [Google Scholar] [CrossRef]
- Huang, K.; Xiao, Q.; Meng, X.; Geng, G.; Wang, Y.; Lyapustin, A.; Gu, D.; Liu, Y. Predicting monthly high-resolution PM2.5 concentrations with random forest model in the North China Plain. Environ. Pollut. 2018, 242, 675–683. [Google Scholar] [CrossRef] [PubMed]
- de Mattos Neto, P.S.G.; Marinho, M.H.N.; Siqueira, H.; de Souza Tadano, Y.; Machado, V.; Antonini Alves, T.; de Oliveira, J.F.L.; Madeiro, F. A Methodology to Increase the Accuracy of Particulate Matter Predictors Based on Time Decomposition. Sustainability 2020, 12, 7310. [Google Scholar] [CrossRef]
- de Mattos Neto, P.S.G.; Firmino, P.R.A.; Siqueira, H.; de Souza Tadano, Y.; Antonini Alves, T.; de Oliveira, J.F.L.; Marinho, M.H.N.; Madeiro, F. Neural-Based Ensembles for Particulate Matter Forecasting. IEEE Access 2020, 9, 14470–14490. [Google Scholar] [CrossRef]


Disclaimer/Publisher’s Note: The statements, opinions and data contained in all publications are solely those of the individual author(s) and contributor(s) and not of MDPI and/or the editor(s). MDPI and/or the editor(s) disclaim responsibility for any injury to people or property resulting from any ideas, methods, instructions or products referred to in the content. |
© 2023 by the authors. Licensee MDPI, Basel, Switzerland. This article is an open access article distributed under the terms and conditions of the Creative Commons Attribution (CC BY) license (https://creativecommons.org/licenses/by/4.0/).