Abstract
Poor household dietary diversity has been linked to malnutrition in individuals, households, and cumulatively in populations. High rates of malnutrition among Khmer ethnic children aged five years and younger have been reported in Tri Ton district, Vietnam. This paper aims to further investigate household dietary diversity and associated factors among Khmer ethnic minority populations in Vietnam. A cross sectional study was conducted from October 2018 to April 2019 in Tri Ton District, An Giang Province. By employing a multistage sampling technique, a total of 402 (99.8% response rate) participants were interviewed to measure household dietary diversity using a structured and validated questionnaire developed by FAO. Both bivariate and multivariate logistic regression analyses were carried out to identify factors associated with household dietary diversity. The results showed that the prevalence of low, medium and high dietary diversity scores were 21.4%, 70.4% and 8.2%, respectively. Male-headed households, literacy level, household income, exposure to mass media on nutrition and health information, and frequency of eating were positively associated with household dietary diversity (p < 0.05). However, owning a vegetable and rice farm was not statistically related to households’ dietary diversification. The paper concludes that the magnitude of household diversified dietary intakes was essentially low to medium in participants’ households. These findings have provided evidence to inform the development of the National Nutrition Strategy—2021–2030 in Vietnam, to be revised in 2045. This national strategy proposes appropriate interventions, programs and policies to improve socioeconomic status in ethnic groups and in mountainous areas to enhance populations’ health and well-being including controlling childhood malnutrition. In order to improve population health and wellbeing in Tri Ton District, further actions to address effective dietary practices including strengthening nutrition and health communication about the need to improve household dietary diversity to high levels are recommended.
1. Introduction
Malnutrition is a serious and significant public health problem linked to high mortality and morbidity risks, particularly among children aged five years or younger [1,2] (from here on to be termed as under-fives). Globally in 2017, a significant number of malnourished under-fives, including 150 million, 50 million and 38 million were reported to suffer from stunting, wasting and overweight, respectively [3]. Most of these children were from: (i) poor rural areas of low- and middle-income countries [4,5], (ii) ethnic minority communities, and (iii) indigenous people [6,7]. According to previous studies, malnutrition accounts for more than 3.1 million deaths per year in under-fives, with poor dietary diversity being one of the key and modifiable determinants [8,9,10]. Dietary diversity refers to the consumption of food, across and within food groups, capable of ensuring sufficient intake of essential nutrients that can promote physical and mental health and wellbeing [11]. A growing body of literature has demonstrated a significant association between dietary diversity, micronutrient adequacy and positive health outcomes [12,13,14]. It has also been noted that when more food groups are included in daily diets, the likelihood of fulfilling the nutrient requirements increases [15]. By contrast, a low dietary diversity: increases the risk of malnutrition including underweight and stunting [16], triggers cognitive deficits [17], and raises the proportion of undernourished populations [18]. The socio-economic disparity has also been noted as one of the explanatory factors for under-nutrition and poor health outcomes in populations [19,20,21]. It is acknowledged that people with a high socio-economic status (SES) are more likely to have resources enabling them to have good dietary diversity, whereas people with low SES are more likely to have poor dietary habits leading to poorer health outcomes [22]. In addition to socioeconomic differences, ethnic minority groups are at high-risks in terms of household dietary diversity relative to the dominant ethnic groups due to the impact of their own culture, religious beliefs and rurarity [23].
In Vietnam, despite the recent great achievements in reducing poverty and hunger, there is still a disparity in health outcomes with ethnic minority groups in rural and remote areas continuing to suffer from significant malnutrition [24,25]. Several policies and programs, along with significant investments, have been allocated to vulnerable communities such as the Khmer minority group to improve livelihood, health and nutrition status [26]. The recent National Nutrition Strategy and the targeted national program for socio-economic development in ethnic minorities and mountainous areas, have also created a supportive environment for the comprehensive development of ethnic minority populations [27,28]. The Khmer group, who primarily live in the Mekong Delta, face significant challenges such as: low quality of education, poor socioeconomic status, job uncertainties and slow adaptation to the business environment [29]. These challenges have led to limited average income per person compared with the national level (VND 1.626 million per month versus 4.16 million per month in 2016) [30,31], leading to poor purchase power, thus preventing the consumption of HDD. Low literacy levels and language barriers are also among the challenges for Khmer people to integrate into the Vietnamese mainstream education system—leading to low health and dietary literacy [32,33]. The level of malnutrition among Khmer under-fives in Tri Ton District of the Mekong Delta was higher at 37.8% for underweight (WAZ < −2), 50.0% for stunting (HAZ < −2) and 17.0% for wasting (WHZ < −2) compared with the national average of 14.1% underweight, 24.6 stunting and 6.4% wasting, respectively [32,34]. The Tri Ton district is one of the poorest communities in An Giang province. The most recent data showed that people in 14/15 communes in the district completed the primary school literacy [35]. The livelihood of local people depends heavily on forest and small-scale cultivation. Meanwhile, the district has been affected by climate change, especially drought caused by extreme weather events [36]. It is widely accepted that climate change has an impact on all aspects of food security and nutrition including food production, food accessibility, food utilisation, and dietary diversity, but more severe consequences on minority groups such as Khmer than on the Kinh group (account for 85% of the Vietnamese population) [37,38]. A wide range of international policies have been suggested for nations to reduce levels of undernutrition in under-fives. Poverty and malnutrition reduction were the Millennium Development Goals (MDGs) goal [39] by 2015. However, the situation of undernutrition of rural poor households, especially Khmer households in the Tri Ton district, a rural district of An Giang province remained high at the conclusions of MDGs in 2015 [32]. While food security is considered as one of the determinants of childhood malnutrition [40], and have been targeted in nutrition policy in Vietnam, household dietary diversity has not been specifically focused. Additionally, our literature review showed a limitation of evidence for characteristics of household dietary diversity in Khmer minority group. This study was conducted to assess Khmer’s household dietary diversity and associated factors in Tri Ton District, An Giang Province, Mekong Delta Vietnam. Since the study was conducted, the findings have already provided evidence for the 2021 to 2030 National Nutrition Strategy. The strategy is envisioned to be revised in 2045 and its targets are to enhance ethnic minority populations’ health and well-being and to control childhood malnutrition.
2. Methods
2.1. Study Design, Settings and Participants
A cross-sectional community-based study was conducted from October 2018 to April 2019 in Tri Ton district, a rural district of An Giang Province in Mekong Delta region, Vietnam. (Figure 1). The Tri Ton District is located in the South-western part of the country. In 2018, the district had a total of 33,674 households, of which Khmer ethnic minority households accounted for 33.4% (11,263 households) [33]. In recent years, the number of Khmer migrants seeking employment in large cities and industrial parks has increased, with the young working age populations being over represented [41].
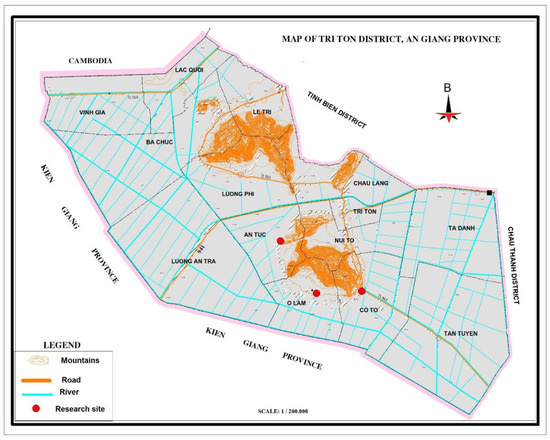
Figure 1.
Map of Tri Ton district, An Giang province (Reprinted/adapted with permission from Ref. [42]. Copyright 2020, Tien Duy Pham).
2.2. Sample Size and Sampling Technique
The sample size for this survey was determined by the single population proportion formula [43].
with p-value = 50%, without any assumption prevalence in this area, 95% confidence interval = 1.96; d = 0.05, z = the standard normal tabulated value, and α = level of significance. Therefore, the total sample size was 384. Considering 5% of the non-response rate, the total sample size was 403.
The multistage sampling technique was employed to select the study participants in Tri Ton district. Firstly, of nine communes where the Khmer live, three communes were selected using simple random sampling method. Secondly, the proportional to population size allocation (PPS) was conducted to calculate the sample size for each commune. Thirdly, simple random sampling method (conducted by choosing a random number in the random number table corresponding to a numbered list of Khmer households) was used to select the households for interviews.
2.3. Data Collection Procedures
A house-to-house approach was carried out for data collection. A standard questionnaire in English was translated into Vietnamese. Because not all Khmer people speak Vietnamese, interpreters were used during the interviews with participants. The translated question was tested using a sample of 20 households (5%) (not included in the study sample) in a community which had similar characteristics of the research sites. Before the actual data collection, the questionnaire was revised based on their comments prior to pilot testing and validation for internal consistency. This process was necessary to ensure that the translated questionnaire was similar to the original English questionnaire. For data collection, the person who was responsible for preparing household food in the previous day was interviewed on behalf of household members for 24 h food recall and SES data.
Unattended households were revisited twice during the visit day to ensure that the required sample size was reached. Six research trained students and three local Khmer public health practitioners (interpreters) were involved in the data collection process. Training of interviewers and field work supervision was carried out by the principal investigator. The data were immediately checked in the field for accuracy and completeness. Additionally, supervisors re-checked the questionnaire for the completeness, quality, and consistency of information collected on the daily basis.
2.4. Measurement of Study Variables
A standard multi-part questionnaire was used to assess household dietary diversity as an outcome variable and some other explanatory variables.
The dependent variable (household dietary diversity) was collected using guidelines for measuring household dietary diversity developed by FAO [44]. Dietary diversity score (DDS) was defined as the number of different food groups consumed by family members over the last 24 h [44]. One point was awarded to each food group consumed over the reference period, and the sums of all points were calculated for the DDS for each household [44]. Low Dietary Diversity, Medium Dietary Diversity, and High Dietary Diversity were defined as less than three, 4–6, and ≥7 food groups consumed, respectively [45,46].
Independent variables included: demographic and socioeconomic factors such as sex, age, education level of the head of the household (Vietnamese), main occupation of the head of household, household income (million Vietnam Dong (VND)/month), media exposure, vegetable farm owner and rice farm ownership.
2.5. Data Management and Statistical Analysis
The data was checked for completeness and consistency before cleaning and entry intoEPI-INFO version 7 statistical software [47]. Data analyses were performed by SPSS software package version 20 [48].
Age was categorised based on the encyclopaedia of Aging and Public Health [49]. Education level was classified as illiteracy and literacy in Vietnamese. Average household income was classified as ≤2.0, 2.1–4.0, 4.1–6.0, and >6.0 million Vietnamese Dong/month [50]. Medium Dietary Diversity and High Dietary Diversity were categorised as Diversified category, Low Dietary Diversity as Non-diversified category [45,51].
Descriptive statistics were performed to characterise the participants using different variables of interest. The association between household dietary diversity and socio-demographic, economic, and dietary variety variables of respondents was assessed using univariate logistic regression followed by a multivariate forward stepwise logistic regression test to determine the adjusted odd ratio (aOR). Hosmer and Lemeshow goodness-of-fit test was performed. The area under the receiver-operating characteristic (ROC) curves was calculated to evaluate the predictive value of various factors. The ROC curve assesses the capacity of the entire logistic regression model to distinguish between Khmer households with diverse and non-diverse diets. Results of a test are deemed statistically significant if the p-value is less than 0.05.
3. Ethical Consideration
Ethical clearance was obtained from the Ethical Review Committee by The board of Rectors of An Giang University (now it is An Giang University—Vietnam University Ho Chi Minh City) on 1 October 2018 before the study began. There was also permission obtained from the authority and administration health officers of 3 communes in Tri Ton district, Vietnam who allowed and supported the researchers to conduct the research in the district. Each participant’s informed consent was obtained after the researchers explained the purpose of the study. Participants were informed of the voluntary nature and their right to refuse participation at any stage of the study. They were also assured of the confidentiality of the collected information.
4. Results
4.1. Characteristics of the Participated Households and Household Dietary Diversity
Of the 403 eligible respondents, 402 participated in this study, a response rate of 99.8%. As presented in Table 1, the proportion of female household heads, illiteracy (Vietnamese), and age range from 41 to 65 years were 40.3%, 21.9% and 54.5%, respectively. More than 60% of the households had average monthly income between 2.1 and 4.0 million VND. Over a third of households in this sample had a vegetable or rice farm. The mean household dietary diversity score was 4.6 (SD ± 1.4). The majority of the households were at the moderate level of dietary diversity (over 70%). The proportion of households classified as having diversified dietary intake was roughly 80%. Just over a third of households ate three times per day, with the majority of them eating two times a day. Meanwhile, nearly a half of households skipped breakfast.

Table 1.
Socio-demographic, economic, and dietary diversity characteristics of respondents (n = 402).
The prevalence of participants who consumed four food groups accounted for the highest followed by 5, 6, and 7 food groups (Figure 2). The most consumed food groups were: cereals (100%); vegetables (68.7%); fish and seafood (67.9%); and spices, condiments and beverages (54.7%) (Figure 3). Meat/poultry/organ meats were consumed only by 35.1% of households. Fruits, eggs, dairy, nuts and root crops were consumed the least (less than 20%) (Figure 3).
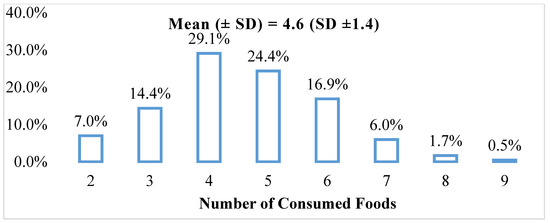
Figure 2.
Food consumption pattern of Khmer minority households by the number of foods consumed (%).
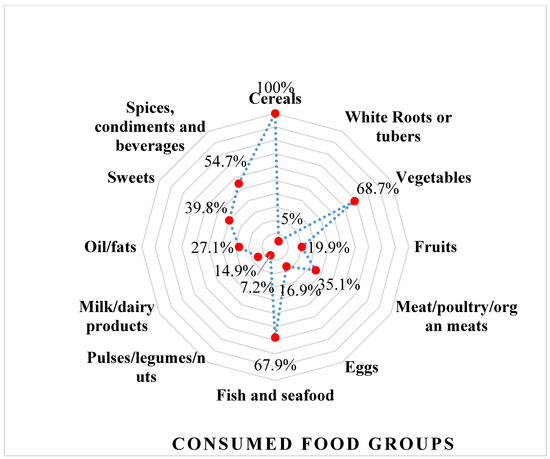
Figure 3.
Food consumption patternsof Khmer minority households by consumed food groups (%).
4.2. Associated Factors of Household Dietary Diversity
Table 2 shows that sex and educational level of the household head, age, household income, media exposure on nutrition and health, frequency of eating, and breakfast eaten were significantly associated with diversified diets among Khmer households. Ownership of a vegetable or rice farm was not significantly associated with household dietary diversity.
Table 2.
Characteristics and univariate analysis of factors associated with Khmer household dietary diversity in Tri Ton district.
When seven variables from the unadjusted model were included in a single model adjusting for each other, all factors remained significant except for age and breakfast eaten. The Hosmer and Lemeshow goodness-of-fit test showed the model being a good fit with p = 0.908. The multivariate logistic regression analysis showed significantly higher odds of having diversified diets among the households with male-headed families (aOR 3.34; 95% CI 1.86–5.98, p = 0.000), literacy (Vietnamese) (aOR 9.32; 95% CI 5.06–17.16, p = 0.000), household income (million VND/month) 2.1–4.0 (aOR 2.87; 95% CI 1.56–5.29, p = 0.001), 4.1–6.0 (aOR 3.64; 95% CI 1.03–12.93, p = 0.046), >6.0 (aOR 6.27; 95% CI 1.09–36.06, p = 0.040), having media exposure on nutrition and health (aOR 1.89; 95% CI 1.04–3.41, p = 0.036), and frequently ate three times and above per 24 h (aOR 2.12; 95% CI 1.13–3.98, p = 0.019) (Table 3).
Table 3.
Multivariate analysis of factors associated with Khmer household dietary diversity in Tri Ton district.
A ROC curve was developed (Figure 4) from the fitted predicted value from the final logistic regression model. The area under the operator characteristic curve was 0.835.
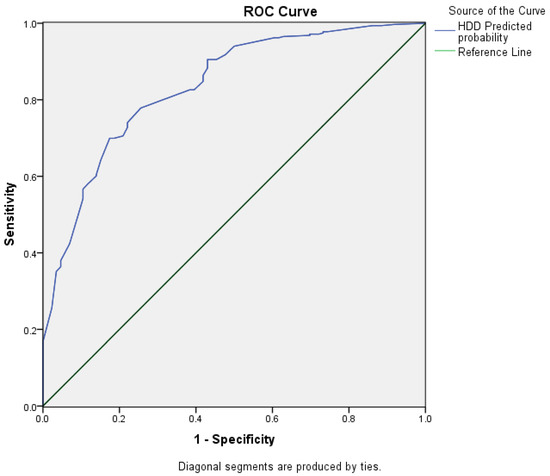
Figure 4.
Receiver-operating characteristic curve for a multivariate logistic regression model to predict Khmer household dietary diversity in Tri Ton district.
5. Discussion
5.1. Household Dietary Diversity among Khmer Households
Although the household dietary diversity score (HDDS) does not measure dietary diversity consumed at an individual level, it does indicate household eating patterns of a range of foods, information that can be used to promote good eating patterns within households and communities for prevention of, not only undernutrition, but over nutrition including obesity [53]. The HDDS has also been highly recommended as essential for modifying the risks of several dietary-related chronic diseases [54]. The mean HDDS of this study was consistent with the previous studies in Cambodia [55], where 97.6% of the population is ethnically Khmer, and greater than 80% completed primary school education [56]. In contrast, the mean HDDS from our study was lower the 2011, survey results from four provinces of non-Khmer group [57]. A number of studies in low- and middle-income nations also found similar results where most ethnic groups had low or medium dietary diversity scores [45,58,59,60]. Thus, ethnicity may have an impact on HDDS as people in the same ethnic group are likely to have similar dietary patterns and eating behaviours independent of socioeconomic status. However, this study did not explore this issue, and further studies are recommended to in-depth investigate this statement. In addition, a considerable proportion of households at Low Dietary Diversity (consumed less than three food groups per day) in this study may result in increased malnutrition in the households [16,61]. The future studies regarding to HDD should consider ethnicity in order to control malnutrition.
Results from the general nutrition survey in Vietnam in 2019 revealed that the Vietnamese are consuming more meat, vegetables but less starchy food [62]. In contrast, the dietary pattern of the studied ethnic group seemed to be characterised by starchy and vegetable-based foods. Based on the socioeconomic status of these populations, the plausible reasons for these dietary patterns could be that Khmer households were mainly surrounded by the natural forest [33], which would have made it easier to harvest wild vegetables for their meals. Moreover, while young Khmer people were in the cities and industrial zones [41], the older remained at home to take care of the children and preparing meals for the family. The traditional custom and eating habits from the older generations which persist in contemporary households, is the predominant consumption of starchy and vegetables food-based diet. It is reasonable to argue that the Khmer households had similar dietary patterns to that of ethnic minorities in Northwest Vietnam where grains, grain products and vegetables have been reported to be the most frequently consumed foods [63], and where fruits and legumes, nuts and seeds are rarely consumed. These findings are consistent with Nguyen and colleagues’ findings, where starchy staple foods and vegetables were reported to be widely consumed in other low- and middle-income countries including Bangladesh, Ethiopia, Mexico, and Botswana. In these countries, meat, eggs, dairy products, and fruits were reported to be less likely to be consumed in the previous 24 h [64,65,66]. It is therefore reasonable to allude that the current dietary consumption of the Khmer minority households comprises a monotonous pattern of starchy based staples, with inadequate animal products and fruits, potentially lacking essential micronutrients for the human development. As such, nutrient deficiencies and malnutrition patterns in many of the households were similar to commonly found some communities in developing countries where foods consumption is consistent with having poor dietary patterns [67,68]. While we acknowledge that practicing dietary diversity is important, it is worth noting that improved dietary diversity can be challenging due to a range of factors including, socio-economic, residence and cultural factors [69,70], especially where traditional food menu with low diversity are favoured. We also must acknowledge that, the differences in HDDS might be due to variations in agroecology, culture and guidelines used to assess the dependent variables. As these factors were not the focus of the current study, further studies are recommended to explore the role that these factors may play in contributing or not to HDDS.
5.2. Associated Factors of Household Dietary Diversity among Khmer Ethnic Group
Understanding the factors contributing to household dietary diversity helps to develop appropriate food security policies and interventions. Consistent with the literature review for general populations, our final logistic regression model revealed that factors such as the sex and educational level of the household head, household income, media exposure to nutrition and health, and frequency of eating were significantly associated with diversified diets in the Khmer group. This model had an excellent predictive accuracy for diversified diets among Khmer households, with the area under the ROC curve being 0.835 [71].
Higher odds for household dietary diversity among males compared to females being the household’s head were consistent with findings from studies on rural households in low- and middle-income countries or settings such as West Bengal, India [58], Sri Lanka [72], Mirab Abaya Woreda, Southern Ethiopia [46], Finote Selam town, Ethiopia [45], Amatole and Nyandeni districts, South Africa [59]. It is evident that females who were heads of households were also working. Therefore, increased women’s workload could have negatively impacted their nutritional intake and quality because of factors such as the reduction of time available for family nutrition and health-enhancing activities. This could possibly mean that females (who in many cultures are food makers) [73] did not have sufficient time and resources required to provide optimum dietary diversity for their households [74,75,76]. This is contrary to males as the household’s head. Additionally, the income of males may be higher than females [77], leading to high purchasing power including of diverse foodstuffs. However, this statement was not studied in our research and needs further investigation.
The level of literacy was another factor to have a positive significant association with household dietary diversity. This finding is significant, because it calls for efforts to promote education of communities in the quest to improve dietary diversity. Similar and comparable findings have been suggested by other studies [51,78,79,80], indicating that people with higher level of education have a greater awareness and understanding of nutritional and health benefits of high dietary diversity, and thus leading better dietary practices.
Household income was also positively statistically significantly associated with HDDS. Studies by Belachew and Yemane [51], Taruvinga et al. [59] and Morseth et al. [81], have also revealed direct association between higher income and higher diversified diet in households, which may indicate the need to address poverty to improve dietary diversity. These findings support the WHO social determinants of health framework where high education and higher wealth would address poverty and provide resources to ensure adequate nutritious food supply [82]. Several authors have also argued that the increased demand for fruits (which could mean better dietary quality) increases with income [83,84,85]. It is agreed that nutritious and healthy foods including fruits may be expensive, and low income households may not choose these as a priority due to the need to fulfil other pressing life demands [86].
Media exposure on nutrition and health was another factor that showed significant association with household dietary diversity. In conformity with findings by Beyene and colleagues [87], the odds of household dietary diversity were 1.89 times higher among households that were exposed to mass media on nutrition and health compared to the households unexposed to mass media. It is reasonable to hypothesis that this finding could be the impact of currently running media promotions that use radio and television to promote healthy eating and healthy cooking practices.
Consistent with the findings by Mekuria and colleagues [45], the odds of household dietary diversity were 2.12 times higher among households who consumed food three times and over, compared to households that consumed food two times. This is logical and could be explained by the fact that increasing the frequency of consuming food would likely increase the type of items consumed, and hence increased dietary diversity of the households.
There was, however, no statistically significant correlation between having a vegetable or rice farm and dietary diversification. This conclusion is consistent with research conducted in Finote Selam town, northwest Ethiopia [45], but dissimilar to studies conducted in Noakhali district, Bangladesh [88], Tanzania [89], and West Bengal, India [58]. According to the findings of these studies, the land is a crucial factor for diet variety, and families owning larger areas of agricultural land had higher HDDS. It has also been reported that dietary diversity increases with farm size [58,88,89]. In this research, however, the average acreage of vegetable farms and rice farms held by Khmer families was small. Therefore, there was no difference in dietary diversity between farm-owning and non-farm-owning households.
The study has already made significant contributions to the body of knowledge, including informing the development of the National Nutrition Strategy for the period of 2021–2030, envisioned to be revised in 2045. From our understanding, this is the first research on the Khmer minority group, particularly for household dietary diversity. Results from this study will additionally raise awareness among the community and policymakers regarding improving household dietary diversity to control undernutrition.
6. Conclusions
The prevalence of low, medium and high dietary diversity scores were 21.4%, 70.4% and 8.2%, respectively. Dietary patterns of Khmer ethnic groups were characterised by starchy, staple foods and vegetables with low frequency of animal protein source foods, dairy products, nuts, and fruits consumed. Sex of household head, education level of household head, household income, frequency of eating and exposure to mass media on nutrition and health were significant contributing factors for household dietary diversity. The government should enforce policies that ensure that diversified foods are available and accessible at low cost for the Khmer households and communities. Strengthening nutrition and health communication is recommended to improve Khmer household dietary diversity, resulting in improved nutrition and health of the Khmer communities. Findings from this research have provided evidence for the National Nutrition Strategies for the period of 2021–2030, envision to be revised in 2045. The Strategy proposes appropriate and effective interventions, programs and policies to improve socioeconomic status in ethnic groups and mountainous areas in Vietnam [27,28]. Prospective policy targeting childhood malnutrition control should be issued, and in consideration of diversity of culture, gender impact, appropriate education and communication channels. In order to improve population health and wellbeing in Tri Ton District, further efforts including strengthening nutrition and health communication about the need to improve household dietary diversity to high levels are recommended.
7. Limitations of the Study
The limitation of the current study is the reliance on 24 h dietary recall which does not show the usual dietary practices of individuals members in the household. It is well known that the dietary patterns of individuals or household change during religious festivals. To ensure that the religious festivals did not have impact on the current study findings, interviews were not conducted around the times of religious festivals including the traditional Tet Chol Chnam Thmay, Sen Don Ta Festival, Dang Y Kathinat festival, Ok Om Bok moon worship festival, Dang Bong festival, Buddha’s Birthday ceremony and the Phum Soc festivals. It is also worth noting that it did not compare the findings of the current study with the Kinh group in the district, which is a limitation to consider in interpreting the results. Given these limitations and the nature of the current study—a cross-sectional design, interpretations of conclusions must be undertaken cautiously.
Author Contributions
Conceptualization, H.N.L. and K.V.N.; methodology, H.N.L., K.V.N. and L.M.; investigation, H.N.L. and K.V.N.; statistical analysis, interpretation, data, H.N.L., K.V.N., L.M., H.P. and N.T.D.H.; writing—original draft preparation, H.N.L.; writing—review and editing, L.M., N.T.D.H., H.N.L., K.V.N., H.P. and D.T.T.; critically revised the manuscript after peer review, H.N.L., L.M. and N.T.D.H. All authors have read and agreed to the published version of the manuscript.
Funding
This research received no external funding.
Institutional Review Board Statement
The study was conducted in accordance with the Declaration of Helsinki, and approved by the Ethical Review Committee by The board of Rectors of An Giang University (now it is An Giang University—Vietnam University Ho Chi Minh City) on 1 October 2018.
Informed Consent Statement
Informed consent was obtained from all subjects involved in the study.
Data Availability Statement
The data presented in this study are available upon reasonable request from the corresponding author. The data are not publicly available due to the privacy of ethnic minority group.
Acknowledgments
We would like to thank all respondents for their genuine response during the interviews and the data collectors for their kind cooperation, strong commitment and honesty. We give special thanks to those students from An Giang university—Vietnam University Ho Chi Minh City who undertook household interviews. Warm thanks also go to Tien Duy Pham (An Giang University—Vietnam University Ho Chi Minh City) for his support in map drawing. We acknowledge the time and resources of the research assistants that Living Deltas Hub contributed to the completion of the paper.
Conflicts of Interest
The authors declare no conflict of interest.
Abbreviations
| aOR | Adjusted odds ratio |
| CI | Confidence interval |
| DDS | Dietary diversity scores |
| HDDS | Household dietary diversity score |
| FAO | Food and Agriculture Organization of the United Nations |
| EPI Info | epidemiological information |
| SPSS | Statistical package for social sciences |
| USD | United States Dollar |
References
- Darapheak, C.; Takano, T.; Kizuki, M.; Nakamura, K.; Seino, K. Consumption of animal source foods and dietary diversity reduce stunting in children in Cambodia. Int. Arch. Med. 2013, 6, 29. [Google Scholar] [CrossRef]
- Monika, B.; Mercedes, d.O. Malnutrition: Quantifying the health impact at national and local levels. In WHO Environmental Burden of Disease Series; World Health Organization: Geneva, Switzerland, 2005. [Google Scholar]
- FAO; IFAD; UNICEF; WFP; WHO. The State of Food Security and Nutrition in the World 2018. Building Climate Resilience for Food Security and Nutrition; FAO: Rome, Italy, 2018. [Google Scholar]
- Black, R.E.; Morris, S.S.; Bryce, J. Where and why are 10 million children dying every year? Lancet 2003, 361, 2226–2234. [Google Scholar] [CrossRef]
- UNICEF. The State of the World’s Children 2015: Reimagine the Future: Innovation for Every Child; UNICEF: New York, NY, USA, 2014.
- Chyne, D.A.L.; Meshram, I.I.; Rajendran, A.; Kodali, V.; Getti, N.; Roy, P.; Kuhnlein, H.V.; Longvah, T. Nutritional status, food insecurity, and biodiversity among the Khasi in Meghalaya, North-East India. Matern. Child Nutr. 2017, 13, e12557. [Google Scholar] [CrossRef]
- Zalilah, M.S.; Tham, B.L. Food Security and Child Nutritional Status among Orang Asli (Temuan) Households in Hulu langat, Selangor. Med. J. Malays. 2002, 57, 36–50. [Google Scholar]
- Kennedy, G.L.; Pedro, M.R.; Seghieri, C.; Nantel, G.; Brouwer, I. Dietary Diversity Score Is a Useful Indicator of Micronutrient Intake in Non-Breast-Feeding Filipino Children. J. Nutr. 2006, 137, 472–477. [Google Scholar] [CrossRef]
- Zhao, W.; Yu, K.; Tan, S.; Zheng, Y.; Zhao, A.; Wang, P.; Zhang, Y. Dietary diversity scores: An indicator of micronutrient inadequacy instead of obesity for Chinese children. BMC Public Health 2017, 17, 440. [Google Scholar] [CrossRef]
- Black, R.E.; Victora, C.G.; Walker, S.P.; Bhutta, Z.A.; Christian, P.; de Onis, M.; Ezzati, M.; Grantham-McGregor, S.; Katz, J.; Martorell, R.; et al. Maternal and child undernutrition and overweight in low-income and middle-income countries. Lancet 2013, 382, 427–451. [Google Scholar] [CrossRef]
- Arimond, M.; Ruel, M.T. Summary Indicators for Infant and Child Feeding Practices: An Example from the Ethiopia Demographic and Health Survey 2000; International Food Policy Research Institute: Washington, DC, USA, 2002. [Google Scholar]
- Steyn, N.P.; Nel, J.H.; Nantel, G.; Kennedy, G.; Labadarios, D. Food variety and dietary diversity scores in children: Are they good indicators of dietary adequacy? Public Health Nutr. 2006, 9, 644–650. [Google Scholar] [CrossRef]
- Otsuka, R.; Kato, Y.; Nishita, Y.; Tange, C.; Nakamoto, M.; Tomida, M.; Imai, T.; Ando, F.; Shimokata, H.; Suzuki, T. Dietary diversity and 14-year decline in higher-level functional capacity among middle-aged and elderly Japanese. Nutrition 2016, 32, 784–789. [Google Scholar] [CrossRef]
- Frempong, R.B.; Annim, S.K. Dietary diversity and child malnutrition in Ghana. Heliyon 2017, 3, e00298. [Google Scholar] [CrossRef]
- Labadarios, D.; Steyn, N.P.; Nel, J. How diverse is the diet of adult South Africans? Nutr. J. 2011, 10, 33. [Google Scholar] [CrossRef] [PubMed]
- Hatløy, A.; Hallund, J.; Diarra, M.M.; Oshaug, A. Food variety, socioeconomic status and nutritional status in urban and rural areas in Koutiala (Mali). Public Health Nutr. 2000, 3, 9. [Google Scholar] [CrossRef] [PubMed]
- Black, M.M. Micronutrient Deficiencies and Cognitive Functioning. J. Nutr. 2003, 133, 3927S–3931S. [Google Scholar] [CrossRef] [PubMed]
- Torlesse, H.; Kiess, L.; Bloem, M.W. Association of household rice expenditure with child nutritional status indicates a role for macroeconomic food policy in combating malnutrition. J. Nutr. 2003, 133, 1320–1325. [Google Scholar] [CrossRef]
- Alkerwi, A.; Sauvageot, N.; Nau, A.; Lair, M.-L.; Donneau, A.-F.; Albert, A.; Guillaume, M. Population Compliance With National Dietary Recommendations and Its Determinants: Findings From the ORISCAV-LUX Study. Br. J. Nutr. 2012, 108, 2083–2092. [Google Scholar] [CrossRef]
- Darmon, N.; Drewnowski, A. Does Social Class Predict Diet Quality? Am. J. Clin. Nutr. 2008, 87, 1107–1117. [Google Scholar] [CrossRef]
- Groth, M.V.; SFagt, L.B. Social Determinants of Dietary Habits in Denmark. Eur. J. Clin. Nutr. 2001, 55, 959–966. [Google Scholar] [CrossRef]
- James, W.P.; Nelson, M.; Ralph, A.; Leather, S. Socioeconomic determinants of health. The contribution of nutrition to inequalities in health. BMJ 1997, 314, 1545–1549. [Google Scholar] [CrossRef]
- Wang, A.; Scherpbier, R.W.; Huang, X.; Guo, S.; Yang, Y.; Josephs-Spaulding, J.; Ma, C.; Zhou, H.; Wang, Y. The dietary diversity and stunting prevalence in minority children under 3 years old: A cross-sectional study in forty-two counties of Western China. Br. J. Nutr. 2017, 118, 840–848. [Google Scholar] [CrossRef]
- Le, T.T.; Le, T.T.D.; Do, N.K.; Nadezhda, V.S.; Andrej, M.G.; Nguyen, T.T.T.; Nguyen, T.T.M.; Vu, T.T.; Le, T.H.; Nguyen, T.T.L.; et al. Ethnic Variations in Nutritional Status among Preschool Children in Northern Vietnam: A Cross-Sectional Study. Int. J. Environ. Res. Public Health 2019, 16, 4060. [Google Scholar] [CrossRef]
- Mbuya, N.V.; Dao, H.L.; Atwood, S.J.; Phuong, H.N.; Thanh Do, T.; Nguyen, S.D. Disparate Outcomes: A Multisectoral Nutrition Assessment and Gap Analysis of Vietnam’s Ethnic Minority Populations (English); World Bank Group: Washington, DC, USA, 2019. [Google Scholar]
- Mbuya, N.V.N.; Atwood, S.J.; Huynh, P.N. Persistent Malnutrition in Ethnic Minority Communities of Vietnam: Issues and Options for Policy and Interventions. International Development in Focus; World Bank: Washington, DC, USA, 2019. [Google Scholar]
- Office of the Government of Vietnam. Stipulating the Objectives of the National Target Program for Economic Development in Vietnam—Society in Ethnic Minority and Mountainous Areas in the Period 2021–2030, Phase I: From 2021 to 2025; Office of the Government of Vietnam: Hanoi, Vietnam, 2021.
- Vietnam Ministry of Health. Regarding the Appointment of Agencies and Organizations to Organize the Implementation of Projects and Sub-Projects Projects and Contents on Health under the National Target Program for Economic Development—The Society of Ethnic Minorities and Mountainous Areas in the Period 2021–2030, Phase I: From 2021 to 2025; Vietnam Ministry of Health: Hanoi, Vietnam, 2022.
- Vu, T.T.M. Some basic and beginning issues for Khmer ethnic community, Now. J. Ethn. Minor. Res. 2017, 20, 13–19. [Google Scholar]
- Tung, D.T. Poverty and Ethnic Minorities: The Case of Khmer Households in the Rural Mekong Delta, Vietnam. Econ. Sociol. 2018, 11, 233–244. [Google Scholar] [CrossRef]
- Socio-Economic Situation in 2016. Available online: https://www.gso.gov.vn/en/data-and-statistics/2020/01/socio-economic-situation-in-2016/ (accessed on 14 December 2022).
- Le, N.H.; Nguyen, T.H.; Ngo, N.T. Nutritional Status among Khmer Ethnic Minority Children Under Five in Tri Ton district, An Giang province. J. Food Nutr. Sci. 2016, 12, 64–70. [Google Scholar]
- Tri Ton Statistical Office. Statistical Yearbook of Tri Ton District. Vietnam: An Giang Statistical Office; Tri Ton Statistical Office: Tri Ton, Vietnam, 2018. [Google Scholar]
- National Institute of Nutrition of Vietnam. Nutritional Status of Children under Five Years Old in 2015; National Institute of Nutrition of Vietnam: Hanoi, Vietnam, 2015. [Google Scholar]
- Potential Development Investment (in Vietnamese: Tiềm Năng Đầu tư Phát Triển). Available online: https://triton.angiang.gov.vn/wps/portal/Home#gsc.tab=0 (accessed on 14 December 2022).
- Luong, V.A. Study on proposal of rural water supply solutions in An Giang province under climate change coditions. Turk. Online J. Des. Art Commun.—TOJDAC 2018, 8, 2914–2923. [Google Scholar]
- Home Office. Country Policy and Information Note Vietnam: Ethnic and Religious Groups; Home Office: London, UK, 2022; Volume v 3.0. [Google Scholar]
- World Food Programme. Climate Impacts on Food Security and Nutrition. A Review of Existing Knowledge; WFP: Rome, Italy, 2012. [Google Scholar]
- United Nations. Transforming Our World: The 2030 Agenda for Sustainbable Development; United Nations: New York, NY, USA, 2015. [Google Scholar]
- Drammeh, W.; Hamid, N.A.; Rohana, A.J. Determinants of Household Food Insecurity and Its Association with Child Malnutrition in Sub-Saharan Africa: A Review of the Literature. Curr. Res. Nutr. Food Sci. 2019, 7, 610–623. [Google Scholar] [CrossRef]
- Ho, T.N. The Social and Economic Effects of Remigration to Rural Areas in Vietnam: A Case Study of Khmer People in O Lam Village, Tri Ton District, An Giang Province; SLU, Department of Urban and Rural Development: Uppsala, Sweden, 2010. [Google Scholar]
- Nguyen, V.T.; Pham, T.L.P. Gender Roles and Relationships: Khmer Ethnic Minority Women’s Participation in Water Management; SEARCA: Los Baños, Philippines, 2021. [Google Scholar]
- Arifin, W.N. Introduction to sample size calculation. Educ. Med. J. 2013, 5, e89–e96. [Google Scholar] [CrossRef]
- FAO. Guidelines for Measuring Household and Individual Dietary Diversity; FAO: Rome, Italy, 2011. [Google Scholar]
- Mekuria, G.; Wubneh, Y.; Tewabe, T. Household dietary diversity and associated factors among residents of finote selam town, north west Ethiopia: A cross sectional study. BMC Nutr. 2017, 3, 28. [Google Scholar] [CrossRef]
- Misker, D.; Misker, B.; Ayele, G. House hold dietary diversity and associated factors in Mirab Abaya wereda Southern Ethiopia; community based cross sectional study. Divers. Equal. Health Care 2016, 13, 293–296. [Google Scholar] [CrossRef]
- Centers for Disease Control and Prevention. EPI-INFO Version 7; Centers for Disease Control and Prevention: Atlanta, GA, USA, 2018.
- IBM. SPSS Statistics Version 20.0; IBM: Armonk, NY, USA, 2018. [Google Scholar]
- Gideon, C.A. Adult Development. In Encyclopedia of Aging and Public Health; Loue, S.J., Sajatovic, M., Boston, M.A., Eds.; Springer: Berlin/Heidelberg, Germany, 2008. [Google Scholar]
- Office of the Government of Vietnam. Regulations on the Multidimensional Poverty Line for the Period of 2021–2025; Office of the Government of Vietnam: Hanoi, Vietnam, 2021.
- Belachew, T.; Yemane, T. Dietary diversity among people 40 years and above in Jimma town Southwest Ethiopia. Ethiop. J. Health Sci. 2007, 17, 115–120. [Google Scholar]
- Exchange Rates, Convert US Dollars to Vietnamese Dong. Available online: https://portal.vietcombank.com.vn/en-Us/Personal/TG/Pages/exchange-rate.aspx?devicechannel=default (accessed on 1 April 2019).
- de Oliveira Otto, M.C.; Anderson, C.A.M.; Dearborn, J.L.; Ferranti, E.P.; Mozaffarian, D.; Rao, G.; Wylie-Rosett, J.; Lichtenstein, A.H.; American Heart Association Behavioral Change for Improving Health Factors Committee of the Council on Lifestyle and Cardiometabolic Health and Council on Epidemiology and Prevention; Council on Cardiovascular and Stroke Nursing; et al. Dietary Diversity: Implications for Obesity Prevention in Adult Populations: A Science Advisory from the American Heart Association. Circulation 2018, 138, e160–e168. [Google Scholar] [CrossRef]
- McCullough, M.L.; Feskanich, D.; Stampfer, M.J.; Giovannucci, E.L.; Rimm, E.B.; Hu, F.B.; Spiegelman, D.; Hunter, D.J.; Colditz, G.A.; Willett, W.C. Diet quality and major chronic disease risk in men and women: Moving toward improved dietary guidance. Am. J. Clin. Nutr. 2002, 76, 1261–1271. [Google Scholar] [CrossRef]
- McDonald, C.M.; McLean, J.; Kroeun, H.; Talukder, A.; Lynd, L.D.; Green, T.J. Household food insecurity and dietary diversity as correlates of maternal and child undernutrition in rural Cambodia. Eur. J. Clin. Nutr. 2015, 69, 242–246. [Google Scholar] [CrossRef]
- Cambodia Population 2019. Available online: http://worldpopulationreview.com/countries/cambodia-population/ (accessed on 14 October 2019).
- Nguyen, P.; Manohar, S.; Mai, L.; Subandoro, A.; Rawat, R.P.M. Alive & Thrive Baseline Survey Report: Viet Nam; International Food Policy Research Institute: Washington, DC, USA, 2011. [Google Scholar]
- Sarkar, S. Households’ Dietary Diversity: A Study of Rural Households in West Bengal, India. Eur. Acad. Res. 2014, 2, 8307–8325. [Google Scholar]
- Taruvinga, A.; Muchenje, V.; Mushunje, A. Determinants of rural household dietary diversity: The case of Amatole and Nyandeni districts, South Africa. Int. J. Dev. Sustain. 2013, 2, 2233–2247. [Google Scholar]
- Hassen, Z.N. Determinants of Household Dietary Diversity and Nutritional Status of Women in Reproductive Age Group: The Case of Addis Ababa City, Ethiopia. Master’s Thesis, University of Nairobi, Department of Food Science, Nutrition and Technology, Nairobi, Kenya, 2013. [Google Scholar]
- Khamis, A.G.; Mwanri, A.W.; Ntwenya, J.E.; Kreppel, K. The influence of dietary diversity on the nutritional status of children between 6 and 23 months of age in Tanzania. BMC Pediatr. 2019, 19, 518. [Google Scholar] [CrossRef]
- The Ministry of Health Announced the Results of the 2019–2020 Nutrition Census (In Vietnamese: Bộ Y tế Công bố kết Quả Tổng Điểu tra Dinh Dưỡng Năm 2019–2020). Available online: https://moh.gov.vn/tin-noi-bat/-/asset_publisher/3Yst7YhbkA5j/content/bo-y-te-cong-bo-ket-qua-tong-ieu-tra-dinh-duong-nam-2019-2020 (accessed on 14 December 2022).
- Chau, T.T.N. Promotion of the Consumption of Local Foods to Improve the Diet of Vietnamese Children. Master’s Thesis, Ghent University, Faculty of Bioscience Engineering, Ghent, Belgium, 2016. [Google Scholar]
- Cordero-Ahiman, O.V.; Santellano-Estrada, E.; Garrido, A. Dietary Diversity in Rural Households: The Case of Indigenous Communities in Sierra Tarahumara, Mexico. J. Food Nutr. Res. 2017, 5, 86–94. [Google Scholar] [CrossRef]
- Nguyen, P.H.; Avula, R.; Ruel, M.T.; Saha, K.K.; Ali, D.; Tran, L.M.; Frongillo, E.A.; Menon, P.; Rawat, R. Maternal and child dietary diversity are associated in Bangladesh, Vietnam, and Ethiopia. J. Nutr. 2013, 143, 1176–1183. [Google Scholar] [CrossRef]
- Legwegoh, A.F.; Hovorka, A.J. Assessing food insecurity in Botswana: The case of Gaborone. Dev. Pract. 2013, 23, 346–358. [Google Scholar] [CrossRef]
- Angeles-Agdeppa, I.; Denney, L.; Toledo, M.B.; Obligar, V.A.; Jacquier, E.F.; Carriquiry, A.L.; Capanzana, M.V. Inadequate nutrient intakes in Filipino schoolchildren and adolescents are common among those from rural areas and poor families. Food Nutr. Res. 2019, 63, 3435. [Google Scholar] [CrossRef]
- Hwalla, N.; Dhaheri, A.S.A.; Radwan, H.; Alfawaz, H.A.; Fouda, M.A.; Al-Daghri, N.M.; Zaghloul, S.; Blumberg, J.B. The Prevalence of Micronutrient Deficiencies and Inadequacies in the Middle East and Approaches to Interventions. Nutrients 2017, 9, 229. [Google Scholar] [CrossRef]
- Kunto, Y.S.; Bras, H. Ethnic Group Differences in Dietary Diversity of School-Aged Children in Indonesia: The Roles of Gender and Household SES. Food Nutr. Bull. 2019, 40, 182–201. [Google Scholar] [CrossRef] [PubMed]
- Van Der Eng, P. Cassava in Indonesia: A historical re-appraisal of an enigmatic food crop. Southeast Asian Stud. 1998, 36, 3–31. [Google Scholar]
- Mandrekar, J.N. Receiver Operating Characteristic Curve in Diagnostic Test Assessment. J. Thorac. Oncol. 2010, 5, 1315–1316. [Google Scholar] [CrossRef] [PubMed]
- Jayawardena, R.; Byrne, N.M.; Soares, M.J.; Katulanda, P.; Yadav, B.; Hills, A.P. High dietary diversity is associated with obesity in Sri Lankan adults: An evaluation of three dietary scores. BMC Public Health 2013, 13, 314. [Google Scholar] [CrossRef]
- Food and Agriculture Organization of the United Nations. Women and Sustainable Food Security In Women: The Key to Food Security; Women and Population Division, Sustainable Development Department: Rome, Italy; Food and Agriculture Organization of the United Nations: Rome, Italy, 1997. [Google Scholar]
- Headey, D.; Chiu, A.; Kadiyala, S. Agriculture’s role in the Indian Enigma: Help or hindrance to the crisis of undernutrition? Food Secur. 2012, 4, 87–102. [Google Scholar] [CrossRef]
- Kadiyala, S.; Harris, J.; Headey, D.; Yosef, S.; Gillespie, S. Agriculture and nutrition in India: Mapping evidence to pathways. Ann. N. Y. Acad. Sci. 2014, 1331, 43–56. [Google Scholar] [CrossRef]
- Komatsu, H.; Malapit, H.J.L.; Theis, S. Does women’s time in domestic work and agriculture affect women’s and children’s dietary diversity? Evidence from Bangladesh, Nepal, Cambodia, Ghana, and Mozambique. Food Policy 2018, 79, 256–270. [Google Scholar] [CrossRef]
- Rahman, R.I.; Islam, R. Employment, Labour Force Participation and Education: Towards Gender Equality in Bangladesh; Centre for Development and Employment Research (CDER) and Friedrich-Ebert-Stiftung (FES) Bangladesh: Dhaka, Bangladesh, 2019. [Google Scholar]
- Smith, L.C.; Haddad, L. Explaining Child Malnutrition in Developing Countries: A Cross-Country Analysis; International Food Policy Research Institute: Washington, DC, USA, 2000. [Google Scholar]
- Smith, L.C.; Ramakrishnan, U.; Ndiaye, A.; Haddad, L.; Martorell, R. The Importance of Women’s Status for Child Nutrition in Developing Countries; International Food Policy Research Institute: Washington, DC, USA, 2003. [Google Scholar]
- Block, S.A. Maternal Nutrition Knowledge and the Demand for Micronutrient-Rich Foods: Evidence from Indonesia. J. Dev. Stud. 2003, 40, 82–105. [Google Scholar] [CrossRef]
- Morseth, M.S.; Grewal, N.K.; Kaasa, I.S.; Hatloy, A.; Barikmo, I.; Henjum, S. Dietary diversity is related to socioeconomic status among adult Saharawi refugees living in Algeria. BMC Public Health 2017, 17, 621. [Google Scholar] [CrossRef]
- World Health Organization. A Conceptual Framework for Action on the Social Determinants of Health; World Health Organization: Geneva, Switzerland, 2010. [Google Scholar]
- Regmi, A. Changing Structure of Global Food Consumption and Trade. Market and Trade Economics Division. Economic Research Service, USDA, Agriculture and Trade Report; WRS-01-1. Edition; United States Department of Agriculture: Washington, DC, USA, 2001.
- Pollack, S.L. Consumer Demand for Fruit and Vegetables: The U.S. Example. Changing Structure of Global Food Consumption and Trade Edition; Economic Research Service, U.S. Department of Agriculture: Washington, DC, USA, 2001.
- Thielea, S.; Weiss, C. Consumer demand for food diversity: Evidence for Germany. Food Policy 2003, 28, 99–115. [Google Scholar] [CrossRef]
- Ruel, M.; Minot, N.; Smith, L. Patterns and determinants of fruit and vegetable demand in developing countries: A multi-country comparison. In Proceedings of the Joint WHO/FAO Workshop on Fruit and Vegetables for Health, Kobe, Japan, 1–3 September 2004. [Google Scholar]
- Beyene, M.; Worku, A.G.; Wassie, M.M. Dietary diversity, meal frequency and associated factors among infant and young children in Northwest Ethiopia: A cross- sectional study. BMC Public Health 2015, 15, 1007. [Google Scholar] [CrossRef] [PubMed]
- Kabir, M.R.; Halima, O.; Rahman, N.; Ghosh, S.; Islam, M.S.; Rahman, H. Linking farm production diversity to household dietary diversity controlling market access and agricultural technology usage: Evidence from Noakhali district, Bangladesh, Heliyon. Heliyon 2022, 8, e08755. [Google Scholar] [CrossRef] [PubMed]
- Ochieng, J.; Afari-Sefa, V.; Lukumay, P.J.; Dubois, T. Determinants of dietary diversity and the potential role of men in improving household nutrition in Tanzania. PLoS ONE 2017, 12, e0189022. [Google Scholar] [CrossRef] [PubMed]


Disclaimer/Publisher’s Note: The statements, opinions and data contained in all publications are solely those of the individual author(s) and contributor(s) and not of MDPI and/or the editor(s). MDPI and/or the editor(s) disclaim responsibility for any injury to people or property resulting from any ideas, methods, instructions or products referred to in the content. |
© 2023 by the authors. Licensee MDPI, Basel, Switzerland. This article is an open access article distributed under the terms and conditions of the Creative Commons Attribution (CC BY) license (https://creativecommons.org/licenses/by/4.0/).