

Transfer of Bisphenol A and Trace Metals from Plastic Packaging to Mineral Water in Ouagadougou, Burkina Faso
 , ,
, ,
Abstract
:1. Introduction
2. Materials and Methods
2.1. Study Area
2.2. Sampling and Preliminary Tests
2.3. Analyses and Calibration
- 18 °C as the average of the lowest annual temperatures;
- 29 °C as the average annual temperature;
- 39 °C as the average of the highest annual temperatures.
3. Results and Discussion
3.1. Production, Transport and Storage of Packaged Water
3.2. Bisphenol A in Sources and Packaged Water in Ouagadougou
3.3. BPA in Packaged Water
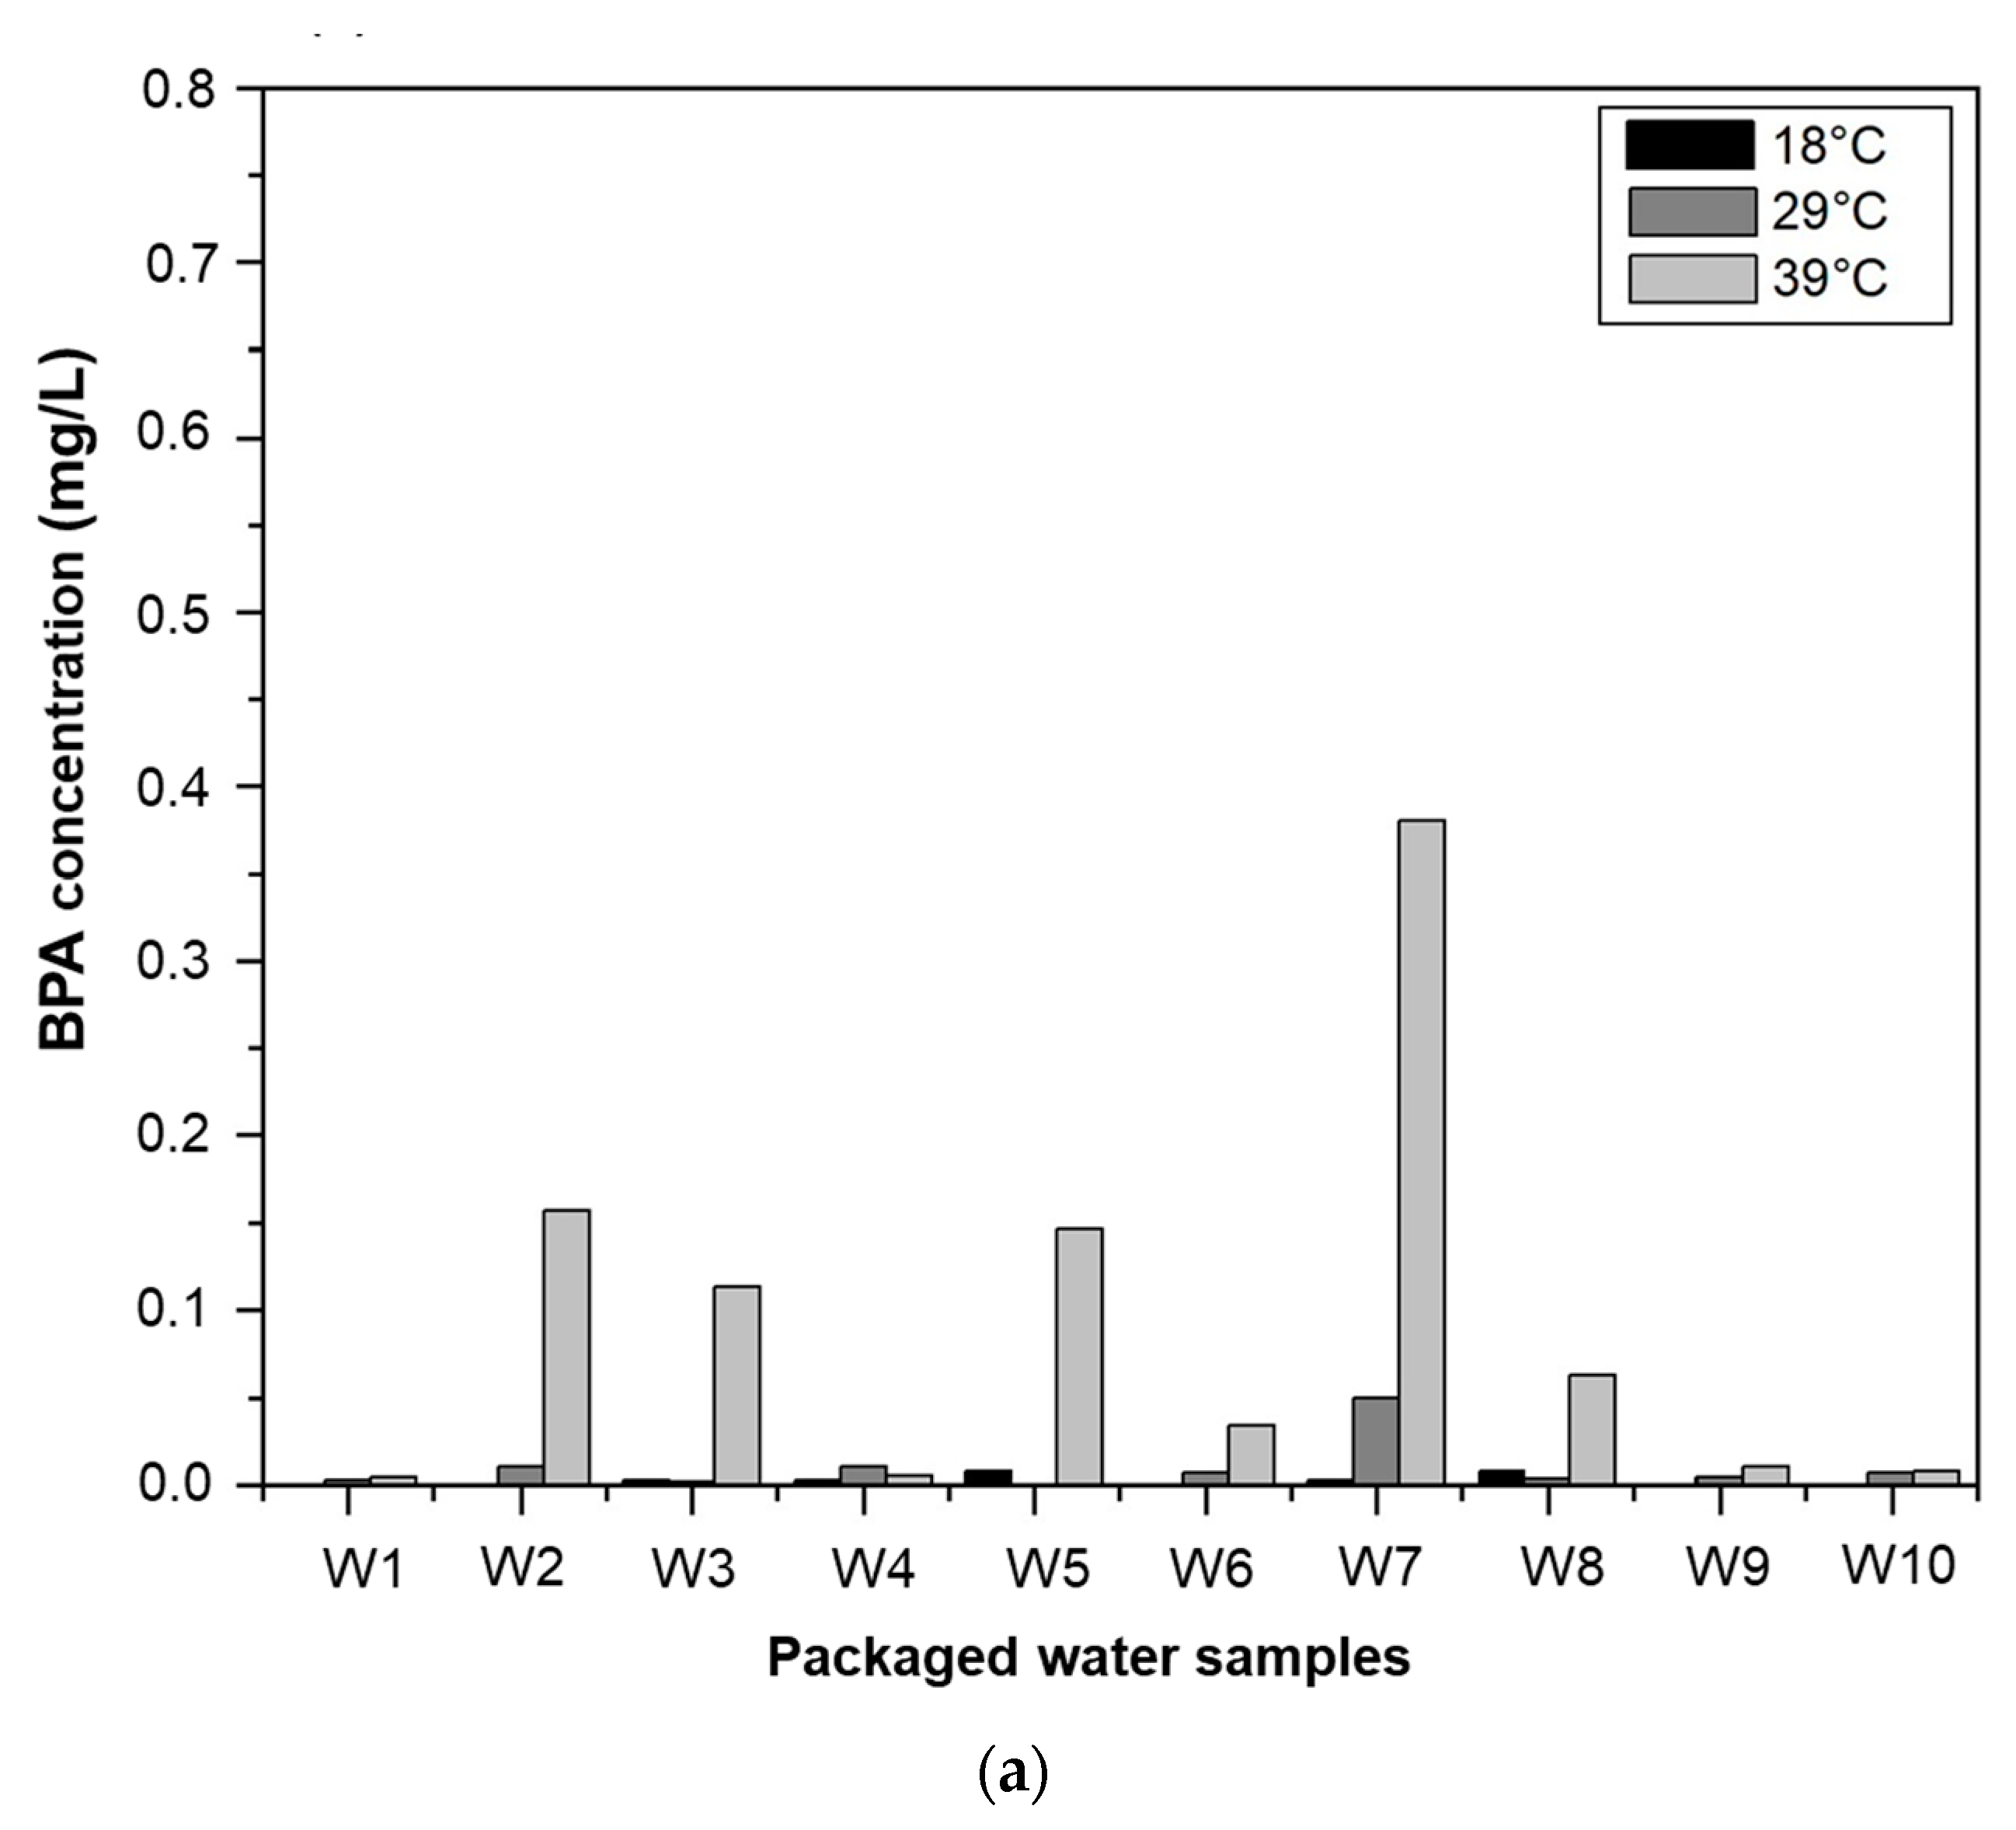
3.3.1. Effect of Temperature on BPA Migration
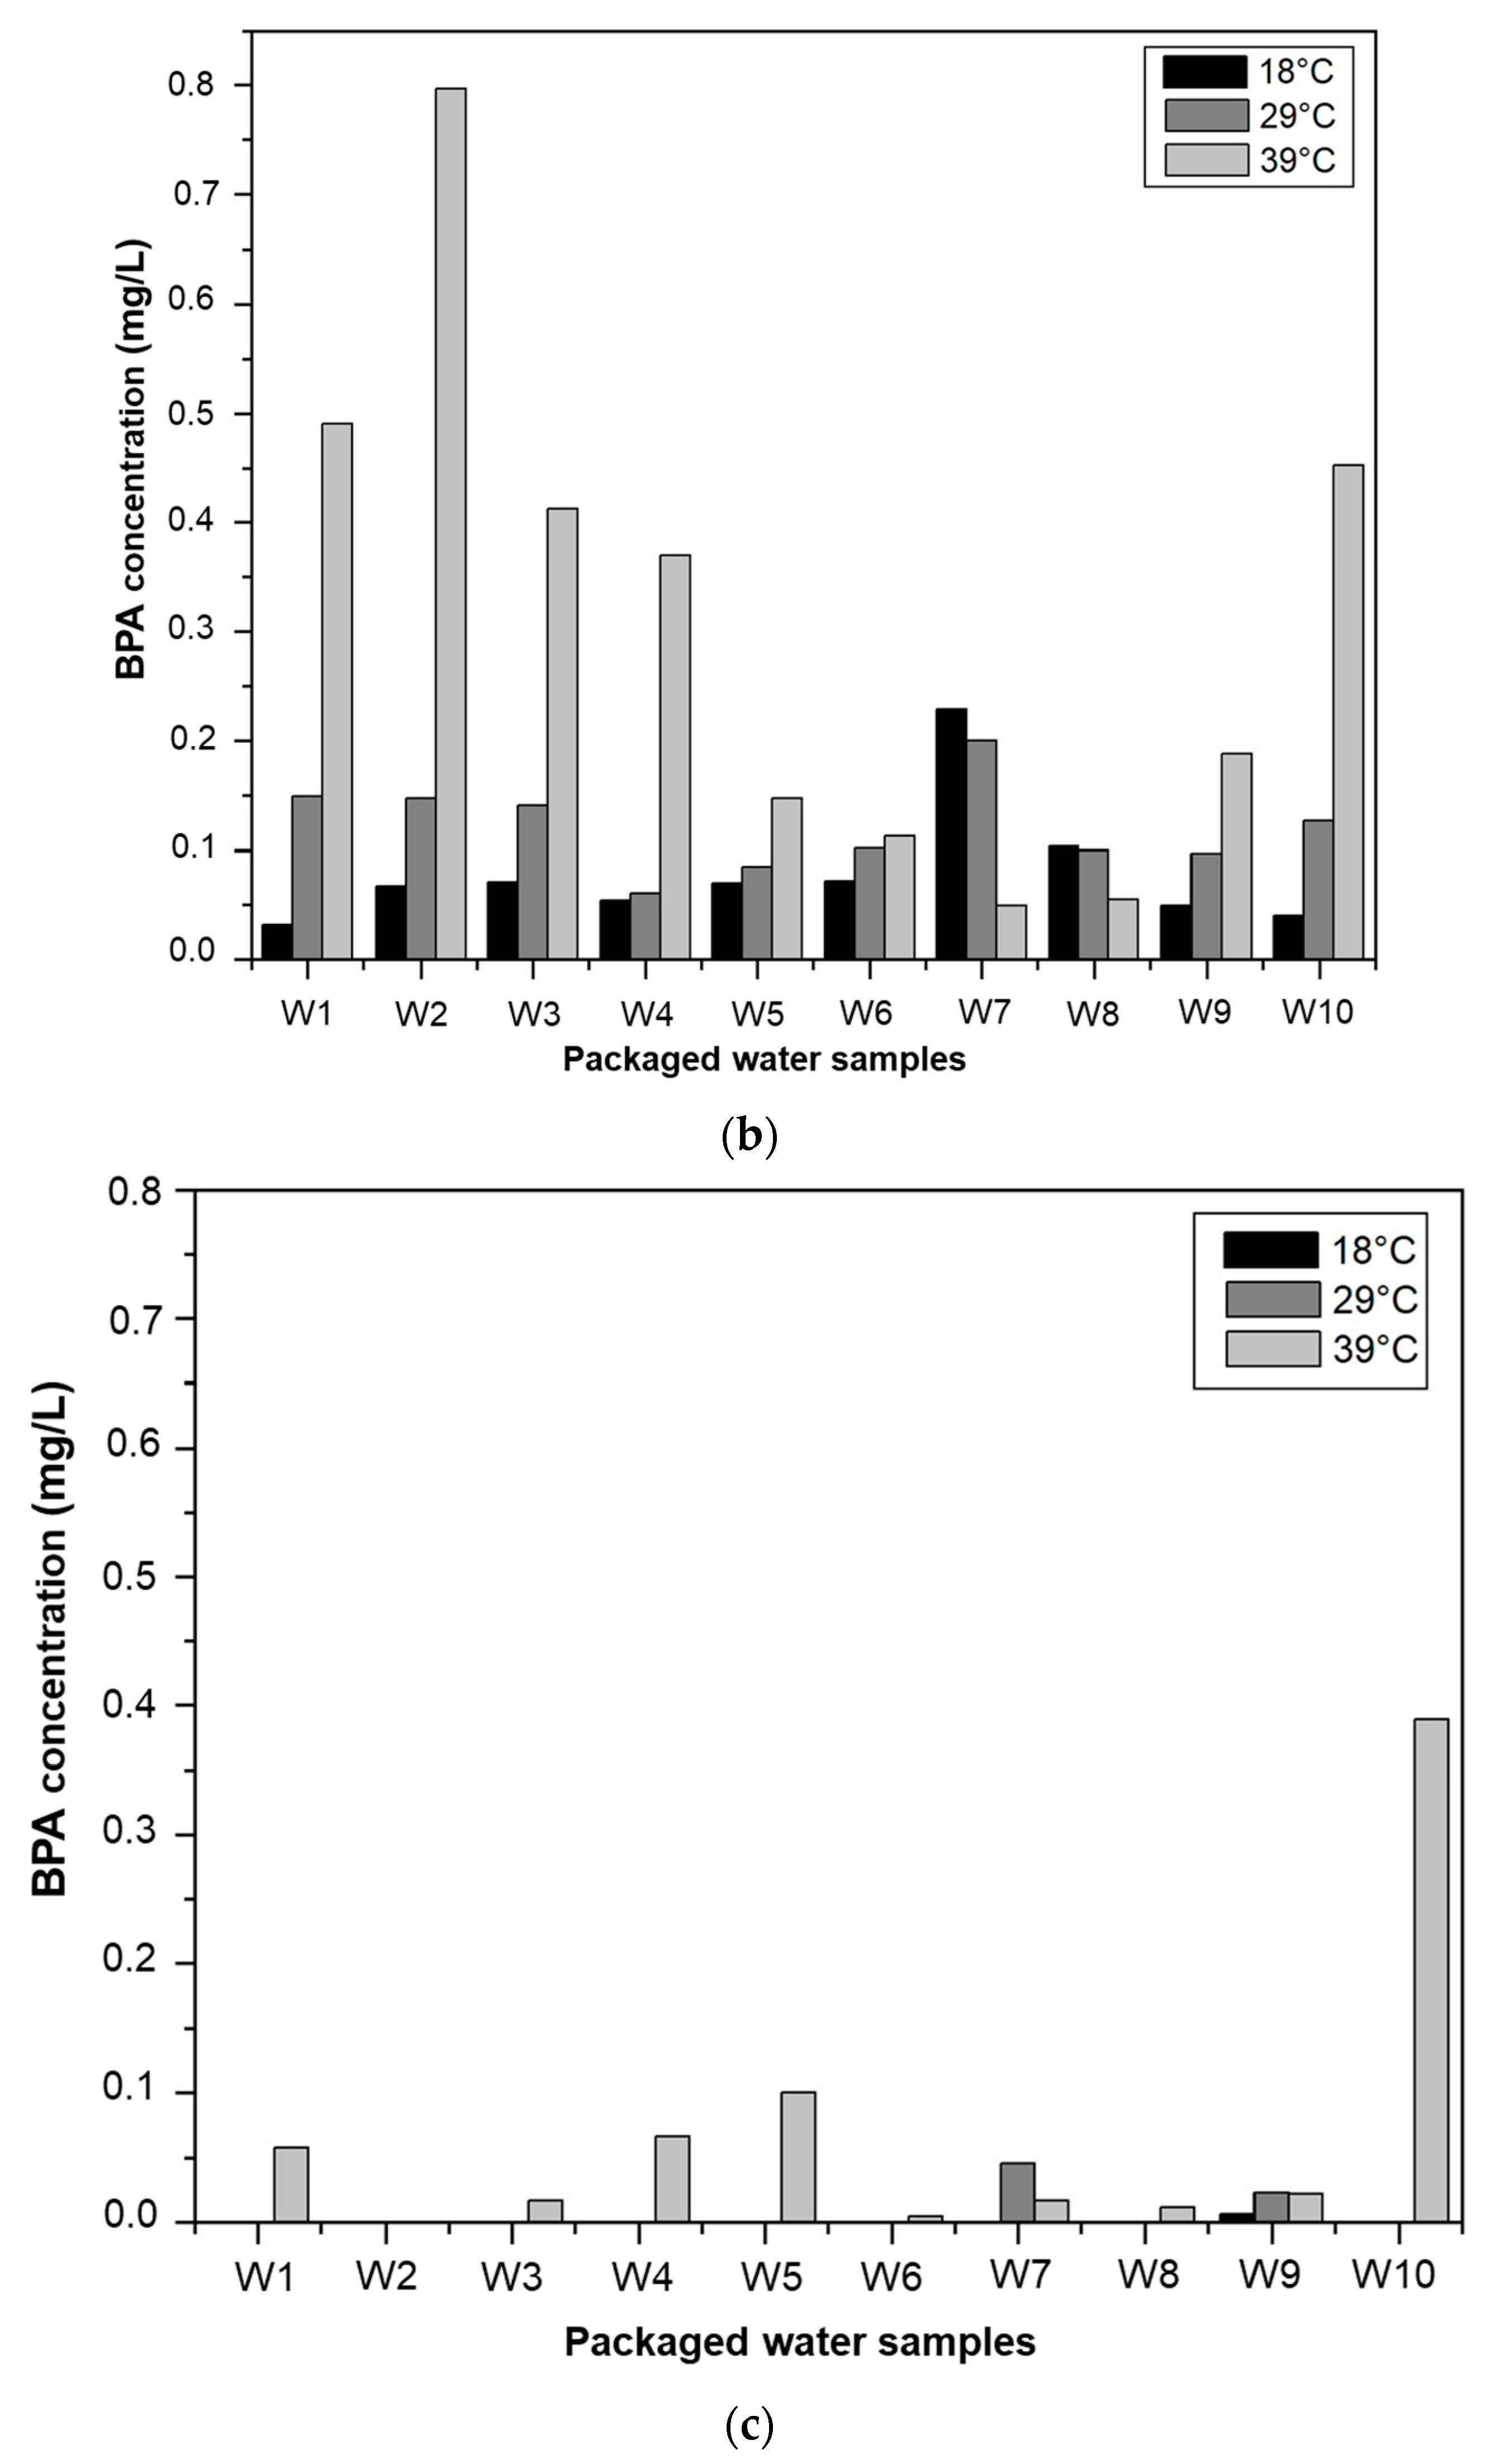
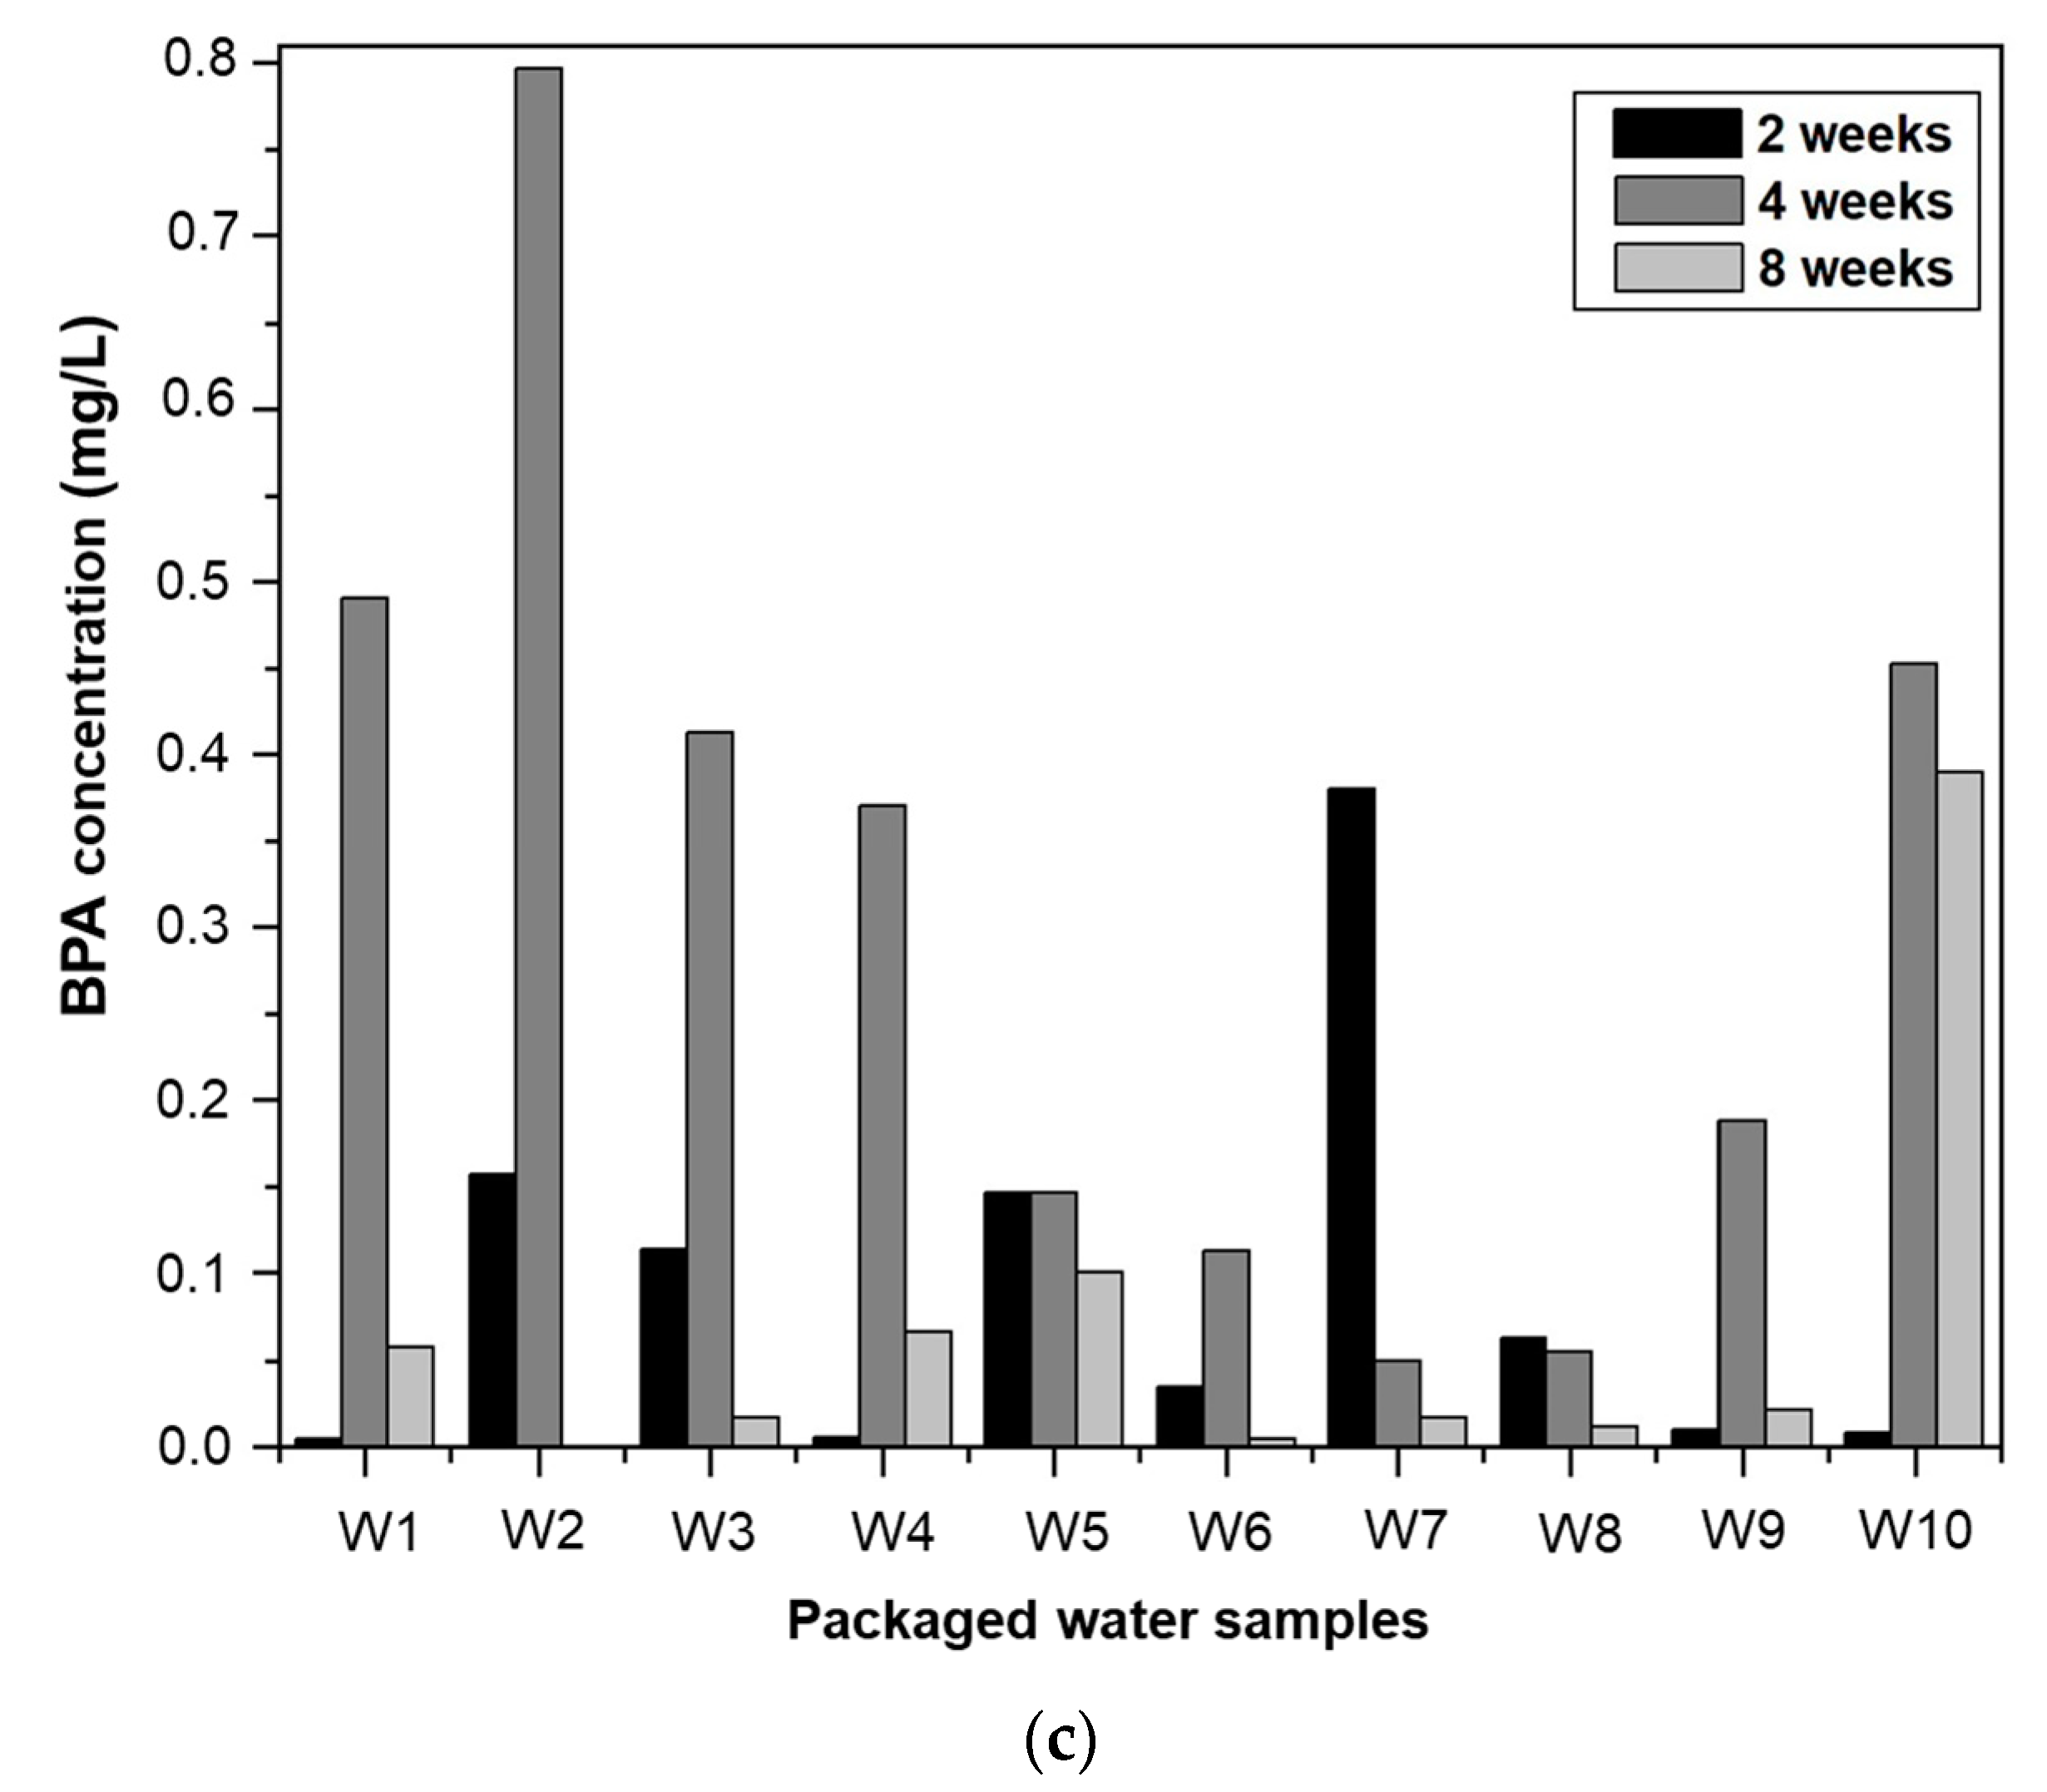
3.3.2. Effect of Storage Time on BPA Migration
3.3.3. The Degradation of BPA in Packaged Water
3.3.4. Chloride and pH Effect on BPA Behaviour
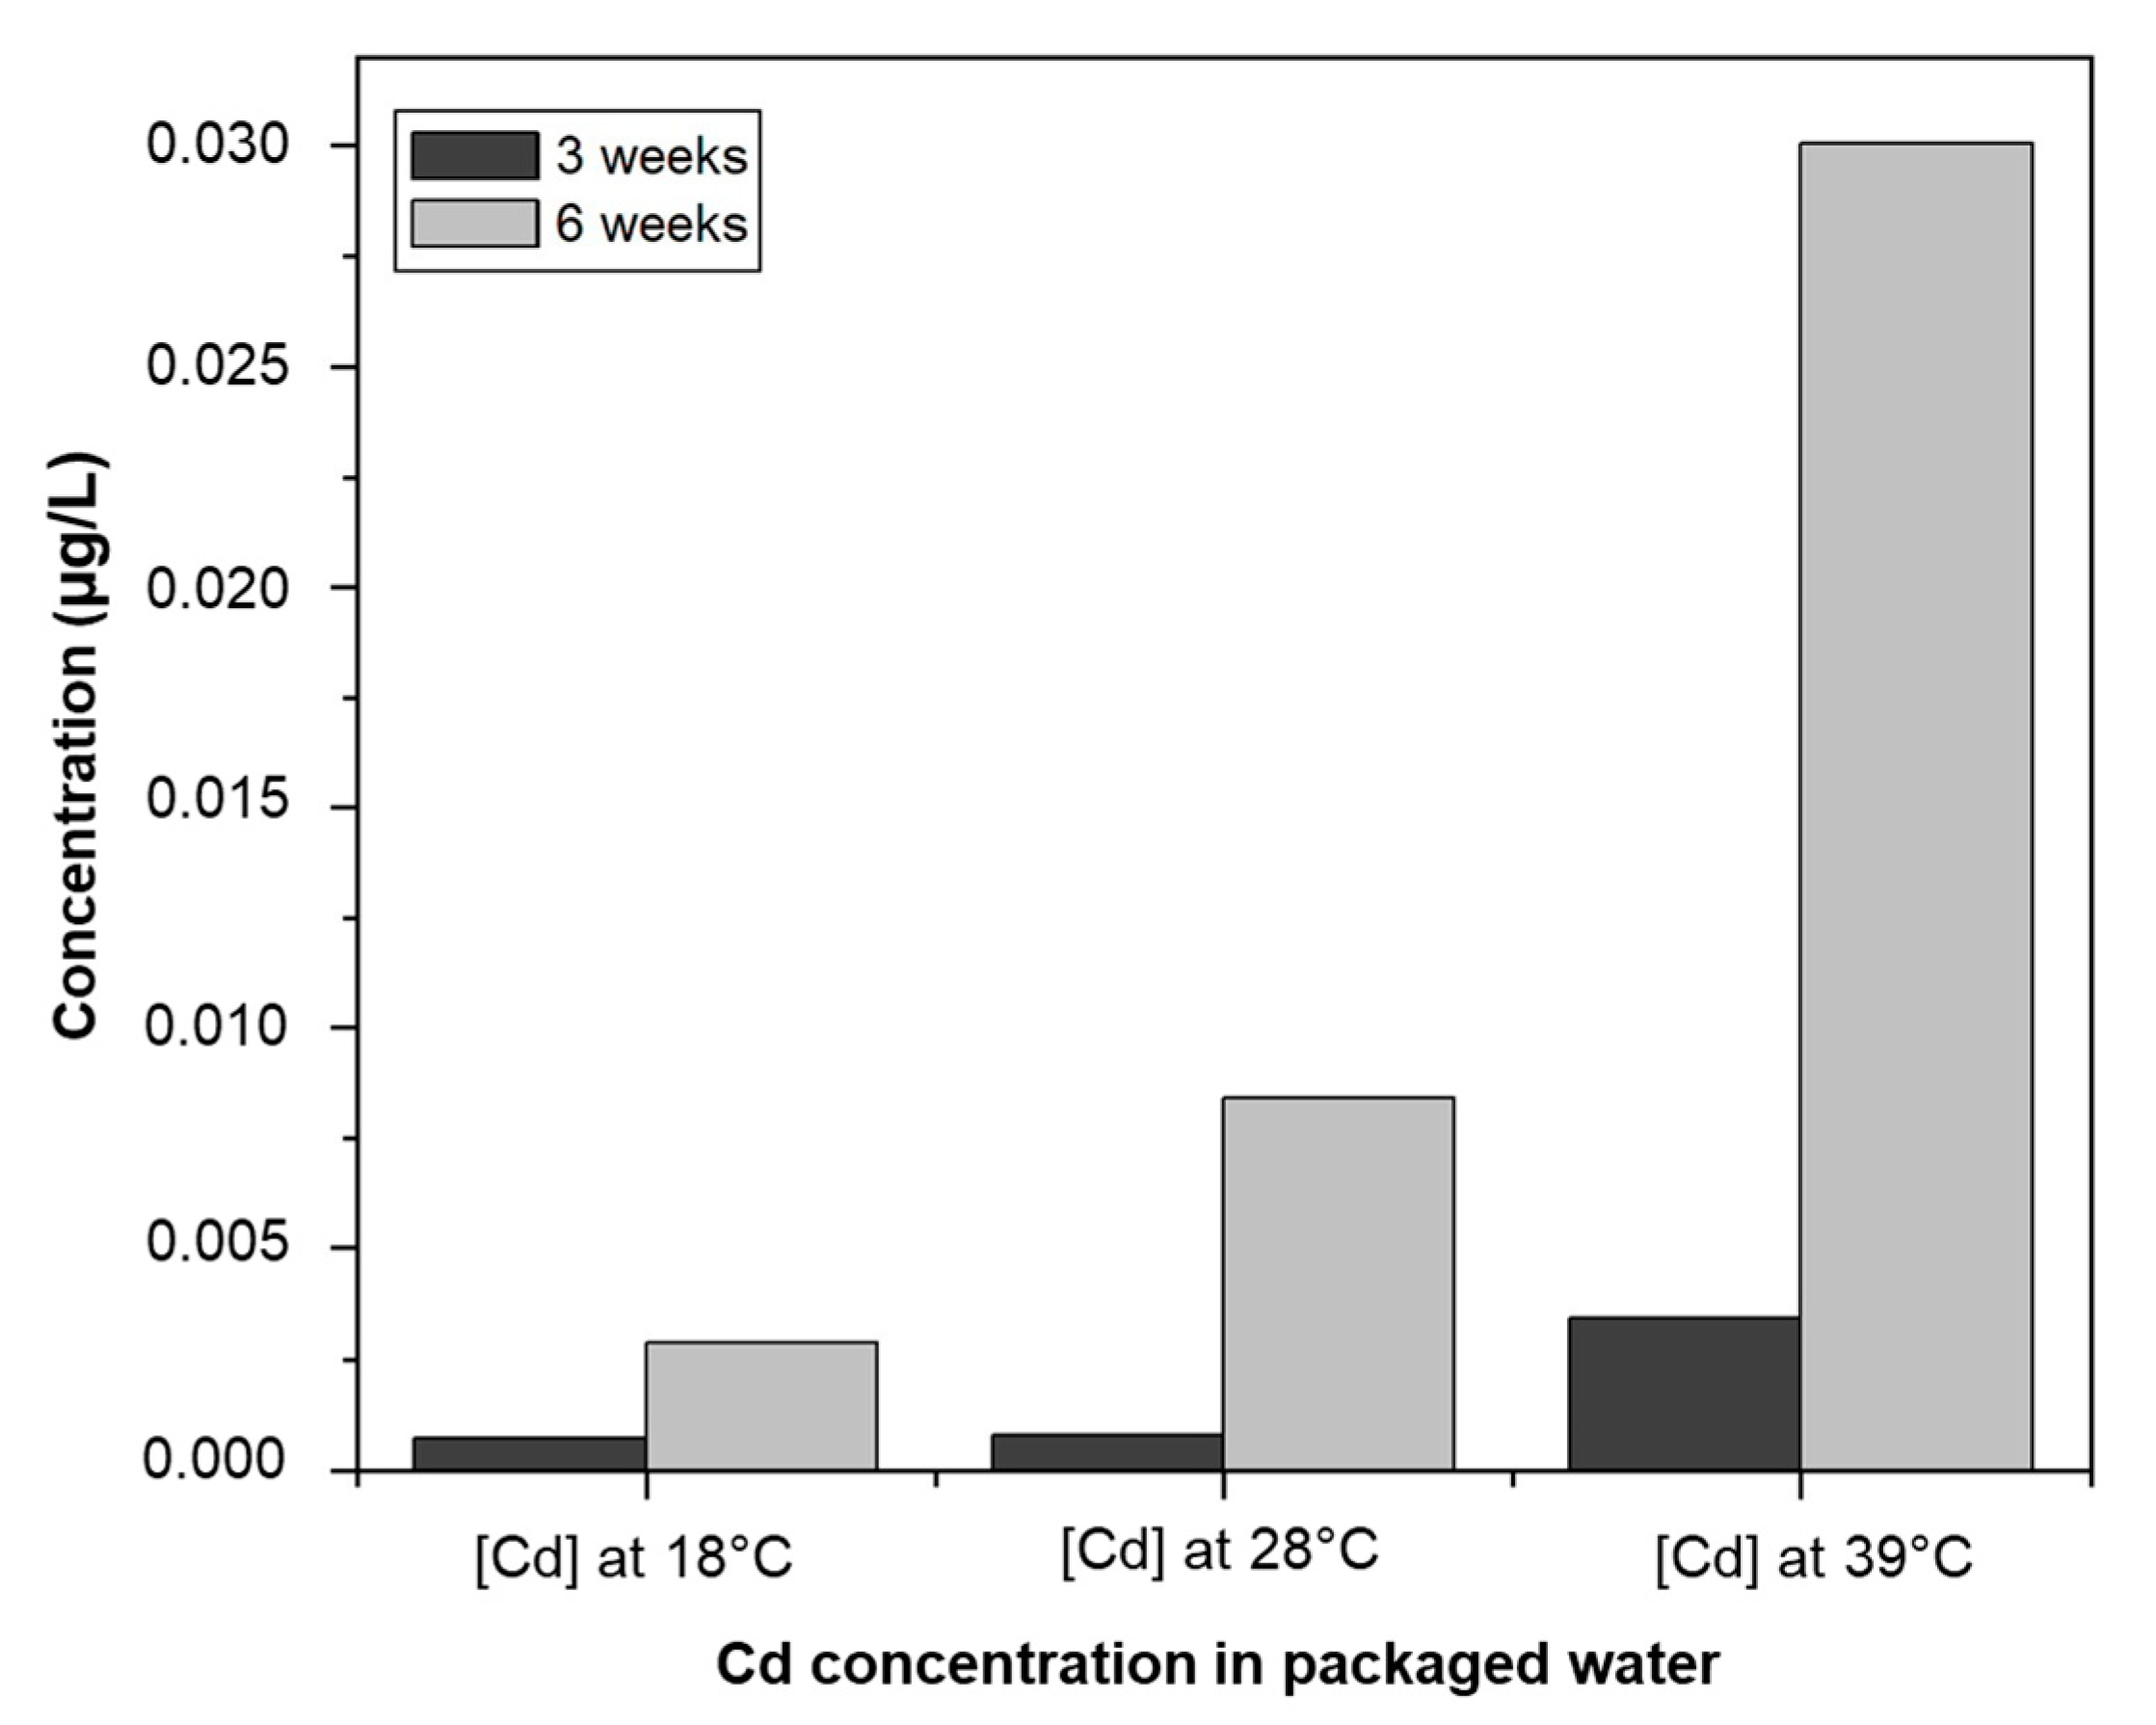
3.4. Trace Metals in Packaged Water
4. Conclusions
Author Contributions
Funding
Institutional Review Board Statement
Informed Consent Statement
Data Availability Statement
Acknowledgments
Conflicts of Interest
References
- Africa: Population Growth Rate 2000–2030. Available online: https://www.statista.com/statistics/1224179/population-growth-in-africa/ (accessed on 5 July 2023).
- ONU-Habitat Plan Stratégique du Programme des Nations Unies pour les Établissements Humains Pour la Période 2020–2023. 2020. Available online: https://unhabitat.org/sites/default/files/2019/12/strategic_plan_fr.pdf (accessed on 5 July 2023).
- Denis, E. La Croissance Urbaine en Afrique de l’Ouest De l’Exploitation à la Prolifération. 2009. Available online: https://shs.hal.science/halshs-00371263 (accessed on 5 July 2023).
- Zoma, V.; Kiemdé, A.; Sawadogo, Y. Principaux Défis de La Croissance Urbaine de Ouagadougou. Regardsuds 2022, 2, 77–92. [Google Scholar]
- INSD Institut National de La Statistique et La Demographie, Ouagadougou (Projections Communales 2020). Available online: http://www.insd.bf/ (accessed on 21 November 2022).
- Ahmed, J.; Wong, L.P.; Channa, N.; Ahmed, W.; Chua, Y.P.; Shaikh, M.Z. Arsenic Contamination and Potential Health Risk to Primary School Children through Drinking Water Sources. Hum. Ecol. Risk Assess. Int. J. 2022, 29, 369–389. [Google Scholar] [CrossRef]
- Alarcón-Herrera, M.T.; Martin-Alarcon, D.A.; Gutiérrez, M.; Reynoso-Cuevas, L.; Martín-Domínguez, A.; Olmos-Márquez, M.A.; Bundschuh, J. Co-Occurrence, Possible Origin, and Health-Risk Assessment of Arsenic and Fluoride in Drinking Water Sources in Mexico: Geographical Data Visualization. Sci. Total Environ. 2020, 698, 134168. [Google Scholar] [CrossRef] [PubMed]
- Saha, R.; Dey, N.C.; Rahman, M.; Bhattacharya, P.; Rabbani, G.H. Geogenic Arsenic and Microbial Contamination in Drinking Water Sources: Exposure Risks to the Coastal Population in Bangladesh. Front. Environ. Sci. 2019, 7, 57. [Google Scholar] [CrossRef]
- Obianyo, J.I. Effect of Storage Containers on Water Quality. Trop. J. Sci. Technol. 2020, 1, 66. [Google Scholar]
- Adeloju, S.B.; Khan, S.; Patti, A.F. Arsenic Contamination of Groundwater and Its Implications for Drinking Water Quality and Human Health in Under-Developed Countries and Remote Communities—A Review. Appl. Sci. 2021, 11, 1926. [Google Scholar] [CrossRef]
- Ahmad, A.; Bhattacharya, P. Arsenic in Drinking Water: Is 10 Μg/L a Safe Limit? Curr. Pollut. Rep. 2019, 5, 1–3. [Google Scholar] [CrossRef]
- Sawadogo, B.; Konaté, Y.; Sossou, S.K.; Ado Saidou, N.F.; Nouhou Moussa, A.W.; Karambiri, H. Removal of Sulphate Ions from Borehole Water Using Nanofiltration and Reverse Osmosis. Water 2022, 14, 3422. [Google Scholar] [CrossRef]
- Uppal, J.S.; Zheng, Q.; Le, X.C. Arsenic in Drinking Water—Recent Examples and Updates from Southeast Asia. Curr. Opin. Environ. Sci. Health 2019, 7, 126–135. [Google Scholar] [CrossRef]
- Ahoussi, E.; Soro, N.; Kouassi, A.; Soro, G.; Koffi, Y.; Zade, S. Application des méthodes d’analyses statistiques multivariées à l’étude de l’origine des métaux lourds (Cu2+, Mn2+, Zn2+ et Pb2+) dans les eaux des nappes phréatiques de la ville d’Abidjan. Int. J. Biol. Chem. Sci. 2010, 4, 1753–1765. [Google Scholar] [CrossRef]
- Kumar, S.; Islam, A.R.M.T.; Islam, H.M.T.; Hasanuzzaman, M.; Ongoma, V.; Khan, R.; Mallick, J. Water Resources Pollution Associated with Risks of Heavy Metals from Vatukoula Goldmine Region, Fiji. J. Environ. Manag. 2021, 293, 112868. [Google Scholar] [CrossRef]
- Naik, M.R.; Barik, M.; Prasad, K.V.; Kumar, A.; Verma, A.K.; Sahoo, S.K.; Jha, V.; Sahoo, N.K. Hydro-Geochemical Analysis Based on Entropy and Geostatistics Model for Delineation of Anthropogenic Ground Water Pollution for Health Risks Assessment of Dhenkanal District, India. Ecotoxicology 2022, 31, 549–564. [Google Scholar] [CrossRef]
- Tokatlı, C.; Varol, M. Variations, Health Risks, Pollution Status and Possible Sources of Dissolved Toxic Metal(Loid)s in Stagnant Water Bodies Located in an Intensive Agricultural Region of Turkey. Environ. Res. 2021, 201, 111571. [Google Scholar] [CrossRef]
- Cantoni, B.; Cappello Riguzzi, A.; Turolla, A.; Antonelli, M. Bisphenol A Leaching from Epoxy Resins in the Drinking Water Distribution Networks as Human Health Risk Determinant. Sci. Total Environ. 2021, 783, 146908. [Google Scholar] [CrossRef]
- Schlienger, J.-L. Impact métabolique de l’exposition au bisphénol A: État des lieux. Médecine Mal. Metab. 2014, 8, 340–345. [Google Scholar] [CrossRef]
- AFSSA Avis de l’agence Française de Sécurité Santinaire Des Aliments Relatif Aux Bisphénol A Dans Les Biberons En Polycarbonate Susceptibles d’etre Chauffés Au Four à Micro-Ondes. 2008. Available online: https://www.anses.fr/fr/system/files/MCDA2008sa0141.pdf (accessed on 5 July 2023).
- Vandenberg, L.N.; Hauser, R.; Marcus, M.; Olea, N.; Welshons, W.V. Human Exposure to Bisphenol A (BPA). Reprod. Toxicol. 2007, 24, 139–177. [Google Scholar] [CrossRef]
- Monneret, C. Faut-il interdire le bisphénol A? Ann. Pharm. Fr. 2010, 68, 99–103. [Google Scholar] [CrossRef]
- Schäfer, A.I.; Nghiem, L.D.; Oschmann, N. Bisphenol A Retention in the Direct Ultrafiltration of Greywater. J. Membr. Sci. 2006, 283, 233–243. [Google Scholar] [CrossRef]
- Cooper, J.E.; Kendig, E.L.; Belcher, S.M. Assessment of Bisphenol A Released from Reusable Plastic, Aluminium and Stainless Steel Water Bottles. Chemosphere 2011, 85, 943–947. [Google Scholar] [CrossRef] [PubMed]
- LEC Methode LEC Pour l’analyse Du Bisphénol A Dans Les Boissons, Fiche Technique, Laboratoire Expertises et Conseils Accredite Pour Les Analyses Œnologiques et Pour Les Analyses de Traces Sur Bois de Tonnellerie, Boissons Spiritueuses & Vins. Agrement Pour Certificat Exports. 2016. Available online: https://www.lec-cognac.com/wa_files/FT_Bisphenol_20A.pdf (accessed on 5 July 2023).
- Nalbone, G.; Cicolella, A.; Laot-Cabon, S. L’exposition humaine au bisphénol A: Un facteur de risque environnemental des maladies métaboliques et cardiovasculaires. Med. Longévité 2011, 3, 42–51. [Google Scholar] [CrossRef]
- Jiang, W.; Ding, K.; Huang, W.; Xu, F.; Lei, M.; Yue, R. Potential Effects of Bisphenol A on Diabetes Mellitus and Its Chronic Complications: A Narrative Review. Heliyon 2023, 9, e16340. [Google Scholar] [CrossRef] [PubMed]
- Zafra, A.; del Olmo, M.; Suárez, B.; Hontoria, E.; Navalón, A.; Vílchez, J.L. Gas Chromatographic–Mass Spectrometric Method for the Determination of Bisphenol A and Its Chlorinated Derivatives in Urban Wastewater. Water Res. 2003, 37, 735–742. [Google Scholar] [CrossRef] [PubMed]
- Prueitt, R.L.; Hixon, M.L.; Fan, T.; Olgun, N.S.; Piatos, P.; Zhou, J.; Goodman, J.E. Systematic Review of the Potential Carcinogenicity of Bisphenol A in Humans. Regul. Toxicol. Pharmacol. 2023, 142, 105414. [Google Scholar] [CrossRef]
- Bhardwaj, L.K.; Sharma, A. Estimation of Physico-Chemical, Trace Metals, Microbiological and Phthalate in PET Bottled Water. Chem. Afr. 2021, 4, 981–991. [Google Scholar] [CrossRef]
- Noureddine El Moussawi, S.; Ouaini, R.; Matta, J.; Chébib, H.; Cladière, M.; Camel, V. Simultaneous Migration of Bisphenol Compounds and Trace Metals in Canned Vegetable Food. Food Chem. 2019, 288, 228–238. [Google Scholar] [CrossRef]
- Rowell, C.; Kuiper, N.; Preud’Homme, H. Is Container Type the Biggest Predictor of Trace Element and BPA Leaching from Drinking Water Bottles? Food Chem. 2016, 202, 88–93. [Google Scholar] [CrossRef]
- Lu, T.; Peng, H.; Yao, F.; Nadine Ferrer, A.S.; Xiong, S.; Niu, G.; Wu, Z. Trace Elements in Public Drinking Water in Chinese Cities: Insights from Their Health Risks and Mineral Nutrition Assessments. J. Environ. Manag. 2022, 318, 115540. [Google Scholar] [CrossRef]
- Vasseghian, Y.; Almomani, F.; Dragoi, E.-N. Health Risk Assessment Induced by Trace Toxic Metals in Tap Drinking Water: Condorcet Principle Development. Chemosphere 2022, 286, 131821. [Google Scholar] [CrossRef]
- RGPH 2019: Le Burkina Faso Compte 20 487 979 Habitants. Available online: https://www.finances.gov.bf/forum/detail-actualites?tx_news_pi1%5Baction%5D=detail&tx_news_pi1%5Bcontroller%5D=News&tx_news_pi1%5Bnews%5D=210&cHash=d4f20bcadd89c7ad2ad4f420b4300dfa (accessed on 5 July 2023).
- Hagiwara, K.; Inui, T.; Koike, Y.; Aizawa, M.; Nakamura, T. Speciation of Inorganic Arsenic in Drinking Water by Wavelength-Dispersive X-ray Fluorescence Spectrometry after in situ Preconcentration with Miniature Solid-Phase Extraction Disks. Talanta 2015, 134, 739–744. [Google Scholar] [CrossRef]
- Cunha, S.C.; Fernandes, J.O. Assessment of Bisphenol A and Bisphenol B in Canned Vegetables and Fruits by Gas Chromatography–Mass Spectrometry after QuEChERS and Dispersive Liquid–Liquid Microextraction. Food Control 2013, 33, 549–555. [Google Scholar] [CrossRef]
- De Toni, L.; Tisato, F.; Seraglia, R.; Roverso, M.; Gandin, V.; Marzano, C.; Padrini, R.; Foresta, C. Phthalates and Heavy Metals as Endocrine Disruptors in Food: A Study on Pre-Packed Coffee Products. Toxicol. Rep. 2017, 4, 234–239. [Google Scholar] [CrossRef] [PubMed]
- Kyrila, G.; Katsoulas, A.; Schoretsaniti, V.; Rigopoulos, A.; Rizou, E.; Doulgeridou, S.; Sarli, V.; Samanidou, V.; Touraki, M. Bisphenol A Removal and Degradation Pathways in Microorganisms with Probiotic Properties. J. Hazard. Mater. 2021, 413, 125363. [Google Scholar] [CrossRef] [PubMed]
- Errico, S.; Bianco, M.; Mita, L.; Migliaccio, M.; Rossi, S.; Nicolucci, C.; Menale, C.; Portaccio, M.; Gallo, P.; Mita, D.G.; et al. Migration of Bisphenol A into Canned Tomatoes Produced in Italy: Dependence on Temperature and Storage Conditions. Food Chem. 2014, 160, 157–164. [Google Scholar] [CrossRef]
- Xu, J.; Zhao, C.; Wang, T.; Yang, S.; Liu, Z. Photo-Oxidation of Bisphenol A in Aqueous Solutions at Near Neutral PH by a Fe(III)-Carboxylate Complex with Oxalacetic Acid as a Benign Molecule. Molecules 2018, 23, 1319. [Google Scholar] [CrossRef] [PubMed]
- Environnement/Santé, Évaluation Préalable Finale Pour Le Défi Concernant Le Phénol, 4,4′-(1-Méthyléthylidène)Bis (Bisphénol-A),Numéro de Registre Du Chemical Abstracts Service 80-05-7la Loi Canadienne Sur La Protection de l’environnement (1999). 2008. Available online: https://www.ec.gc.ca/ese-ees/default.asp?lang=Fr&n=3C756383-1 (accessed on 5 July 2023).
- Rudel, R.A.; Melly, S.J.; Geno, P.W.; Sun, G.; Brody, J.G. Identification of Alkylphenols and Other Estrogenic Phenolic Compounds in Wastewater, Septage, and Groundwater on Cape Cod, Massachusetts. Environ. Sci. Technol. 1998, 32, 861–869. [Google Scholar] [CrossRef]
- El Cadi, M.A.; Bouslimane, Y.; El Jaoudi, R.; Bouklouze, A.; Cherrah, Y. Bisphénol A: À nouveau risque, nouveau défi! Med. Reprod. 2012, 14, 151–155. [Google Scholar]
- Brede, C.; Fjeldal, P.; Skjevrak, I.; Herikstad, H. Increased Migration Levels of Bisphenol A from Polycarbonate Baby Bottles after Dishwashing, Boiling and Brushing. Food Addit. Contam. 2003, 20, 684–689. [Google Scholar] [CrossRef]
- Calafat, A.M.; Kuklenyik, Z.; Reidy, J.A.; Caudill, S.P.; Ekong, J.; Needham, L.L. Urinary Concentrations of Bisphenol A and 4-Nonylphenol in a Human Reference Population. Environ. Health Perspect. 2005, 113, 391–395. [Google Scholar] [CrossRef]
- ARS Pollution Intérieure: Risques Sanitaires pour la Femme Enceinte et le Jeune Enfant. 2017. Available online: https://www.nouvelle-aquitaine.ars.sante.fr/media/9145 (accessed on 6 July 2023).
- Sajiki, J.; Yonekubo, J. Degradation of Bisphenol-A (BPA) in the Presence of Reactive Oxygen Species and Its Acceleration by Lipids and Sodium Chloride. Chemosphere 2002, 46, 345–354. [Google Scholar] [CrossRef]
- Yoshida, T.; Horie, M.; Hoshino, Y.; Nakazawa, H.; Horie, M.; Nakazawa, H. Determination of Bisphenol A in Canned Vegetables and Fruit by High Performance Liquid Chromatography. Food Addit. Contam. 2001, 18, 69–75. [Google Scholar] [CrossRef]
- Tian, K.; Yu, Y.; Qiu, Q.; Sun, X.; Meng, F.; Bi, Y.; Gu, J.; Wang, Y.; Zhang, F.; Huo, H. Mechanisms of BPA Degradation and Toxicity Resistance in Rhodococcus Equi. Microorganisms 2023, 11, 67. [Google Scholar] [CrossRef] [PubMed]
- Michałowicz, J. Bisphenol A—Sources, Toxicity and Biotransformation. Environ. Toxicol. Pharmacol. 2014, 37, 738–758. [Google Scholar] [CrossRef] [PubMed]
- Liu, S.-H.; Su, C.-C.; Lee, K.-I.; Chen, Y.-W. Effects of Bisphenol A Metabolite 4-Methyl-2,4-Bis(4-Hydroxyphenyl)Pent-1-Ene on Lung Function and Type 2 Pulmonary Alveolar Epithelial Cell Growth. Sci. Rep. 2016, 6, 39254. [Google Scholar] [CrossRef] [PubMed]
- Staples, C.A.; Dome, P.B.; Klecka, G.M.; Oblock, S.T.; Harris, L.R. A Review of the Environmental Fate, Effects, and Exposures of Bisphenol A. Chemosphere 1998, 36, 2149–2173. [Google Scholar] [CrossRef] [PubMed]
- West, R.J.; Goodwin, P.A.; Klecka, G.M. Assessment of the Ready Biodegradability of Bisphenol A. Bull. Environ. Contam. Toxicol. 2001, 67, 106–112. [Google Scholar] [CrossRef]
- Kang, J.-H.; Kondo, F. Bisphenol A Degradation by Bacteria Isolated from River Water. Arch. Environ. Contam. Toxicol. 2002, 43, 0265–0269. [Google Scholar] [CrossRef] [PubMed]
- INERIS Données Technico-Économiques sur les Substances Chimiques en France: Bisphénol A, INERIS-DRC-10-102861-01251B. 2010. Available online: https://substitution-bp.ineris.fr/fr/document/donnees-technico-economiques-substances-chimiques-en-france-bisphenol (accessed on 7 July 2023).
- Efsa Toxicokinetics of Bisphenol A—Scientific Opinion of the Panel on Food Additives, Flavourings, Processing Aids and Materials in Contact with Food (AFC)|EFSA. Available online: https://www.efsa.europa.eu/en/efsajournal/pub/759 (accessed on 21 November 2022).
- Sakai, K.; Yamanaka, H.; Moriyoshi, K.; Ohmoto, T.; Ohe, T. Biodegradation of Bisphenol A and Related Compounds by Sphingomonas sp. Strain BP-7 Isolated from Seawater. Biosci. Biotechnol. Biochem. 2007, 71, 51–57. [Google Scholar] [CrossRef]
- Yang, Y.; Wang, Z.; Xie, S. Aerobic Biodegradation of Bisphenol A in River Sediment and Associated Bacterial Community Change. Sci. Total Environ. 2014, 470–471, 1184–1188. [Google Scholar] [CrossRef]
- Chauveheid, E.; Chorfi, S.; Scholdis, S.; Paquet, M.-H. L’exposition au bisphenol-a et a certains derives chlores par l’eau potable chloree. In Proceedings of the Conférence JIE, Bruxelles, Belgique, 23–24 May 2016; Volume 11. [Google Scholar]
- Ouandaogo-Yameogo, S. Ressources En Eau Souterraine Du Centre Urbain de Ouagadougou Au Burkina Faso, Qualité et Vulnérabilité. These de Doctorat, Avignon. 2008. Available online: http://www.lha.univ-avignon.fr/Theses/Suzanne%20Yameogo/2008-11-28%20Suzanne%20YAMEOGO.pdf (accessed on 7 July 2023).
- Han, Q.; Wang, H.; Dong, W.; Liu, T.; Yin, Y.; Fan, H. Degradation of Bisphenol A by Ferrate(VI) Oxidation: Kinetics, Products and Toxicity Assessment. Chem. Eng. J. 2015, 262, 34–40. [Google Scholar] [CrossRef]
- Liao, C.; Kannan, K. A Survey of Bisphenol A and Other Bisphenol Analogues in Foodstuffs from Nine Cities in China. Food Addit. Contam. Part A 2014, 31, 319–329. [Google Scholar] [CrossRef]


| Sample Code | Roughness | Presence of Tongue |
|---|---|---|
| W1 | Smooth | Yes |
| W2 | Smooth | No |
| W3 | Rough | Yes |
| W4 | Smooth | Yes |
| W5 | Rough | No |
| W6 | Rough | No |
| W7 | Smooth | No |
| W8 | Smooth | No |
| W9 | Rough | No |
| W10 | Smooth | No |
| Sample Code | Parameters (mg/L) | Standard Results | Results P/F/X | ||
|---|---|---|---|---|---|
| Fe | Mn | Co | |||
| W1 | 33 | 38 | 2 | Oxo Biodegradable | Validated |
| W2 | 24 | 48 | 2 | Oxo Biodegradable | Validated |
| W3 | 52 | 16 | 3 | Oxo Biodegradable | Undetermined |
| W4 | 38 | 25 | 3 | Oxo Biodegradable | Validated |
| W5 | 58 | 12 | 2 | Oxo Biodegradable | Undetermined |
| W6 | 73 | 13 | 2 | Oxo Biodegradable | Undetermined |
| W7 | 81 | 17 | 2 | Oxo Biodegradable | Validated |
| W8 | 75 | 32 | 3 | Oxo Biodegradable | Validated |
| W9 | 45 | 47 | 4 | Oxo Biodegradable | Validated |
| W10 | 70 | 33 | 4 | Oxo Biodegradable | Validated |
| Concentrations of Spiked Solutions (mg/L) | Concentrations Detected by GC/MS (mg/L) | Recovery Rate (%) |
|---|---|---|
| 1.00 | 1.01 | 101 |
| 5.00 | 5.20 | 104 |
| 10.00 | 10.50 | 105 |
| Average rate | 103 | |
| Samples | W1 | W2 | W3 | W4 | W5 | W6 | W7 | W8 | W9 | W10 |
|---|---|---|---|---|---|---|---|---|---|---|
| Total germs at 37 °C (CFU/L) | 440 | 572 | 799 | 404 | 76 | 64 | 900 | 784 | 484 | 816 |
| Exposure Temperature | Chloride Concentration (mg/L) | |||||||||
|---|---|---|---|---|---|---|---|---|---|---|
| W1 | W2 | W3 | W4 | W5 | W6 | W7 | W8 | W9 | W10 | |
| 18 °C | 1.1 | 0.8 | 0.8 | 0.9 | 0.8 | 1.0 | 0.9 | 0.8 | 0.9 | 0.8 |
| 29 °C | 0.9 | 0.8 | 0.8 | 0.9 | 0.7 | 0.9 | 0.8 | 0.8 | 0.9 | 0.7 |
| 39 °C | 0.5 | 0.6 | 0.5 | 0.7 | 0.6 | 0.6 | 0.7 | 0.7 | 0.6 | 0.6 |
| Exposure Temperature | pH Value | |||||||||
|---|---|---|---|---|---|---|---|---|---|---|
| W1 | W2 | W3 | W4 | W5 | W6 | W7 | W8 | W9 | W10 | |
| 18 °C | 7.3 | 7.6 | 6.9 | 7.2 | 7.3 | 7.2 | 7.2 | 7.0 | 7.2 | 7.5 |
| 29 °C | 7.5 | 7.7 | 7.6 | 7.3 | 7.4 | 7.2 | 7.6 | 7.7 | 7.3 | 7.8 |
| 39 °C | 7.6 | 7.8 | 7.7 | 7.4 | 7.5 | 7.8 | 7.7 | 7.9 | 7.4 | 8.1 |
| Temperature | Cd Concentration (µg/L) * | Exposure Time | ||||||||||
|---|---|---|---|---|---|---|---|---|---|---|---|---|
| W1 | W2 | W3 | W4 | W5 | W6 | W7 | W8 | W9 | W10 | Average | ||
| 18 °C | <DL | <DL | <DL | <DL | <DL | <DL | <DL | <DL | <DL | <DL | <DL | 3 weeks |
| 29 °C | <DL | <DL | <DL | <DL | <DL | <DL | <DL | 0.9 | <DL | <DL | 0.1 | |
| 39 °C | 2.0 | 1.0 | 2.5 | <DL | <DL | <DL | <DL | 5.9 | <DL | <DL | 1.1 | |
| 18 °C | 1.0 | <DL | <DL | <DL | <DL | <DL | <DL | <DL | <DL | <DL | 0.1 | 6 weeks |
| 29 °C | 1.0 | <DL | <DL | <DL | <DL | 1.0 | 3.5 | 5.1 | <DL | 0.1 | 1.1 | |
| 39 °C | 2.0 | 2.5 | 6.9 | 1.0 | 9.7 | 2.0 | 6.6 | 6.2 | 1.1 | 7.2 | 5.9 | |
| Water Source | F1 | F2 | F3 | F4 | F5 | F6 | F7 | F8 | F9 | F10 |
|---|---|---|---|---|---|---|---|---|---|---|
| Iron concentration (mg/L) | 0.25 | 0.20 | 0.15 | 0.30 | 0.10 | 0.45 | 0.25 | 0.25 | 0.40 | 0.10 |
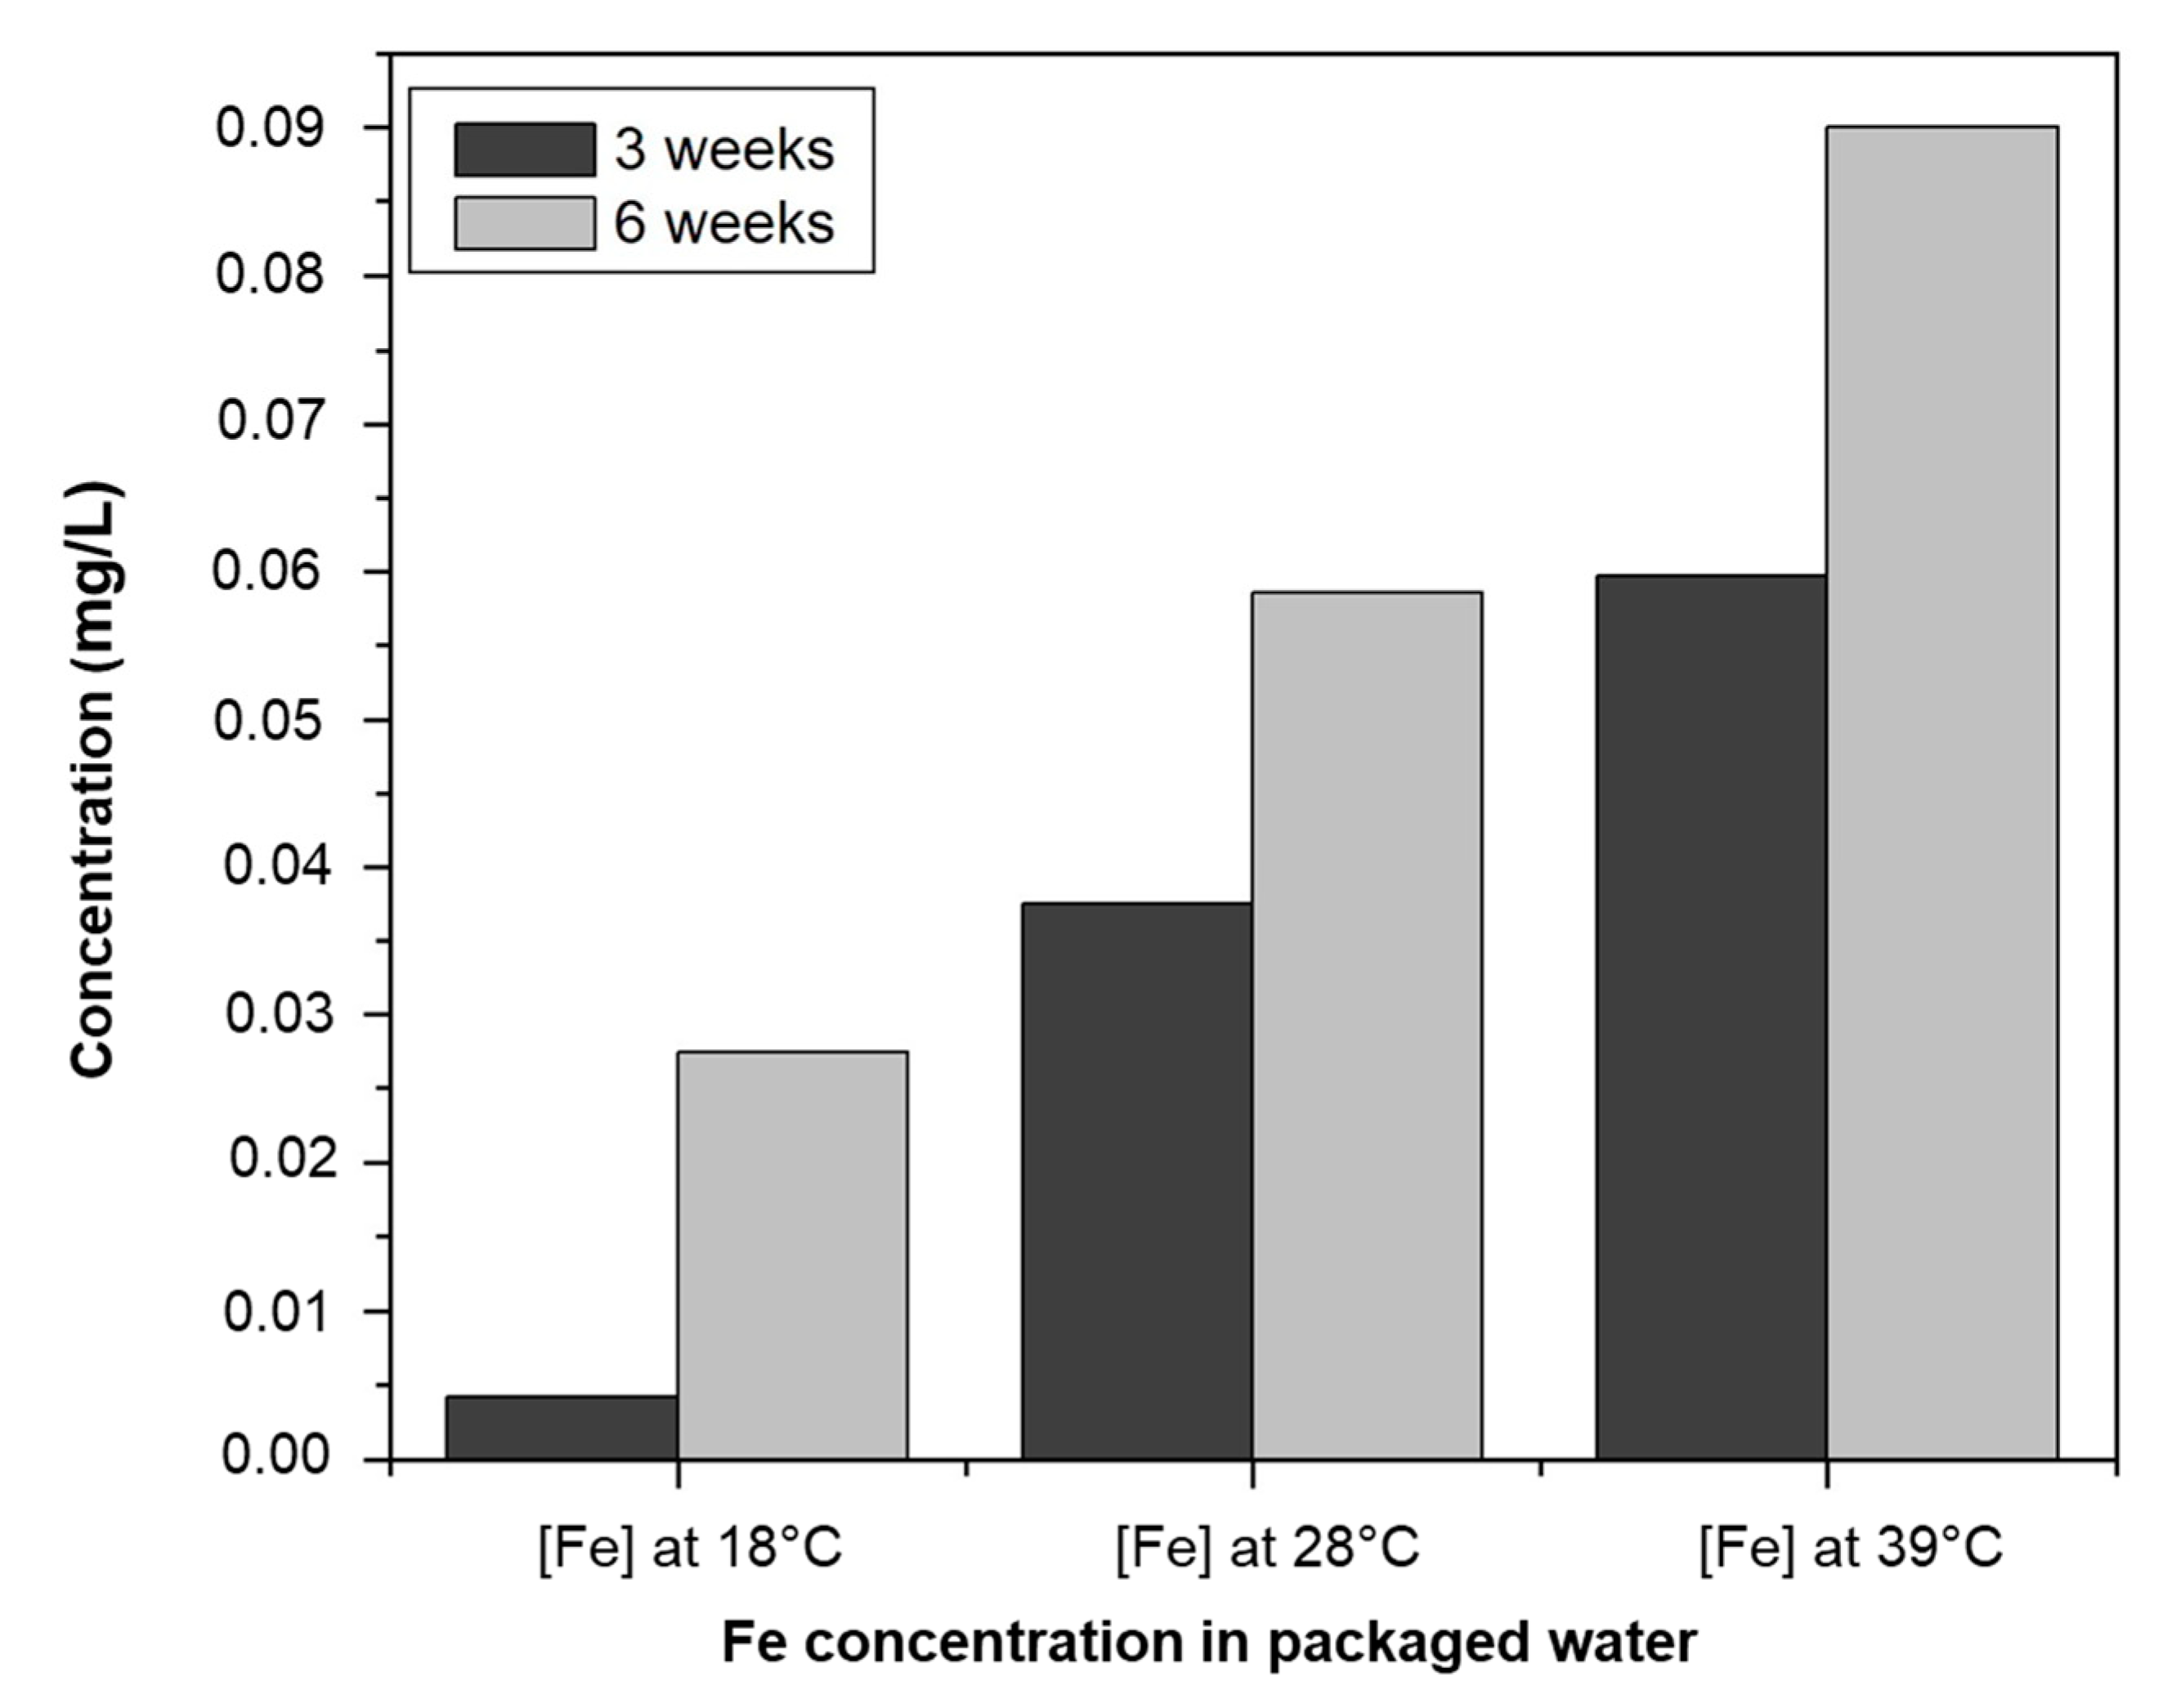
| Temperature | Fe Concentration (mg/L) | Exposure Time | ||||||||||
|---|---|---|---|---|---|---|---|---|---|---|---|---|
| W1 | W2 | W3 | W4 | W5 | W6 | W7 | W8 | W9 | W10 | Average | ||
| 18 °C | <DL | <DL | <DL | <DL | <DL | <DL | 0.015 | 0.017 | 0.001 | 0.009 | 0.004 | 3 weeks |
| 29 °C | 0.030 | 0.036 | 0.038 | 0.003 | 0.043 | 0.009 | 0.069 | 0.064 | 0.031 | 0.054 | 0.037 | |
| 39 °C | 0.052 | 0.039 | 0.054 | 0.003 | 0.082 | 0.095 | 0.069 | 0.081 | 0.067 | 0.054 | 0.059 | |
| 18 °C | 0.010 | 0012 | <DL | 0.008 | 0.036 | 0.032 | 0.059 | 0.039 | 0.044 | 0.034 | 0.027 | 6 weeks |
| 29 °C | 0.032 | 0.055 | 0.069 | 0.016 | 0.046 | 0.051 | 0.080 | 0.067 | 0.083 | 0.086 | 0.059 | |
| 39 °C | 0.076 | 0.054 | 0.081 | 0.100 | 0.132 | 0.098 | 0.086 | 0.084 | 0.088 | 0.102 | 0.090 | |
Disclaimer/Publisher’s Note: The statements, opinions and data contained in all publications are solely those of the individual author(s) and contributor(s) and not of MDPI and/or the editor(s). MDPI and/or the editor(s) disclaim responsibility for any injury to people or property resulting from any ideas, methods, instructions or products referred to in the content. |
© 2023 by the authors. Licensee MDPI, Basel, Switzerland. This article is an open access article distributed under the terms and conditions of the Creative Commons Attribution (CC BY) license (https://creativecommons.org/licenses/by/4.0/).
Share and Cite
Sawadogo, B.; Konaté, F.O.; Konaté, Y.; Traoré, O.; Sossou, S.K.; Sawadogo, E.; Sourabié Ouattara, P.B.; Karambiri, H. Transfer of Bisphenol A and Trace Metals from Plastic Packaging to Mineral Water in Ouagadougou, Burkina Faso. Int. J. Environ. Res. Public Health 2023, 20, 6908. https://doi.org/10.3390/ijerph20206908
Sawadogo B, Konaté FO, Konaté Y, Traoré O, Sossou SK, Sawadogo E, Sourabié Ouattara PB, Karambiri H. Transfer of Bisphenol A and Trace Metals from Plastic Packaging to Mineral Water in Ouagadougou, Burkina Faso. International Journal of Environmental Research and Public Health. 2023; 20(20):6908. https://doi.org/10.3390/ijerph20206908
Chicago/Turabian StyleSawadogo, Boukary, Francis Ousmane Konaté, Yacouba Konaté, Ousmane Traoré, Seyram Kossi Sossou, Eric Sawadogo, Pane Bernadette Sourabié Ouattara, and Harouna Karambiri. 2023. "Transfer of Bisphenol A and Trace Metals from Plastic Packaging to Mineral Water in Ouagadougou, Burkina Faso" International Journal of Environmental Research and Public Health 20, no. 20: 6908. https://doi.org/10.3390/ijerph20206908
APA StyleSawadogo, B., Konaté, F. O., Konaté, Y., Traoré, O., Sossou, S. K., Sawadogo, E., Sourabié Ouattara, P. B., & Karambiri, H. (2023). Transfer of Bisphenol A and Trace Metals from Plastic Packaging to Mineral Water in Ouagadougou, Burkina Faso. International Journal of Environmental Research and Public Health, 20(20), 6908. https://doi.org/10.3390/ijerph20206908