Two-Stage Multi-Objective Stochastic Model on Patient Transfer and Relief Distribution in Lockdown Area of COVID-19
Abstract
:1. Introduction
2. Literature Review
- (1)
- Many studies have considered victim transfer and relief distribution separately, but few studies have considered the coordination between the two operations.
- (2)
- Some studies of emergency management have considered humanitarian issues, but few studies have been able to obtain a real Pareto optimal solution set.
- (3)
- No study has considered the characteristics of epidemic diseases and the control measures in a multi-objective victim transfer and relief distribution problem.
3. Problem Definition and Formulation
- (1)
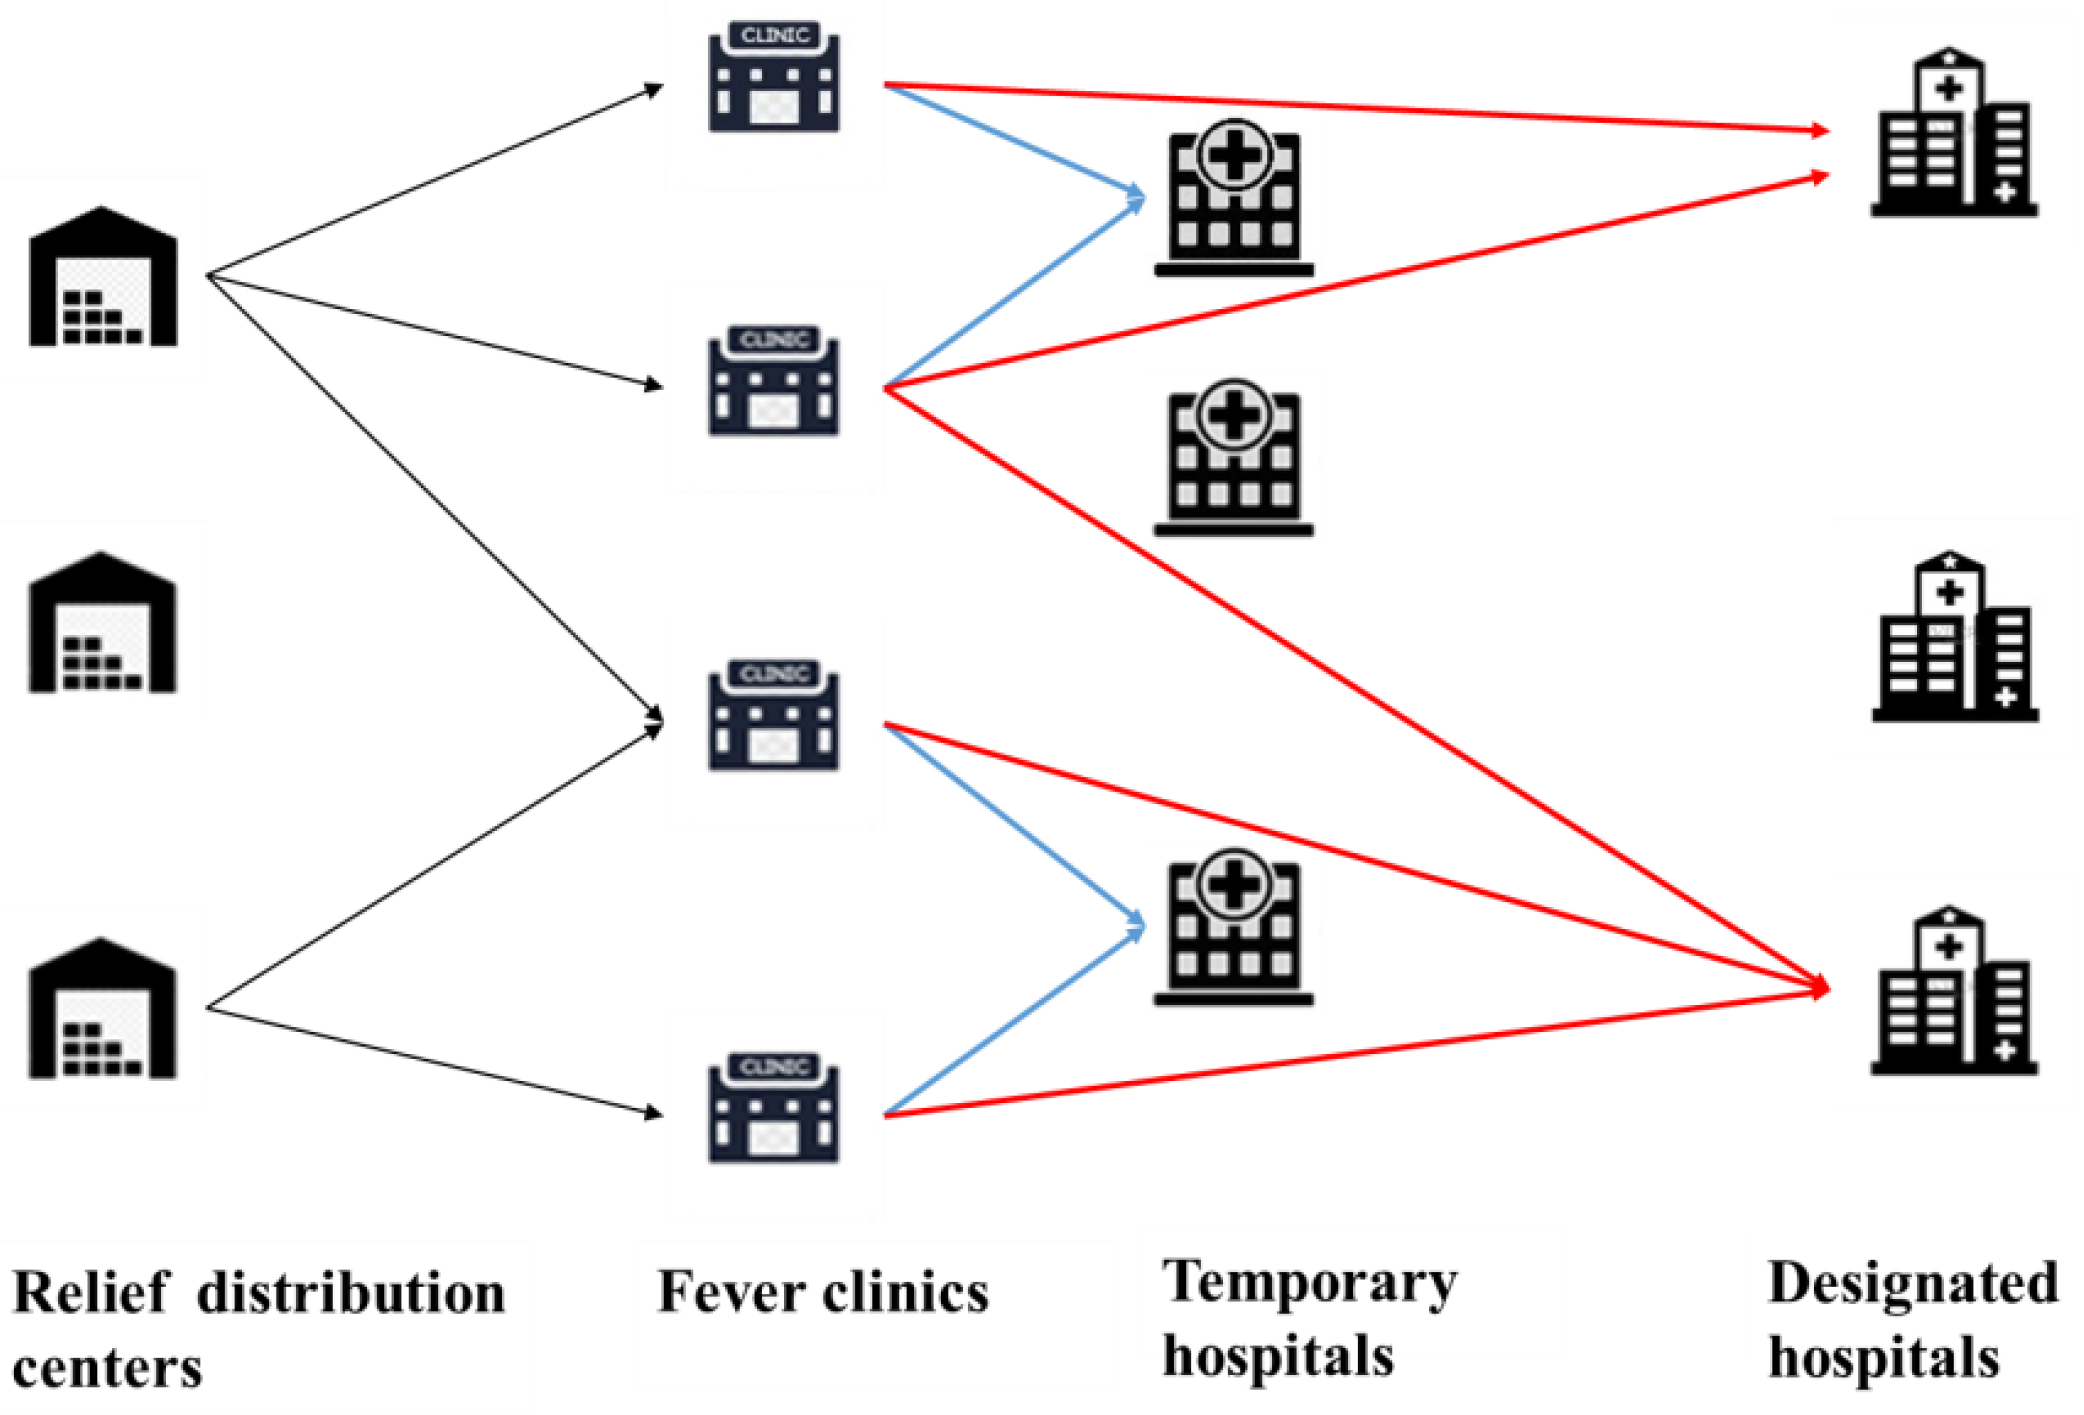
- Each community has a fever clinic, in which the general physicians in the community diagnose illnesses and transfer confirmed cases to the appropriate hospitals;
- (2)
- The confirmed cases consisting of the infected people and critical patients can be estimated by the modified SEIR model;
- (3)
- We assume that untransferred confirmed cases do not affect the forecast results, because only a small number of confirmed cases are not transferred in time and will be preferentially transferred in the next period;
- (4)
- The infected people need to be transferred to the THs and the critical patients need to be transferred to the DHs;
- (5)
- The fever clinics provide a set of medical and ancillary supplies (such as an N95 mask and an additional protective suit) for each infected patient and critical patient;
- (6)
- Each established TRDC can distribute relief supplies to each fever clinic using a vehicle with a homogeneous capacity.
3.1. Time-Varying Epidemic Prediction Model
3.2. Notation
| : | Set of scenarios, ; |
| : | Set of planning periods, ; |
| : | Set of TRDCs, ; |
| : | Set of fever clinics, ; |
| : | Set of THs, ; |
| : | Set of DHs, . |
| : | Probability of scenario s; |
| : | Transportation time from the node n to the node m; |
| : | Fixed cost of the TRDC i; |
| : | Fixed cost of the TH j; |
| : | Fixed cost of the DH h; |
| : | Holding cost of a relief supply; |
| : | Penalty cost of a unit of relief supply; |
| : | Transfer cost for the infected people from the fever clinic c to the TH j; |
| : | Transfer cost for a critical patient from the fever clinic c to the DT h; |
| : | Transport fees for one vehicle from the TRDC i to the fever clinic c; |
| : | Maximum capacity of the TRDC i; |
| : | Capacity of a vehicle to carry the relief supplies; |
| : | Maximum capacity of the TH j; |
| : | Maximum capacity of the DH h; |
| : | Number of infected people at the fever clinic c in scenario s; |
| : | Number of critical patients at the fever clinic c in scenario s; |
| : | Priority of satisfying the critical patient; |
| : | Confidence levels of the chance-constrained model; |
| : | A large positive number. |
| : | 1, if the TRDC i is established, 0 else; |
| : | 1, if the TH j is established under scenario s, 0 else; |
| : | 1, if the designated hospital h be established under scenario s, 0 else; |
| : | Amount of inventory at the TRDC i; |
| : | Number of relief supplies transported from the TRDC i to the fever clinic c in scenario s. |
3.3. Model Formulation
3.4. A Chance-Constrained Model for Patient Transfer and Relief Distribution
4. Solution Algorithm
4.1. ε-Constraint Algorithm
- Step 1:
- Calculate a payoff table
- Step 2:
- Set a
- Step 3:
- Step 4:
- Solve
- Step 5:
- Step 6:
- Return P and F
4.2. An Improved PICEA-g Algorithm
4.2.1. An Adaptive K-Nearest Neighborhood Method Based on a Novel Similarity Distance
- The similarity of the locations of emergency facilities
- 2
- The similarity between distribution planning and transfer planning
| Algorithm 1: Framework of the K-nearest neighborhood method |
| Input: solution S, neighborhood size K1 and K2 |
| 1. set the current neighborhood size Kc and K1; |
| 2.for; |
| 3. Find non-dominated solutions NS in S; |
| 4. Generate offspring solutions OS based on neighborhood size Kc; |
| 5. if |
| 6. Find non-dominated solutions NOS in OS; |
| 7. if |
| 8. ; |
| 9. else |
| 10. ; |
| 11. end if |
| 12. end if |
| 13. if |
| 14. ; |
| 15. else |
| 16. |
| 17. end if |
| 18.end for |
4.2.2. The PICEA-g-AKNN Algorithm
- 1
- We define a dominant individual if the solution dominates all of the neighborhoods. It is probable that the dominant individual is close to the Pareto front. Therefore, an SBX local search strategy is used to modify this individual. The SBX local search strategy not only enables the dominant individual to move close to the Pareto fronts but also does not cause a large disturbance for the outstanding individual. Let is the probability of executing SBX and the SBX is described as Equation (46).where is a randomly generated number in the range [0, 1]. Note that if , we assign that is equal to zero. If , then assign to , where is the offspring in the dimension, is a parent chromosome selected at random from the neighborhood, and is a random number generated as follows according to [58].where is a parameter that represents the degree of learning from the parent individual.
- 2
- A solution is defined as an exploring individual if it is not dominated by any neighborhood and there are other non-dominant individuals in the neighborhood. The exploring individual is likely to obtain useful information from the non-dominant individual in the neighborhood. We use a classic and robust DE operator named “DE/rand/1” to generate offspring. Because more parents can be referenced in the DE, children individuals can exchange excellent information with individuals in the neighborhood [59]:where is the children individual of , and and are randomly selected from the non-dominant individuals in the neighborhood. When there is only one non-dominant solution of in the neighborhood, the other parent individual is selected randomly from the other individuals in the neighborhood. is the mutation factor. We assign is equal to zero if , and assign to if .
- 3
- A solution is defined as a learning individual if it is dominated by individuals in the neighborhood. For the learning individual, it is necessary to try to learn from the outstanding individuals in the neighborhood. A directional search DE named “DE/current-to-dominance” has good global search ability and is used to generate offspring [60].where is an individual that dominates the current individual in the neighborhood, is another mutation factor, and and are randomly selected from the individuals that dominate . If only one solution dominates , the other parent individual can choose from the non-dominated solution of . We assign when it is equal to zero if , then assign to if .
5. Computational Examinations
5.1. Simulation of Forecasting Phase
5.2. Simulation of the Second Stage
5.3. Computational Performance Analysis
6. Conclusions
Author Contributions
Funding
Institutional Review Board Statement
Informed Consent Statement
Data Availability Statement
Acknowledgments
Conflicts of Interest
References
- Verity, R.; Okell, L.C.; Dorigatti, I.; Winskill, P.; Whittaker, C.; Imai, N.; Cuomo-Dannenburg, G.; Thompson, H.; Walker, P.G.; Fu, H. Estimates of the severity of coronavirus disease 2019: A model-based analysis. Lancet Infect. Dis. 2020, 20, 669–677. [Google Scholar] [CrossRef] [PubMed]
- Scalera, N.M.; Mossad, S.B.J.P.m. The first pandemic of the 21st century: Review of the 2009 pandemic variant influenza A (H1N1) virus. Postgrad. Med. 2009, 121, 43–47. [Google Scholar] [CrossRef] [PubMed]
- Chowell, G.; Nishiura, H. Transmission dynamics and control of Ebola virus disease (EVD): A review. BMC Med. 2014, 12, 196. [Google Scholar] [CrossRef] [PubMed] [Green Version]
- Büyüktahtakın, İ.E.; des-Bordes, E.; Kıbış, E.Y. A new epidemics–logistics model: Insights into controlling the Ebola virus disease in West Africa. Eur. J. Oper. Res. 2018, 265, 1046–1063. [Google Scholar] [CrossRef]
- Cozzolino, A. Humanitarian logistics and supply chain management. In Humanitarian Logistics; Springer: Berlin/Heidelberg, Germany, 2012; pp. 5–16. [Google Scholar]
- Duhamel, C.; Santos, A.C.; Brasil, D.; Châtelet, E.; Birregah, B. Connecting a population dynamic model with a multi-period location-allocation problem for post-disaster relief operations. Ann. Oper. Res. 2016, 247, 693–713. [Google Scholar] [CrossRef]
- Moreno, A.; Alem, D.; Ferreira, D. Heuristic approaches for the multiperiod location-transportation problem with reuse of vehicles in emergency logistics. Comput. Oper. Res. 2016, 69, 79–96. [Google Scholar] [CrossRef]
- Vahdani, B.; Veysmoradi, D.; Shekari, N.; Mousavi, S.M. Multi-objective, multi-period location-routing model to distribute relief after earthquake by considering emergency roadway repair. Neural Comput. Appl. 2018, 30, 835–854. [Google Scholar] [CrossRef]
- Ghasemi, P.; Khalili-Damghani, K.; Hafezalkotob, A.; Raissi, S. Uncertain multi-objective multi-commodity multi-period multi-vehicle location-allocation model for earthquake evacuation planning. Appl. Math. Comput. 2019, 350, 105–132. [Google Scholar] [CrossRef]
- Elçi, Ö.; Noyan, N. A chance-constrained two-stage stochastic programming model for humanitarian relief network design. Transp. Res. Part B Methodol. 2018, 108, 55–83. [Google Scholar] [CrossRef]
- Banomyong, R.; Varadejsatitwong, P.; Oloruntoba, R. A systematic review of humanitarian operations, humanitarian logistics and humanitarian supply chain performance literature 2005 to 2016. Ann. Oper. Res. 2019, 283, 71–86. [Google Scholar] [CrossRef]
- Grass, E.; Fischer, K.; Science, M. Two-stage stochastic programming in disaster management: A literature survey. Surv. Oper. Res. 2016, 21, 85–100. [Google Scholar] [CrossRef]
- Ahmadi, M.; Seifi, A.; Tootooni, B. A humanitarian logistics model for disaster relief operation considering network failure and standard relief time: A case study on San Francisco district. Transp. Res. Part E Logist. Transp. Rev. 2015, 75, 145–163. [Google Scholar] [CrossRef]
- Oksuz, M.K.; Satoglu, S.I. A two-stage stochastic model for location planning of temporary medical centers for disaster response. Int. J. Disaster Risk Reduct. 2020, 44, 101426. [Google Scholar] [CrossRef]
- Vahdani, B.; Veysmoradi, D.; Noori, F.; Mansour, F. Two-stage multi-objective location-routing-inventory model for humanitarian logistics network design under uncertainty. Int. J. Disaster Risk Reduct. 2018, 27, 290–306. [Google Scholar] [CrossRef]
- Zhang, J.; Liu, H.; Yu, G.; Ruan, J.; Chan, F.T. A three-stage and multi-objective stochastic programming model to improve the sustainable rescue ability by considering secondary disasters in emergency logistics. Comput. Ind. Eng. 2019, 135, 1145–1154. [Google Scholar] [CrossRef]
- Doodman, M.; Shokr, I.; Bozorgi-Amiri, A.; Jolai, F. Pre-positioning and dynamic operations planning in pre-and post-disaster phases with lateral transhipment under uncertainty and disruption. J. Ind. Eng. Int. 2019, 15, 53–68. [Google Scholar] [CrossRef] [Green Version]
- Saadatseresht, M.; Mansourian, A.; Taleai, M. Evacuation planning using multiobjective evolutionary optimization approach. Eur. J. Oper. Res. 2009, 198, 305–314. [Google Scholar] [CrossRef]
- Coutinho-Rodrigues, J.; Tralhão, L.; Alçada-Almeida, L. Solving a location-routing problem with a multiobjective approach: The design of urban evacuation plans. J. Transp. Geogr. 2012, 22, 206–218. [Google Scholar] [CrossRef]
- Goodarzian, F.; Taleizadeh, A.A.; Ghasemi, P.; Abraham, A. An integrated sustainable medical supply chain network during COVID-19. Eng. Appl. Artif. Intell. 2021, 100, 104188. [Google Scholar] [CrossRef] [PubMed]
- Mansoori, S.; Bozorgi-Amiri, A.; Pishvaee, M.S. A robust multi-objective humanitarian relief chain network design for earthquake response, with evacuation assumption under uncertainties. Neural Comput. Appl. 2020, 32, 2183–2203. [Google Scholar] [CrossRef]
- Flores, I.; Ortuño, M.T.; Tirado, G.; Vitoriano, B. Supported evacuation for disaster relief through lexicographic goal programming. Mathematics 2020, 8, 648. [Google Scholar] [CrossRef] [Green Version]
- Goerigk, M.; Grün, B.J.O.S. A robust bus evacuation model with delayed scenario information. Or Spectr. 2014, 36, 923–948. [Google Scholar] [CrossRef]
- Lim, G.J.; Zangeneh, S.; Baharnemati, M.R.; Assavapokee, T. A capacitated network flow optimization approach for short notice evacuation planning. Eur. J. Oper. Res. 2012, 223, 234–245. [Google Scholar] [CrossRef]
- Shahparvari, S.; Abbasi, B. Robust stochastic vehicle routing and scheduling for bushfire emergency evacuation: An Australian case study. Transp. Res. Part A Policy Pract. 2017, 104, 32–49. [Google Scholar] [CrossRef]
- Shahparvari, S.; Abbasi, B.; Chhetri, P.; Abareshi, A. Fleet routing and scheduling in bushfire emergency evacuation: A regional case study of the Black Saturday bushfires in Australia. Transp. Res. Part D Transp. Environ. 2019, 67, 703–722. [Google Scholar] [CrossRef]
- Bayram, V.; Yaman, H. Shelter location and evacuation route assignment under uncertainty: A benders decomposition approach. Transp. Sci. 2018, 52, 416–436. [Google Scholar] [CrossRef]
- Liang, B.; Yang, D.; Qin, X.; Tinta, T. A risk-averse shelter location and evacuation routing assignment problem in an uncertain environment. Int. J. Environ. Res. Public Health 2019, 16, 4007. [Google Scholar] [CrossRef] [Green Version]
- Sheu, J.-B.; Pan, C. A method for designing centralized emergency supply network to respond to large-scale natural disasters. Transp. Res. Part B Methodol. 2014, 67, 284–305. [Google Scholar] [CrossRef]
- Sabouhi, F.; Bozorgi-Amiri, A.; Moshref-Javadi, M.; Heydari, M. An integrated routing and scheduling model for evacuation and commodity distribution in large-scale disaster relief operations: A case study. Ann. Oper. Res. 2019, 283, 643–677. [Google Scholar] [CrossRef]
- Setiawan, E.; Liu, J.; French, A. Resource location for relief distribution and victim evacuation after a sudden-onset disaster. IISE Trans. 2019, 51, 830–846. [Google Scholar] [CrossRef]
- Dasaklis, T.K.; Pappis, C.P.; Rachaniotis, N.P. Epidemics control and logistics operations: A review. Int. J. Prod. Econ. 2012, 139, 393–410. [Google Scholar] [CrossRef]
- Bozorgi-Amiri, A.; Khorsi, M. A dynamic multi-objective location–routing model for relief logistic planning under uncertainty on demand, travel time, and cost parameters. Int. J. Adv. Manuf. Technol. 2016, 85, 1633–1648. [Google Scholar] [CrossRef]
- Caunhye, A.M.; Nie, X.; Pokharel, S. Optimization models in emergency logistics: A literature review. Socio-Econ. Plan. Sci. 2012, 46, 4–13. [Google Scholar] [CrossRef]
- Fereiduni, M.; Shahanaghi, K. A robust optimization model for distribution and evacuation in the disaster response phase. J. Ind. Eng. Int. 2017, 13, 117–141. [Google Scholar] [CrossRef] [Green Version]
- Vahdani, B.; Veysmoradi, D.; Mousavi, S.; Amiri, M. Planning for relief distribution, victim evacuation, redistricting and service sharing under uncertainty. Socio-Econ. Plan. Sci. 2022, 80, 101158. [Google Scholar] [CrossRef]
- Wang, J.; Shen, D.; Yu, M. Multiobjective optimization on hierarchical refugee evacuation and resource allocation for disaster management. Math. Probl. Eng. 2020, 2020, 8395714. [Google Scholar] [CrossRef]
- Ghasemi, P.; Khalili-Damghani, K.; Hafezalkotob, A.; Raissi, S. Stochastic optimization model for distribution and evacuation planning (A case study of Tehran earthquake). Socio-Econ. Plan. Sci. 2020, 71, 100745. [Google Scholar] [CrossRef]
- Mohammadi, S.; Darestani, S.A.; Vahdani, B.; Alinezhad, A. A robust neutrosophic fuzzy-based approach to integrate reliable facility location and routing decisions for disaster relief under fairness and aftershocks concerns. Comput. Ind. Eng. 2020, 148, 106734. [Google Scholar] [CrossRef]
- Deb, K.; Pratap, A.; Agarwal, S.; Meyarivan, T. A fast and elitist multiobjective genetic algorithm: NSGA-II. IEEE Trans. Evol. Comput. 2002, 6, 182–197. [Google Scholar] [CrossRef] [Green Version]
- Mostaghim, S.; Teich, J. Strategies for finding good local guides in multi-objective particle swarm optimization (MOPSO). In Proceedings of the 2003 IEEE Swarm Intelligence Symposium. SIS’03 (Cat. No. 03EX706), Indianapolis, IN, USA, 26–26 April 2003; pp. 26–33. [Google Scholar]
- Ishibuchi, H.; Tsukamoto, N.; Nojima, Y. Behavior of evolutionary many-objective optimization. In Proceedings of the Tenth International Conference on Computer Modeling and Simulation (uksim 2008), Cambridge, UK, 1–3 April 2008; pp. 266–271. [Google Scholar]
- Liu, H.-L.; Chen, L.; Zhang, Q.; Deb, K. An evolutionary many-objective optimisation algorithm with adaptive region decomposition. In Proceedings of the 2016 IEEE Congress on Evolutionary Computation (CEC), Vancouver, BC, Canada, 24–29 July 2016; pp. 4763–4769. [Google Scholar]
- Bader, J.; Zitzler, E. HypE: An algorithm for fast hypervolume-based many-objective optimization. Evol. Comput. 2011, 19, 45–76. [Google Scholar] [CrossRef]
- Purshouse, R.C.; Jalbă, C.; Fleming, P.J. Preference-driven co-evolutionary algorithms show promise for many-objective optimisation. In Proceedings of the International Conference on Evolutionary Multi-Criterion Optimization, Ouro Preto, Brazil, 5–8 April 2011; pp. 136–150. [Google Scholar]
- Wang, R.; Fleming, P.J.; Purshouse, R.C. General framework for localised multi-objective evolutionary algorithms. Inf. Sci. 2014, 258, 29–53. [Google Scholar] [CrossRef]
- Wang, R.; Purshouse, R.C.; Fleming, P.J. Preference-inspired coevolutionary algorithms for many-objective optimization. IEEE Trans. Evol. Comput. 2012, 17, 474–494. [Google Scholar] [CrossRef]
- Liu, M.; Zhang, D. A dynamic logistics model for medical resources allocation in an epidemic control with demand forecast updating. J. Oper. Res. Soc. 2016, 67, 841–852. [Google Scholar] [CrossRef]
- Mishra, B.K.; Saini, D.K. SEIRS epidemic model with delay for transmission of malicious objects in computer network. Appl. Math. Comput. 2007, 188, 1476–1482. [Google Scholar] [CrossRef]
- Cao, S.; Feng, P.; Shi, P. Study on the epidemic development of COVID-19 in Hubei province by a modified SEIR model. J. Zhejiang Univ. 2020, 49, 178–184. [Google Scholar]
- Charnes, A.; Cooper, W.W. Chance-constrained programming. Manag. Sci. 1959, 6, 73–79. [Google Scholar] [CrossRef]
- Ghomi-Avili, M.; Naeini, S.G.J.; Tavakkoli-Moghaddam, R.; Jabbarzadeh, A. A fuzzy pricing model for a green competitive closed-loop supply chain network design in the presence of disruptions. J. Clean. Prod. 2018, 188, 425–442. [Google Scholar] [CrossRef]
- Tang, M.; Ji, B.; Fang, X.; Yu, S.S. Discretization-Strategy-Based Solution for Berth Allocation and Quay Crane Assignment Problem. J. Mar. Sci. Eng. 2022, 10, 495. [Google Scholar] [CrossRef]
- Zhang, S.X.; Zheng, L.M.; Liu, L.; Zheng, S.Y.; Pan, Y.M. Decomposition-based multi-objective evolutionary algorithm with mating neighborhood sizes and reproduction operators adaptation. Soft Comput. 2017, 21, 6381–6392. [Google Scholar] [CrossRef]
- Guo, W.; Liu, T.; Dai, F.; Xu, P. An improved whale optimization algorithm for feature selection. Comput. Mater. Contin. 2020, 62, 337–354. [Google Scholar] [CrossRef]
- Epitropakis, M.G.; Plagianakos, V.P.; Vrahatis, M.N. Finding multiple global optima exploiting differential evolution’s niching capability. In Proceedings of the 2011 IEEE Symposium on Differential Evolution (SDE), Paris, France, 11–15 April 2011; pp. 1–8. [Google Scholar]
- Zhang, Y.-H.; Gong, Y.-J.; Gao, Y.; Wang, H.; Zhang, J. Parameter-free voronoi neighborhood for evolutionary multimodal optimization. IEEE Trans. Evol. Comput. 2019, 24, 335–349. [Google Scholar] [CrossRef]
- Deb, K.; Beyer, H.-G. Self-adaptive genetic algorithms with simulated binary crossover. Evol. Comput. 2001, 9, 197–221. [Google Scholar] [CrossRef] [PubMed]
- Storn, R.; Price, K. Differential evolution—A simple and efficient heuristic for global optimization over continuous spaces. J. Glob. Optim. 1997, 11, 341–359. [Google Scholar] [CrossRef]
- Qin, A.K.; Huang, V.L.; Suganthan, P.N. Differential evolution algorithm with strategy adaptation for global numerical optimization. IEEE Trans. Evol. Comput. 2008, 13, 398–417. [Google Scholar] [CrossRef]
- Lei, H.; Wang, R.; Laporte, G.J.C.; Research, O. Solving a multi-objective dynamic stochastic districting and routing problem with a co-evolutionary algorithm. Comput. Oper. Res. 2016, 67, 12–24. [Google Scholar] [CrossRef]





| Parameters | r | β | q | α | δI | δq | γI | γH |
|---|---|---|---|---|---|---|---|---|
| 2 | 0.045 | 1.0 × 10⁻⁶ | 2.7 × 10⁻⁴ | 0.13 | 0.13 | 0.007 | 0.014 |
| Affected Areas | 1 | 2 | 3 | 4 | 5 | 6 | 7 | 8 | 9 | 10 |
|---|---|---|---|---|---|---|---|---|---|---|
| N | 150,005 | 113,553 | 175,424 | 226,502 | 200,740 | 164,807 | 187,551 | 159,922 | 210,337 | 209,542 |
| E(0) | 125 | 131 | 320 | 225 | 477 | 205 | 320 | 103 | 98 | 155 |
| I(0) | 5 | 3 | 9 | 8 | 5 | 7 | 9 | 4 | 7 | 3 |
| R(0) | 37 | 41 | 33 | 36 | 40 | 23 | 35 | 20 | 15 | 32 |
| H(0) | 1 | 3 | 5 | 4 | 2 | 5 | 2 | 3 | 0 | 1 |
| SI(0) | 219 | 178 | 409 | 291 | 611 | 321 | 400 | 184 | 129 | 233 |
| EI(0) | 139 | 171 | 230 | 180 | 320 | 189 | 306 | 99 | 102 | 174 |
| dI(t)/dH(t) | Period | ||||||
|---|---|---|---|---|---|---|---|
| Scenario | 1 | 2 | 3 | 4 | 5 | 6 | 7 |
| 1 | 15/4 | 28/8 | 38/11 | 46/13 | 51/15 | 55/16 | 57/17 |
| 2 | 15/5 | 31/10 | 45/14 | 56/18 | 64/21 | 70/23 | 77/25 |
| 3 | 15/4 | 30/9 | 43/13 | 54/16 | 61/18 | 67/19 | 70/20 |
| 4 | 25/7 | 47/14 | 65/18 | 78/22 | 88/25 | 94/27 | 98/29 |
| Fever Clinic | |||||||||||
|---|---|---|---|---|---|---|---|---|---|---|---|
| 1 | 2 | 3 | 4 | 5 | 6 | 7 | 8 | 9 | 10 | ||
| TRDC | 1 | 5/1.2 | 5/1.1 | 6/2.0 | 7/1.6 | 3/1.1 | 6/1.5 | 4/2.2 | 7/3.0 | 9/2.5 | 4/1.3 |
| 2 | 7/2.0 | 4/2.2 | 5/2.3 | 3/1.5 | 2/1.0 | 5/1.3 | 5/1.3 | 6/1.5 | 4/1.8 | 6/2.4 | |
| 3 | 4/1.5 | 5/1.7 | 3/1.0 | 5/1.5 | 6/2.0 | 3/1.1 | 7/2.6 | 4/1.6 | 6/1.7 | 7/1.9 | |
| TH | 1 | 6/1.6 | 7/1.9 | 5/1.5 | 4/1.7 | 6/2.4 | 5/2.2 | 8/2.5 | 3/1.0 | 5/1.1 | 7/1.4 |
| 2 | 7/2.3 | 6/2.2 | 6/3.0 | 3/1.2 | 4/1.2 | 6/1.8 | 5/2.0 | 7/2.0 | 5/1.5 | 6/1.4 | |
| 3 | 5/1.5 | 8/2.0 | 7/2.2 | 8/2.7 | 4/2.0 | 6/1.8 | 7/2.1 | 5/1.8 | 9/2.9 | 7/3.0 | |
| DH | 1 | 5/1.2 | 6/2.0 | 3/1.4 | 6/1.8 | 4/1.1 | 7/1.5 | 5/1.1 | 8/2.4 | 3/1.1 | 8/2.0 |
| 2 | 7/1.9 | 5/1.5 | 7/2.6 | 6/2.5 | 5/1.4 | 8/2.0 | 8/3.2 | 6/1.5 | 3/2.0 | 7/2.3 | |
| 3 | 5/2.4 | 6/2.1 | 4/1.5 | 6/1.9 | 7/2.0 | 3/1.1 | 6/1.6 | 9/2.0 | 5/1.8 | 4/1.1 | |
| Capacity | Fixed Cost | ||
|---|---|---|---|
| TH | 1 | 2000 | 30,000 |
| 2 | 3000 | 40,000 | |
| 3 | 3000 | 44,000 | |
| DH | 1 | 900 | 30,000 |
| 2 | 1000 | 50,000 | |
| 3 | 800 | 40,000 |
| Fixed Cost | Variable Cost | ||
|---|---|---|---|
| TRDC | 1 | 30,000 | 1.2 |
| 2 | 25,000 | 1.5 | |
| 3 | 20,000 | 1.7 |
| Scenario | TRDC | Fever Clinic | |||||||||
|---|---|---|---|---|---|---|---|---|---|---|---|
| 1 | 2 | 3 | 4 | 5 | 6 | 7 | 8 | 9 | 10 | ||
| 1 | 1 | 336 | 29 | 15 | 837 | 460 | |||||
| 2 | 35 | 456 | 652 | 521 | 931 | 513 | 279 | 274 | |||
| 3 | |||||||||||
| 2 | 1 | 263 | 51 | 46 | 18 | 69 | 41 | 713 | 57 | 26 | 393 |
| 2 | 160 | 380 | 630 | 527 | 820 | 495 | 67 | 252 | 259 | 71 | |
| 3 | |||||||||||
| 3 | 1 | 347 | 36 | 77 | 32 | 72 | 620 | 38 | 409 | ||
| 2 | 56 | 390 | 710 | 499 | 861 | 441 | 181 | 237 | 260 | 24 | |
| 3 | |||||||||||
| 4 | 1 | 403 | 17 | 21 | 114 | 666 | 94 | 19 | 393 | ||
| 2 | 102 | 389 | 766 | 559 | 828 | 417 | 58 | 192 | 258 | 83 | |
| 3 | |||||||||||
| Scenario | TH | Fever Clinic | |||||||||
|---|---|---|---|---|---|---|---|---|---|---|---|
| 1 | 2 | 3 | 4 | 5 | 6 | 7 | 8 | 9 | 10 | ||
| 1 | 1 | 311 | 377 | 559 | 240 | 234 | 382 | ||||
| 2 | 433 | 760 | 441 | 469 | |||||||
| 3 | |||||||||||
| 2 | 1 | 382 | 398 | 594 | 288 | 263 | |||||
| 2 | 507 | 829 | 496 | 719 | 429 | ||||||
| 3 | |||||||||||
| 3 | 1 | 362 | 390 | 756 | 248 | 244 | |||||
| 2 | 470 | 791 | 478 | 714 | 394 | ||||||
| 3 | |||||||||||
| 4 | 1 | 418 | 781 | 295 | 274 | ||||||
| 2 | 541 | 866 | 266 | 752 | 435 | ||||||
| 3 | 523 | 283 | |||||||||
| Scenario | DH | Fever Clinic | |||||||||
|---|---|---|---|---|---|---|---|---|---|---|---|
| 1 | 2 | 3 | 4 | 5 | 6 | 7 | 8 | 9 | 10 | ||
| 1 | 1 | 98 | 80 | 167 | 44 | 229 | 207 | 75 | |||
| 2 | |||||||||||
| 3 | 38 | 4 | 91 | 138 | 76 | 119 | |||||
| 2 | 1 | 134 | 212 | 251 | 221 | 82 | |||||
| 2 | |||||||||||
| 3 | 125 | 19 | 155 | 155 | 88 | 134 | |||||
| 3 | 1 | 115 | 12 | 182 | 54 | 240 | 218 | 79 | |||
| 2 | |||||||||||
| 3 | 112 | 90 | 147 | 79 | 124 | ||||||
| 4 | 1 | 161 | 165 | 262 | 227 | 85 | |||||
| 2 | 131 | 90 | |||||||||
| 3 | 73 | 195 | 168 | 135 | |||||||
| Instance | |I| | |C| | |J| | |H| | |T| | |S| |
|---|---|---|---|---|---|---|
| T-4-20-4-4-7-4 | 4 | 20 | 4 | 4 | 7 | 4 |
| T-4-20-4-4-7-8 | 4 | 20 | 4 | 4 | 7 | 8 |
| T-4-20-4-4-7-12 | 4 | 20 | 4 | 4 | 7 | 12 |
| T-4-20-4-4-14-4 | 4 | 20 | 4 | 4 | 14 | 4 |
| T-5-20-4-4-14-8 | 4 | 20 | 4 | 4 | 14 | 8 |
| T-5-20-4-4-14-12 | 4 | 20 | 4 | 4 | 14 | 12 |
| T-5-30-5-5-7-4 | 5 | 30 | 5 | 5 | 7 | 4 |
| T-5-30-5-5-7-8 | 5 | 30 | 5 | 5 | 7 | 8 |
| T-5-30-5-5-7-12 | 5 | 30 | 5 | 5 | 7 | 12 |
| T-5-30-5-5-14-4 | 5 | 30 | 5 | 5 | 14 | 4 |
| T-5-30-5-5-14-8 | 5 | 30 | 5 | 5 | 14 | 8 |
| T-5-30-5-5-14-12 | 5 | 30 | 5 | 5 | 14 | 12 |
| T-8-50-8-8-7-4 | 8 | 50 | 8 | 8 | 7 | 4 |
| T-8-50-8-8-7-8 | 8 | 50 | 8 | 8 | 7 | 8 |
| T-8-50-8-8-7-12 | 8 | 50 | 8 | 8 | 7 | 12 |
| T-8-50-8-8-14-4 | 8 | 50 | 8 | 8 | 14 | 4 |
| T-8-50-8-8-14-8 | 8 | 50 | 8 | 8 | 14 | 8 |
| T-8-50-8-8-14-12 | 8 | 50 | 8 | 8 | 14 | 12 |
| Initial Values | N | E(0) | I(0) | R(0) | H(0) | Sq(0) | Eq(0) |
|---|---|---|---|---|---|---|---|
| [15,000~30,000] | [100~200] | [0~10] | [0~10] | [0~10] | [100~200] | [100~200] |
| Parameters | PICEA-g-ANK | PICEA-g | MOEA/D | NSGA-II |
|---|---|---|---|---|
| Maximum generations maxGen Population size N Number of goal vectors Ng Probability pc Probability pm | 5000 100 100 0.8 0.2 | 5000 100 100 0.8 0.2 | 5000 100 - 0.8 0.2 | 5000 100 - 0.8 0.2 |
| Neighborhood size T | N/20-N/5 | - | 20 | - |
| Instance | ||||||
|---|---|---|---|---|---|---|
| T-4-20-4-4-7-4 | 0.213 | 0.253 | 0.202 | 0.183 | 0.212 | 0.013 |
| T-4-20-4-4-7-8 | 0.266 | 0.135 | 0.214 | 0.288 | 0.302 | 0.044 |
| T-4-20-4-4-7-12 | 0.184 | 0.117 | 0.25 | 0 | 0.360 | 0.161 |
| T-4-20-4-4-14-4 | 0.20 | 0.304 | 0.202 | 0.104 | 0.105 | 0.255 |
| T-5-20-4-4-14-8 | 0.496 | 0.121 | 0.24 | 0.166 | 0.406 | 0 |
| T-5-20-4-4-14-12 | 0.211 | 0.058 | 0.057 | 0.204 | 0.237 | 0.187 |
| T-5-30-5-5-7-4 | 0.419 | 0.013 | 0.358 | 0.072 | 0.023 | 0.303 |
| T-5-30-5-5-7-8 | 0.168 | 0.263 | 0.072 | 0.227 | 0.042 | 0.164 |
| T-5-30-5-5-7-12 | 0.283 | 0.105 | 0.299 | 0.056 | 0.183 | 0.133 |
| T-5-30-5-5-14-4 | 0.218 | 0.152 | 0.195 | 0.012 | 0.153 | 0.389 |
| T-5-30-5-5-14-8 | 0.285 | 0.151 | 0.158 | 0.221 | 0.248 | 0.242 |
| T-5-30-5-5-14-12 | 0.480 | 0 | 0.184 | 0.118 | 0.223 | 0.294 |
| T-8-50-8-8-7-4 | 0.515 | 0.124 | 0.231 | 0.132 | 0.171 | 0.40 |
| T-8-50-8-8-7-8 | 0.317 | 0.15 | 0.147 | 0.294 | 0.297 | 0.145 |
| T-8-50-8-8-7-12 | 0.275 | 0.164 | 0 | 0.412 | 0.194 | 0.290 |
| T-8-50-8-8-14-4 | 0.360 | 0.218 | 0.159 | 0.113 | 0.315 | 0.047 |
| T-8-50-8-8-14-8 | 0.581 | 0 | 0.125 | 0.177 | 0.307 | 0.031 |
| T-8-50-8-8-14-12 | 0.338 | 0.081 | 0.149 | 0.033 | 0.238 | 0.155 |
| Average | 0.3629 | 0.1506 | 0.2026 | 0.1758 | 0.2510 | 0.2031 |
Disclaimer/Publisher’s Note: The statements, opinions and data contained in all publications are solely those of the individual author(s) and contributor(s) and not of MDPI and/or the editor(s). MDPI and/or the editor(s) disclaim responsibility for any injury to people or property resulting from any ideas, methods, instructions or products referred to in the content. |
© 2023 by the authors. Licensee MDPI, Basel, Switzerland. This article is an open access article distributed under the terms and conditions of the Creative Commons Attribution (CC BY) license (https://creativecommons.org/licenses/by/4.0/).
Share and Cite
Long, S.; Zhang, D.; Li, S.; Li, S. Two-Stage Multi-Objective Stochastic Model on Patient Transfer and Relief Distribution in Lockdown Area of COVID-19. Int. J. Environ. Res. Public Health 2023, 20, 1765. https://doi.org/10.3390/ijerph20031765
Long S, Zhang D, Li S, Li S. Two-Stage Multi-Objective Stochastic Model on Patient Transfer and Relief Distribution in Lockdown Area of COVID-19. International Journal of Environmental Research and Public Health. 2023; 20(3):1765. https://doi.org/10.3390/ijerph20031765
Chicago/Turabian StyleLong, Shengjie, Dezhi Zhang, Shuangyan Li, and Shuanglin Li. 2023. "Two-Stage Multi-Objective Stochastic Model on Patient Transfer and Relief Distribution in Lockdown Area of COVID-19" International Journal of Environmental Research and Public Health 20, no. 3: 1765. https://doi.org/10.3390/ijerph20031765
APA StyleLong, S., Zhang, D., Li, S., & Li, S. (2023). Two-Stage Multi-Objective Stochastic Model on Patient Transfer and Relief Distribution in Lockdown Area of COVID-19. International Journal of Environmental Research and Public Health, 20(3), 1765. https://doi.org/10.3390/ijerph20031765


