
Can Enterprises in China Achieve Sustainable Development through Green Investment?


Abstract
:1. Introduction
2. Theoretical Background and Hypothesis Testing
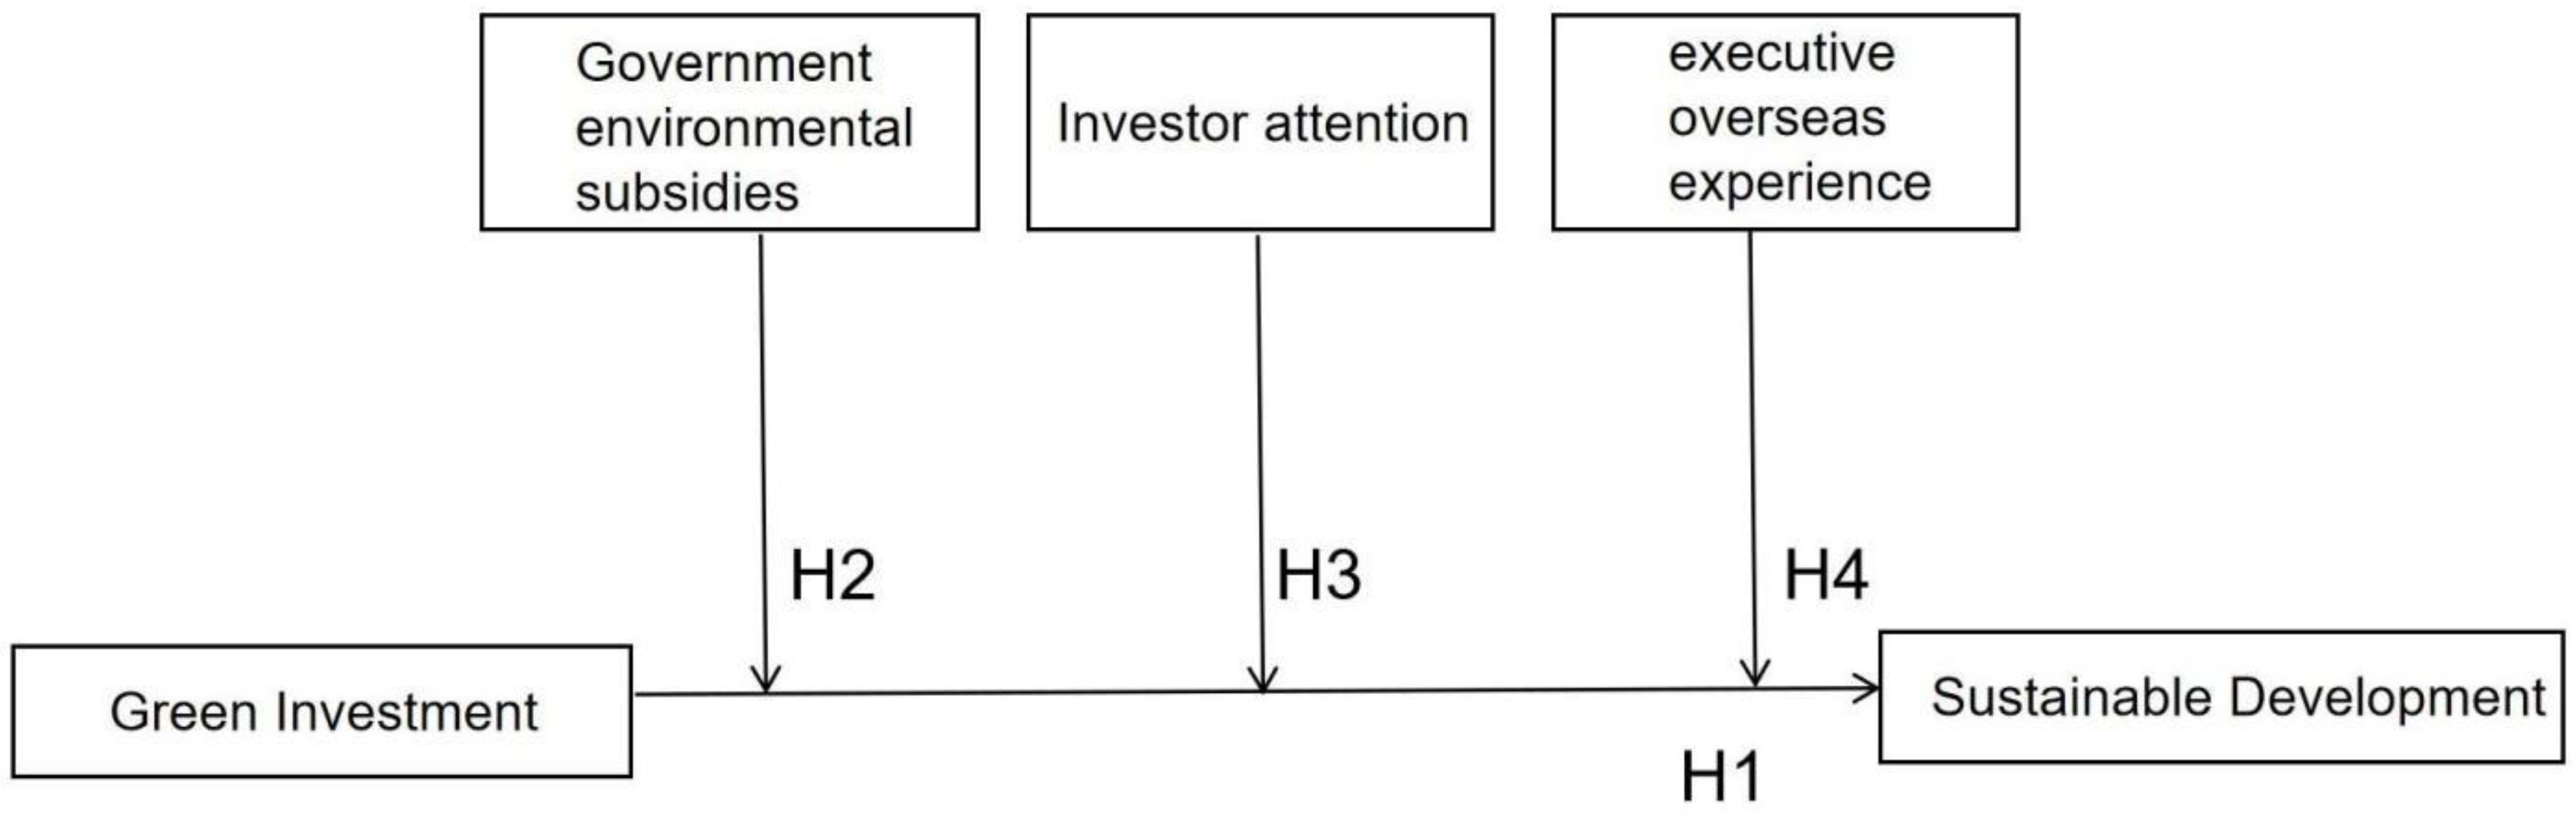
2.1. Green Investment and Corporate Sustainability
2.2. The Regulating Role of Government Environmental Subsidies
2.3. Moderating Effect of Investor Attention
2.4. Moderating Effect of Executives’ Overseas Experience
3. Research Methodology and Design
3.1. Data and Samples
3.2. Definition and Measurement of Variables
3.2.1. Explained Variables
3.2.2. Explanatory Variables
3.2.3. Regulating Variables
3.2.4. Control Variables
3.3. Model Design
4. Results of the Empirical Analysis
4.1. Descriptive Statistics and Correlations
4.2. Analysis of Empirical Results
4.2.1. Green Investment and Corporate Sustainability
4.2.2. Moderating Effect of Government Environmental Subsidies on Corporate Sustainability
4.2.3. Moderating Effect of Investor Attention on Corporate Sustainability
4.2.4. Moderating Effect of Executives’ Overseas Experience on Corporate Sustainability
4.3. Robustness Tests
4.3.1. Tests Based on Sample Interval Adjustment
4.3.2. Tests Based on Range Adjustment of Independent Variables
4.3.3. Testing Based on Two-Stage Least Squares
4.4. Extensibility Study
4.4.1. Heterogeneity Analysis of the Nature of Equity
4.4.2. Heterogeneity Analysis of Industry
5. Conclusions
5.1. Discussion
5.2. Conclusions
5.3. Implication of the Study
5.4. Limitations and Future Directions
Author Contributions
Funding
Institutional Review Board Statement
Informed Consent Statement
Data Availability Statement
Conflicts of Interest
References
- Renneboog, L.; Ter Horst, J.; Zhang, C. The Price of Ethics and Stakeholder Governance: The Performance of Socially Responsible Mutual Funds. J. Corp. Financ. 2008, 14, 302–322. [Google Scholar] [CrossRef]
- Aktas, N.; de Bodt, E.; Cousin, J.-G. Do Financial Markets Care about SRI? Evidence from Mergers and Acquisitions. J. Bank. Financ. 2011, 35, 1753–1761. [Google Scholar] [CrossRef]
- Dorfleitner, G.; Nguyen, M. Which Proportion of SR Investments Is Enough? A Survey-Based Approach. Bus. Res. 2016, 9, 1–25. [Google Scholar] [CrossRef] [Green Version]
- Wins, A.; Zwergel, B. Comparing Those Who Do, Might and Will Not Invest in Sustainable Funds: A Survey among German Retail Fund Investors. Bus. Res. 2016, 9, 51–99. [Google Scholar] [CrossRef] [Green Version]
- Trinks, P.J.; Scholtens, B. The Opportunity Cost of Negative Screening in Socially Responsible Investing. J. Bus. Ethics 2017, 140, 193–208. [Google Scholar] [CrossRef] [Green Version]
- Rizzi, F.; Pellegrini, C.; Battaglia, M. The Structuring of Social Finance: Emerging Approaches for Supporting Environmentally and Socially Impactful Projects. J. Clean. Prod. 2018, 170, 805–817. [Google Scholar] [CrossRef]
- Lozano, R.; Reid, A. Socially Responsible or Reprehensible? Investors, Electricity Utility Companies, and Transformative Change in Europe. Energy Res. Soc. Sci. 2018, 37, 37–43. [Google Scholar] [CrossRef]
- Allevi, E.; Basso, A.; Bonenti, F.; Oggioni, G.; Riccardi, R. Measuring the Environmental Performance of Green SRI Funds: A DEA Approach. Energy Econ. 2019, 79, 32–44. [Google Scholar] [CrossRef]
- Chan, K.H.; Ng, T.H.; Fadi, A. What Do Undergraduates Think about Green Investment? Empirical Evidence from a Developing Nation. Indian J. Public Health Res. Dev. 2018, 9, 1627. [Google Scholar] [CrossRef]
- Duanmu, J.-L.; Bu, M.; Pittman, R. Does Market Competition Dampen Environmental Performance? Evidence from China. Strateg. Manag. J. 2018, 39, 3006–3030. [Google Scholar] [CrossRef]
- Wang, K.; Zhang, H.-M.; Tsai, S.-B.; Wu, L.-D.; Xue, K.-K.; Fan, H.-J.; Zhou, J.; Chen, Q. Does a Board Chairman’s Political Connection Affect Green Investment?-From a Sustainable Perspective. Sustainability 2018, 10, 582. [Google Scholar] [CrossRef] [Green Version]
- Naseem, T.; Shahzad, F.; Asim, G.A.; Rehman, I.U.; Nawaz, F. Corporate Social Responsibility Engagement and Firm Performance in Asia Pacific: The Role of Enterprise Risk Management. Corp. Soc. Responsib. Environ. Manag. 2020, 27, 501–513. [Google Scholar] [CrossRef]
- Ren, S.; Hao, Y.; Wu, H. How Does Green Investment Affect Environmental Pollution? Evidence from China. Environ. Resour. Econ. 2022, 81, 25–51. [Google Scholar] [CrossRef]
- Wu, H.; Hao, Y.; Ren, S. How Do Environmental Regulation and Environmental Decentralization Affect Green Total Factor Energy Efficiency: Evidence from China. Energy Econ. 2020, 91, 104880. [Google Scholar] [CrossRef]
- Li, G.; Zhang, R.; Feng, S.; Wang, Y. Digital Finance and Sustainable Development: Evidence from Environmental Inequality in China. Bus. Strategy Environ. 2022, 31, 3574–3594. [Google Scholar] [CrossRef]
- Balcilar, M.; Usman, O.; Ike, G.N. Investing Green for Sustainable Development without Ditching Economic Growth. Sustain. Dev. 2022. [CrossRef]
- Eyraud, L.; Clements, B.; Wane, A. Green Investment: Trends and Determinants. Energy Policy 2013, 60, 852–865. [Google Scholar] [CrossRef]
- Li, Z.-Z.; Li, R.Y.M.; Malik, M.Y.; Murshed, M.; Khan, Z.; Umar, M. Determinants of Carbon Emission in China: How Good Is Green Investment? Sustain. Prod. Consum. 2021, 27, 392–401. [Google Scholar] [CrossRef]
- Voica, M.C.; Panait, M.; Radulescu, I. Green Investments—Between Necessity, Fiscal Constraints and Profit. Procedia Econ. Financ. J. 2015, 22, 72–79. [Google Scholar] [CrossRef] [Green Version]
- Dobler, M.; Lajili, K.; Zéghal, D. Environmental Performance, Environmental Risk and Risk Management: Environmental Performance, Environmental Risk and Risk Management. Bus. Strategy Environ. 2014, 23, 1–17. [Google Scholar] [CrossRef]
- GiannettiI, M.; Liao, G.; Yu, X. The Brain Gain of Corporate Boards: Evidence from China. J. Financ. 2015, 70, 1629–1682. [Google Scholar] [CrossRef]
- Amore, M.D.; Bennedsen, M.; Larsen, B.; Rosenbaum, P. CEO Education and Corporate Environmental Footprint. J. Environ. Econ. Manag. 2019, 94, 254–273. [Google Scholar] [CrossRef]
- Slater, D.J.; Heather, D.F. CEO International Assignment Experience and Corporate Social Performance. J. Bus. Ethics 2009, 89, 473–489. [Google Scholar] [CrossRef]
- Mariassunta, G.; Andrei, S. On the Determinants of Entrepreneurial Activity: Individual Characteristics, Economic Environment, and Social Norms. Swed. Econ. Policy Rev. 2004, 11, 263–313. [Google Scholar]
- Clarkson, P.M.; Li, Y.; Richardson, G.D. The Market Valuation of Environmental Capital Expenditures by Pulp and Paper Companies. Account. Rev. 2004, 79, 329–353. [Google Scholar] [CrossRef]
- Liao, X.; Shi, X. Public Appeal, Environmental Regulation and Green Investment: Evidence from China. Energy Policy 2018, 119, 554–562. [Google Scholar] [CrossRef]
- Hart, S.L.; Ahuja, G. Does It Pay to Be Green? An Empirical Examination of the Relationship Between Emission Reduction and Firm Performance. Bus. Strategy Environ. 1996, 5, 30–37. [Google Scholar] [CrossRef]
- Ambec, S.; Lanoie, P. Does It Pay to Be Green? A Systematic Overview. Acad. Manag. Perspect. 2008, 22, 45–62. [Google Scholar]
- Wamba, L.D. The Determinants of Environmental Performance and Its Effect on the Financial Performance of European-Listed Companies. J. Gen. Manag. 2022, 47, 97–110. [Google Scholar] [CrossRef]
- Taylor, J.; Vithayathil, J.; Yim, D. Are Corporate Social Responsibility (CSR) Initiatives Such as Sustainable Development and Environmental Policies Value Enhancing or Window Dressing? Corp. Soc. Responsib. Environ. Manag. 2018, 25, 971–980. [Google Scholar] [CrossRef]
- Schmidt, C.G.; Foerstl, K.; Schaltenbrand, B. The Supply Chain Position Paradox: Green Practices and Firm Performance. J. Supply Chain Manag. 2017, 53, 3–25. [Google Scholar] [CrossRef]
- Felício, J.A.; Rodrigues, R.; Caldeirinha, V. Green Shipping Effect on Sustainable Economy and Environmental Performance. Sustainability 2021, 13, 4256. [Google Scholar] [CrossRef]
- Raszkowski, A.; Bartniczak, B. Towards sustainable regional development: Economy, society, environment, good governance based on the example of polish regions. Transform. Bus. Econ. 2018, 17, 225–245. [Google Scholar]
- Dalevska, N.; Khobta, V.; Kwilinski, A.; Kravchenko, S. A Model for Estimating Social and Economic Indicators of Sustainable Development. Entrep. Sustain. Issues 2019, 6, 1839–1860. [Google Scholar] [CrossRef] [PubMed]
- Dabyltayeva, N.; Rakhymzhan, G. The Green Economy Development Path: Overview of Economic Policy Priorities. J. Secur. Sustain. Issues 2019, 8, 643–651. [Google Scholar] [CrossRef] [PubMed]
- Mentel, G.; Brożyna, J.; Szetela, B. Renevable Energy and Economic Development in the European Union. Acta Polytech. Hung. 2017, 14, 11–34. [Google Scholar]
- Matuszewska-Janica, A.; Żebrowska-Suchodolska, D.; Mentel, G. Evaluation of short-term relationships between selected investment funds and the capital market in Poland. Acta Polytech. Hung. 2019, 16, 25–41. [Google Scholar]
- Ahi, P.; Searcy, C.; Jaber, M.Y. A Quantitative Approach for Assessing Sustainability Performance of Corporations. Ecol. Econ. 2018, 152, 336–346. [Google Scholar] [CrossRef]
- Helleno, A.L.; de Moraes, A.J.I.; Simon, A.T. Integrating Sustainability Indicators and Lean Manufacturing to Assess Manufacturing Processes: Application Case Studies in Brazilian Industry. J. Clean. Prod. 2017, 153, 405–416. [Google Scholar] [CrossRef]
- Brown, J.R.; Martinsson, G.; Thomann, C. Can Environmental Policy Encourage Technical Change? Emissions Taxes and R&D Investment in Polluting Firms. Rev. Financ. Stud. 2022, 35, 4518–4560. [Google Scholar]
- Alam, M.S.; Atif, M.; Chien-Chi, C.; Soytaş, U. Does Corporate R&D Investment Affect Firm Environmental Performance? Evidence from G-6 Countries. Energy Econ. 2019, 78, 401–411. [Google Scholar]
- Zheng, J.; Khurram, M.U.; Chen, L. Can Green Innovation Affect ESG Ratings and Financial Performance? Evidence from Chinese GEM Listed Companies. Sustainability 2022, 14, 8677. [Google Scholar] [CrossRef]
- Sun, Y.; Li, H.; Zhang, K.; Kamran, H.W. Dynamic and Casual Association between Green Investment, Clean Energy and Environmental Sustainability Using Advance Quantile A.R.D.L. Framework. Econ. Res.-Ekon. Istraživanja 2022, 35, 3609–3628. [Google Scholar] [CrossRef]
- Xin, Y.; Jiang, C.; Guo, Y.; Liu, J.; Wu, H.; Hao, Y. Corporate Social Responsibility and High-Quality Development: Do Green Innovation, Environmental Investment and Corporate Governance Matter? Emerg. Mark. Financ. Trade 2022, 58, 3191–3214. [Google Scholar]
- Lu, H.Y.; Deng, T.Q.; Yu, J.L. Can financial subsidies promote corporate “greening”?—A study based on Chinese listed companies with heavy pollution. Econ. Manag. 2019, 41, 5–22. [Google Scholar]
- Li, R.; Ramanathan, R. Exploring the Relationships between Different Types of Environmental Regulations and Environmental Performance: Evidence from China. J. Clean. prod. 2018, 196, 1329–1340. [Google Scholar] [CrossRef]
- Blazsek, S.; Escribano, A. Patent Propensity, R&D and Market Competition: Dynamic Spillovers of Innovation Leaders and Followers. J. Econom. 2016, 191, 145–163. [Google Scholar]
- Liu, G.; Yang, Z.; Zhang, F.; Zhang, N. Environmental Tax Reform and Environmental Investment: A Quasi-Natural Experiment Based on China’s Environmental Protection Tax Law. Energy Econ. 2022, 109, 106000. [Google Scholar] [CrossRef]
- Hattori, K. Optimal Combination of Innovation and Environmental Policies under Technology Licensing. Econ. Model. 2017, 64, 601–609. [Google Scholar] [CrossRef]
- Wijethilake, C. Proactive Sustainability Strategy and Corporate Sustainability Performance: The Mediating Effect of Sustainability Control Systems. J. Environ. Manag. 2017, 196, 569–582. [Google Scholar] [CrossRef]
- Freeman, R.E. The Politics of Stakeholder Theory: Some Future Directions. Bus. Ethics Q. 1994, 4, 409–421. [Google Scholar] [CrossRef]
- Li, Z.; Li, P.; Zhao, X.; Tu, Z. Business Strategy and Environmental Information Disclosure Quality: Empirical Evidence from Chinese Heavy Pollution Listed Firms. Int. J. Environ. Res. Public. Health 2022, 19, 8325. [Google Scholar] [CrossRef] [PubMed]
- Song, M.-L.; Cao, S.-P.; Wang, S.-H. The Impact of Knowledge Trade on Sustainable Development and Environment-Biased Technical Progress. Technol. Forecast. Soc. Chang. 2019, 144, 512–523. [Google Scholar] [CrossRef]
- Montmartin, B.; Herrera, M. Internal and External Effects of R&D Subsidies and Fiscal Incentives: Empirical Evidence Using Spatial Dynamic Panel Models. Res. Policy 2015, 44, 1065–1079. [Google Scholar]
- Zhang, Y.; Wang, J.; Xue, Y.; Yang, J. Impact of Environmental Regulations on Green Technological Innovative Behavior: An Empirical Study in China. J. Clean. prod. 2018, 188, 763–773. [Google Scholar] [CrossRef]
- Hong, Y.; Jiang, X.; Shi, B.; Yu, C. Do Fiscal Environmental Protection Expenditures Crowd Out Corporate Environmental Protection Investments? Sustainability 2022, 14, 13608. [Google Scholar] [CrossRef]
- Zhang, W.; Chiu, Y.-B.; Hsiao, C.Y.-L. Effects of Country Risks and Government Subsidies on Renewable Energy Firms’ Performance: Evidence from China. Renew. Sustain. Energy Rev. 2022, 158, 112164. [Google Scholar] [CrossRef]
- Goodman, J.; Arenas, D. Engaging Ethically: A Discourse Ethics Perspective on Social Shareholder Engagement. Bus. Ethics Q. 2015, 25, 163–189. [Google Scholar] [CrossRef] [Green Version]
- Deng, C.; Zhou, X.; Peng, C.; Zhu, H. Going Green: Insight from Asymmetric Risk Spillover between Investor Attention and pro-Environmental Investment. Financ. Res. Lett. 2022, 47, 102565. [Google Scholar] [CrossRef]
- Gibson Brandon, R.; Glossner, S.; Krueger, P.; Matos, P.; Steffen, T. Do Responsible Investors Invest Responsibly? Rev. Financ. 2022, 26, 1389–1432. [Google Scholar] [CrossRef]
- Eccles, R.G.; Serafeim, G.; Seth, D.; Ming, C.C.Y. The Performance Frontier: Innovating for a Sustainable Strategy: Interaction. Harv. Bus. Rev. 2013, 91, 17–18. [Google Scholar]
- Richardson, B.J. Socially Responsible Investing for Sustainability: Overcoming Its Incomplete and Conflicting Rationales. Transnatl. Environ. Law 2013, 2, 311–338. [Google Scholar] [CrossRef]
- Esty, D.C.; Karpilow, Q. Harnessing Investor Interest in Sustainability: The Next Frontier in Environmental Information Regulation. Yale J. Regul. 2019, 36, 625. [Google Scholar]
- Kordsachia, O.; Focke, M.; Velte, P. Do Sustainable Institutional Investors Contribute to Firms’ Environmental Performance? Empirical Evidence from Europe. Rev. Manag. Sci. 2022, 16, 1409–1436. [Google Scholar] [CrossRef]
- Pan, K.; He, F. Does Public Environmental Attention Improve Green Investment Efficiency?—Based on the Perspective of Environmental Regulation and Environmental Responsibility. Sustainability 2022, 14, 12861. [Google Scholar] [CrossRef]
- Alexiev, A.S.; Jansen, J.J.P.; Van den Bosch, F.A.J.; Volberda, H.W. Top Management Team Advice Seeking and Exploratory Innovation: The Moderating Role of TMT Heterogeneity. J. Manag. Stud. 2010, 47, 1343–1364. [Google Scholar] [CrossRef]
- Cao, X.; Wang, Z.; Li, G.; Zheng, Y. The Impact of Chief Executive Officers’ (CEOs’) Overseas Experience on the Corporate Innovation Performance of Enterprises in China. J. Innov. Knowl. 2022, 7, 100268. [Google Scholar] [CrossRef]
- Cui, S. Enterprise Innovation, Executive Experience and Internationalization Strategy: Evidence From High-Carbon Industrial Enterprises Versus Low-Carbon Industrial Enterprises in China. Front. Energy Res. 2022, 9, 821269. [Google Scholar] [CrossRef]
- Sun, H.; Zhu, J.; Wang, T.; Wang, Y. MBA CEOs and Corporate Social Responsibility: Empirical Evidence from China. J. Clean. Prod. 2021, 290, 125801. [Google Scholar] [CrossRef]
- Lundgren, T.; Zhou, W. Firm Performance and the Role of Environmental Management. J. Environ. Manag. 2017, 203, 330–341. [Google Scholar] [CrossRef]
- Lopatta, K.; Kaspereit, T.; Tideman, S.A.; Rudolf, A.R. The Moderating Role of CEO Sustainability Reporting Style in the Relationship between Sustainability Performance, Sustainability Reporting, and Cost of Equity. J. Bus. Econ. 2022, 92, 429–465. [Google Scholar] [CrossRef]
- Lau, C.; Lu, Y.; Liang, Q. Corporate Social Responsibility in China: A Corporate Governance Approach. J Bus. Ethics 2016, 136, 73–87. [Google Scholar] [CrossRef]
- Iliev, P.; Roth, L. Learning from Directors’ Foreign Board Experiences. J. Corp. Financ. 2018, 51, 1–19. [Google Scholar] [CrossRef]
- Wen, W.; Cui, H.; Ke, Y. Directors with Foreign Experience and Corporate Tax Avoidance. J. Corp. Financ. 2020, 62, 101624. [Google Scholar] [CrossRef]
- Dai, Y.; Kong, D.; Liu, S. Returnee Talent and Corporate Investment: Evidence from China. Eur. Account. Rev. 2018, 27, 313–337. [Google Scholar] [CrossRef]
- Cao, F.; Sun, J.; Yuan, R. Board Directors with Foreign Experience and Stock Price Crash Risk: Evidence from China. J. Bus. Financ. Account. 2019, 46, 1144–1170. [Google Scholar] [CrossRef]
- Wen, W.; Song, J. Can Returnee Managers Promote CSR Performance? Evidence from China. Front. Bus. Res. China 2017, 11, 12. [Google Scholar] [CrossRef] [Green Version]
- Zhang, J.; Kong, D.; Wu, J. Doing Good Business by Hiring Directors with Foreign Experience. J. Bus. Ethics 2018, 153, 859–876. [Google Scholar] [CrossRef]
- Chen, W.; Zhu, Y.; Wang, C. Executives’ Overseas Background and Corporate Green Innovation. Corp. Soc. Responsib. Environ. Manag. 2022, 30, 165–179. [Google Scholar] [CrossRef]
- Liao, Y.; Qiu, X.; Wu, A.; Sun, Q.; Shen, H.; Li, P. Assessing the impact of green innovation on corporate sustainable development. Front. Energy Res. 2022, 2, 800848. [Google Scholar] [CrossRef]
- Du, W.; Li, M. Assessing the Impact of Environmental Regulation on Pollution Abatement and Collaborative Emissions Reduction: Micro-Evidence from Chinese Industrial Enterprises. Environ. Impact Assess. Rev. 2020, 82, 106382. [Google Scholar] [CrossRef]
- Jiang, X.; Akbar, A. Does Increased Representation of Female Executives Improve Corporate Environmental Investment? Evidence from China. Sustainability 2018, 10, 4750. [Google Scholar] [CrossRef] [Green Version]
- Li, Q.Y.; Xiao, Z.H. Heterogeneous environmental regulatory instruments and firms’ incentives for green innovation—Evidence from green patents of listed firms. Econ. Res. 2020, 55, 192–208. [Google Scholar]
- Da, Z.; Engelberg, J.; Gao, P. In Search of Attention. J. Financ. 2011, 66, 1461–1499. [Google Scholar] [CrossRef]
- Goddard, J.; Kita, A.; Wang, Q. Investor Attention and FX Market Volatility. J. Int. Financ. Mark. Inst. Money 2015, 38, 79–96. [Google Scholar] [CrossRef] [Green Version]
- Gupta, K.; Banerjee, R. Does OPEC News Sentiment Influence Stock Returns of Energy Firms in the United States? Energy Econ. 2019, 77, 34–45. [Google Scholar] [CrossRef]
- Yuan, R.; Wen, W. Managerial Foreign Experience and Corporate Innovation. J. Corp. Financ. 2018, 48, 752–770. [Google Scholar] [CrossRef]
- Liu, B.; Ju, T.; Bai, M.; Yu, C.-F. Imitative Innovation and Financial Distress Risk: The Moderating Role of Executive Foreign Experience. Int. Rev. Econ. Financ. 2021, 71, 526–548. [Google Scholar] [CrossRef]
- Jin, Z.; Xu, J. Impact of Environmental Investment Financial Performance: Evidence From Chinese Listed Companies. Pol. J. Environ. Stud. 2020, 29, 2235–2245. [Google Scholar] [CrossRef]
- Crifo, P.; Durand, R.; Gond, J.-P. Encouraging Investors to Enable Corporate Sustainability Transitions: The Case of Responsible Investment in France. Organ. Environ. 2019, 32, 125–144. [Google Scholar] [CrossRef]
- Hayes, A.F. Introduction to Mediation, Moderation, and Conditional Process Analysis: A Regression-Based Approach. In Methodology In the Social Sciences; The Guilford Press: New York, NY, USA, 2013. [Google Scholar]
- Chen, Y.; Ma, Y. Does Green Investment Improve Energy Firm Performance? Energy Policy 2021, 153, 112252. [Google Scholar] [CrossRef]
- Fisman, R.; Svensson, J. Are Corruption and Taxation Really Harmful to Growth? Firm Level Evidence. J. Dev. Econ. 2007, 83, 63–75. [Google Scholar] [CrossRef] [Green Version]
- Kaustia, M.; Rantala, V. Social Learning and Corporate Peer Effects. J. Financ. Econ. 2015, 117, 653–669. [Google Scholar] [CrossRef]
- Xu, X.; Zhang, W.; Wang, T.; Xu, Y.; Du, H. Impact of Subsidies on Innovations of Environmental Protection and Circular Economy in China. J Environ. Manag. 2021, 289, 112385. [Google Scholar] [CrossRef]
- Dang, D. Can Environmental Subsidies Promote the Green Investment of Enterprises? Mod. Econ. 2020, 11, 109–125. [Google Scholar] [CrossRef] [Green Version]
- Zhang, Y.; Wei, J.; Zhu, Y.; George-Ufot, G. Untangling the Relationship between Corporate Environmental Performance and Corporate Financial Performance: The Double-Edged Moderating Effects of Environmental Uncertainty. J. Clean. Prod. 2020, 263, 121584. [Google Scholar] [CrossRef]
- Shabbir, M.S.; Wisdom, O. The Relationship between Corporate Social Responsibility, Environmental Investments and Financial Performance: Evidence from Manufacturing Companies. Environ. Sci. Pollut. Res. 2020, 27, 39946–39957. [Google Scholar] [CrossRef]
- Li, R.; Ramanathan, R. Can Environmental Investments Benefit Environmental Performance? The Moderating Roles of Institutional Environment and Foreign Direct Investment. Bus. Strategy Environ. 2020, 29, 3385–3398. [Google Scholar] [CrossRef]


| Variable | Symbol | Name | Definition |
|---|---|---|---|
| Explained variable | SGR | Sustainable Development | Net sales interest rate × total asset turnover × income retention rate × equity multiplier/(1—net sales interest rate × total asset turnover × income retention rate × equity multiplier) |
| Explanatory variable | GI | Green Investment | Total environmental investment/total assets at year-end |
| Moderating variable | ENVSUB | Government Environmental Subsidies | Total environmental subsidies/current year operating revenue |
| ATTEN | Investor Attention | Total number of Google web searches for stock symbols/million | |
| OVERSEA | Executives’ Overseas Experience | Number of executives with overseas experience/total number of executives | |
| Controlled variable | SIZE | Company Size | Natural logarithm of total assets for the year |
| LEV | Asset–Liability Ratio | Total liabilities/total assets | |
| ROA | Profitability | Net income/average balance of total assets | |
| ATO | Net Asset Turnover Ratio | Sales revenue/average of total net assets at the beginning and end of the period | |
| CFLOW | Cash Flow Ratio | Net cash flow from operating activities/total assets | |
| GROWTH | Growth | Main business income of this period/main business income of period−1 | |
| TOBINQ | Tobin Q | (Outstanding market value + non-marketable par value/total assets − net intangible assets − net goodwill) | |
| SOE | Nature of Equity | State-controlled = 1; otherwise = 0 | |
| AGE | Enterprise Age | Ln (enterprise observation year − registration year + 1) | |
| INDUSTRY | Industry | Industry dummy variable, belonging to the corresponding year = 1, otherwise = 0 | |
| YEAR | Year | Time dummy variable, belonging to the corresponding year = 1, otherwise = 0 |
| Year | 2010 | 2011 | 2012 | 2013 | 2014 | 2015 | 2016 | 2017 | 2018 | 2019 | 2020 |
|---|---|---|---|---|---|---|---|---|---|---|---|
| Sample | N = 0 | N = 999 | N = 1157 | N = 1294 | N = 1337 | N = 1236 | N = 1333 | N = 1586 | N = 1764 | N = 2016 | N = 2057 |
| Variable | N | Mean | SD | Min | p50 | Max | Skewness | Kurtosis |
|---|---|---|---|---|---|---|---|---|
| SGR | 14,779 | 0.031 | 0.078 | −0.057 | 0.008 | 0.633 | 5.196 | 35.499 |
| GI | 14,779 | 0.045 | 0.005 | 0.034 | 0.045 | 0.057 | 0.033 | 2.540 |
| ENVSUB | 14,779 | 0.046 | 0.016 | 0.018 | 0.043 | 0.119 | 1.614 | 7.182 |
| ATTEN | 14,779 | 1.091 | 0.558 | 0.500 | 0.910 | 2.480 | 0.857 | 2.647 |
| OVERSEA | 14,779 | 0.071 | 0.082 | 0.000 | 0.053 | 0.385 | 1.501 | 5.309 |
| SIZE | 14,779 | 22.424 | 1.328 | 20.029 | 22.216 | 26.272 | 0.747 | 3.287 |
| LEV | 14,779 | 0.422 | 0.197 | 0.055 | 0.417 | 0.857 | 0.149 | 2.190 |
| ROA | 14,779 | 0.054 | 0.044 | 0.002 | 0.043 | 0.221 | 1.399 | 5.105 |
| ATO | 14,779 | 1.313 | 1.089 | 0.148 | 1.006 | 6.888 | 2.454 | 10.775 |
| CFLOW | 14,779 | 0.055 | 0.066 | −0.138 | 0.054 | 0.240 | 0.020 | 3.711 |
| GROWTH | 14,779 | 0.174 | 0.365 | −0.427 | 0.111 | 2.744 | 3.610 | 23.160 |
| TOBINQ | 14,779 | 1.948 | 1.195 | 0.860 | 1.554 | 7.915 | 2.484 | 10.605 |
| SOE | 14,779 | 0.400 | 0.490 | 0.000 | 0.000 | 1.000 | 0.410 | 1.169 |
| AGE | 14,779 | 2.878 | 0.335 | 1.609 | 2.944 | 3.466 | −0.915 | 4.227 |
| SGR | GI | ENVSUB | ATTEN | OVERSEA | SIZE | LEV | ROA | ATO | CFLOW | GROWTH | TOBINQ | SOE | AGE | |
|---|---|---|---|---|---|---|---|---|---|---|---|---|---|---|
| SGR | 1 | |||||||||||||
| GI | 0.174 *** | 1 | ||||||||||||
| ENVSUB | 0.310 *** | 0.204 *** | 1 | |||||||||||
| ATTEN | 0.145 *** | 0.175 *** | 0.191 *** | 1 | ||||||||||
| OVERSEA | 0.207 *** | 0.196 *** | 0.210 *** | 0.260 *** | 1 | |||||||||
| SIZE | 0.117 *** | 0.048 *** | 0.078 *** | 0.199 *** | 0.110 *** | 1 | ||||||||
| LEV | 0.110 *** | 0.049 *** | 0.142 *** | 0.062 *** | 0.003 | 0.567 *** | 1 | |||||||
| ROA | 0.234 *** | 0.058 *** | 0.010 | 0.027 *** | 0.140 *** | −0.098 *** | −0.392 *** | 1 | ||||||
| ATO | −0.052 *** | 0.012 | −0.043 *** | −0.009 | −0.036 *** | 0.251 *** | 0.511 *** | −0.055 *** | 1 | |||||
| CFLOW | −0.051 *** | −0.032 *** | −0.126 *** | −0.024 *** | 0.026 *** | 0.024 *** | −0.186 *** | 0.471 *** | 0.021 ** | 1 | ||||
| GROWTH | 0.328 *** | 0.101 *** | 0.224 *** | 0.047 *** | 0.089 *** | 0.017 ** | 0.067 *** | 0.170 *** | 0.101 *** | −0.014 * | 1 | |||
| TOBINQ | 0.038 *** | 0.004 | −0.019 ** | 0.036 *** | 0.079 *** | −0.382 *** | −0.359 *** | 0.379 *** | −0.123 *** | 0.173 *** | 0.037 *** | 1 | ||
| SOE | −0.037 *** | 0.005 | 0.016 ** | 0.046 *** | −0.181 *** | 0.388 *** | 0.316 *** | −0.182 *** | 0.180 *** | −0.043 *** | −0.074 *** | −0.177 *** | 1 | |
| AGE | 0.004 | −0.022 *** | 0.022 *** | −0.014 * | −0.051 *** | 0.167 *** | 0.142 *** | −0.054 *** | 0.026 *** | 0.045 *** | −0.056 *** | −0.031 *** | 0.178 *** | 1 |
| (1) | (2) | (3) | (4) | |
|---|---|---|---|---|
| Variables | SGR | SGR | SGR | SGR |
| GI−1 | 1.563 *** | 1.142 *** | 1.186 *** | 0.984 *** |
| (8.10) | (7.36) | (7.09) | (6.28) | |
| SIZE | 0.016 *** | 0.016 *** | 0.014 *** | 0.014 *** |
| (5.13) | (5.42) | (4.67) | (4.64) | |
| LEV | 0.131 *** | 0.113 *** | 0.130 *** | 0.117 *** |
| (9.59) | (8.74) | (9.60) | (8.80) | |
| ROA | 0.727 *** | 0.652 *** | 0.685 *** | 0.619 *** |
| (15.71) | (15.10) | (15.22) | (13.99) | |
| ATO | −0.018 *** | −0.016 *** | −0.018 *** | −0.017 *** |
| (−9.07) | (−8.36) | (−8.56) | (−8.67) | |
| GROWTH | 0.044 *** | 0.036 *** | 0.043 *** | 0.042 *** |
| (8.60) | (7.23) | (8.53) | (8.62) | |
| TOBIN | −0.002 ** | −0.002 ** | −0.003 *** | −0.002 ** |
| (−2.48) | (−2.26) | (−3.02) | (−2.12) | |
| AGE | 0.003 | 0.001 | 0.019 * | 0.007 |
| (0.23) | (0.11) | (1.65) | (0.65) | |
| CFLOW | −0.121 *** | −0.097 *** | −0.111 *** | −0.105 *** |
| (−7.10) | (−6.26) | (−6.75) | (−6.76) | |
| SOE | −0.011 ** | −0.009 * | −0.007 | −0.003 |
| (−2.31) | (−1.80) | (−1.39) | (−0.63) | |
| ENVSUB | 0.713 *** | |||
| (8.33) | ||||
| GI−1∗ ENVSUB | 0.013 *** | |||
| (8.59) | ||||
| ATTEN | 0.024 *** | |||
| (6.03) | ||||
| GI−1∗ ATTEN | 0.008 *** | |||
| (6.80) | ||||
| OVERSEA | 0.189 *** | |||
| (8.55) | ||||
| GI−1∗ OVERSEA | 0.012 *** | |||
| (8.35) | ||||
| _cons | −0.447 *** | −0.461 *** | −0.469 *** | −0.397 *** |
| (−6.69) | (−7.12) | (−6.86) | (−6.26) | |
| Firm | Yes | Yes | Yes | Yes |
| Industry | Yes | Yes | Yes | Yes |
| Year | Yes | Yes | Yes | Yes |
| N | 14,779 | 14,779 | 14,779 | 14,779 |
| R2 | 0.198 | 0.262 | 0.223 | 0.251 |
| adj. R2 | 0.197 | 0.261 | 0.222 | 0.250 |
| F | 32.778 | 38.123 | 32.861 | 37.807 |
| (1) | (2) | (3) | (4) | |
|---|---|---|---|---|
| Variables | SGR | SGR | SGR | SGR |
| GI−1 | 1.738 *** | 1.290 *** | 1.283 *** | 1.107 *** |
| (8.08) | (7.31) | (6.81) | (6.19) | |
| SIZE | 0.017 *** | 0.017 *** | 0.016 *** | 0.015 *** |
| (5.05) | (5.08) | (4.52) | (4.63) | |
| LEV | 0.137 *** | 0.118 *** | 0.134 *** | 0.121 *** |
| (9.03) | (8.24) | (9.04) | (8.24) | |
| ROA | 0.730 *** | 0.647 *** | 0.679 *** | 0.612 *** |
| (14.39) | (13.77) | (13.86) | (12.70) | |
| ATO | −0.019 *** | −0.017 *** | −0.018 *** | −0.017 *** |
| (−8.11) | (−7.45) | (−7.71) | (−7.87) | |
| GROWTH | 0.044 *** | 0.035 *** | 0.043 *** | 0.042 *** |
| (8.08) | (6.67) | (8.07) | (8.09) | |
| TOBIN | −0.002 | −0.002 | −0.002 ** | −0.001 |
| (−1.57) | (−1.45) | (−2.19) | (−1.35) | |
| AGE | −0.003 | −0.004 | 0.012 | 0.003 |
| (−0.21) | (−0.37) | (1.51) | (0.29) | |
| CFLOW | −0.117 *** | −0.093 *** | −0.105 *** | −0.099 *** |
| (−6.42) | (−5.44) | (−5.91) | (−5.92) | |
| SOE | −0.015 ** | −0.015 ** | −0.011 * | −0.005 |
| (−2.55) | (−2.34) | (−1.74) | (−0.86) | |
| ENVSUB | 0.772 *** | |||
| (8.26) | ||||
| GI−1 ∗ ENVSUB | 0.013 *** | |||
| (8.23) | ||||
| ATTEN | 0.028 *** | |||
| (6.61) | ||||
| GI−1 ∗ ATTEN | 0.008 *** | |||
| (6.34) | ||||
| OVERSEA | 0.196 *** | |||
| (8.34) | ||||
| GI−1 ∗ OVERSEA | 0.012 *** | |||
| (8.46) | ||||
| _cons | −0.470 *** | −0.472 *** | −0.503 *** | −0.420 *** |
| (−6.25) | (−6.44) | (−6.46) | (−5.95) | |
| Firm | Yes | Yes | Yes | Yes |
| Industry | Yes | Yes | Yes | Yes |
| Year | Yes | Yes | Yes | Yes |
| N | 12,722 | 12,722 | 12,722 | 12,722 |
| R2 | 0.201 | 0.269 | 0.230 | 0.259 |
| adj. R2 | 0.199 | 0.268 | 0.228 | 0.258 |
| F | 31.477 | 37.741 | 31.851 | 36.852 |
| (1) | (2) | (3) | (4) | |
|---|---|---|---|---|
| Variables | SGR | SGR | SGR | SGR |
| GIINV−1 | 1.833 *** | 1.201 *** | 1.184 *** | 0.847 *** |
| (6.52) | (4.95) | (4.58) | (3.49) | |
| SIZE | 0.016 *** | 0.017 *** | 0.015 *** | 0.014 *** |
| (5.23) | (5.58) | (4.75) | (4.59) | |
| LEV | 0.132 *** | 0.114 *** | 0.131 *** | 0.121 *** |
| (9.56) | (8.67) | (9.57) | (8.91) | |
| ROA | 0.731 *** | 0.666 *** | 0.692 *** | 0.632 *** |
| (15.61) | (15.26) | (15.11) | (14.08) | |
| ATO | −0.018 *** | −0.016 *** | −0.018 *** | −0.017 *** |
| (−9.14) | (−8.20) | (−8.47) | (−8.75) | |
| GROWTH | 0.045 *** | 0.037 *** | 0.044 *** | 0.043 *** |
| (8.69) | (7.42) | (8.64) | (8.72) | |
| TOBIN | −0.002 ** | −0.002 ** | −0.003 *** | −0.002 ** |
| (−2.35) | (−2.09) | (−3.00) | (−2.27) | |
| AGE | 0.001 | −0.002 | 0.020 * | 0.009 |
| (0.09) | (−0.18) | (1.73) | (0.77) | |
| CFLOW | −0.122 *** | −0.102 *** | −0.115 *** | −0.107 *** |
| (−7.08) | (−6.47) | (−6.87) | (−6.76) | |
| SOE | −0.011 ** | −0.010 * | −0.006 | −0.004 |
| (−2.14) | (−1.82) | (−1.18) | (−0.69) | |
| ENVSUB | 0.791 *** | |||
| (8.50) | ||||
| GIINV−1∗ENVSUB | 0.011 *** | |||
| (7.67) | ||||
| ATTEN | 0.027 *** | |||
| (6.27) | ||||
| GIINV−1∗ ATTEN | 0.007 *** | |||
| (6.75) | ||||
| OVERSEA | 0.215 *** | |||
| (8.34) | ||||
| GIINV−1∗ OVERSEA | 0.010 *** | |||
| (8.60) | ||||
| _cons | −0.412 *** | −0.436 *** | −0.450 *** | −0.374 *** |
| (−6.19) | (−6.75) | (−6.50) | (−5.82) | |
| Firm | Yes | Yes | Yes | Yes |
| Industry | Yes | Yes | Yes | Yes |
| Year | Yes | Yes | Yes | Yes |
| N | 14,779 | 14,779 | 14,779 | 14,779 |
| R2 | 0.191 | 0.244 | 0.214 | 0.239 |
| adj. R2 | 0.190 | 0.243 | 0.213 | 0.238 |
| F | 32.737 | 36.407 | 32.177 | 35.488 |
| First Stage | Second Stage | |
|---|---|---|
| Variables | GI−1 | SGR |
| GI−1 | 4.426 *** | |
| 2.72 | ||
| GImean−1 | 1.056 *** | |
| 9.14 | ||
| SIZE | 0.001 *** | 0.014 *** |
| 4.23 | 4.14 | |
| LEV | 0.003 *** | 0.123 *** |
| 3.95 | 8.73 | |
| ROA | 0.014 *** | 0.686 *** |
| 6.51 | 13.21 | |
| ATO | −0.000 *** | −0.017 *** |
| (−3.18) | (−8.44) | |
| GROWTH | 0.001 *** | 0.041 *** |
| 5.86 | 7.73 | |
| TOBIN | 0.000 | −0.003 *** |
| 0.81 | (−2.60) | |
| AGE | −0.002 *** | 0.008 |
| (−2.84) | 0.64 | |
| CFLOW | −0.003 *** | −0.111 *** |
| (−3.62) | (−6.20) | |
| SOE | 0.000 | −0.013 ** |
| 1.11 | (−2.50) | |
| Firm | YES | YES |
| Industry | YES | YES |
| Year | YES | YES |
| Observations | 14,779 | 14,779 |
| R-squared | 0.158 | |
| Number of id | 2513 | 2513 |
| F | 83.61 | 32.72 |
| Kleibergen–Paap rk LM statistic | 72.95(Chi-sq(1) p-value = 0.0000) | |
| Cragg–Donald F statistic | 83.32 | |
| Kleibergen–Paap rk Wald F statistic | 83.61 | |
| 10% maximal instrumental variable size | 16.38 | |
| State-Owned Enterprise | Non-State-Owned Enterprise | |
|---|---|---|
| SGR | SGR | |
| GI−1 | 0.330 * | 2.532 *** |
| (1.68) | (8.44) | |
| SIZE | 0.011 ** | 0.020 *** |
| (2.20) | (4.74) | |
| LEV | 0.136 *** | 0.135 *** |
| (5.51) | (7.87) | |
| ROA | 0.695 *** | 0.731 *** |
| (9.80) | (12.13) | |
| ATO | −0.015 *** | −0.025 *** |
| (−6.22) | (−6.35) | |
| GROWTH | 0.051 *** | 0.040 *** |
| (6.23) | (6.05) | |
| TOBIN | −0.002 | −0.003 ** |
| (−1.38) | (−2.24) | |
| AGE | −0.019 | 0.016 |
| (−1.11) | (0.98) | |
| CFLOW | −0.107 *** | −0.119 *** |
| (−4.15) | (−5.27) | |
| _cons | −0.248 ** | −0.603 *** |
| (−2.26) | (−6.60) | |
| Firm | Yes | Yes |
| Industry | Yes | Yes |
| Year | Yes | Yes |
| N | 5904 | 8875 |
| R2 | 0.168 | 0.228 |
| adj. R2 | 0.166 | 0.226 |
| F | 12.500 | 24.264 |
| Heavily Polluting Industry | Non-Heavily Polluting Industry | |
|---|---|---|
| SGR | SGR | |
| GI−1 | 1.974 *** | 1.312 *** |
| (5.92) | (5.58) | |
| SIZE | 0.020 *** | 0.013 *** |
| (4.30) | (3.33) | |
| LEV | 0.090 *** | 0.164 *** |
| (4.88) | (8.39) | |
| ROA | 0.638 *** | 0.789 *** |
| (8.61) | (13.48) | |
| ATO | −0.013 *** | −0.022 *** |
| (−5.26) | (−7.51) | |
| GROWTH | 0.049 *** | 0.041 *** |
| (5.24) | (6.89) | |
| TOBIN | −0.004 * | −0.002 |
| (−1.75) | (−1.59) | |
| AGE | 0.030 | −0.012 |
| (1.55) | (−0.87) | |
| CFLOW | −0.095 *** | −0.132 *** |
| (−4.93) | (−5.74) | |
| SOE | −0.001 | −0.016 ** |
| (−0.06) | (−2.56) | |
| _cons | −0.630 *** | −0.347 *** |
| (−6.07) | (−4.06) | |
| Firm | Yes | Yes |
| Industry | Yes | Yes |
| Year | Yes | Yes |
| N | 5381 | 9398 |
| R2 | 0.230 | 0.188 |
| adj. R2 | 0.227 | 0.186 |
| F | 13.425 | 21.891 |
Disclaimer/Publisher’s Note: The statements, opinions and data contained in all publications are solely those of the individual author(s) and contributor(s) and not of MDPI and/or the editor(s). MDPI and/or the editor(s) disclaim responsibility for any injury to people or property resulting from any ideas, methods, instructions or products referred to in the content. |
© 2023 by the authors. Licensee MDPI, Basel, Switzerland. This article is an open access article distributed under the terms and conditions of the Creative Commons Attribution (CC BY) license (https://creativecommons.org/licenses/by/4.0/).
Share and Cite
Zheng, S.; Jin, S. Can Enterprises in China Achieve Sustainable Development through Green Investment? Int. J. Environ. Res. Public Health 2023, 20, 1787. https://doi.org/10.3390/ijerph20031787
Zheng S, Jin S. Can Enterprises in China Achieve Sustainable Development through Green Investment? International Journal of Environmental Research and Public Health. 2023; 20(3):1787. https://doi.org/10.3390/ijerph20031787
Chicago/Turabian StyleZheng, Sisi, and Shanyue Jin. 2023. "Can Enterprises in China Achieve Sustainable Development through Green Investment?" International Journal of Environmental Research and Public Health 20, no. 3: 1787. https://doi.org/10.3390/ijerph20031787