1. Introduction
Climate change has increasingly influenced human life. Carbon emission has become a major factor causing global climate warnings. The world’s biggest CO
2 emitter is currently China [
1]. For meeting the challenge of global weather changes, changing the resource-consuming economic development mode, and achieving high-quality development, China’s administration has introduced a range of policy measures for decreasing CO
2 emissions. LCCP is China’s most important strategy to explore CO
2 reduction in cities [
2].
In terms of the origin of CO
2 emission, the city is the center of human production and life and the center of high-power expenditure and CO
2 emission [
3]. As China’s urbanization progresses rapidly, cities account for 70–80% of total CO
2 emissions [
4,
5] and cities have twice the carbon footprint of rural areas. Therefore, the decarbonization of urban development is critical to reducing CO
2 emissions in China.
The existing literature mainly studies LCCP from LCCP’s concept [
6], LCCP’s development model [
7,
8], LCCP’s evaluation index [
9,
10], and LCCP’s effectiveness [
11].
Based on the real-life experiences of China’s LCCP, some scholars have conducted many empirical assessments of the effects of LCCP construction in China. Yu and Zhang [
12] find that LCCP has a significant active impact on green total factor productivity (TFP) and this effect is greater in a non-resource dependent and coastal city in China. Qiu et al. [
13] estimated LCCP’s impact on carbon emission efficiency; LCCP can improve CO
2 emissions performance by about 1.7%. As the time point of carbon peaking approaches, carbon emission efficiency accelerates. Chen et al. [
14] find that LCCP dramatically increased the TFP of locally listed firms.
Although there is a relatively rich existing literature on LCCP, there are still some problems. Firstly, most of the carbon emission data used in existing studies are emissions from China’s cities’ statistical yearbooks; this data includes only CO2 emissions from straight power spending, such as air, natural air, electricity, heat, etc. The scope of this data is not comprehensive and may underestimate the extent of CO2 emission in cities. Secondly, existing literature does not systematically summarize LCCP’s CO2 emissions decline path in theory, but only examines individual potential influencing mechanisms such as innovation and industrial structure. Thirdly, the existing literature does not analyze the synergistic elements of carbon reduction in LCCP; these synergistic factors lead to great differences in the construction of LCCP.
There are three main points of possible innovation in this paper. Firstly, this paper uses CEADs data. This data uses IPCC-recommended methods for computing carbon emissions. The data covers all direct carbon emissions from human socio-economic activities within the administrative boundaries of the city, including 47 socio-economic sectors, 17 kinds of fuel combustion, and cement manufacturing processes [
15]. Secondly, this paper theoretically divides the carbon emission reduction paths of LCCP into three types and examines the differences between and within mechanisms. Thirdly, this paper analyzes the synergistic elements of LCCP, which play a key role in the effect of LCCP.
2. Policies Setting and Mechanism Assumptions
2.1. Policies Setting
Former Chinese President Hu delivered an important speech titled “Working Together to Solve Challenges of Weather Changes”. He said that China would dramatically decrease CO2 emissions by 2020 at the 2009 U.N. Climate Summit. Subsequently, China officially announced a 40–45 percent cut in carbon emission intensity in 2020 versus 2005 on 26 November 2019.
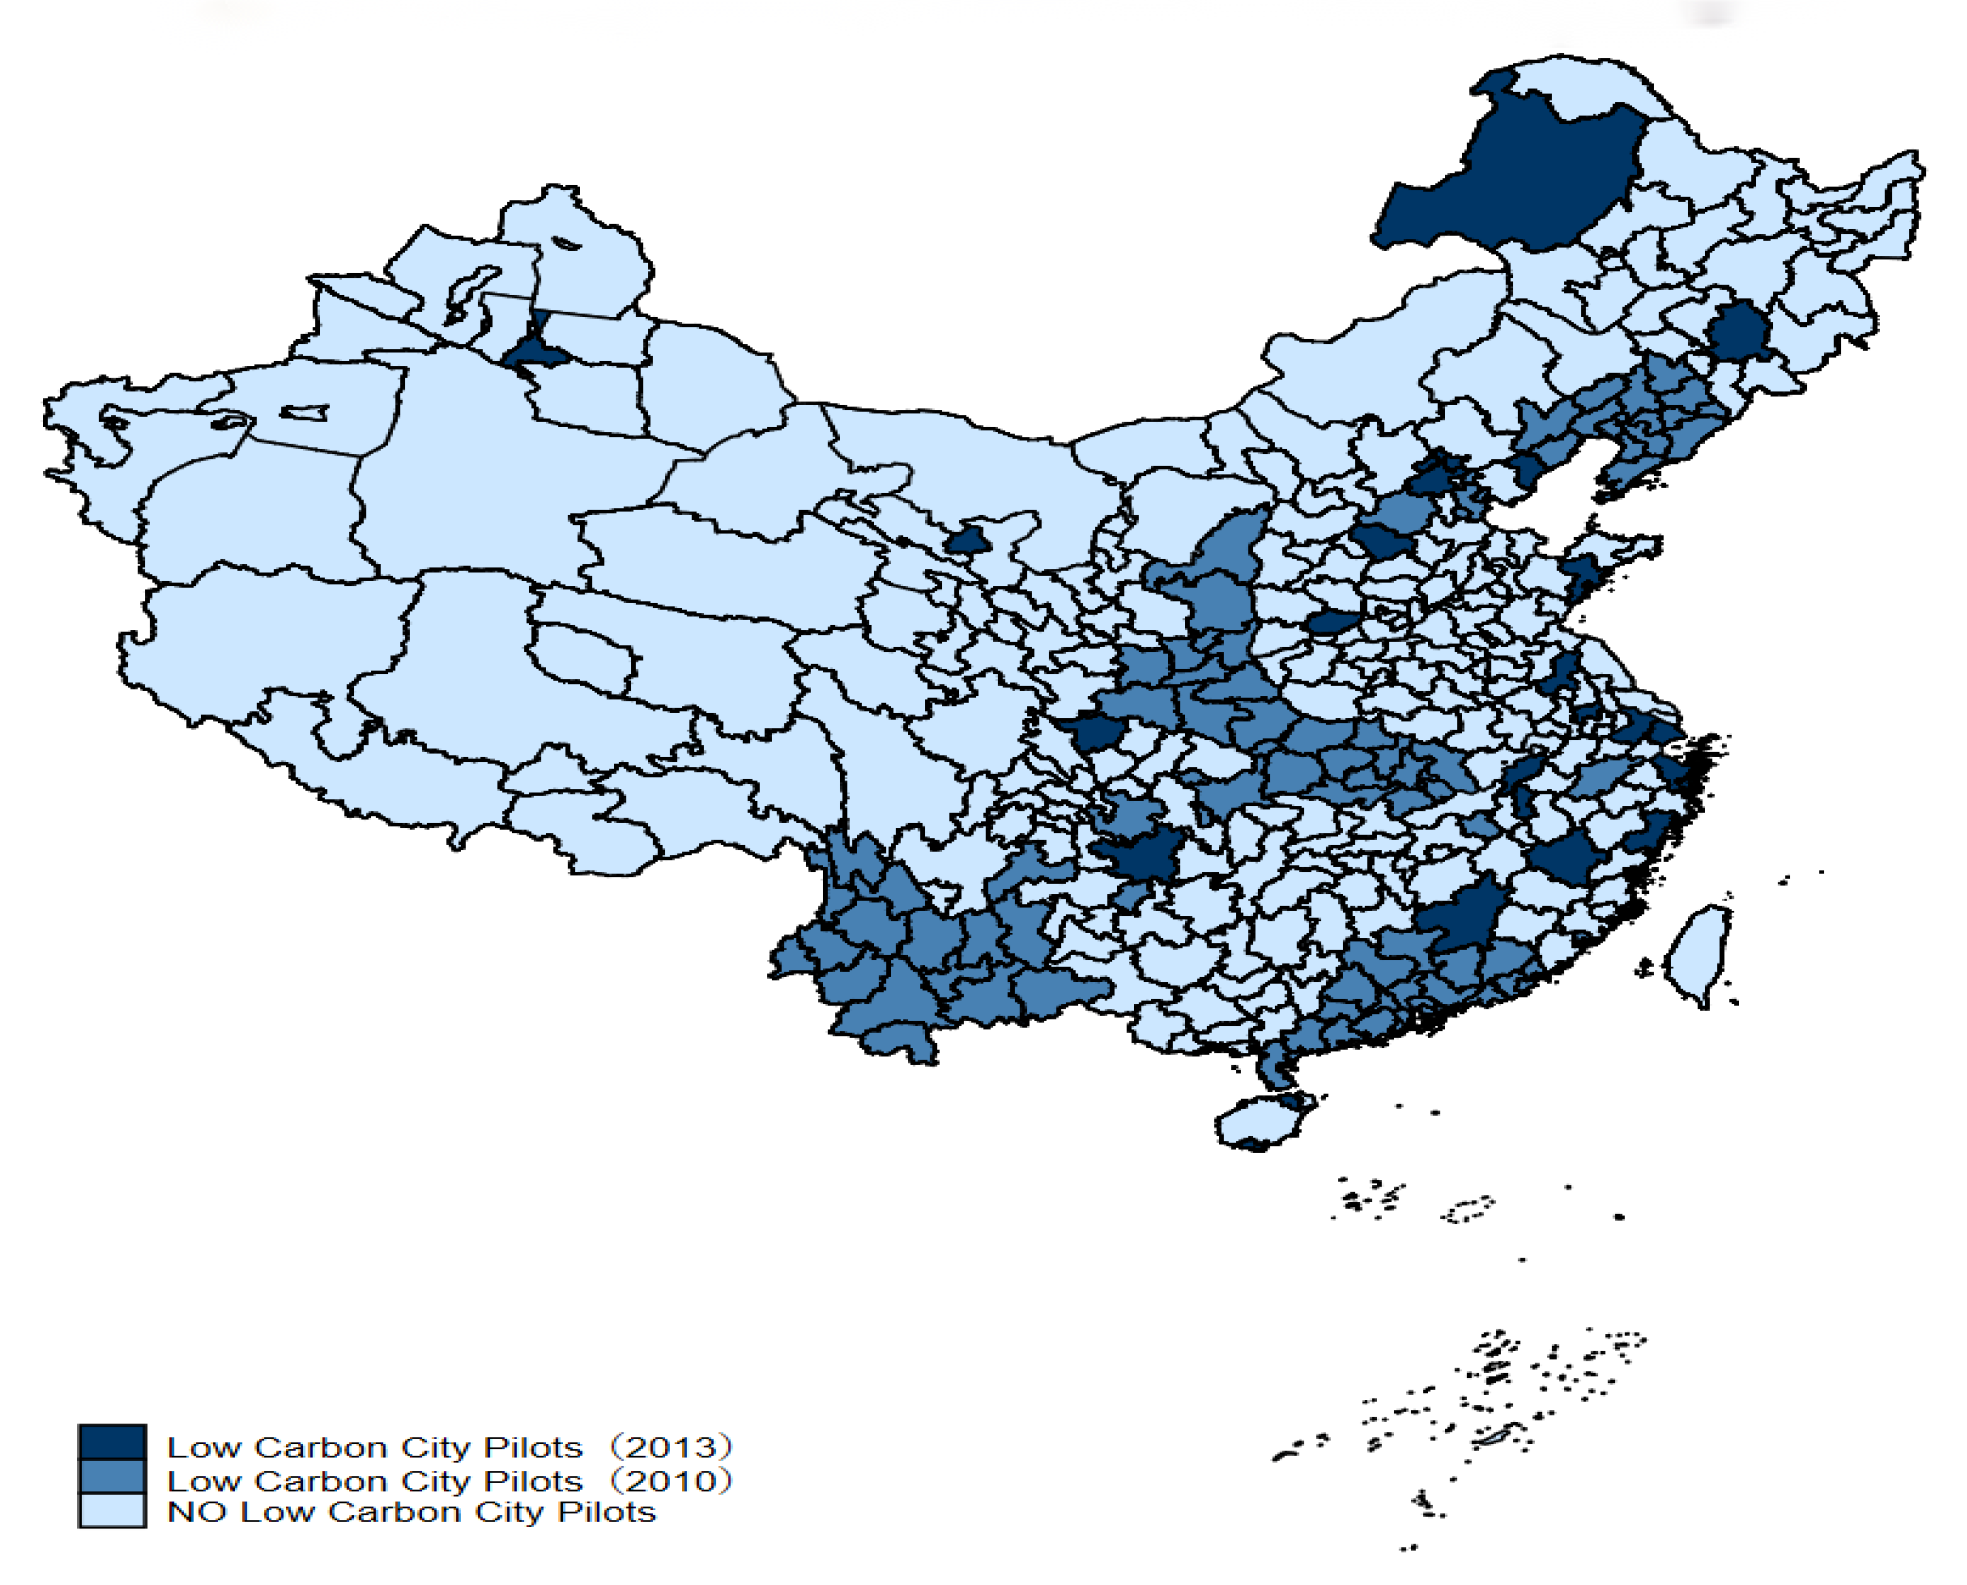
In pursuit of the target to limit carbon emissions, China has introduced a whole set of measures to boost carbon emissions cuts. LCCP is seen as an important policy for China to realize CO
2 cut targets. NDRC published the first announcements of LCCP in 2010 including eight cities and five provinces, while NDRC published the second announcement of LCCP in 2013 containing thirty-three cities and a province. The particular geographical distribution is presented in
Figure 1.
It needs to be explained that China announced the third batch of LCCP in 2017. Due to the current time node, we can only collect data on the cities’ carbon emissions up to 2019; the time frame of the data is too short to fully verify the policy effects of the third batch of LCCP in 2017. So, this paper does not empirically test the policy effect of the third batch of LCCP.
2.2. Mechanism Assumptions
2.2.1. Innovative Carbon Reduction
As shown in
Figure 2, innovative carbon reduction refers to the formation of new technologies, processes, and methods through innovation to replace the original higher carbon emission technologies, achieving lower carbon emission, and zero carbon emission, so far as to negative CO
2 emissions under the premise of achieving the same output.
The notice issued by NDRC requires LCCP’s government departments to accelerate CO
2 cut technology innovation [
16], boost CO
2 cut technologies’ R&D, introduction, and widespread application, and positively promote the transformation and upgrading of the conventional industry with the help of CO
2 cut technology innovation. Meanwhile, government departments ought to track the most recent advancements in CO
2 cut technology, and positively help industrial enterprises learn advanced foreign technology and make independent innovations.
Existing studies have found that technological progress is an effective means to solve the problem of environmental pollution, especially green technology-oriented innovation [
17]. The Porter hypothesis holds that government regulation has a catalytic effect on technological innovation [
18]. Bergek et al. [
19] find that properly designed government regulations can encourage enterprises to carry out environmentally friendly technological innovation and significantly improve their green technology innovation capabilities. Lee and Min [
20] find that green technology innovation can also effectively reduce CO
2. Hence, we believe that China’s economy and energy system are characterized by high carbonization. The government regulations introduced by the LCCP may promote the advancement of production technology and the upgrading of low-carbon environmental protection technologies, thereby helping to reduce CO
2.
Hypothesis 1: LCCP will achieve carbon reduction through technology development.
2.2.2. Productive Carbon Reduction
As shown in
Figure 2, productive carbon reduction refers to the elimination of high resource depletion and high contamination companies, and the decrease of CO
2 emissions through cutting high resource depletion and high contamination production.
NDCR’s document requires government departments of LCCP to play a comprehensive planning guidance role, adjust the industrial structure, and establish target assessment systems to control CO
2 emission, as well as implement a goal accountability system to control CO
2 emission, and allocate emission reduction tasks to the administrative regions under its jurisdiction as well as to key enterprises. Additionally, government departments of LCCP should develop the region’s carbon emission target decomposition and assessment methods and carry out tracking evaluation and emissions abatement assignments completed in time for each assessment responsible body [
21].
There are two main theories related to productive carbon reduction. The first is “follow the cost hypothesis”; government regulation intrinsically reduces production efficiency and profits by internalizing the negative externalities of pollution into production costs and affects the industry structure through enterprise entry and exit, production scale adjustment, and resource reallocation [
22,
23]. The second is the “pollution shelter hypothesis” to evade regulation or reduce the cost of regulation; international differences in environmental standards or the degree of regulation will prompt the transfer of polluting industries across borders, and as a result, it will cause adjustments and changes in the regional industrial structure [
24]. So, in this paper, high-energy-consuming production is divided into two parts. One part is from domestic; we use industrial value added to measure. The other part is from abroad; we use FDI to measure.
Hypothesis 2: LCCP will achieve carbon reduction by reducing high-energy-consuming production.
2.2.3. Efficient Carbon Reduction
As shown in
Figure 2, efficient carbon reduction refers to achieving more outputs with the same amount of carbon emissions or using fewer carbon emissions for the same output by increasing carbon productivity.
NDRC’s document requires government departments of LCCP to improve the resource mix, conserve resources, reduce consumption, enhance efficiency, increase CO2 sinks, and incorporate the idea of low-carbon growth into urbanization construction and management, as well as oversee the planning and construction of a public transportation-led model, building energy efficiency design and evaluation technology, and green infrastructure according to low-carbon concepts, and establishing environmental, financial, and tax policies to improve energy efficiency. For example, improving emission standards for all types of enterprises, giving low-interest loans and financial subsidies to enterprises with obvious emission reduction effects, etc.
Existing research shows that the development and utilization of renewable energy and the acceleration of energy transition are important to reduce CO
2 emissions [
25]. Improvements in energy efficiency are a major factor in reducing carbon emissions from China’s transportation sector [
26]. Yao et al. [
27] find that there are large differences in energy efficiency between provinces in China and improving the energy efficiency of low-energy efficiency provinces will have a greater effect on China’s carbon emission reduction. Akram et al. [
28] find that energy efficiency is an important factor in the formation of the environmental Kuznets curve in developing countries.
Hypothesis 3: LCCP will achieve carbon reduction through energy efficiency.
2.2.4. Synergistic Carbon Reduction
As shown in
Figure 2, synergistic carbon reduction means that LCCP can play a better carbon reduction effect with the deep integration of some factors.
This paper argues that the degree of digitalization, marketization, and ecological construction of cities is closely related to LCCP’s CO
2 cut effect. The synergy between the degree of digitization and the construction of LCCP is demonstrated by the need for LCCP to improve the management capacity of low-carbon development. It should improve the digital management structure of low-carbon development, establish a work coordination mechanism, prepare the region’s CO
2 emission list, set up registration, monitoring, and accounting systems for CO
2 emissions data, and strengthen the digital capacity and talent team building of LCCP. Asongu [
29] finds that internet adoption in Africa can open up trade and reduce carbon emissions. Kalmaz and Kirikkaleli [
25] emphasize that building “smart cities” using digital technologies is a viable way to achieve carbon reduction.
The synergy between marketization and the construction of LCCP is demonstrated by the need for LCCP to study the use of a market mechanism to facilitate the application of CO
2 emissions limitation goals. Exploring the systematic mechanism is beneficial to the growth of power saving, emissions control, and low-carbon industries and introducing market-oriented, useful public guidelines, and stimulus policy. Zhang et al. [
30] believe that China should establish a unified carbon trading market so that market mechanisms can play a leading role in carbon emission reduction.
The synergistic effect of environmental protection and LCCP construction is demonstrated by the fact that environmental pollutants and CO
2 emissions have the alike origin and source relationship [
31]. LCCP may have synergistic effects of contamination abatement and CO
2 abatement.
Hypothesis 4: Digitalization, marketization, and environmental pollution control may have strong synergistic effects with LCCP.
3. Methodology and Data
3.1. Data
This text applies panel data from China’s 280 towns from 2006 until 2016 to assess LCCP’s CO
2 emissions decrease effects. CO
2 emissions data in cities originate domain from CEADs [
32]. PM2.5 originate from the Chinese Environment Database (CEDS). Other data originate from the “China Energy Statistical Yearbook”, “Urban Statistical Yearbook of China”, “China Statistical Yearbook for Regional Economy”, and “China Industrial Statistical Yearbook”.
3.2. Identification Strategy
Since the first and second batches of LCCP were launched at different times, this paper uses a multi-period
DID approach to estimate LCCP’s influence on CO
2 emission. Controlling other factors constantly, multi-period
DID can examine the gap in carbon emissions between experimental regions and non-experimental regions and changes before and after the practice of LCCP. The multi-period
DID models have been designed as below:
Our text also utilizes the PSM-DID approaches to mitigate the endogenous problems caused by selection bias. The multi-period PSM-DID model is defined as follows:
As shown in the above formula, subscripts i and t indicate region and time, and LnCO2 denotes the carbon emissions. DID = treatmenti × postit; they are all dummy variables with a number of 1 or 0, treatmenti = 1 means that it is LCCP, and treatmenti = 0 means that it is not LCCP. postit = 1 means that it is after the practice of LCCP including the first and second batches, and the rest are defined as 0. Xit is a series of controlled variables. denotes regional fixed-effects, denotes the time fixed-effects, and denotes errors. In addition, to address potential serial correlation and heteroskedasticity, this paper reports on the robust standard error with city clustering; if LCCP significantly reduces local carbon emissions, then ɑ1 is significantly negative.
3.3. Key Variables and Measurement
Explained variables and explanatory variables. The explained variables are CO2 emission and CO2 intensity, both taking logarithmic form (lnCO2, lncogdp); urban GDP for carbon intensity is the real urban GDP at constant 2006 prices. The explanatory variable is DID, which is whether to start LCCP development.
Control variable. Urban carbon emissions are closely related to economic level, economic structure, city size, financial strength, and resource endowment. We need to control these variables to ensure the comparability of carbon emissions between cities. Canadell et al. [
33] prove that economic growth has led to a rapid rise in atmospheric CO
2 concentrations; we use the logarithm of urban GDP (lngdp) and the square of GDP (lngdp2) to weigh the standard of urban economic growth. Cheng et al. [
34] find that industrial structure is an important factor affecting CO
2; this paper utilizes the proportion of secondary industry’s ratio (strind) to weigh the industrial structure of a city. Zhu and Peng [
35] find that population has a large impact on CO
2; we measure the size of the city by the total population’s logarithm (lnpop). Wang et al. [
36] find that government finances can affect carbon emissions through economic development and industrial structure; we use fiscal revenue as a percentage of GDP (strpub) to measure the financial strength of a city. Chuai et al. [
37] find that land use is a major source of anthropogenic CO
2; we use administrative area (lnarea) to measure the land resources of a city. The results of critical variables’ descriptive analysis are displayed in
Table 1.
In
Table 2, by contrasting the carbon emissions between the treatment and control groups and the fourth policy carry out, this paper discovers that the rise in CO
2 emission, before and after the policy in the treatment groups, is smaller than that of the control groups, indicating that LCCP construction has dampening effects on carbon emissions.
4. Empirical Study
4.1. Baseline Regression Result
Our article first utilizes
DID approaches to evaluate the carbon reduction effects of LCCP; benchmark regression result is displayed in
Table 3 and all regression results are in control for year fixed-effects and city fixed-effects. In the first column of
Table 3, we did not add any control variables, the
DID coefficient value is −0.029, and it is significant at the level of 5%. In columns (2)–(5) of
Table 3, we gradually add control variables, the
DID coefficients are all negatively significant above the level of 10%, and the regression coefficient is around −0.026, which means that the LCCP may decrease CO
2 emissions by around 2.6% per year on average. The control variable’s coefficient shows that urban GDP displays a reversed U-type relationship with CO
2 emission, and both the urban population and industrial structure are positively correlated with CO
2 emission.
4.2. Parallel Trend Test
Drawing on [
38], we examine the common trends hypothesis and analyze the dynamic effect of policy based on an event analysis approach. This paper takes the previous year of LCCP practice as a benchmark and constructs the interaction term of the time dummy variable and region dummy variable for 3 years back, the current year, and 3 years forth LCCP practice.
As displayed in
Table 4 and
Figure 3, none of the regression coefficients before the implementation of the LCCP passed significant testing, which indicates that carbon emission changes in the experimental and control group back LCCP practice satisfies the common trends assumption. The coefficients for both the year of LCCP implementation and the three years after implementation are negatively significant above the level of 5%, and in terms of regression coefficients and significance levels, the carbon reduction effect of the third year after LCCP practice has strengthened, meaning that LCCP is increasingly well established.
We also plotted the time trend of the treatment group and the control group in
Figure 4. As can be seen in
Figure 4, the treatment and control groups maintained a similar growth trend until the policy point in time. After the implementation of the policy, CO
2 in the treatment group began to decline, compared with those of the control group.
4.3. PSM-DID
We utilize the PSM-DID approach to solve endogenous problems caused by selection bias [
39]. We utilize control variables used in the baseline regression as covariates, apply a logit model for propensity score estimation, and perform caliper nearest neighbor matching. The nuclear density curve is shown in
Figure 5. We can see that without matching, the Kernel Density curve is not similar between the experimental group and control group, while after matching, the Kernel Density curve is very similar, which indicates the effects of PSM seems well.
Utilizing the post-PSM samples, the outcomes of
DID regression are displayed in
Table 5. We find that the PSM-DID coefficients are negatively significant at the level of 5% and PSM-DID’s coefficient is 0.003 larger than
DID. It suggests that LCCP’s CO
2 decrease effects are somewhat underestimated and the basic regression results of this paper are robust.
4.4. Placebo Test
To enhance the credibility of benchmark regression outcomes, this paper also needs to perform the placebo test. As shown in
Table 6, this paper front-loaded LCCP’s timing for the placebo test and set 2007, 2008, and 2015 as dummy policy years instead of real policy years. The outcomes display that none of the coefficients for fictitious years are significant.
As shown in
Table 7, we replace samples for the placebo test and compress the sample time window to examine the stability of the empirical outcomes in this paper. The empirical outcomes indicate that the carbon reduction effect of LCCP is still significant when we compress the sample time window.
4.5. Robustness Tests
We utilize substituting the dependent variable approach to conduct a robustness test. CO
2 intensity means the relative amount of CO
2 emission per unit of GDP; we can also use the carbon intensity to measure carbon emissions in cities. The outcomes in
Table 8 indicate that LCCP’s effect on CO
2 intensity is also significantly negative.
This paper uses different estimation methods to perform robustness tests. As shown in
Table 9, we ran regressions with fixed effects, random effects, maximum likelihood estimation, and population-averaged models. The outcomes suggest each coefficient is negatively significant.
This paper also performs robustness checks by excluding the effects of contemporaneous related policies. The trial of emission rights trading started in 2007, and the regional power conservation and emissions decrease targets under the five-year plans may affect carbon emissions in LCCP. In column 1 of
Table 10, this paper regresses only samples in pilot cities of emission rights trading. In column 2 of
Table 10, we add the interaction term between the region’s energy reduction target and year as control variables, excluding effects from key control cities’ carbon targets. The outcomes indicate that the effect of LCCP on CO
2 emission is still negatively significant after excluding the effect of related policies.
5. Mechanism Testing
From the above empirical results, we demonstrate that LCCP does have a significant carbon reduction effect. To achieve excellent results in the construction of LCCP, we also need to understand which mechanisms are used in LCCP to achieve carbon emission reductions. This paper utilizes mediation models to examine the mechanism [
40]; the mechanism validation model settings are listed below.
Step 1: Check LCCP’s impacts on carbon emission.
Step 2: Check LCCP’s impacts on mechanisms.
Step 3: Add mechanisms to the baseline regression.
We use R&D expenditure (R&D) to measure innovative carbon reduction [
41]. We use energy intensity to measure efficient carbon reduction. We use the logarithm of industrial value added (Lnind) to measure productive carbon reduction from domestic. This paper utilizes the logarithm of FDI (Lnfdi) to evaluate productive carbon reduction from abroad.
The outcomes of mechanisms validation are shown in
Table 11. In columns (1), (3), (5), and (7), we can find that the LCCP significantly increases the cities’ R&D investment and significantly decreases energy consumption intensity, foreign direct investment, and industrial value added. In columns (2), (4), (6), and (8), we can find that the coefficient of
DID becomes insignificant after adding R&D investment, energy consumption intensity, and foreign direct investment to the regression; this shows that LCCP mainly reduces carbon emissions by improving investment in R&D and innovation, energy use efficiency, and decreasing high-emission foreign direct investment. However, the coefficient of
DID changes less and is still significant, indicating that the reduction in industrial value added of LCCP is not effective in reducing carbon emissions.
6. Heterogeneity Analysis
The effect of CO
2 emissions in cities is closely related to the scale of cities [
42]; to test the scale effect of LCCP, we analyze the heterogeneity of carbon emission LCCP’s CO
2 decrease effects based on city size. We use the city’s resident population as the statistical caliber and divide the city into four categories: Small and medium-sized city, Model II big city, Model I big city, and Super-large city.
On the one hand, small cities may easily achieve economic, industrial, and energy structure promotion and upgrade, leading to a good CO2 reduction effect. However, there may be an insufficient scale effect and a higher average cost of carbon reduction. On the other hand, R&D funding in large cities may be more than adequate and the application of green technology innovation may have a larger-scale effect. However, there may face a large conflict between carbon reduction and economic development.
The grouped outcomes in
Table 12 indicate that the carbon reduction effects of LCCP present nonlinear relationships with city size. It shows an inverted U-shape relationship; LCCP’s CO
2 decrease effects rise and then fall as the size of the city increases. The heterogeneity of city size also further validates the results of this paper’s mechanism test, where LCCP is mainly through R&D funding and energy efficiency improvement to achieve carbon emission reduction.
In this paper, we also want to discuss the influence of digitalization and marketization on LCCP construction and the synergy effects of CO
2 decrease and contamination reduction. We use the percentage of Internet users to evaluate the cities’ digitalization. We utilize IndexMar [
43] and the share of SOEs to evaluate the marketization level of cities. This paper used SO
2 and PM2.5 concentrations to evaluate the cities’ environments. Then, we grouped the samples based on the median; the outcomes are displayed in
Table 13 and tested synergistic effects using a moderation-effect model are shown in
Table 14. It indicates that high digitization and marketization are conducive to the CO
2 decrease effects of LCCP. LCCP has a strong synergistic effect on CO
2 decrease and pollution reduction.
7. Conclusions and Policy Implication
LCCP is a practical exploration of China’s green low-carbon growth. Using China’s samples of 280 towns from 2006 to 2016, this paper finds that LCCP can significantly reduce urban CO2 emission. The LCCP works through three mechanisms to realize urban carbon reduction including innovating low-carbon production technology, improving energy use efficiency, and restricting investment in the high carbon industry. In restricting investment in the high carbon industry, LCCP plays a strong role in limiting foreign high-energy investments and a weaker role in limiting domestic high-energy investments. We also find that LCCP’s carbon reduction effects display the inverse U-shape relationship with city size. Digitalization and marketization of cities have a strong synergy with LCCP. LCPP also has a significant pollution reduction effect.
The policy recommendations in this article are as follows: (1) LCCP can indeed reduce carbon emissions. As a new type of urban development model, LCCP provides feasible ideas for resolving the tension between urban development, resource conservation, and environmental protection. LCCP should consider both low-carbon production and low-carbon consumption. Building LCCP is key to achieving carbon neutrality. The government departments of many developing countries should formulate green low-carbon development plans, establish a carbon-neutral indicator system, and establish a carbon emission accounting platform to build a low-carbon city. (2) Government departments should be aware that there is some conflict between economic development and LCCP; the low-carbon transition should be achieved on the premise of ensuring GDP growth. Therefore, productive carbon reduction has greater resistance, and innovative carbon reduction and efficient carbon reduction may be a more useful path. The choice of low-carbon transition strategy should be achieved by innovating green technology, reducing the energy intensity (energy saving), and improving the energy mix (by increasing the share of clean energy in the energy consumption structure). (3) LCCP should pay more attention to the promotion of digitalization and marketization and reinforce the synergy effects of carbon reduction and pollution reduction. For Super-large cities, vigorously developing renewable energy and increasing investment in research and development are effective ways to reduce emissions; for big cities, optimizing the industrial structure and improving the quality of urbanization are the keys to reducing carbon emissions; for small and medium-sized cities, to achieve low-carbon development, it is necessary to accelerate the elimination of backward production capacity and accelerate industrial upgrading and transformation based on promoting economic growth.
Author Contributions
Conceptualization, H.W.; methodology, H.W.; software, H.W.; validation, H.W.; formal analysis, C.C.; investigation, C.C.; resources, D.L.; data curation, Z.X.; writing—original draft preparation, H.W.; writing—review and editing, H.W.; visualization, H.W.; supervision, Z.X.; project administration, D.L.; funding acquisition, H.W. All authors have read and agreed to the published version of the manuscript.
Funding
This research was funded by [National Social Science Foundation of China] grant number [No. 20BJL131].
Institutional Review Board Statement
Not applicable.
Informed Consent Statement
Not applicable.
Data Availability Statement
The data underlying this article will be shared on reasonable request to the corresponding author (
[email protected]).
Conflicts of Interest
The authors declare no conflict of interest.
References
- Cai, W.; Song, X.; Zhang, P.; Xin, Z.; Zhou, Y.; Wang, Y.; Wei, W. Carbon emissions and driving forces of an island economy: A case study of Chongming Island, China. J. Clean. Prod. 2020, 254, 120028. [Google Scholar] [CrossRef]
- Khanna, N.; Fridley, D.; Hong, L. China’s pilot low-carbon city initiative: A comparative assessment of national goals and local plans. Sustain. Cities Soc. 2014, 12, 110–121. [Google Scholar] [CrossRef]
- Zhang, P.; Cai, W.; Yao, M.; Wang, Z.; Yang, L.; Wei, W. Urban carbon emissions associated with electricity consumption in Beijing and the driving factors. Appl. Energy 2020, 275, 115425. [Google Scholar] [CrossRef]
- Cai, B.; Cui, C.; Zhang, D.; Cao, L.; Wu, P.; Pang, L.; Zhang, J.; Dai, C. China city-level greenhouse gas emissions inventory in 2015 and uncertainty analysis. Appl. Energy 2019, 253, 113579. [Google Scholar] [CrossRef]
- Dhakal, S. Urban energy use and carbon emissions from cities in China and policy implications. Energy Policy 2009, 37, 4208–4219. [Google Scholar] [CrossRef]
- Yang, L.; Li, Y. Low-carbon City in China. Sustain. Cities Soc. 2013, 9, 62–66. [Google Scholar] [CrossRef]
- Cheng, J.; Yi, J.; Dai, S.; Xiong, Y. Can low-carbon city construction facilitate green growth? Evidence from China’s pilot low-carbon city initiative. J. Clean. Prod. 2019, 231, 1158–1170. [Google Scholar] [CrossRef]
- Hung, C.C.-W.; Hsu, S.-C.; Cheng, K.-L. Quantifying city-scale carbon emissions of the construction sector based on multi-regional input-output analysis. Resour. Conserv. Recycl. 2019, 149, 75–85. [Google Scholar] [CrossRef]
- Price, L.; Zhou, N.; Fridley, D.; Ohshita, S.; Lu, H.; Zheng, N.; Fino-Chen, C. Development of a low-carbon indicator system for China. Habitat Int. 2013, 37, 4–21. [Google Scholar] [CrossRef] [Green Version]
- Tan, S.; Yang, J.; Yan, J.; Lee, C.; Hashim, H.; Chen, B. A holistic low carbon city indicator framework for sustainable development. Appl. Energy 2017, 185, 1919–1930. [Google Scholar] [CrossRef]
- Wang, Y.; Lan, Q.; Jiang, F.; Chen, C. Construction of China’s low-carbon competitiveness evaluation system: A study based on provincial cross-section data. Int. J. Clim. Chang. Strateg. Manag. 2019, 12, 74–91. [Google Scholar] [CrossRef]
- Yu, Y.; Zhang, N. Low-carbon city pilot and carbon emission efficiency: Quasi-experimental evidence from China. Energy Econ. 2021, 96, 105125. [Google Scholar] [CrossRef]
- Qiu, S.; Wang, Z.; Liu, S. The policy outcomes of low-carbon city construction on urban green development: Evidence from a quasi-natural experiment conducted in China. Sustain. Cities Soc. 2021, 66, 102699. [Google Scholar] [CrossRef]
- Chen, H.; Guo, W.; Feng, X.; Wei, W.; Liu, H.; Feng, Y.; Gong, W. The impact of low-carbon city pilot policy on the total factor productivity of listed enterprises in China. Resour. Conserv. Recycl. 2021, 169, 105457. [Google Scholar] [CrossRef]
- Shan, Y.; Guan, D.; Liu, J.; Mi, Z.; Liu, Z.; Liu, J.; Schroeder, H.; Cai, B.; Chen, Y.; Shao, S.; et al. Methodology and applications of city level CO2 emission accounts in China. J. Clean. Prod. 2017, 161, 1215–1225. [Google Scholar] [CrossRef] [Green Version]
- Tie, M.; Qin, M.; Song, Q.; Qi, Y. Why does the behavior of local government leaders in low-carbon city pilots influence policy innovation? Resour. Conserv. Recycl. 2020, 152, 104483. [Google Scholar] [CrossRef]
- Herdt, R.W. A Retrospective View of Technological and Other Changes in Philippine Rice Farming, 1965–1982. Econ. Dev. Cult. Chang. 1987, 35, 329–349. [Google Scholar] [CrossRef]
- Porter, M.E.; van der Linde, C. Toward a New Conception of the Environment-Competitiveness Relationship. J. Econ. Perspect. 1995, 9, 97–118. [Google Scholar] [CrossRef] [Green Version]
- Bergek, A.; Berggren, C. The impact of environmental policy instruments on innovation: A review of energy and automotive industry studies. Ecol. Econ. 2014, 106, 112–123. [Google Scholar] [CrossRef] [Green Version]
- Lee, K.-H.; Min, B. Green R&D for eco-innovation and its impact on carbon emissions and firm performance. J. Clean. Prod. 2015, 108, 534–542. [Google Scholar] [CrossRef]
- Wang, R.; Liu, W.; Xiao, L.; Liu, J.; Kao, W. Path towards achieving of China’s 2020 carbon emission reduction target—A discussion of low-carbon energy policies at province level. Energy Policy 2011, 39, 2740–2747. [Google Scholar] [CrossRef]
- Dean, T.J.; Brown, R.L. Pollution Regulation as a Barrier to New Firm Entry: Initial Evidence and Implications for Future Research. Acad. Manag. J. 1995, 38, 288–303. [Google Scholar] [CrossRef]
- Millimet, D.L.; Roy, S.; Sengupta, A. Environmental Regulations and Economic Activity: Influence on Market Structure. Annu. Rev. Resour. Econ. 2009, 1, 99–118. [Google Scholar] [CrossRef] [Green Version]
- Zheng, D.; Shi, M. Multiple environmental policies and pollution haven hypothesis: Evidence from China’s polluting industries. J. Clean. Prod. 2017, 141, 295–304. [Google Scholar] [CrossRef]
- Kalmaz, D.B.; Kirikkaleli, D. Modeling CO2 emissions in an emerging market: Empirical finding from ARDL-based bounds and wavelet coherence approaches. Environ. Sci. Pollut. Res. 2019, 26, 5210–5220. [Google Scholar] [CrossRef] [PubMed]
- Yu, Y.; Li, S.; Sun, H.; Taghizadeh-Hesary, F. Energy carbon emission reduction of China’s transportation sector: An input–output approach. Econ. Anal. Policy 2021, 69, 378–393. [Google Scholar] [CrossRef]
- Yao, X.; Zhou, H.; Zhang, A.; Li, A. Regional energy efficiency, carbon emission performance and technology gaps in China: A meta-frontier non-radial directional distance function analysis. Energy Policy 2015, 84, 142–154. [Google Scholar] [CrossRef]
- Akram, R.; Chen, F.; Khalid, F.; Ye, Z.; Majeed, M.T. Heterogeneous effects of energy efficiency and renewable energy on carbon emissions: Evidence from developing countries. J. Clean. Prod. 2019, 247, 119122. [Google Scholar] [CrossRef]
- Asongu, S.A. ICT, openness and CO2 emissions in Africa. Environ. Sci. Pollut. Res. 2018, 25, 9351–9359. [Google Scholar] [CrossRef] [Green Version]
- Zhang, W.; Li, J.; Li, G.; Guo, S. Emission reduction effect and carbon market efficiency of carbon emissions trading policy in China. Energy 2020, 196, 117. [Google Scholar] [CrossRef]
- Qian, H.; Xu, S.; Cao, J.; Ren, F.; Wei, W.; Meng, J.; Wu, L. Air pollution reduction and climate co-benefits in China’s industries. Nat. Sustain. 2021, 4, 417–425. [Google Scholar] [CrossRef]
- Shan, Y.; Liu, J.; Liu, Z.; Shao, S.; Guan, D. An emissions-socioeconomic inventory of Chinese cities. Sci. Data 2019, 6, 190027. [Google Scholar] [CrossRef] [PubMed] [Green Version]
- Canadell, J.G.; Le Quéré, C.; Raupach, M.R.; Field, C.B.; Buitenhuis, E.T.; Ciais, P.; Conway, T.J.; Gillett, N.P.; Houghton, R.A.; Marland, G. Contributions to accelerating atmospheric CO2 growth from economic activity, carbon intensity, and efficiency of natural sinks. Proc. Natl. Acad. Sci. USA 2007, 104, 18866–18870. [Google Scholar] [CrossRef] [Green Version]
- Cheng, Z.; Li, L.; Liu, J. Industrial structure, technical progress and carbon intensity in China’s provinces. Renew. Sustain. Energy Rev. 2018, 81, 2935–2946. [Google Scholar] [CrossRef]
- Zhu, Q.; Peng, X. The impacts of population change on carbon emissions in China during 1978–2008. Environ. Impact Assess. Rev. 2012, 36, 1–8. [Google Scholar] [CrossRef]
- Wang, L.-O.; Wu, H.; Hao, Y. How does China’s land finance affect its carbon emissions? Struct. Chang. Econ. Dyn. 2020, 54, 267–281. [Google Scholar] [CrossRef]
- Chuai, X.; Huang, X.; Wang, W.; Zhao, R.; Zhang, M.; Wu, C. Land use, total carbon emissions change and low carbon land management in Coastal Jiangsu, China. J. Clean. Prod. 2015, 103, 77–86. [Google Scholar] [CrossRef]
- McGavock, T. Here waits the bride? The effect of Ethiopia’s child marriage law. J. Dev. Econ. 2021, 149, 102580. [Google Scholar] [CrossRef]
- Heckman, J.J.; Ichimura, H.; Todd, P. Matching As An Econometric Evaluation Estimator. Rev. Econ. Stud. 1998, 65, 261–294. [Google Scholar] [CrossRef]
- Baron, R.M.; Kenny, D.A. The moderator–mediator variable distinction in social psychological research: Conceptual, strategic, and statistical considerations. J. Pers. Soc. Psychol. 1986, 51, 1173–1182. [Google Scholar] [CrossRef]
- Fernández, Y.F.; López, M.F.; Blanco, B.O. Innovation for sustainability: The impact of R&D spending on CO2 emissions. J. Clean. Prod. 2018, 172, 3459–3467. [Google Scholar] [CrossRef]
- Lei, R.; Feng, S.; Lauvaux, T. Country-scale trends in air pollution and fossil fuel CO2 emissions during 2001–2018: Confronting the roles of national policies and economic growth. Environ. Res. Lett. 2020, 16, 014006. [Google Scholar] [CrossRef]
- Fan, G.; Wang, X.; Ma, G. The Contribution of Marketization to China’s Economic Growth. China Econ. 2012, 7, 4. [Google Scholar]
| Disclaimer/Publisher’s Note: The statements, opinions and data contained in all publications are solely those of the individual author(s) and contributor(s) and not of MDPI and/or the editor(s). MDPI and/or the editor(s) disclaim responsibility for any injury to people or property resulting from any ideas, methods, instructions or products referred to in the content. |
© 2023 by the authors. Licensee MDPI, Basel, Switzerland. This article is an open access article distributed under the terms and conditions of the Creative Commons Attribution (CC BY) license (https://creativecommons.org/licenses/by/4.0/).


