
Study on the Correlation between Life Expectancy and the Ecological Environment around the Cities along the Belt and Road

Abstract
:1. Introduction
- (1)
- For research on LE, the spatiotemporal lag is not fully considered, and the results deviate from reality. The impact of related factors on LE should be analyzed by combining time lag and spatial lag;
- (2)
- In terms of research on the relationship between the ecological environment and health, research on the ecological environment and LE of China’s land area in the B&R has not yet been reported;
- (3)
- There are few studies on the ecological environment indicators of China’s land area in the B&R and few studies on the comprehensive ecological indicators.
- (1)
- A time lag spatial crosscorrelation analysis method for the ecological environment and LE of the B&R is proposed for the first time. In this paper, the influence of the ecological environment on the time lag and spatial lag of LE is considered;
- (2)
- This paper reveals the spatial and temporal patterns and laws of the ecological environment and LE of the B&R for the first time. At present, there are not many reports on cities along the B&R in China, and there are few studies on LE in the cities along China’s land area around the B&R. Most of them only focus on the construction of a healthy B&R;
- (3)
- This paper provides a new objective assessment method for the ecological assessment of the B&R area. A remote-sensing comprehensive ecological index (RSCEI) is proposed. Five indicators, i.e., land surface temperature, gross primary productivity, leaf area index, fractional vegetation cover, and ground humidity, were selected to be used for the principal component analysis (PCA) to regress and integrate the comprehensive indicators of the ecological environment of the B&R region during 2010, 2015, and 2020 for an ecological quality assessment, which is more advantageous than a single ecological index.
2. Study Area and Data Preprocessing
2.1. Scope and Overview of the Study Area
2.2. Data Sources
2.2.1. MODIS Remote-Sensing Data
2.2.2. Life Expectancy Data
2.3. Data Preprocessing
3. Methodology
3.1. Construction of the Ecological Indicators
- (1)
- Normalized difference vegetation index (NDVI)
- (2)
- Leaf area index (LAI)
- (3)
- Gross Primary Production (GPP)
- (4)
- Land surface temperature (LST)
- (5)
- Wet
3.2. Calculation of Comprehensive Ecological Score
- (1)
- First, standardize the data, i.e., normalize the data;
- (2)
- Second, establish the correlation coefficient matrix of each index;
- (3)
- Third, calculate the eigenvalues and corresponding eigenvectors;
- (4)
- Fourth, calculate the variance contribution rate and determine the number of principal components, k;
- (5)
- Finally, carry out the weighted summation of the k principal components to obtain the CEI as P, whose expression is Formula (2).
3.3. Trend Analysis
3.4. Cold and Hot Spot Analysis
3.5. Time Lag Spatial Crosscorrelation Analysis
3.5.1. Global Crosscorrelation Analysis
3.5.2. Local Crosscorrelation Analysis
4. Results and Analysis
4.1. CEIs
4.2. Correlation Analysis
4.2.1. Correlation Analysis Results
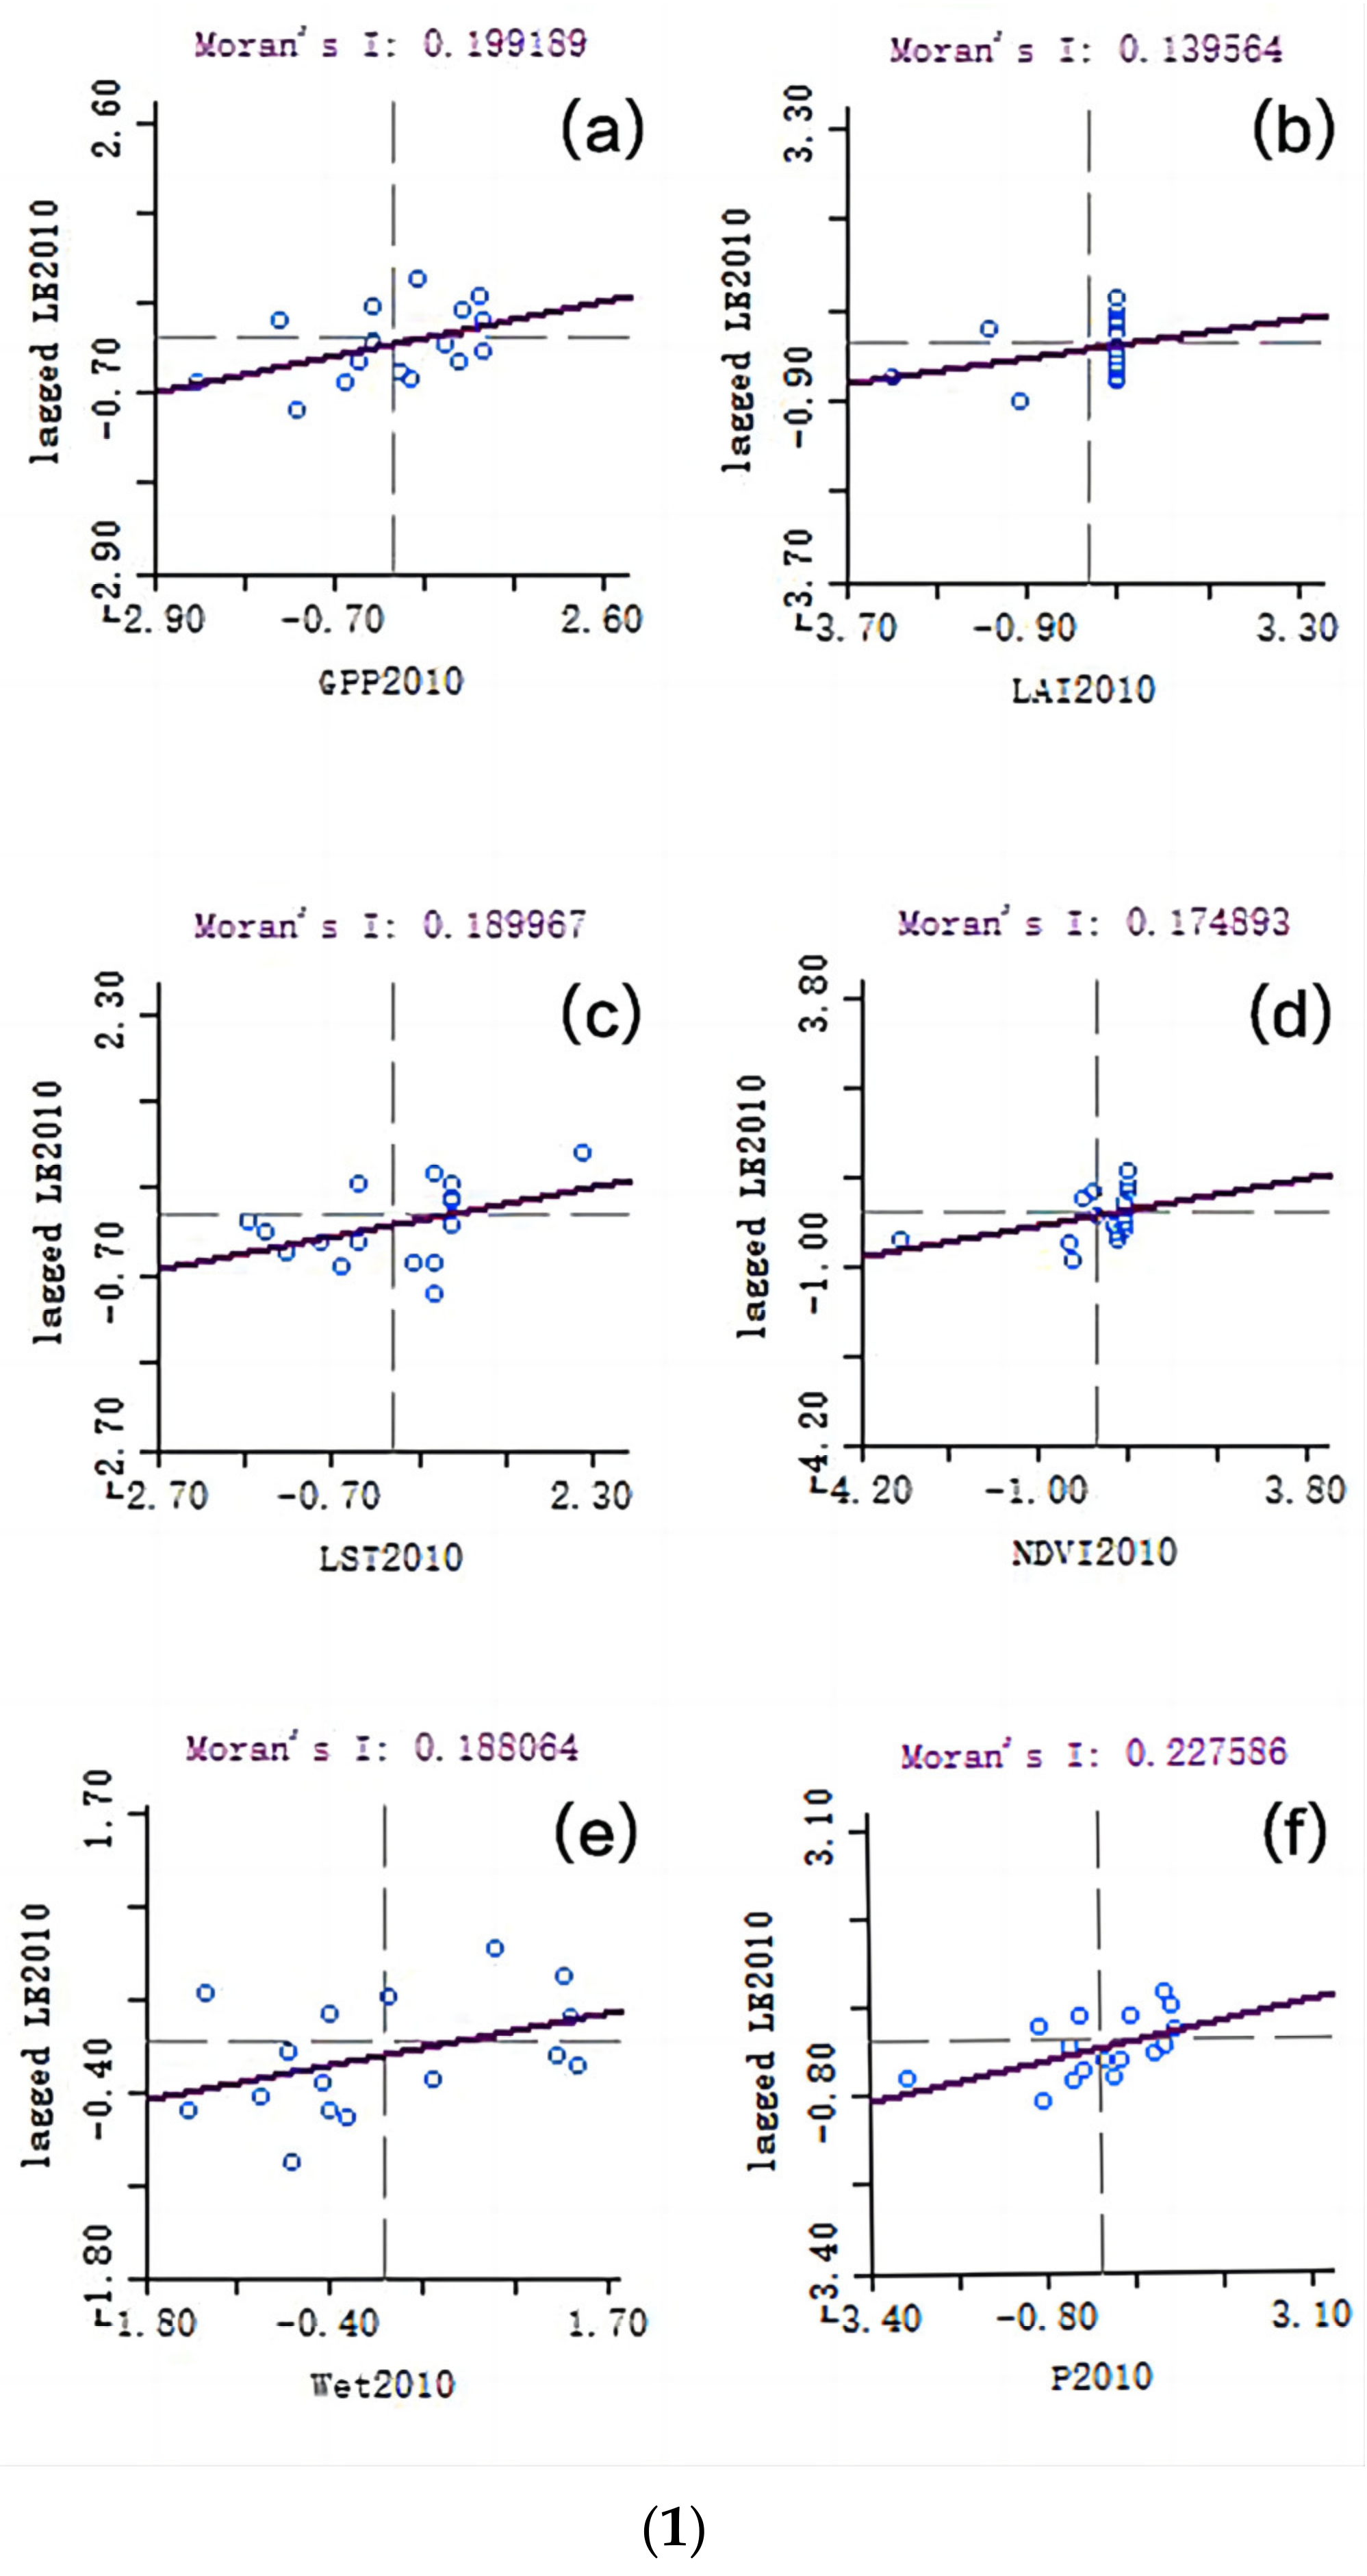
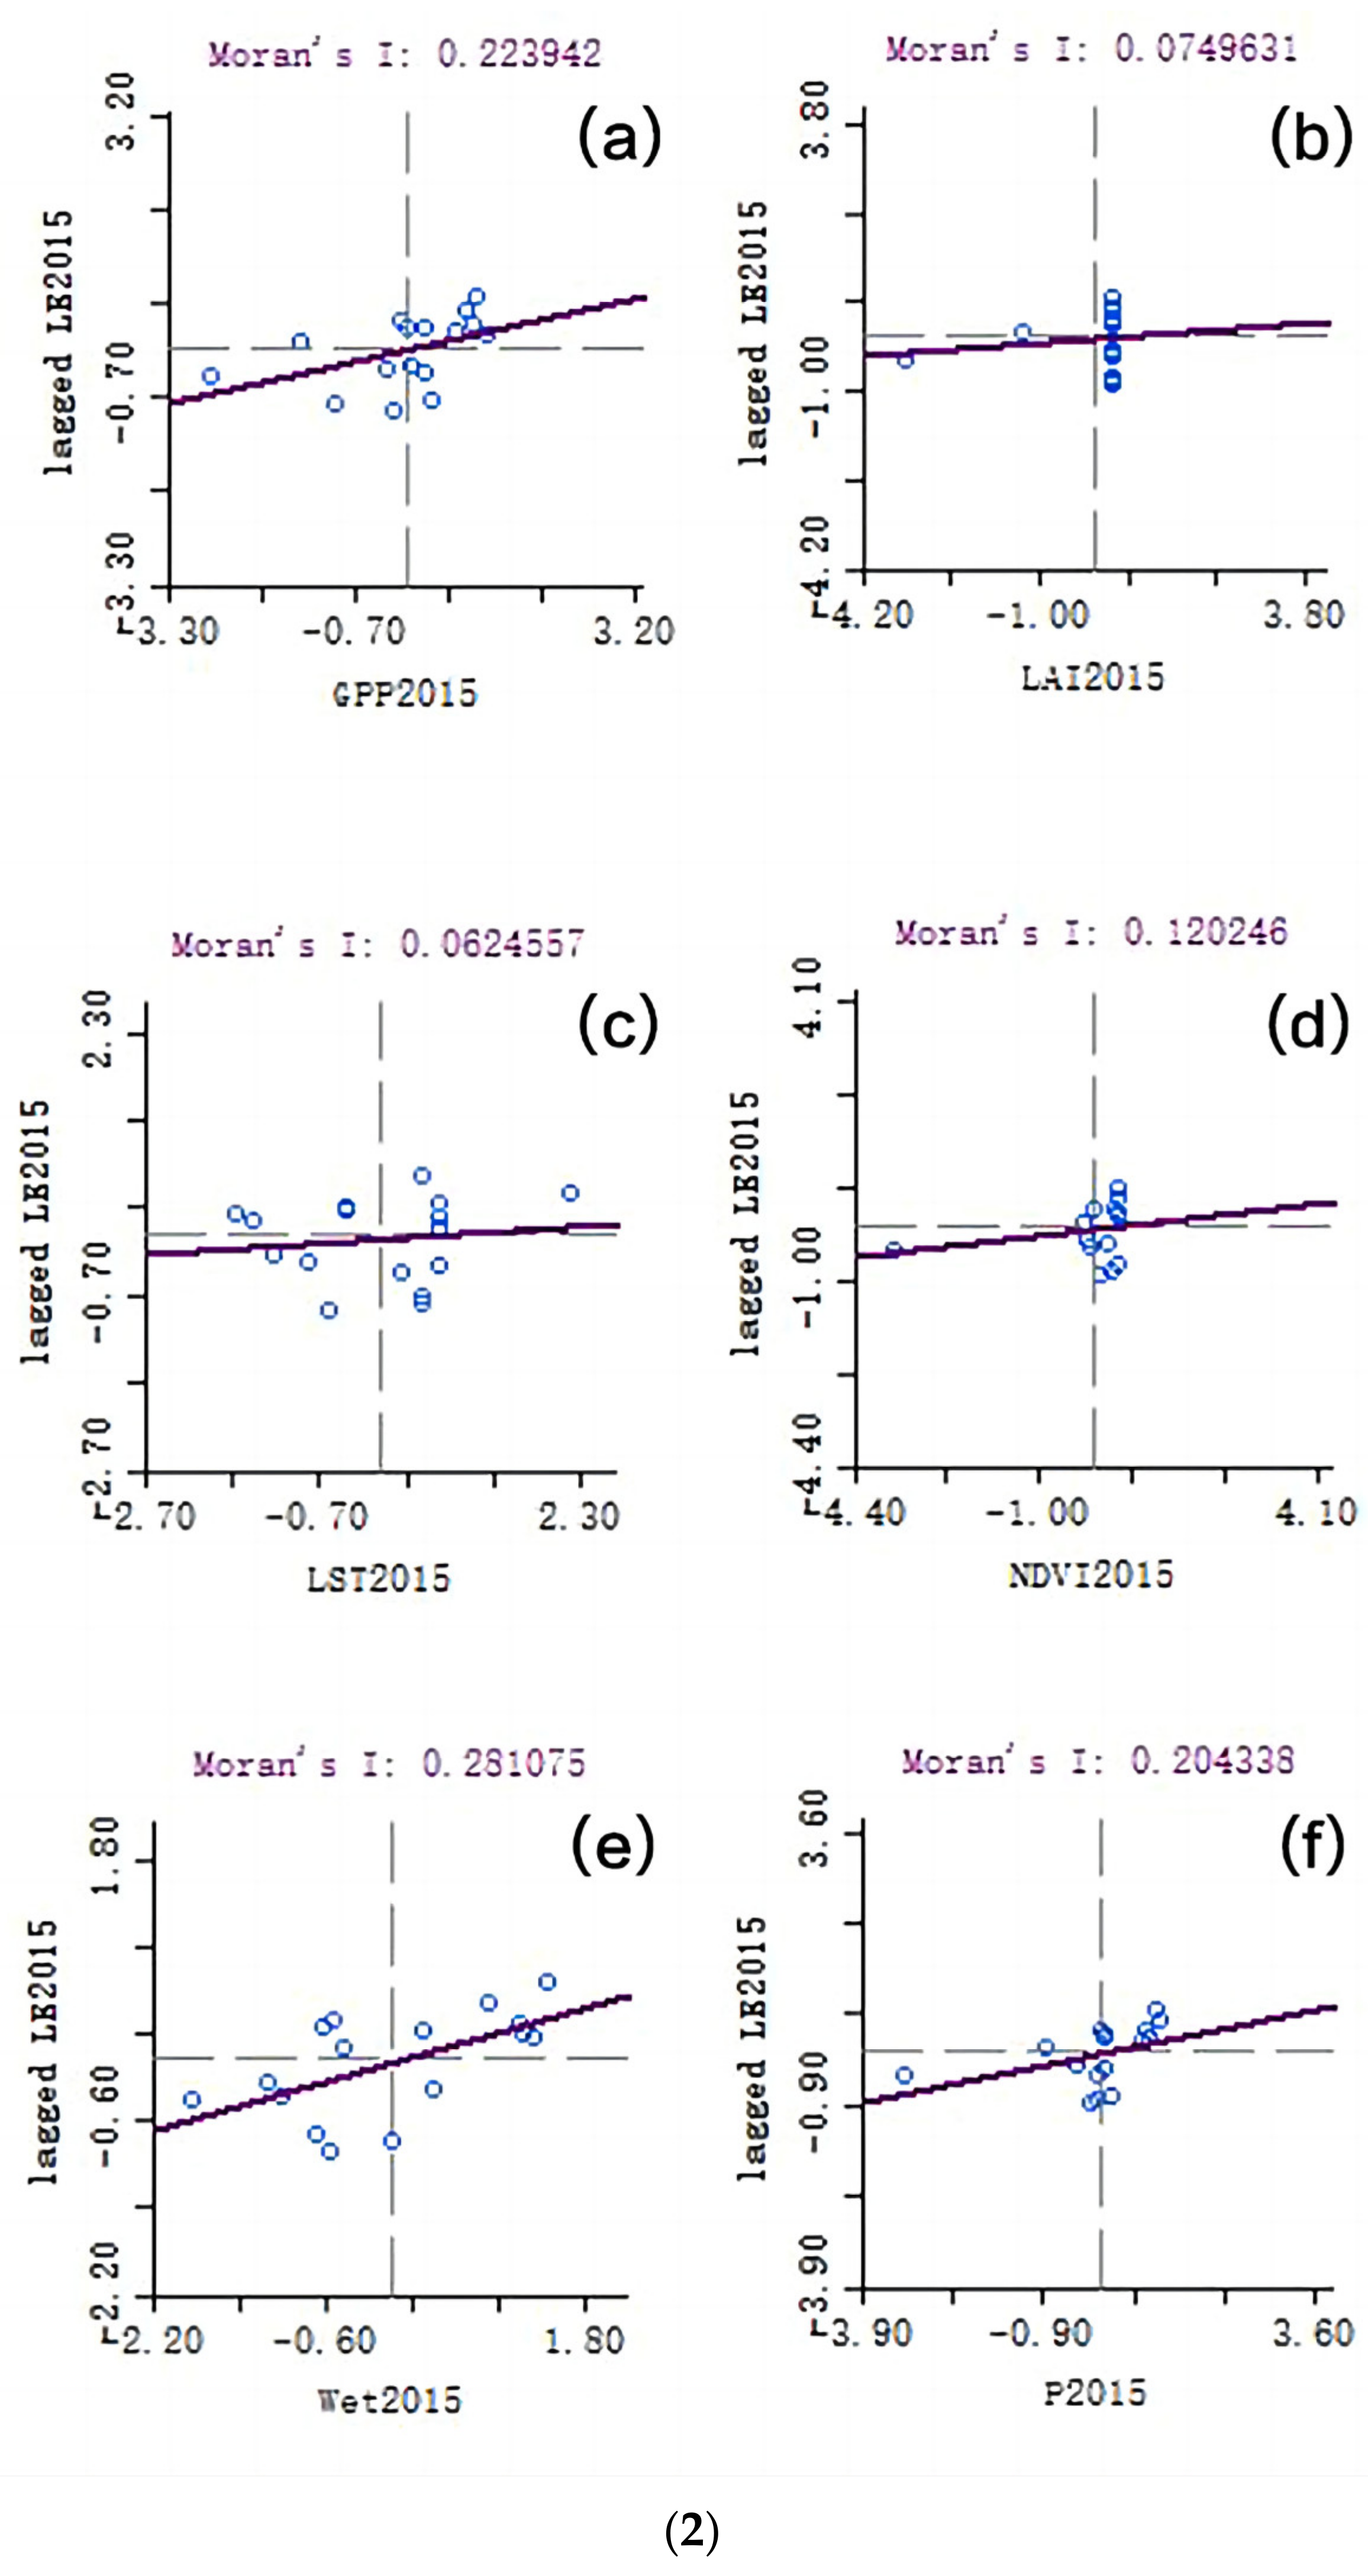
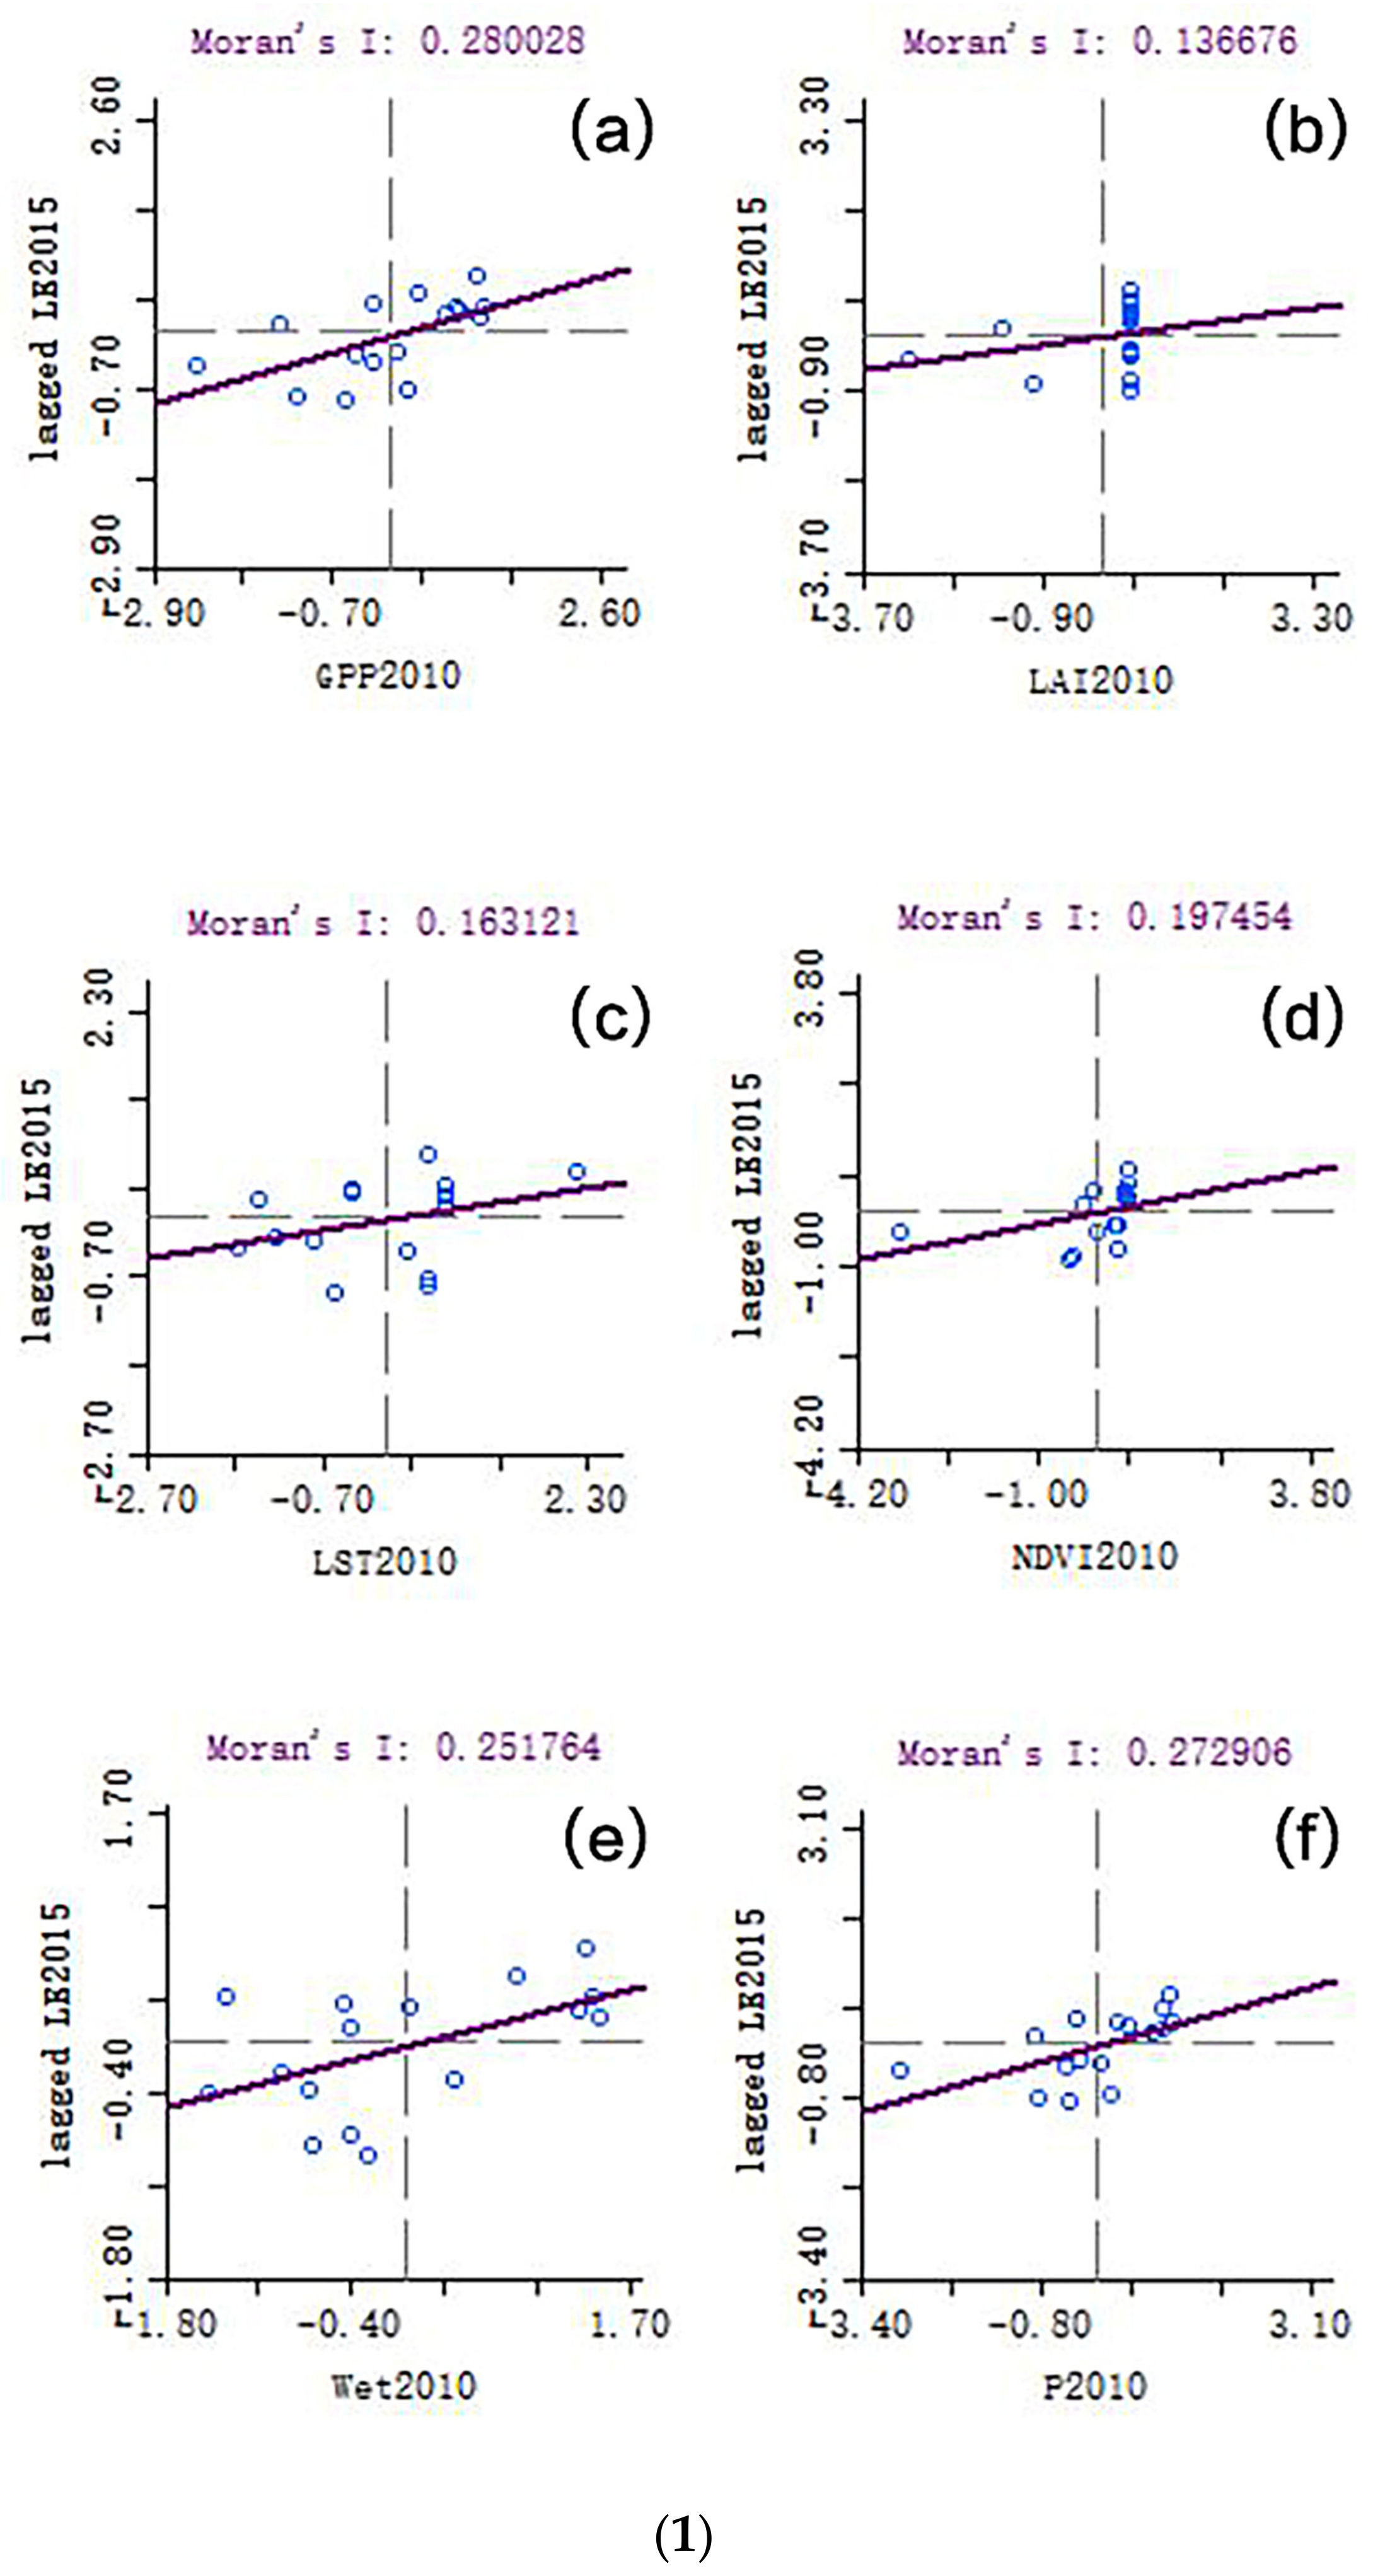
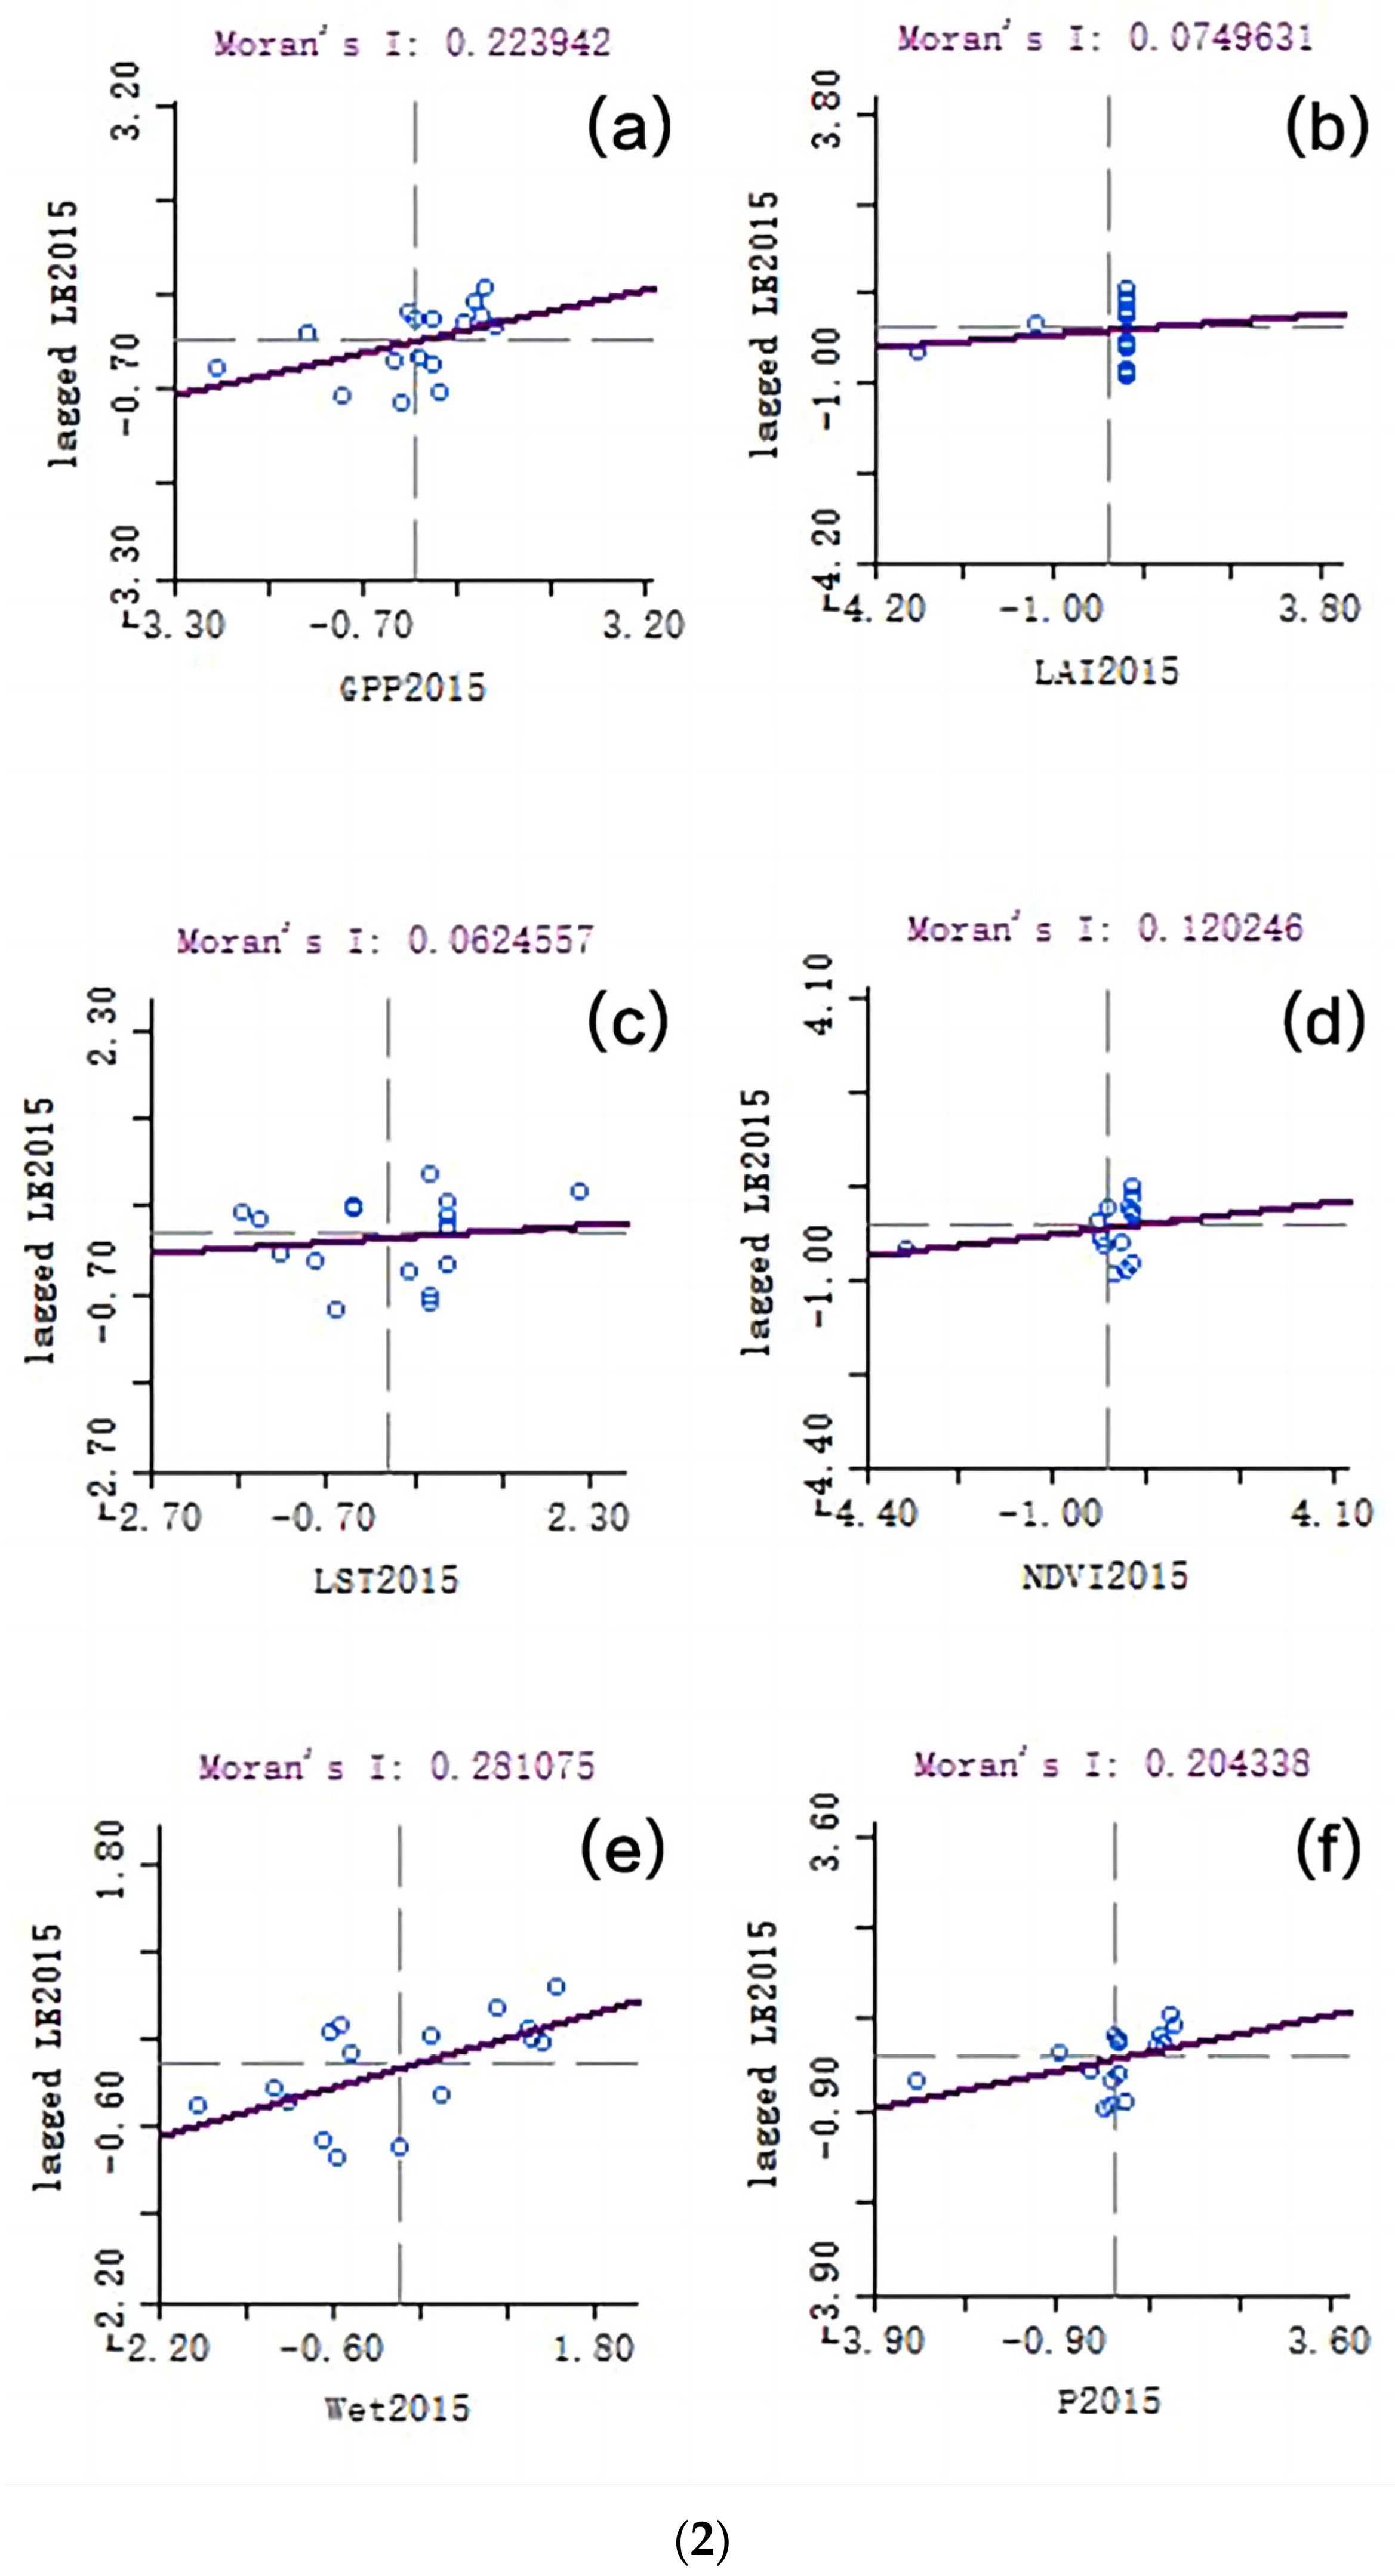
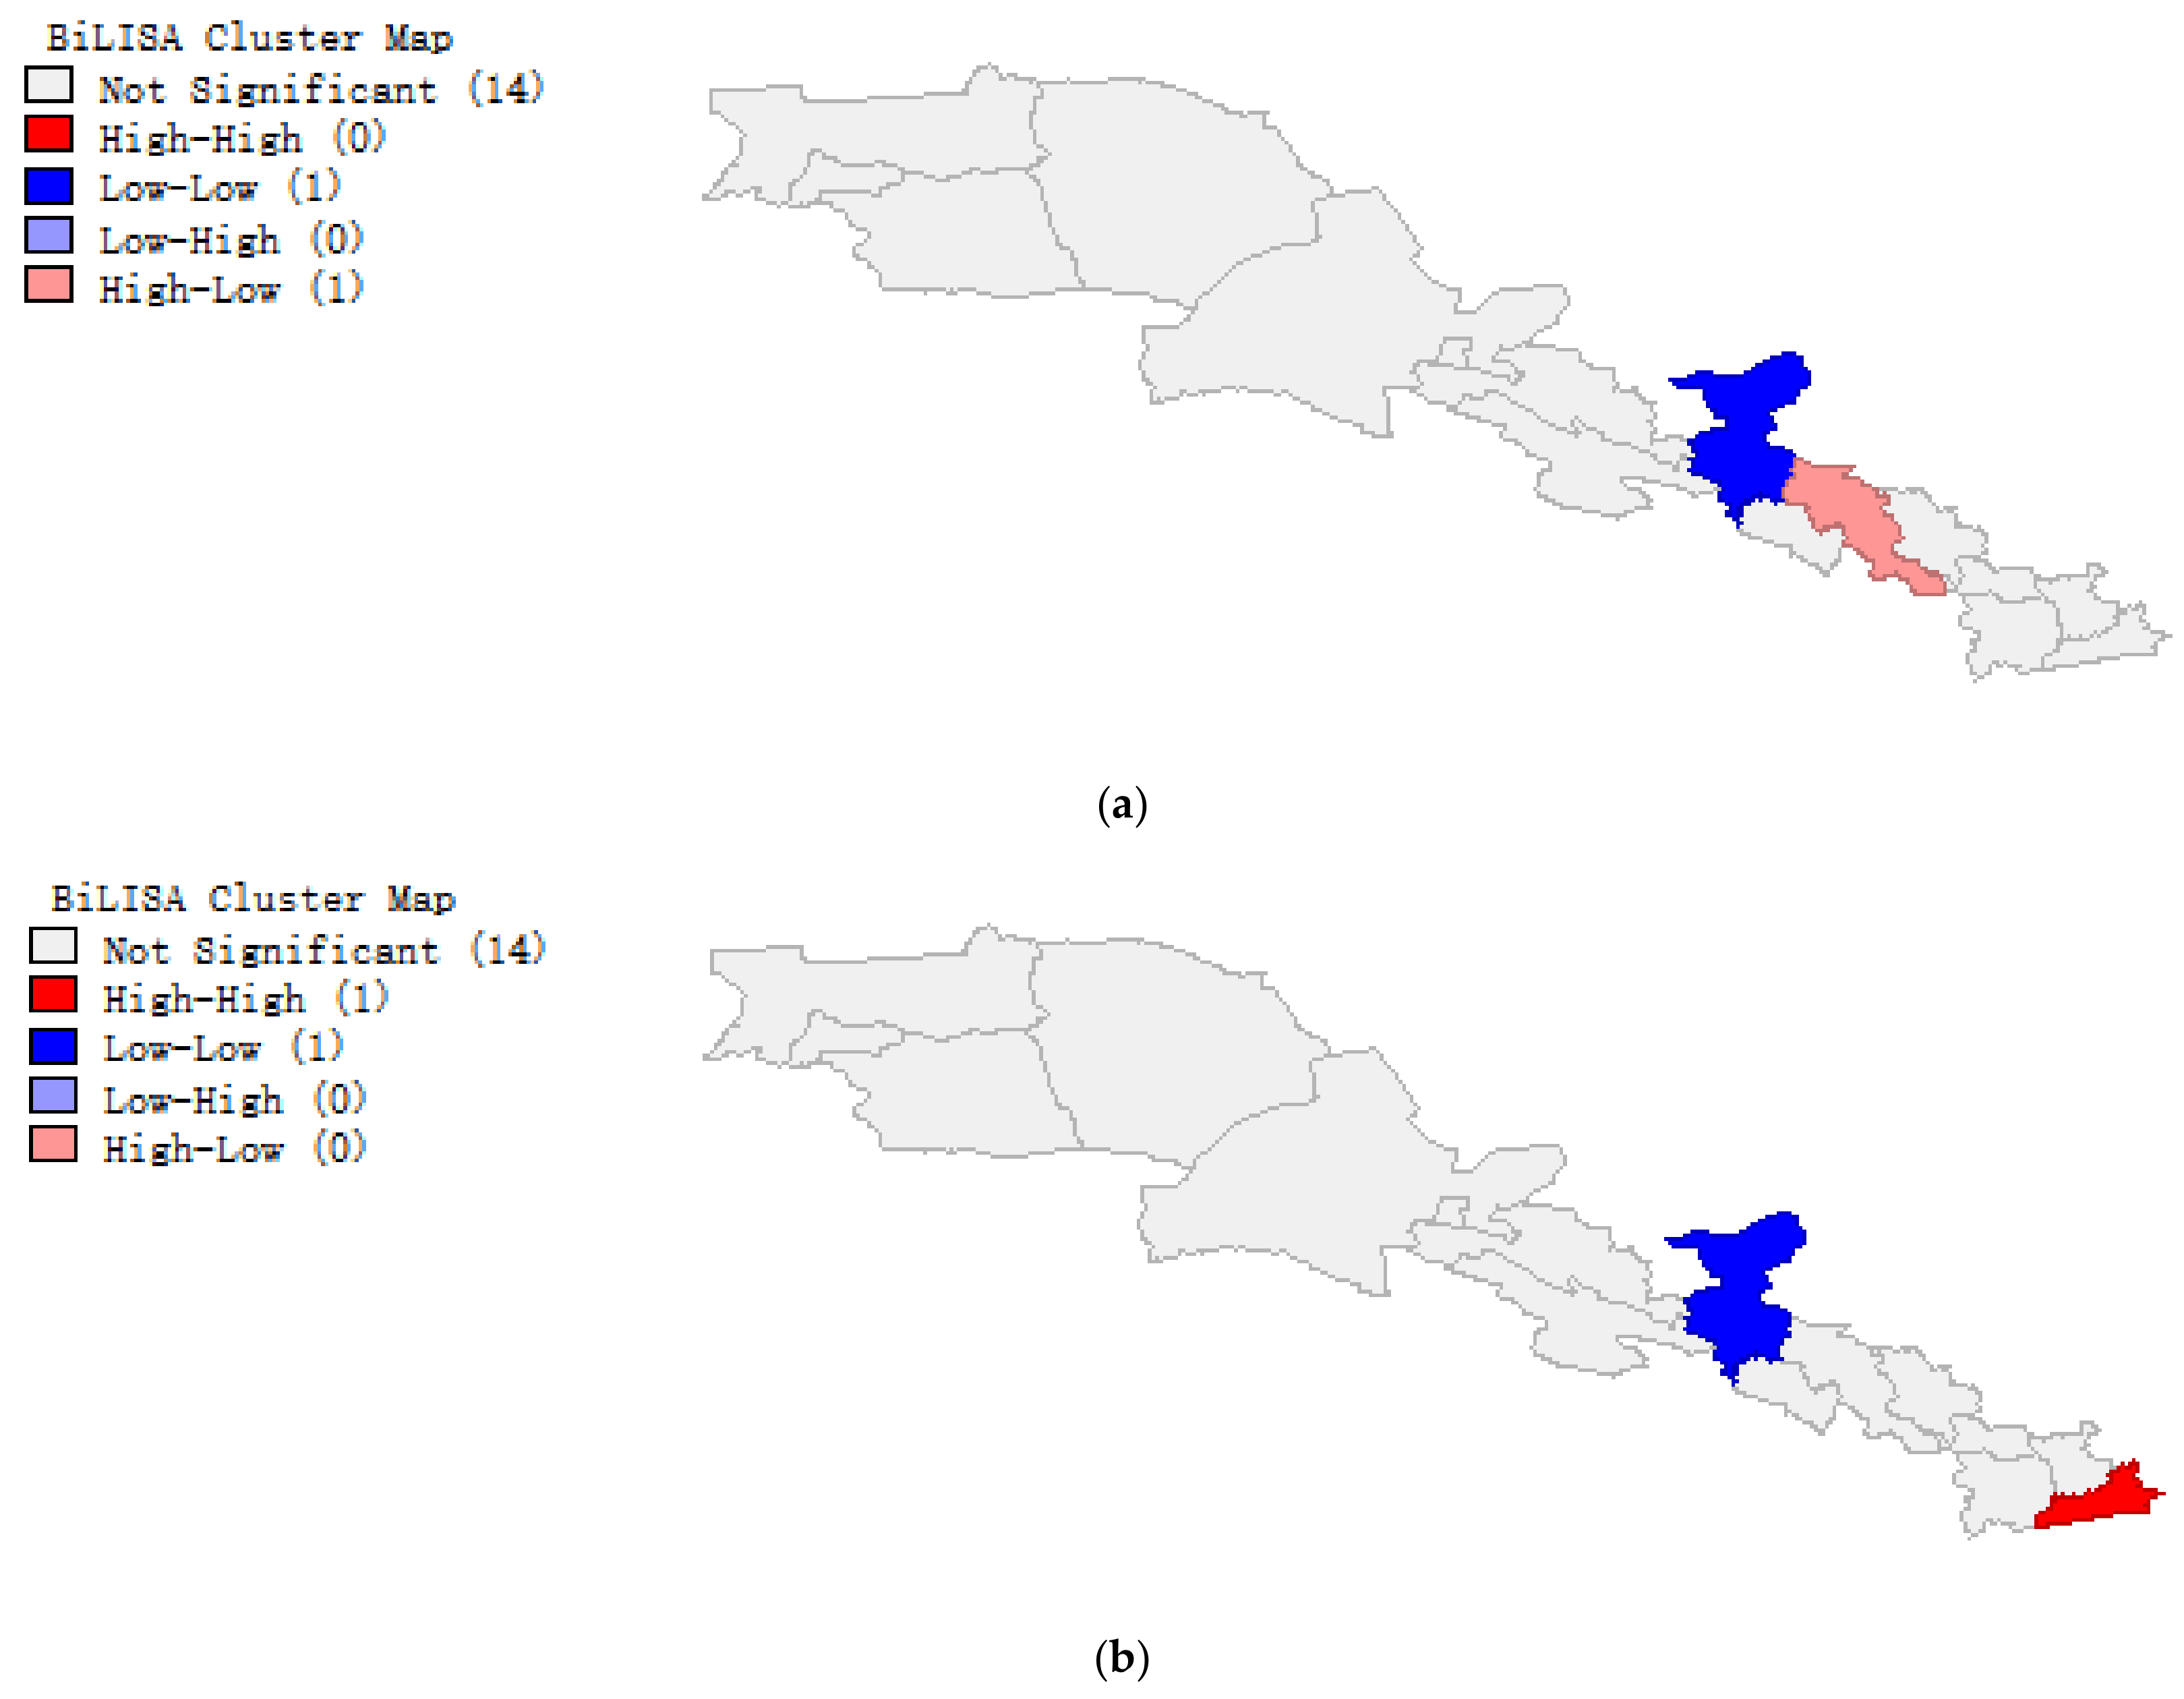
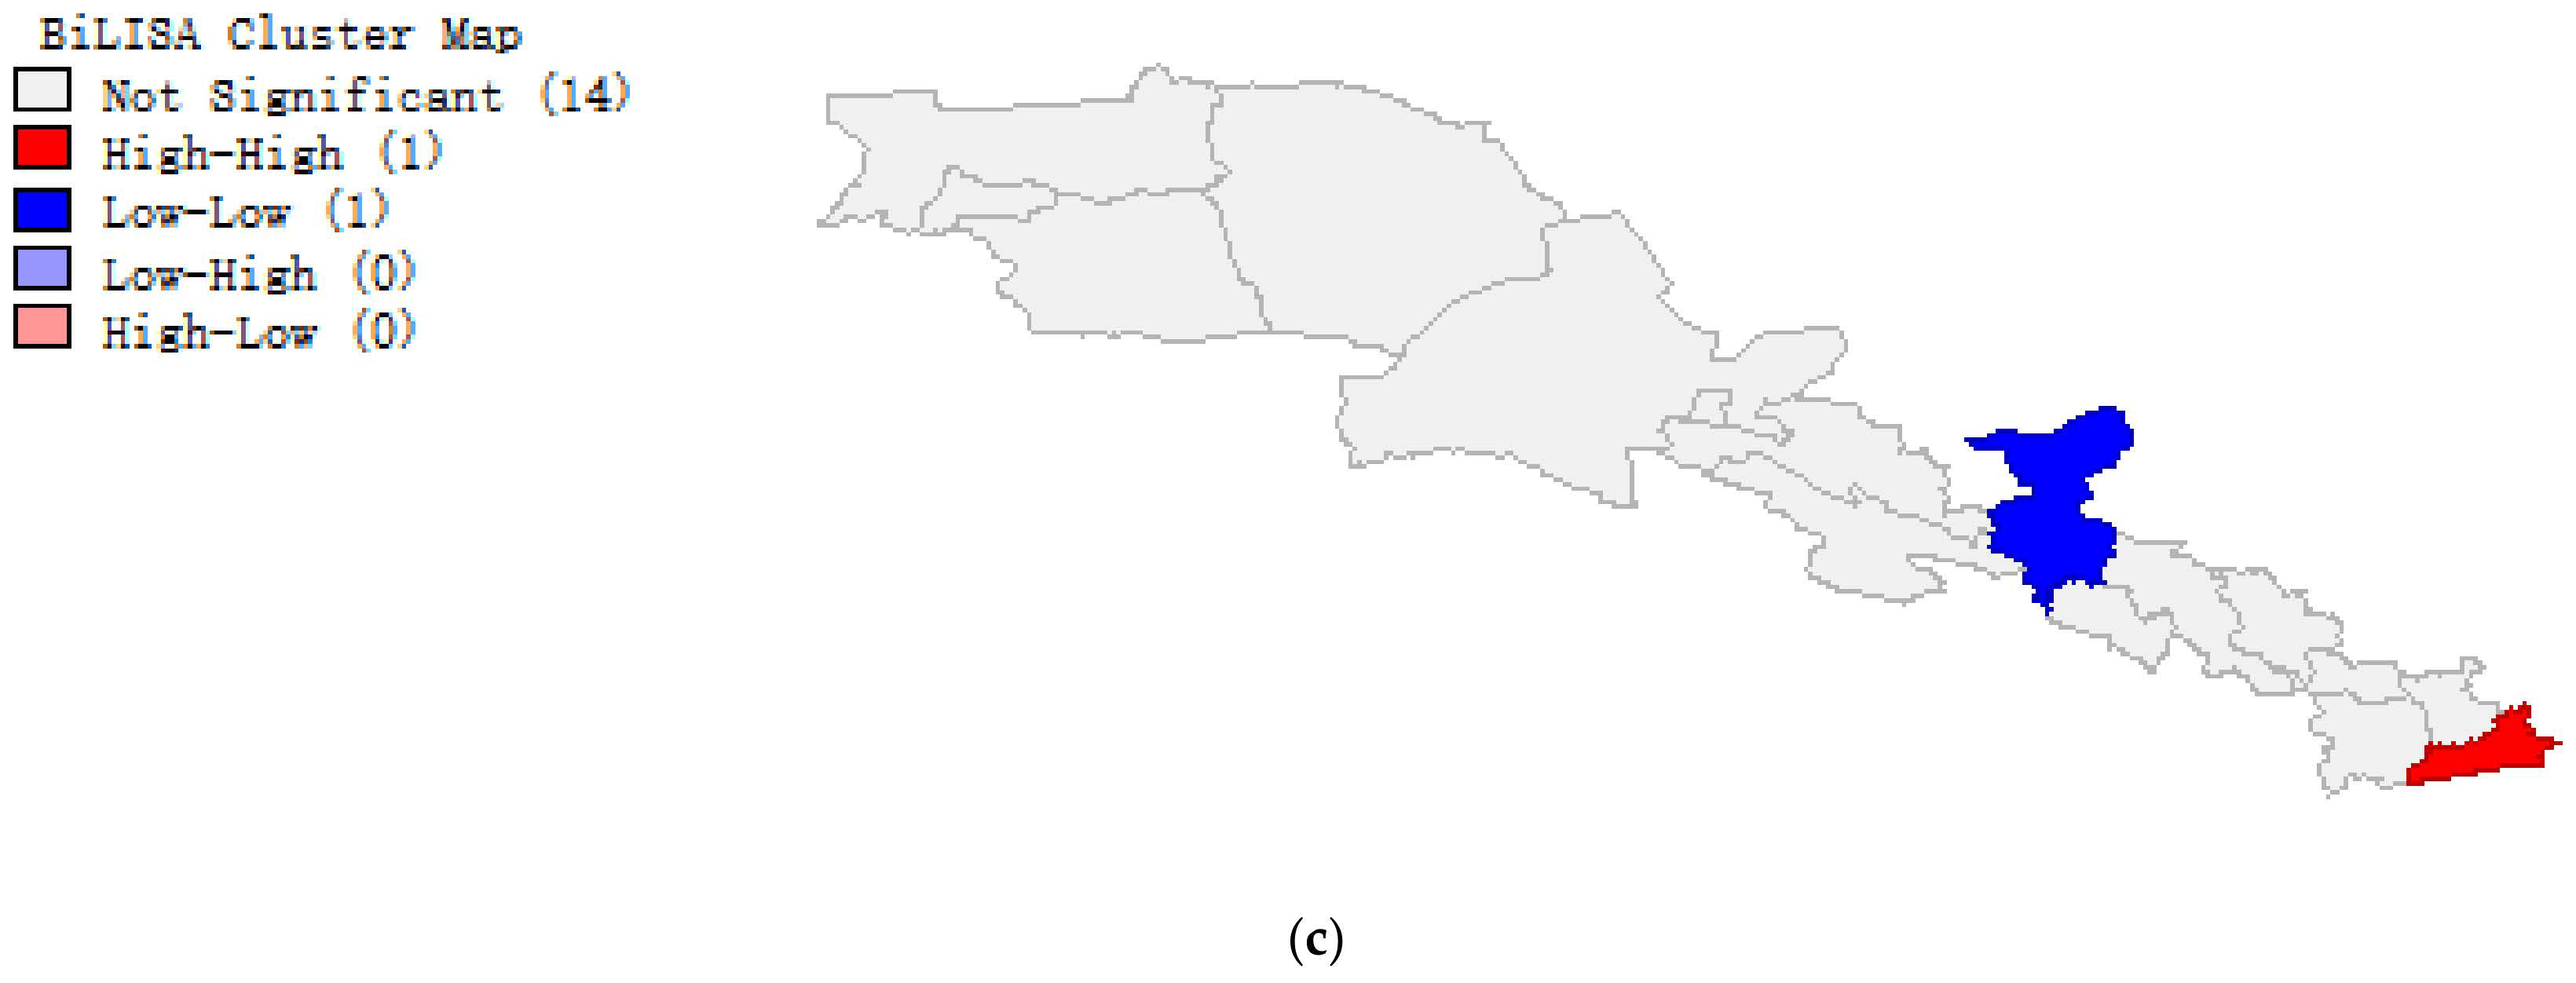
4.2.2. Spatial Correlation Analysis
Trend Analysis
Spatial Cross-Correlation Analysis
Spatiotemporal Lag Spatial Crosscorrelation Analysis
4.3. Discussion
4.3.1. Discussion of Correlation
- (1)
- Correlation coefficient
- (2)
- Spatial crosscorrelation
- (3)
- Consistency between Pearson coefficient and Moran’s I
4.3.2. Discussion of Lag
4.3.3. Discussion on the Influencing Factors
5. Conclusions
- (1)
- Environmental policies in recent years have contributed to the improvement of the ecological environment of the cities along the B&R. There is a positive correlation between LE and the ecological environment of cities from Xi’an to Urumqi along the B&R. The PCA method was used to calculate the correlation between ecological indicators and LE, and more comprehensive results were obtained by combining time and space for the lag analysis;
- (2)
- There is a lagging impact from the ecological environment on LE. The impact of ecological indicators in 2010 on LE in 2020 is greater than that in 2015. Therefore, the benefits of improving the ecological environment on LE may require a long time;
- (3)
- In the correlation analysis between the ecological indicators and LE, GPP had the highest impact, which is beneficial to the growth of LE. However, LST and Wet have a negative impact on LE, which may be unfavorable to the growth of LE;
- (1)
- It is expected that this study can provide a new research idea for the related research of LE in other regions, so other regions along the B&R (e.g., abroad) will be selected for research;
- (2)
- In this study, only five ecological indicators were selected, and CEI data were calculated. In the future, ecological indicators might be more accurate, making the experimental results better in order to provide some scientific reference for the government and relevant policies and suggestions. It is hoped that people can actively respond to the “double carbon” policy of carbon peaking and carbon neutrality, control carbon emissions to slow down global warming, and promote the healthy development of human society.
Author Contributions
Funding
Institutional Review Board Statement
Informed Consent Statement
Data Availability Statement
Conflicts of Interest
References
- Ascensão, F.; Fahrig, L.; Clevenger, A.P.; Corlett, R.T.; Jaeger JA, G.; Laurance, W.F.; Pereira, H.M. Environmental challenges for the Belt and Road Initiative. Nat. Sustain. 2018, 1, 206–209. [Google Scholar] [CrossRef]
- Huang, Y. The Health Silk Road: How China Adapts the Belt and Road Initiative to the COVID-19 Pandemic. Am. J. Public Health 2022, 112, 567–569. [Google Scholar] [CrossRef] [PubMed]
- Ferdinand, P. Westward ho—The China dream and ‘one belt, one road’: Chinese foreign policy under Xi Jinping. Int. Aff. 2016, 92, 941–957. [Google Scholar] [CrossRef] [Green Version]
- Huang, Y. Understanding China’s Belt & Road initiative: Motivation, framework and assessment. China Econ. Rev. 2016, 40, 314–321. [Google Scholar]
- Kjellstrom, T.; Holmer, I.; Lemke, B. Workplace heat stress, health and productivity–an increasing challenge for low and middle-income countries during climate change. Glob. Health Action 2009, 2, 2047. [Google Scholar] [CrossRef] [PubMed]
- Loeppke, R.; Taitel, M.; Haufle, V.; Parry, T.; Kessler, R.C.; Jinnett, K. Health and productivity as a business strategy: A multiemployer study. J. Occup. Environ. Med. 2009, 411–428. [Google Scholar] [CrossRef] [PubMed]
- Hu, R.; Liu, R.; Hu, N. China’s Belt and Road Initiative from a global health perspective. Lancet Glob. Health 2017, 5, e752–e753. [Google Scholar] [CrossRef] [Green Version]
- Chen, H.; Wang, J.; Yu, X.; Li, C.; Zhao, Y.; Xing, Y.; Li, X. Policies of voluntary services involved in public health emergencies in China: Evolution, evaluation, and expectation. Front. Public Health 2022, 51, 10. [Google Scholar] [CrossRef]
- Yang, T.; Zhou, K.; Ding, T. Air pollution impacts on public health: Evidence from 110 cities in Yangtze River Economic Belt of China. Sci. Total Environ. 2022, 851, 158125. [Google Scholar] [CrossRef]
- Patz, J.A.; Campbell-Lendrum, D.; Holloway, T.; Foley, J.A. Impact of regional climate change on human health. Nature 2005, 438, 310–317. [Google Scholar] [CrossRef]
- Li, L.; Zhang, Y.; Zhou, T.; Wang, K.; Wang, C.; Wang, T.; Lü, G. Mitigation of China’s carbon neutrality to global warming. Nat. Commun. 2022, 13, 5315. [Google Scholar] [CrossRef] [PubMed]
- Liu, Z.; Deng, Z.; He, G.; Wang, H.; Zhang, X.; Lin, J.; Liang, X. Challenges and opportunities for carbon neutrality in China. Nat. Rev. Earth Environ. 2022, 3, 141–155. [Google Scholar] [CrossRef]
- Zhao, X.; Ma, X.; Chen, B.; Shang, Y.; Song, M. Challenges toward carbon neutrality in China: Strategies and countermeasures. Resour. Conserv. Recycl. 2022, 176, 105959. [Google Scholar] [CrossRef]
- Landsea, C.W. Hurricanes and global warming. Nature 2005, 438, E11–E12. [Google Scholar] [CrossRef]
- Wang, Y.; Wang, A.; Zhai, J.; Tao, H.; Jiang, T.; Su, B.; Gao, C. Tens of thousands additional deaths annually in cities of China between 1.5 C and 2.0 C warming. Nat. Commun. 2019, 10, 3376. [Google Scholar] [CrossRef] [Green Version]
- Laghari, J. Climate change: Melting glaciers bring energy uncertainty. Nature 2013, 502, 617–618. [Google Scholar] [CrossRef] [Green Version]
- Wunderling, N.; Willeit, M.; Donges, J.F.; Winkelmann, R. Global warming due to loss of large ice masses and Arctic summer sea ice. Nat. Commun. 2020, 11, 5177. [Google Scholar] [CrossRef]
- Oeppen, J.; Vaupel, J.W. Broken limits to life expectancy. Science 2002, 296, 1029–1031. [Google Scholar] [CrossRef] [Green Version]
- Wang, S.; Ren, Z.; Liu, X.; Yin, Q. Spatiotemporal trends in life expectancy and impacts of economic growth and air pollution in 134 countries: A Bayesian modeling study. Soc. Sci. Med. 2022, 293, 114660. [Google Scholar] [CrossRef] [PubMed]
- Gulis, G. Life expectancy as an indicator of environmental health. Eur. J. Epidemiol. 2000, 16, 161–165. [Google Scholar] [CrossRef]
- Nkalu, C.N.; Edeme, R.K. Environmental hazards and life expectancy in Africa: Evidence from GARCH model. Sage Open 2019, 9, 2158244019830500. [Google Scholar] [CrossRef] [Green Version]
- Wu, Y.; Wang, W.; Liu, C.; Chen, R.; Kan, H. The association between long-term fine particulate air pollution and life expectancy in China, 2013 to 2017. Sci. Total Environ. 2020, 712, 136507. [Google Scholar] [CrossRef]
- Cheng, J.; Ho, H.C.; Webster, C.; Su, H.; Pan, H.; Zheng, H.; Xu, Z. Lower-than-standard particulate matter air pollution reduced life expectancy in Hong Kong: A time-series analysis of 8.5 million years of life lost. Chemosphere 2021, 272, 129926. [Google Scholar] [CrossRef]
- Gebremichael, M.; Barros, A.P. Evaluation of MODIS Gross Primary Productivity (GPP) in tropical monsoon regions. Remote Sens. Environ. 2006, 100, 150–166. [Google Scholar] [CrossRef]
- Ladoy, A.; Vallarta-Robledo, J.R.; De Ridder, D.; Sandoval, J.L.; Stringhini, S.; Da Costa, H.; Joost, S. Geographic footprints of life expectancy inequalities in the state of Geneva, Switzerland. Sci. Rep. 2021, 11, 23326. [Google Scholar]
- Liu, W.; Xu, Z.; Yang, T. Health effects of air pollution in China. Int. J. Environ. Res. Public Health 2018, 15, 1471. [Google Scholar] [CrossRef] [Green Version]
- Xiao, R.; Guo, D.; Ali, A.; Mi, S.; Liu, T.; Ren, C.; Zhang, Z. Accumulation, ecological-health risks assessment, and source apportionment of heavy metals in paddy soils: A case study in Hanzhong, Shaanxi, China. Environ. Pollut. 2019, 248, 349–357. [Google Scholar] [CrossRef]
- Zhang, X.; Yang, L.; Li, Y.; Li, H.; Wang, W.; Ye, B. Impacts of lead/zinc mining and smelting on the environment and human health in China. Environ. Monit. Assess. 2012, 184, 2261–2273. [Google Scholar] [CrossRef]
- Caçador, I.; Neto, J.; Duarte, B.; Barroso, D.; Pinto, M.; Marques, J. Development of an Angiosperm Quality Assessment Index (AQuA-Index) for ecological quality evaluation of Portuguese water bodies—A multi-metric approach. Ecol. Indic. 2013, 25, 141–148. [Google Scholar] [CrossRef]
- Li, J.; Song, C.; Cao, L.; Zhu, F.; Meng, X.; Wu, J. Impacts of landscape structure on surface urban heat islands: A case study of Shanghai, China. Remote Sens. Environ. 2011, 115, 3249–3263. [Google Scholar] [CrossRef]
- An, M.; Xie, P.; He, W.; Wang, B.; Huang, J.; Khanal, R. Spatiotemporal change of ecologic environment quality and human interaction factors in three gorges ecologic economic corridor, based on RSEI. Ecol. Indic. 2022, 141, 109090. [Google Scholar] [CrossRef]
- Hu, X.; Xu, H. A new remote sensing index for assessing the spatial heterogeneity in urban ecological quality: A case from Fuzhou City, China. Ecol. Indic. 2018, 89, 11–21. [Google Scholar] [CrossRef]
- Zhang, J.; Zhu, Y.; Fan, F. Mapping and evaluation of landscape ecological status using geographic indices extracted from remote sensing imagery of the Pearl River Delta, China, between 1998 and 2008. Environ. Earth Sci. 2016, 75, 327. [Google Scholar] [CrossRef]
- Ouyang, X.; Wang, J.; Chen, X.; Zhao, X.; Ye, H.; Watson, A.E.; Wang, S. Applying a projection pursuit model for evaluation of ecological quality in Jiangxi Province, China. Ecol. Indic. 2021, 133, 108414. [Google Scholar] [CrossRef]
- Li, Z.-W.; Zeng, G.-M.; Zhang, H.; Yang, B.; Jiao, S. The integrated eco-environment assessment of the red soil hilly region based on GIS—A case study in Changsha City, China. Ecol. Model. 2007, 202, 540–546. [Google Scholar] [CrossRef]
- Tucker, C.J. Red and photographic infrared linear combinations for monitoring vegetation. Remote Sens. Environ. 1979, 8, 127–150. [Google Scholar] [CrossRef] [Green Version]
- Knyazikhin, Y.; Martonchik, J.; Myneni, R.B.; Diner, D.; Running, S.W. Synergistic algorithm for estimating vegetation canopy leaf area index and fraction of absorbed photosynthetically active radiation from MODIS and MISR data. J. Geophys. Res. Atmos. 1998, 103, 32257–32275. [Google Scholar] [CrossRef] [Green Version]
- Running, S.W.; Nemani, R.R.; Heinsch, F.A.; Zhao, M.; Reeves, M.; Hashimoto, H. A continuous satellite-derived measure of global terrestrial primary production. Bioscience 2004, 54, 547–560. [Google Scholar] [CrossRef]
- Benali, A.; Carvalho, A.; Nunes, J.; Carvalhais, N.; Santos, A. Estimating air surface temperature in Portugal using MODIS LST data. Remote Sens. Environ. 2012, 124, 108–121. [Google Scholar] [CrossRef]
- Wan, Z. Collection-5 MODIS Land Surface Temperature Products Users’ Guide; ICESS, University of California: Santa Barbara, CA, USA, 2007. [Google Scholar]
- Lobser, S.; Cohen, W. MODIS tasselled cap: Land cover characteristics expressed through transformed MODIS data. Int. J. Remote Sens. 2007, 28, 5079–5101. [Google Scholar] [CrossRef]
- Tan, J.; Zheng, Y.; Tang, X.; Guo, C.; Li, L.; Song, G.; Li, F. The urban heat island and its impact on heat waves and human health in Shanghai. Int. J. Biometeorol. 2010, 54, 75–84. [Google Scholar] [CrossRef]
- Wang, S.; Luo, K.; Liu, Y. Spatio-temporal distribution of human lifespan in China. Sci. Rep. 2015, 5, 13844. [Google Scholar] [CrossRef] [Green Version]
- Conti, B. Considerations on temperature, longevity and aging. Cell. Mol. Life Sci. 2008, 65, 1626–1630. [Google Scholar] [CrossRef] [Green Version]
- Davis, R.E.; McGregor, G.R.; Enfield, K.B. Humidity: A review and primer on atmospheric moisture and human health. Environ. Res. 2016, 144, 106–116. [Google Scholar] [CrossRef] [Green Version]
- Lin, S.; Luo, M.; Walker, R.J.; Liu, X.; Hwang, S.-A.; Chinery, R. Extreme high temperatures and hospital admissions for respiratory and cardiovascular diseases. Epidemiology 2009, 738–746. [Google Scholar] [CrossRef]
- Watts, K.; Whytock, R.C.; Park, K.J.; Fuentes-Montemayor, E.; Macgregor, N.A.; Duffield, S.; McGowan, P.J. Ecological time lags and the journey towards conservation success. Nat. Ecol. Evol. 2020, 4, 304–311. [Google Scholar] [CrossRef]
- Neumayer, E.; Plümper, T. The gendered nature of natural disasters: The impact of catastrophic events on the gender gap in life expectancy, 1981–2002. Ann. Assoc. Am. Geogr. 2007, 97, 551–566. [Google Scholar] [CrossRef] [Green Version]
- Noy, I. Natural disasters in the Pacific Island Countries: New measurements of impacts. Nat. Hazards 2016, 84, 7–18. [Google Scholar] [CrossRef]
- Wilkinson, R.G. Income distribution and life expectancy. BMJ Br. Med. J. 1992, 304, 165. [Google Scholar] [CrossRef] [Green Version]
- Bravo, J.M.; Ayuso, M.; Holzmann, R.; Palmer, E. Addressing the life expectancy gap in pension policy. Insur. Math. Econ. 2021, 99, 200–221. [Google Scholar] [CrossRef]


| Indicator | Product | Time Resolution (Day) | Space Resolution (m) | Grade |
|---|---|---|---|---|
| NDVI | MOD13Q1 | 16 | 250 | L3 |
| GPP | MOD17A2H. | 8 | 500 | L4 |
| LAI | MOD15A2H | 8 | 500 | L4 |
| LST | MOD11A2 | 8 | 1000 | L3 |
| Wet | MOD09A1 (Surface reflectance) | 8 | 500 | L3 |
| Number of Pixels | Observations | Mean | Standard Deviations | Minimum | Maximum | |
|---|---|---|---|---|---|---|
| GPP2010 | 13,555,431(4523, 2997) | 736 | 0.013162 | 0.018770 | 0.000000 | 0.101799 |
| GPP2015 | 13,555,431(4523, 2997) | 720 | 0.012964 | 0.018558 | 0.000000 | 0.101599 |
| GPP2020 | 13,555,431(4523, 2997) | 736 | 0.012224 | 0.017662 | 0.000000 | 0.103699 |
| LAI2010 | 8,175,867(4417, 1851) | 736 | 0.686858 | 1.284290 | 0.000000 | 7.000000 |
| LAI2015 | 8,175,867(4417, 1851) | 736 | 0.752034 | 1.449256 | 0.000000 | 7.000000 |
| LAI2020 | 8,175,867(4417, 1851) | 736 | 0.721788 | 1.423109 | 0.000000 | 7.000000 |
| LST2010 | 1,968,544(2168, 908) | 736 | 45.612089 | 9.433674 | 0.000000 | 69.000000 |
| LST2015 | 1,968,544(2168, 908) | 736 | 45.612089 | 9.433674 | 0.000000 | 69.000000 |
| LST2020 | 1,968,544(2168, 908) | 736 | 45.606350 | 9.438040 | 0.000000 | 69.000000 |
| NDVI2010 | 3,390,738(2262, 1499) | 368 | 0.271135 | 0.240782 | −0.183699 | 0.998699 |
| NDVI2015 | 3,390,738(2262, 1499) | 368 | 0.275488 | 0.247503 | −0.163000 | 0.996899 |
| NDVI2020 | 3,390,738(2262, 1499) | 368 | 0.269964 | 0.242245 | −0.188199 | 0.999399 |
| WET2010 | 8,774,109(4577, 1917) | 736 | 0.079296 | 0.196396 | −0.607913 | 0.889902 |
| WET2015 | 8,774,109(4577, 1917) | 736 | 0.004665 | 0.235381 | −0.997439 | 0.912903 |
| WET2020 | 8,774,109(4577, 1917) | 736 | 0.042862 | 0.197213 | −0.863188 | 0.945436 |
| Cities or Autonomous Prefectures along the Belt and Road | Life Expectancy (Years) | ||
|---|---|---|---|
| 2010 | 2015 | 2020 | |
| Xi’an City | 75.86 | 76.27 | 80.86 |
| Baoji City | 72.12 | 75.00 | 77.88 |
| Xianyang City | 72.00 | 74.50 | 77.00 |
| Lanzhou City | 72.54 | 73.50 | 74.50 |
| Jiayuguan City | 77.79 | 77.99 | 78.19 |
| Baiyin City | 72.84 | 74.00 | 75.16 |
| Wuwei City | 71.34 | 73.50 | 75.66 |
| Zhangye City | 70.41 | 72.30 | 74.20 |
| Pingliang City | 72.23 | 73.25 | 74.00 |
| Jiuquan City | 72.81 | 74.80 | 75.60 |
| Haibei Tibetan Autonomous Prefecture | 70.41 | 71.33 | 72.24 |
| Urumqi City | 73.70 | 75.80 | 76.40 |
| Turpan City | 71.40 | 73.60 | 74.35 |
| Hami City | 74.00 | 75.00 | 76.00 |
| Changji Hui Autonomous Prefecture | 73.25 | 75.49 | 76.16 |
| Guyuan City | 70.45 | 71.85 | 76.80 |
| Indexes | 2010 | 2015 | 2020 | ||||
|---|---|---|---|---|---|---|---|
| PC1 | PC2 | PC1 | PC2 | PC1 | PC2 | PC3 | |
| GPP | 0.955 | 0.008 | 0.930 | 0.048 | 0.941 | −0.215 | 0.151 |
| LAI | 0.912 | −0.219 | 0.931 | −0.079 | 0.795 | −0.458 | 0.344 |
| LST | −0.072 | 0.955 | −0.113 | 0.984 | −0.254 | 0.560 | 0.787 |
| NDVI | 0.933 | −0.030 | 0.941 | 0.002 | 0.546 | 0.709 | −0.331 |
| Wet | 0.744 | 0.387 | 0.763 | 0.182 | 0.826 | 0.389 | −0.042 |
| Eigenvalue | 3.172 | 1.111 | 3.213 | 1.009 | 2.564 | 1.224 | 0.872 |
| Contribution rate of variance (%) | 63.446 | 22.217 | 64.262 | 20.183 | 51.272 | 24.486 | 17.448 |
| Accumulated variance contribution rate (%) | 63.446 | 85.663 | 64.262 | 84.445 | 51.272 | 75.758 | 93.206 |
| Correlation Index | 2010LE | 2015LE | 2020LE |
|---|---|---|---|
| 2010 GPP | 0.732193 | 0.346175 | 0.545161 |
| 2010 LAI | 0.521710 | 0.589989 | 0.545020 |
| 2010 LST | 0.070000 | −0.311609 | −0.158746 |
| 2010 NDVI | 0.702664 | 0.199525 | 0.356853 |
| 2010 Wet | 0.672466 | −0.209284 | −0.148997 |
| 2010 CEI(P) | 0.769155 | 0.234094 | 0.388458 |
| 2015 GPP | — | 0.652993 | 0.566851 |
| 2015 LAI | — | 0.326956 | 0.492288 |
| 2015 LST | — | −0.268887 | −0.534790 |
| 2015 NDVI | — | 0.594811 | 0.277257 |
| 2015 Wet | — | 0.432666 | −0.291204 |
| 2015 CEI(P) | — | 0.535910 | 0.252389 |
| 2020 GPP | — | — | 0.579655 |
| 2020 LAI | — | — | 0.544977 |
| 2020 LST | — | — | −0.170294 |
| 2020 NDVI | — | — | −0.264197 |
| 2020 Wet | — | — | 0.177764 |
| 2020 CEI(P) | — | — | 0.346410 |
Disclaimer/Publisher’s Note: The statements, opinions and data contained in all publications are solely those of the individual author(s) and contributor(s) and not of MDPI and/or the editor(s). MDPI and/or the editor(s) disclaim responsibility for any injury to people or property resulting from any ideas, methods, instructions or products referred to in the content. |
© 2023 by the authors. Licensee MDPI, Basel, Switzerland. This article is an open access article distributed under the terms and conditions of the Creative Commons Attribution (CC BY) license (https://creativecommons.org/licenses/by/4.0/).
Share and Cite
Li, C.; Wu, J.; Li, D.; Jiang, Y.; Wu, Y. Study on the Correlation between Life Expectancy and the Ecological Environment around the Cities along the Belt and Road. Int. J. Environ. Res. Public Health 2023, 20, 2147. https://doi.org/10.3390/ijerph20032147
Li C, Wu J, Li D, Jiang Y, Wu Y. Study on the Correlation between Life Expectancy and the Ecological Environment around the Cities along the Belt and Road. International Journal of Environmental Research and Public Health. 2023; 20(3):2147. https://doi.org/10.3390/ijerph20032147
Chicago/Turabian StyleLi, Chang, Jing Wu, Dehua Li, Yan Jiang, and Yijin Wu. 2023. "Study on the Correlation between Life Expectancy and the Ecological Environment around the Cities along the Belt and Road" International Journal of Environmental Research and Public Health 20, no. 3: 2147. https://doi.org/10.3390/ijerph20032147