
The Life cycle Assessment Integrated with the Lexicographic Method for the Multi-Objective Optimization of Community-Based Rainwater Utilization


Abstract

1. Introduction
2. Methods
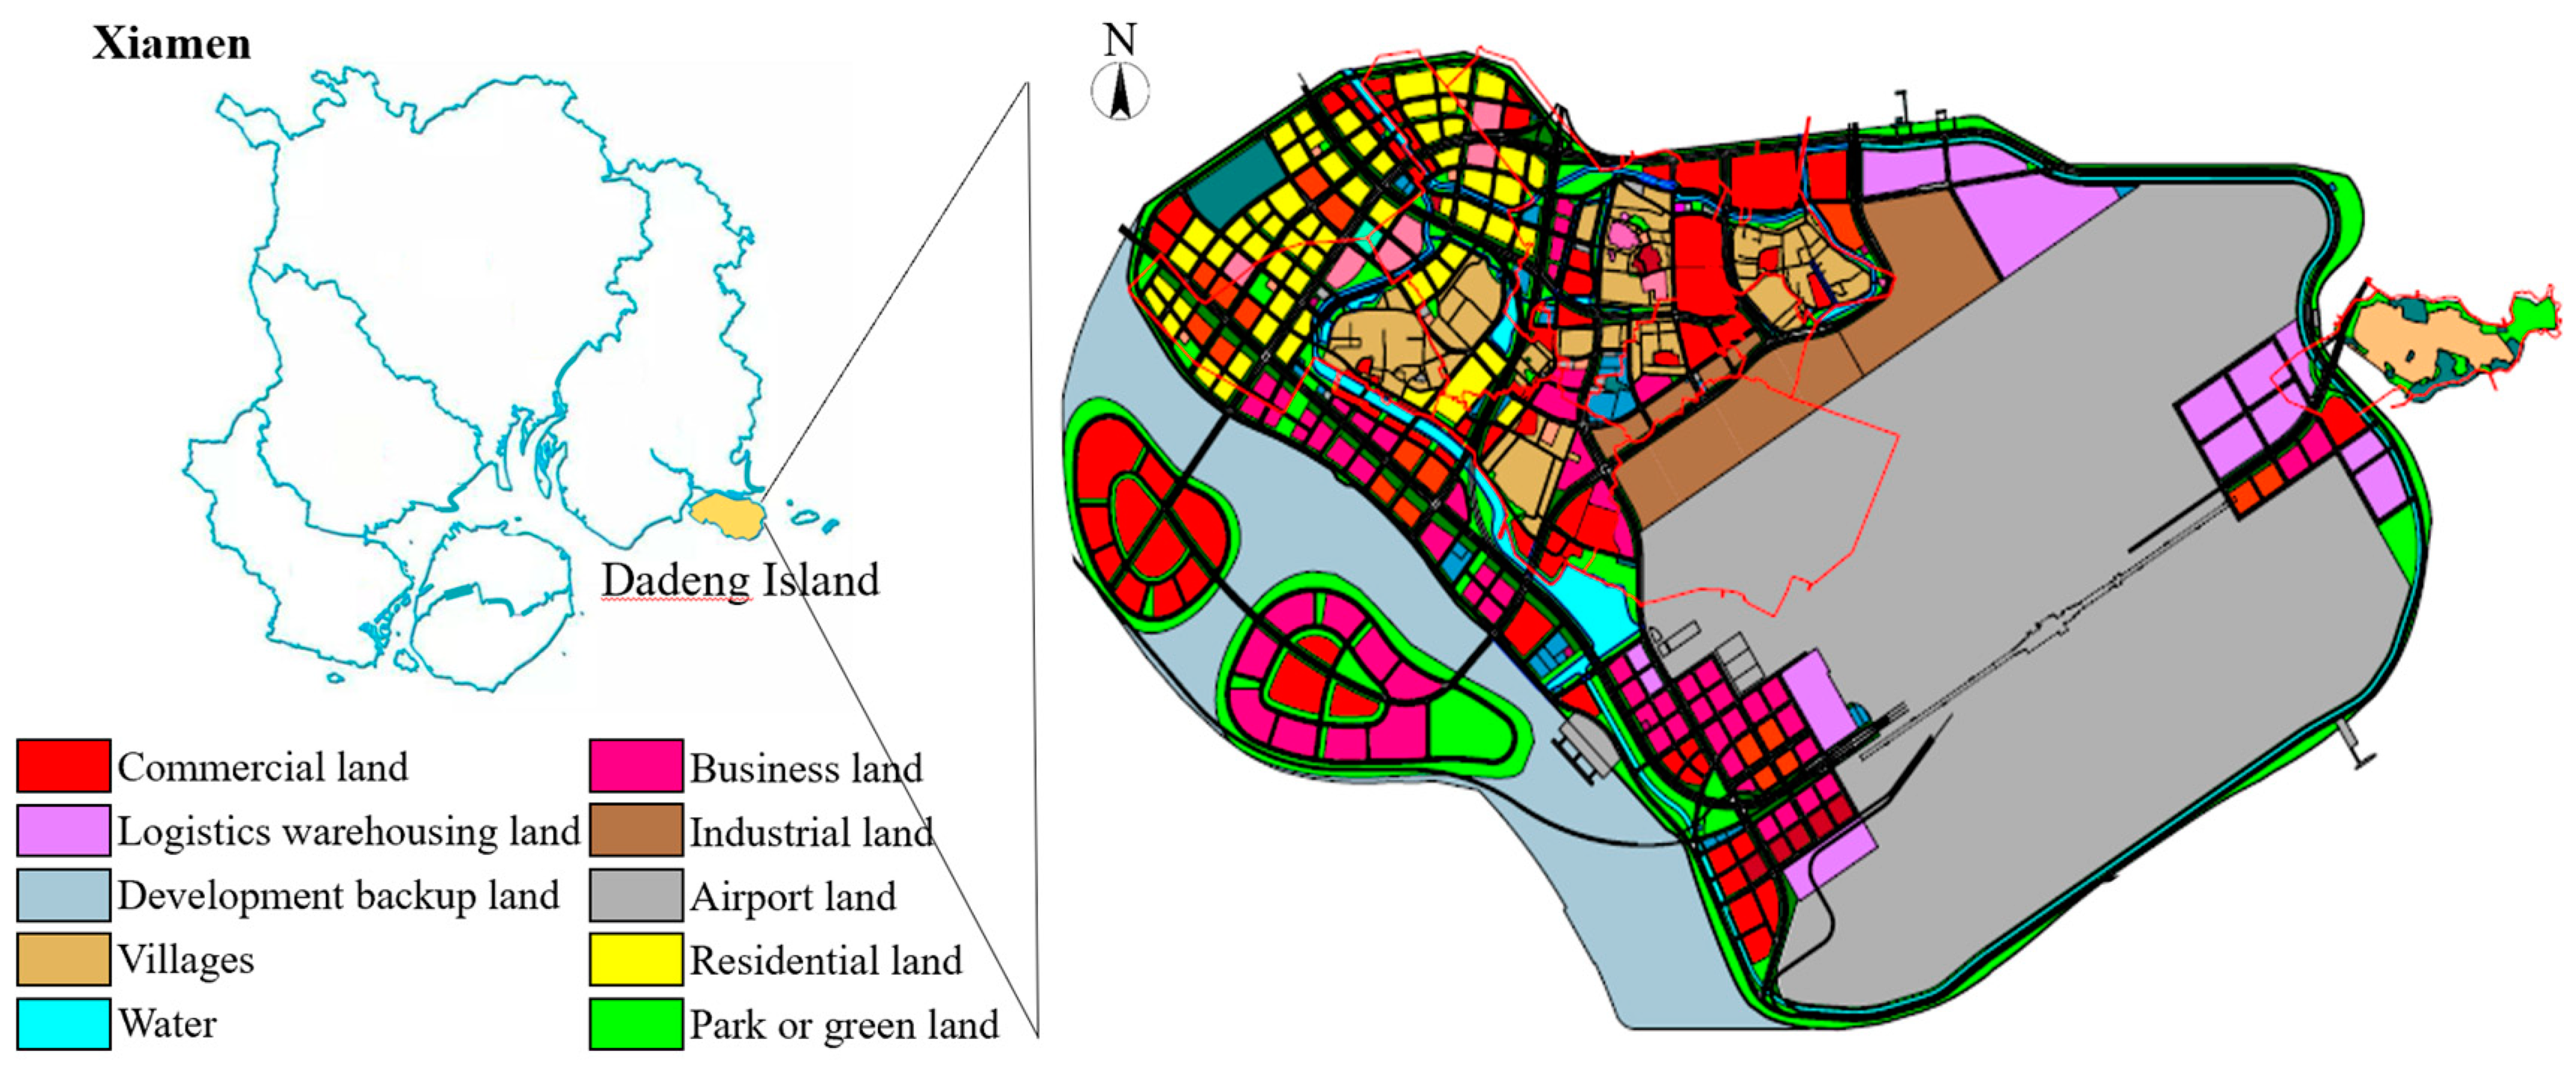
2.1. Study Area
2.2. LCA Model
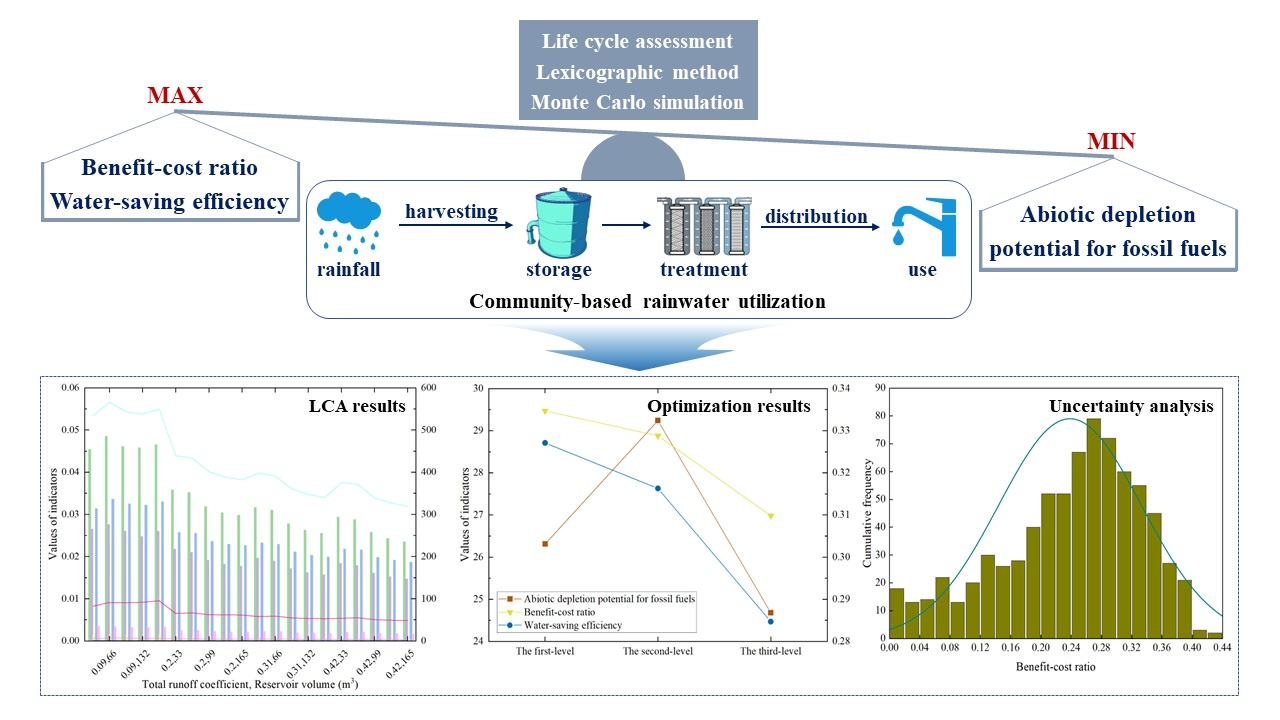
2.2.1. Rainwater Utilization Mode
2.2.2. Goal and Scope
2.2.3. Inventory Analysis
2.2.4. Life Cycle Impact Assessment
2.3. Multi-Objective Optimization Model
2.3.1. Object Functions
2.3.2. Constraints
2.3.3. Datasets
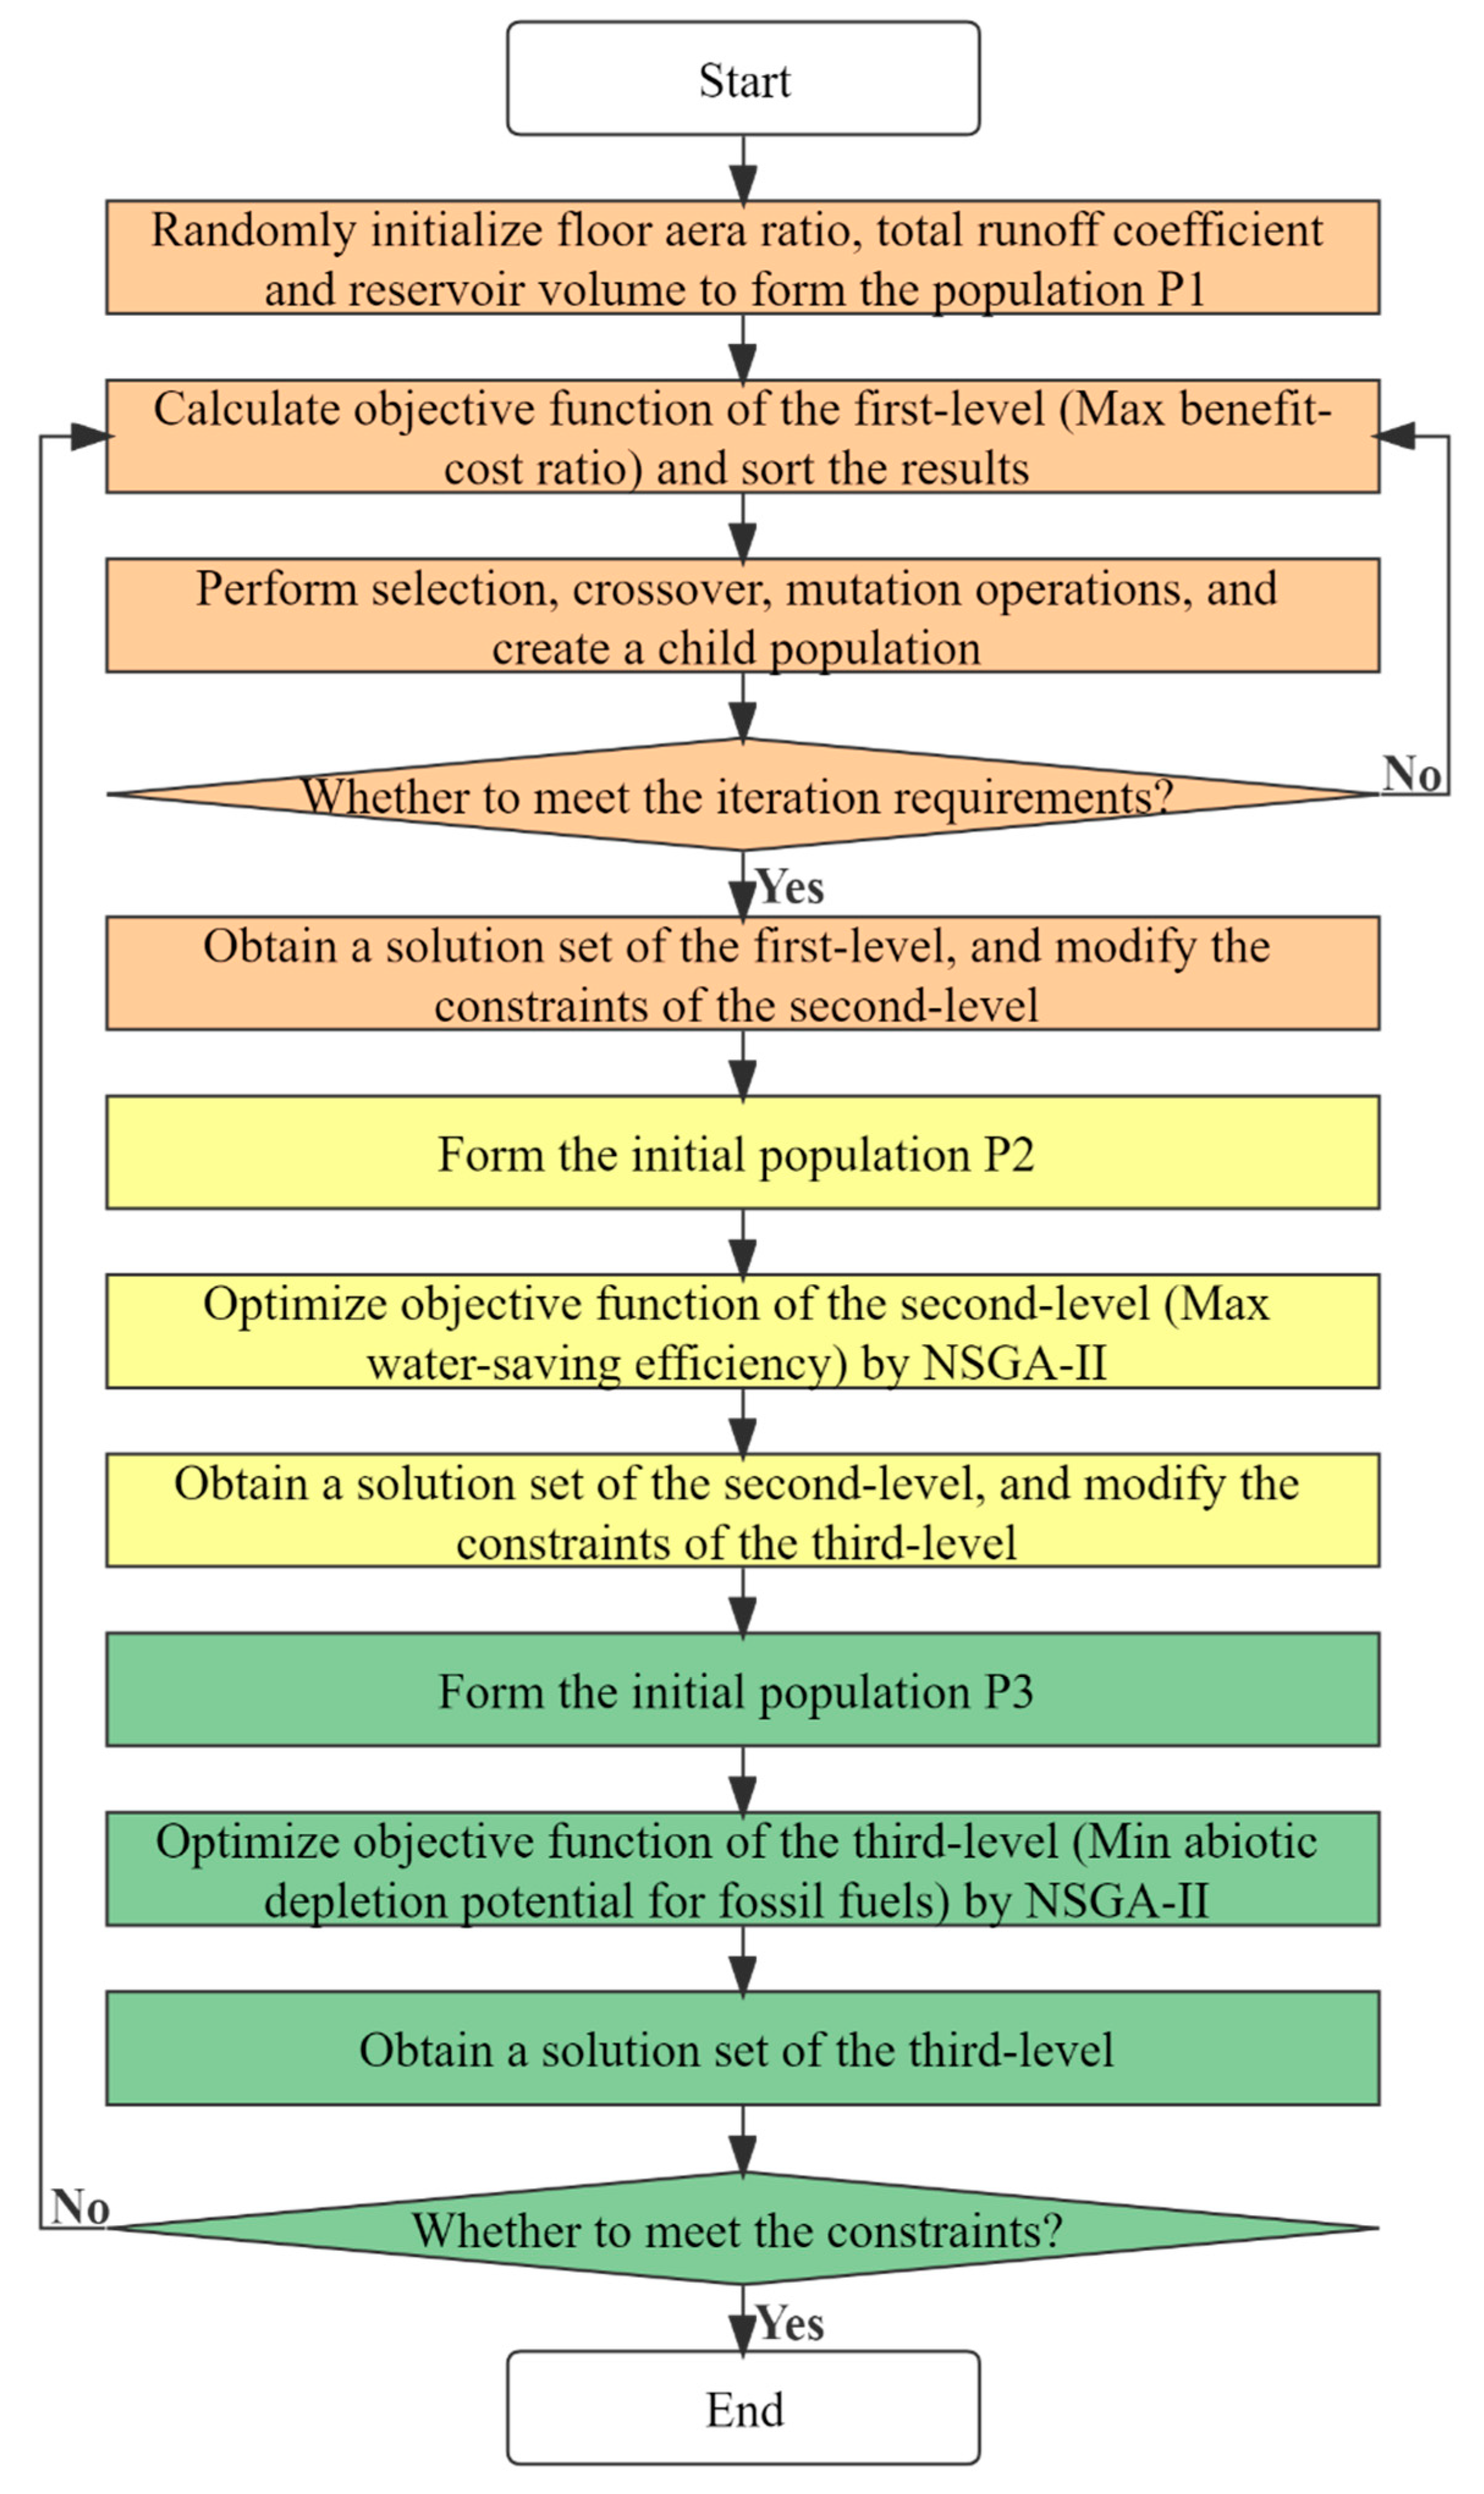
2.3.4. Lexicographic Method
- Determine the sequence of objective functions. The first-level goal was to maximum the BCR; the second-level goal was to maximum the WSE; and the third-level goal was to minimize the ADPF.
- First-level optimization. Solve the optimization model with the maximization of the BCR as the goal under the initial constraints, obtaining a solution set and the maximum BCR.
- Second-level optimization. Modify the constraints and solve the optimization model with the maximization of the WSE as the goal within the first-level optimal solution range, obtaining a solution set and the maximum WSE.
- Third-level optimization. Modify the constraints and solve the optimization model with the minimization of the ADPF as the goal within the second-level optimal solution range, obtaining a solution set and the minimum ADPF.
- Check the solutions of the total runoff coefficient, reservoir volume and FAR. Stop the calculation and output the final optimal solution of the model.
2.4. Uncertainty Analysis
2.4.1. Sources of Uncertainty
2.4.2. Monte Carlo Analysis
3. Results and Discussion
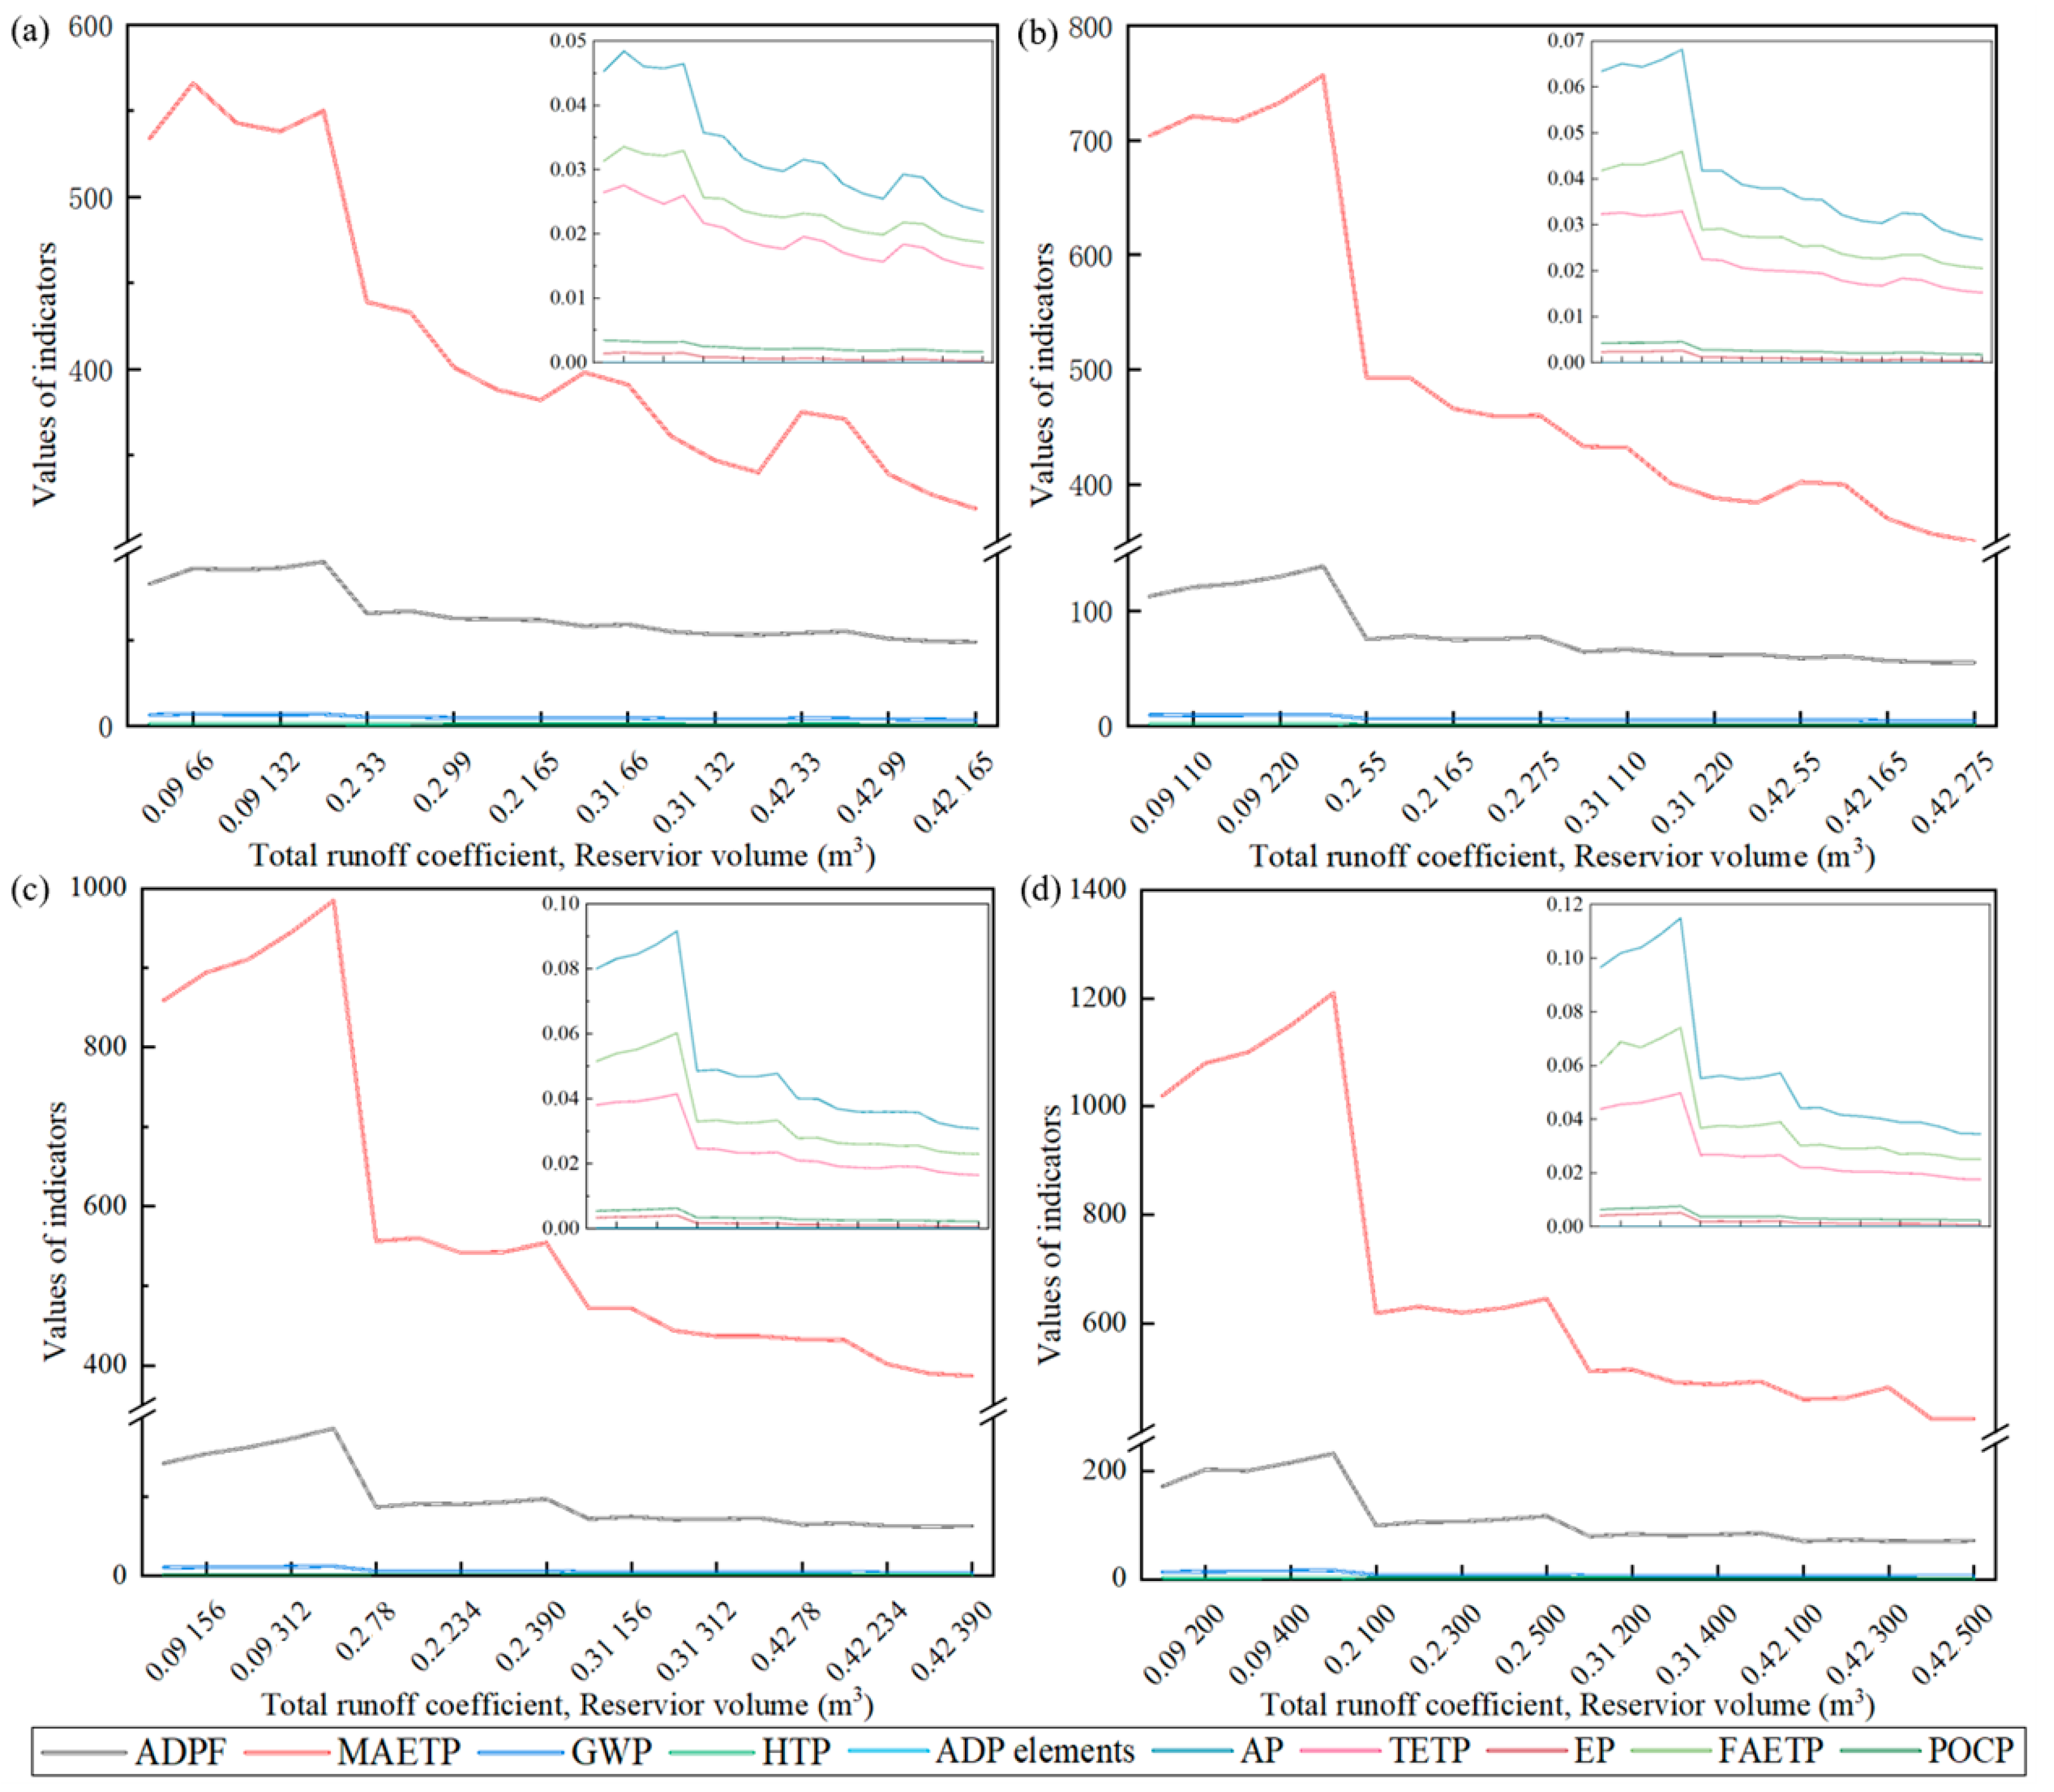
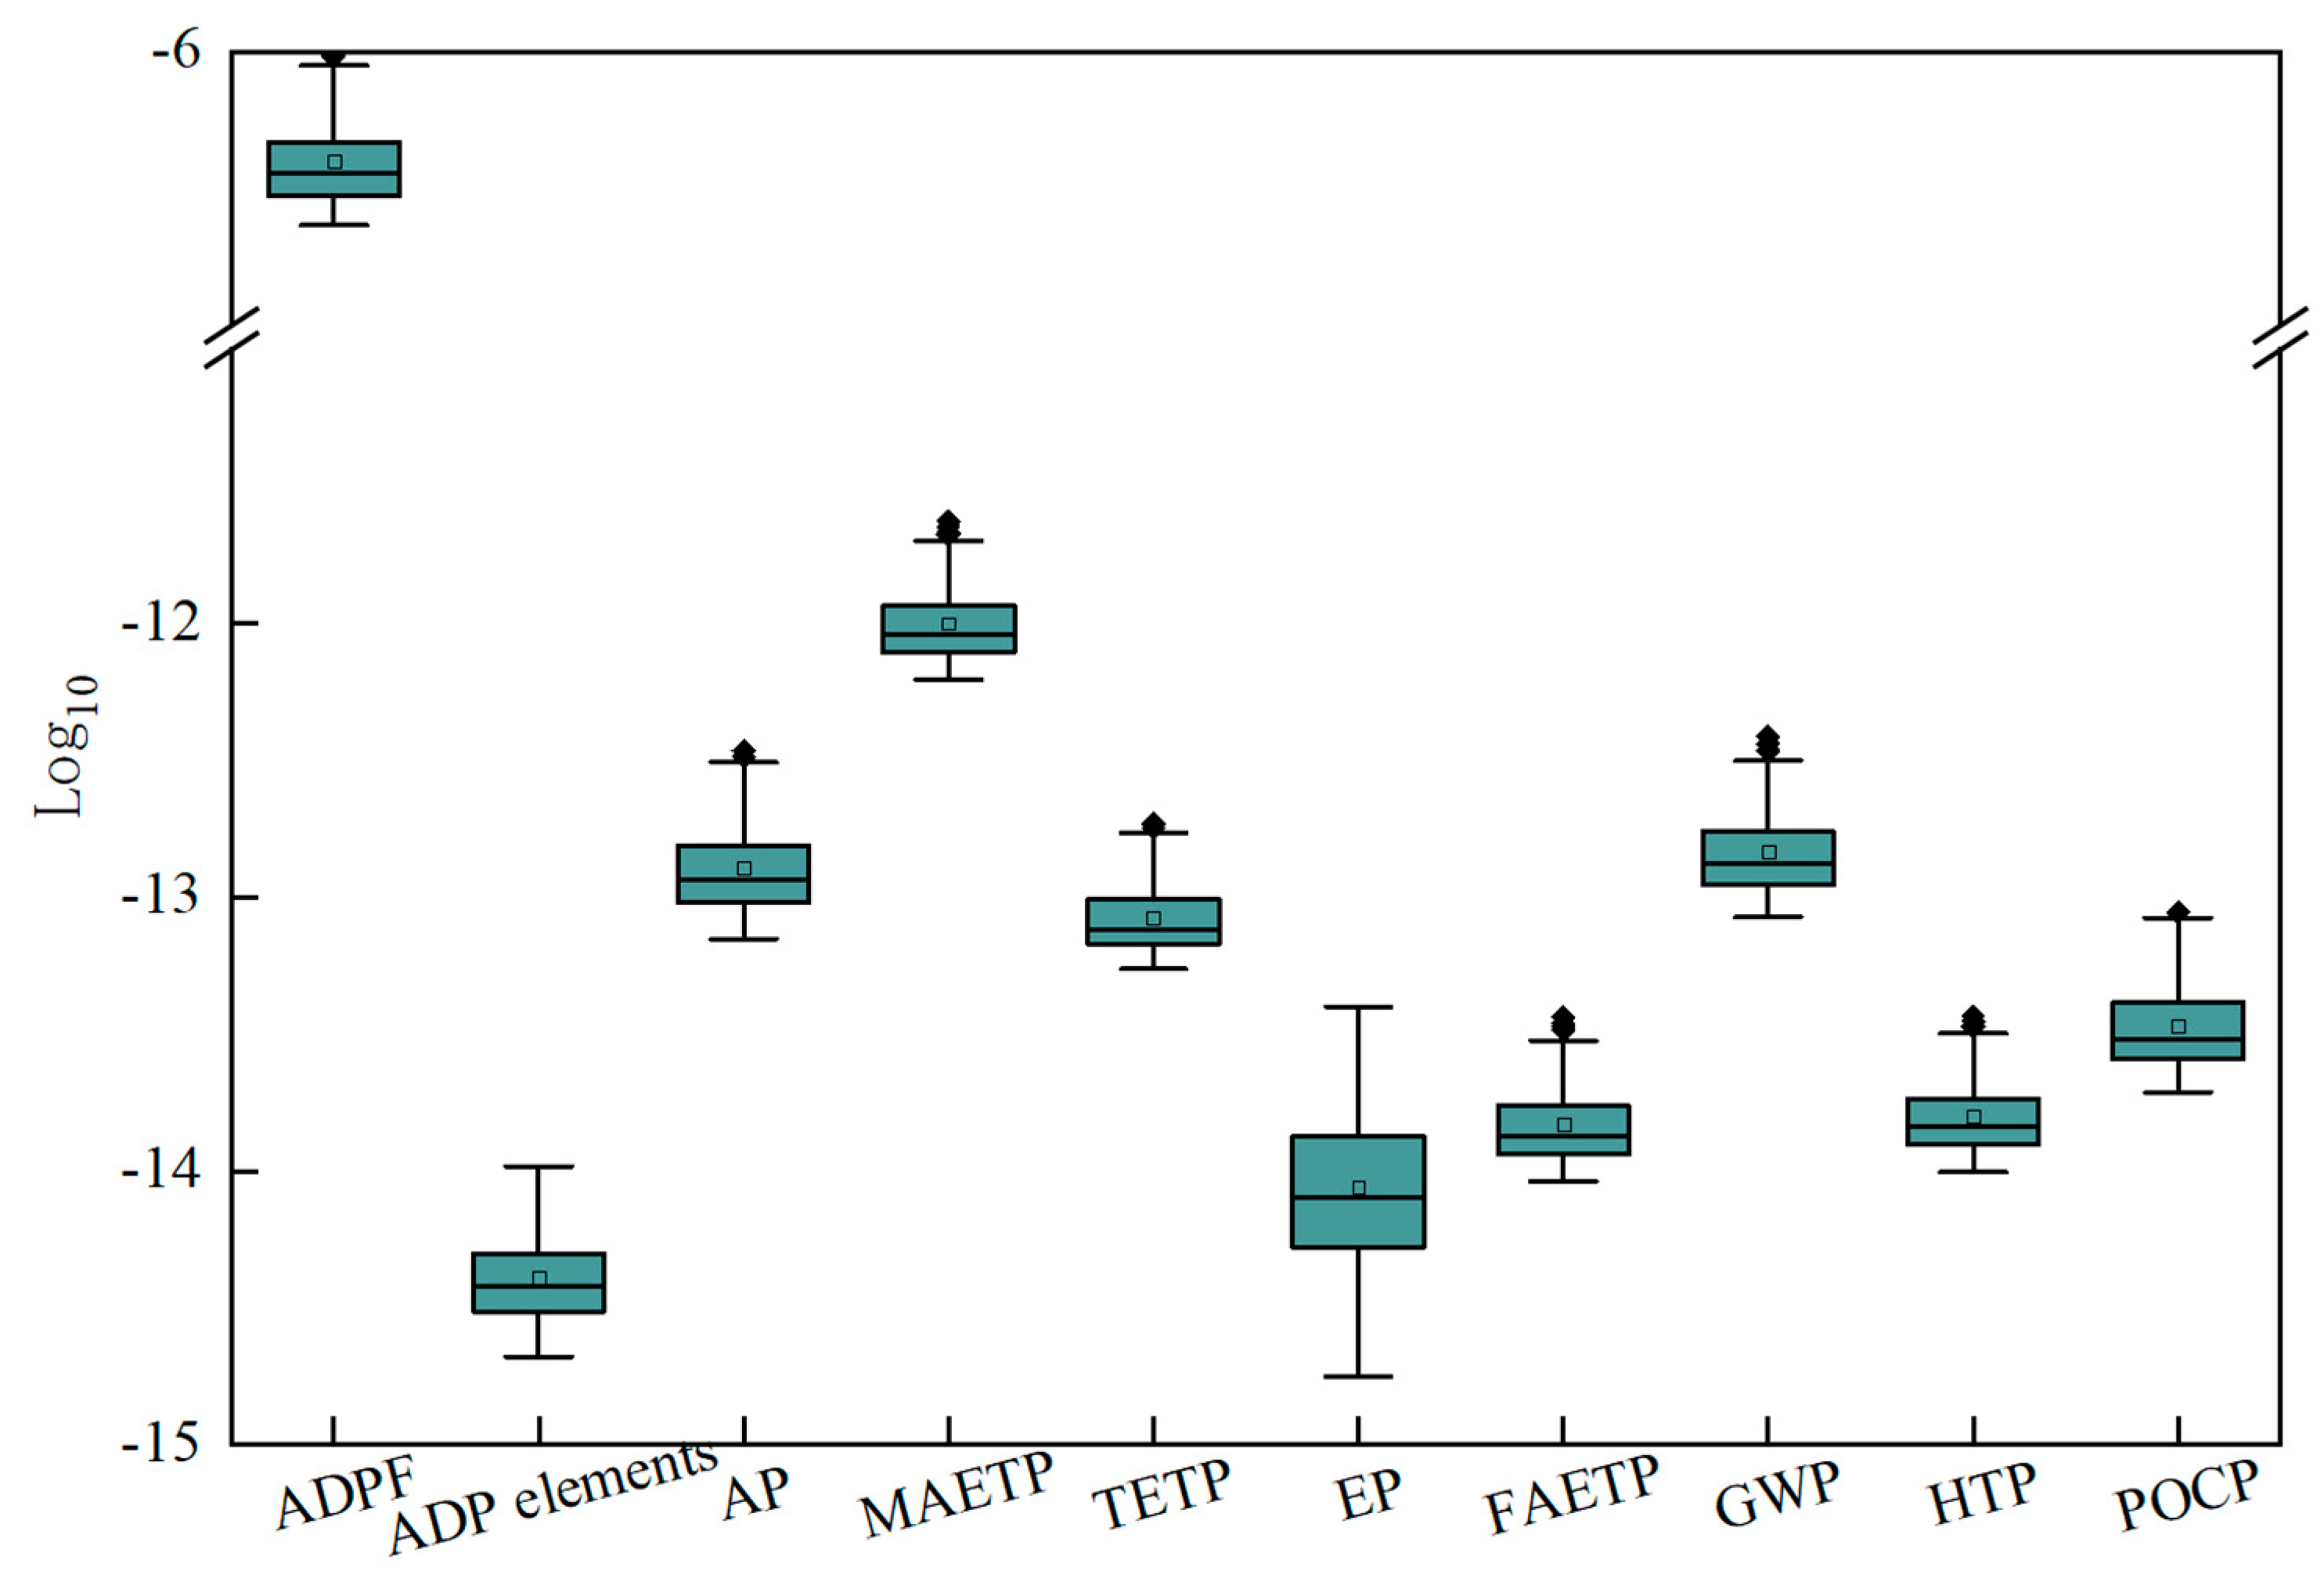
3.1. LCA Performance Analysis of CB-RWU
3.2. Multi-Objective Optimization of CB-RWU
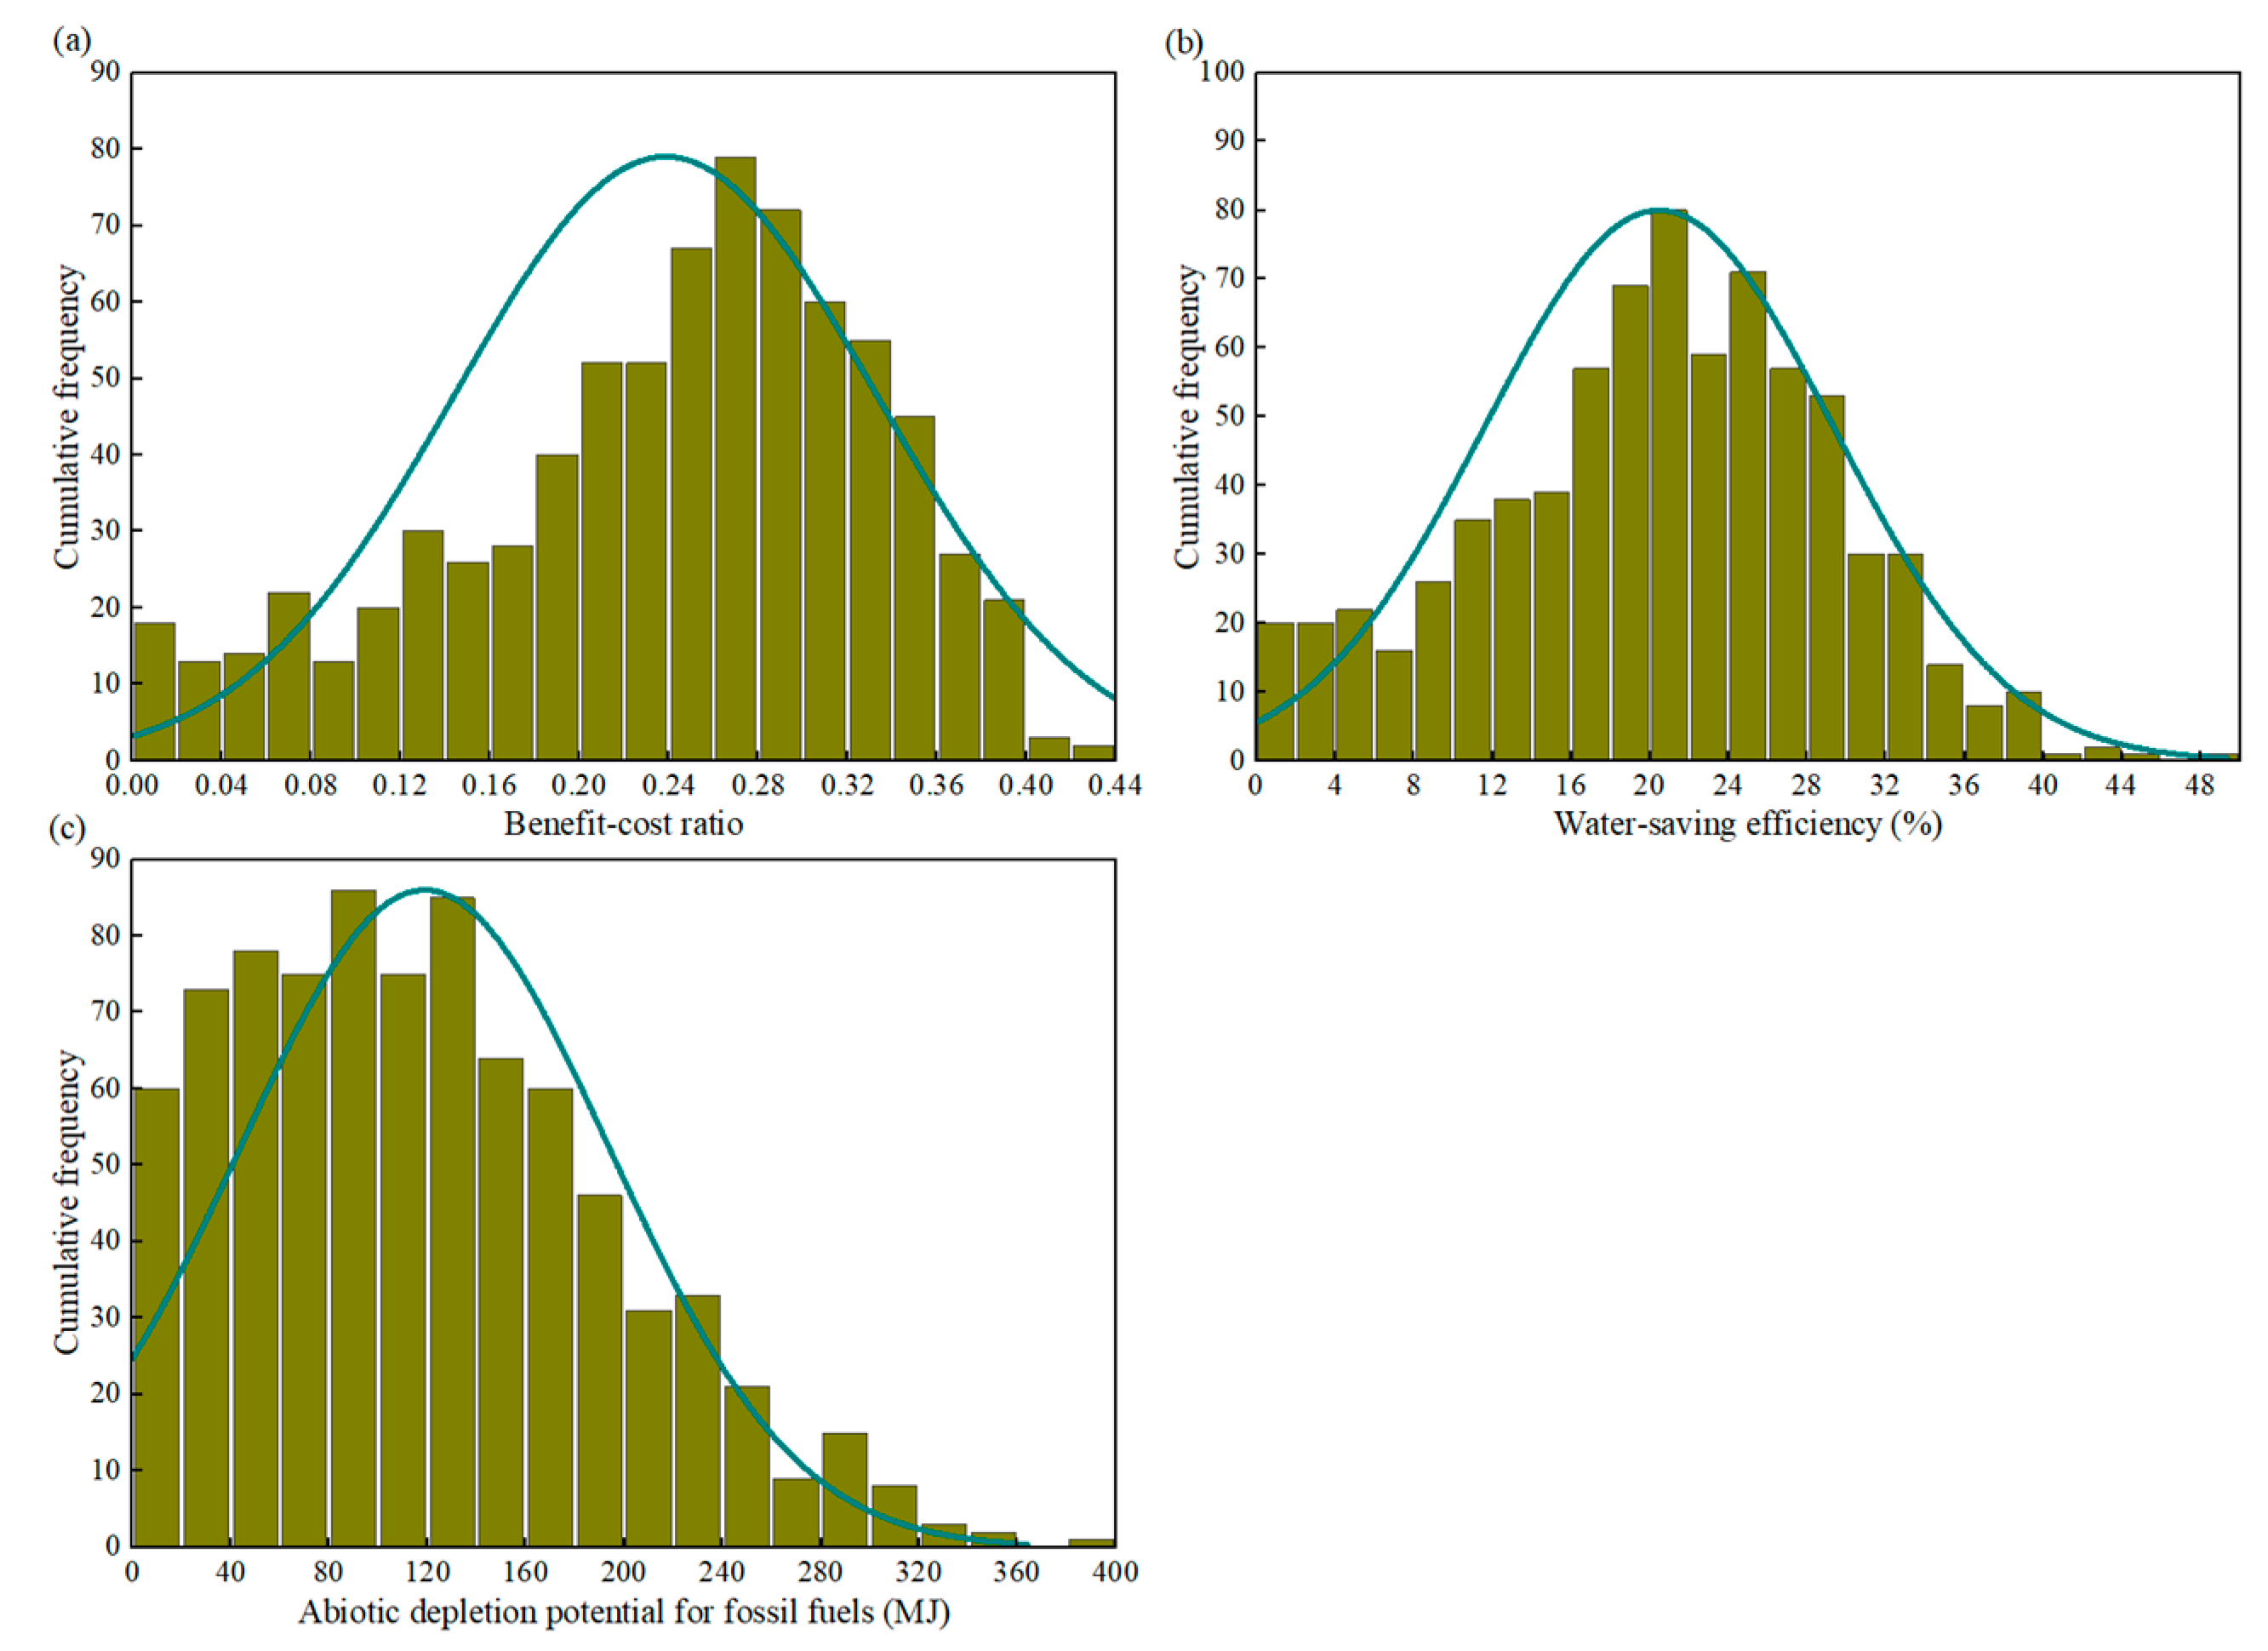
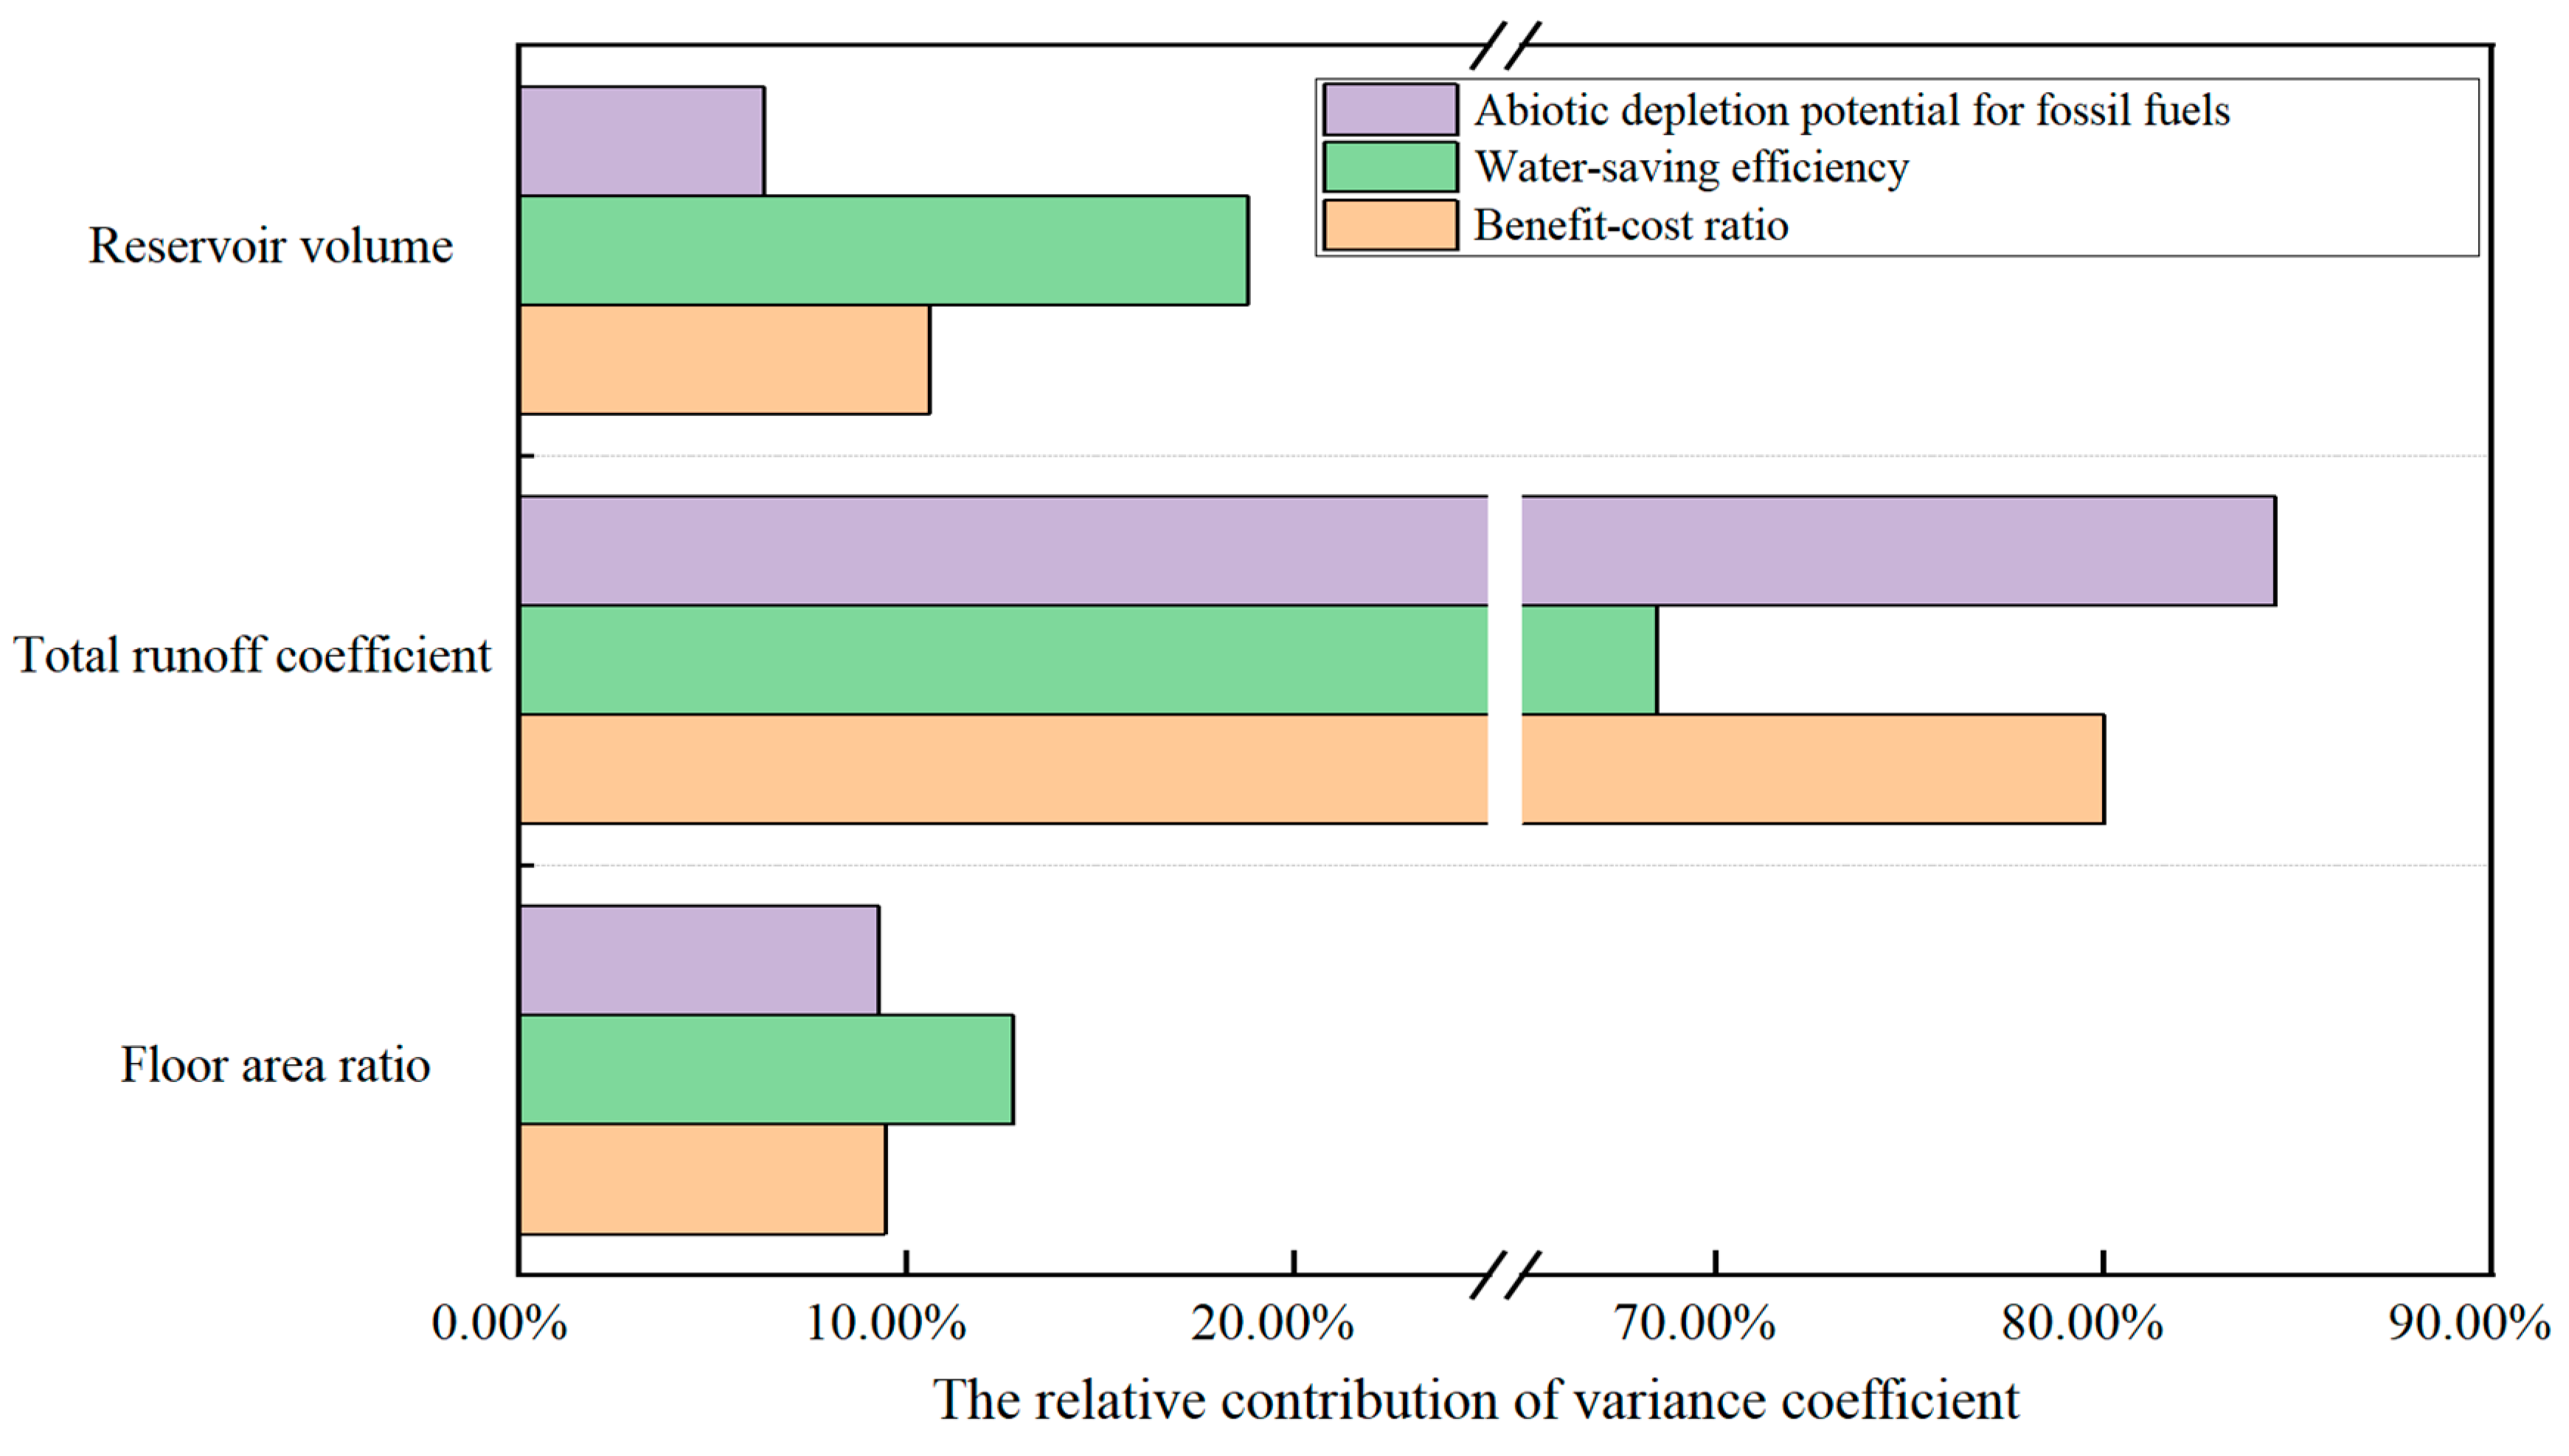
3.3. Uncertainty Analysis
4. Conclusions
Supplementary Materials
Author Contributions
Funding
Institutional Review Board Statement
Informed Consent Statement
Data Availability Statement
Conflicts of Interest
Abbreviations
| ADP elements | abiotic depletion potential elements, kg Sb eq. |
| ADPF | abiotic depletion potential for fossil fuels, MJ |
| AP | acidification potential, kg SO2 eq. |
| BCR | benefit–cost ratio |
| CB-RWU | community-based rainwater utilization |
| COD | chemical oxygen demand |
| CV | coefficient of variance |
| d | days of community-based rainwater utilization runed |
| Dt | water demand on day t, m3 |
| EP | eutrophication potential, kg PO43− eq. |
| F | the total area of the catchment area, m2 |
| FAETP | freshwater aquatic ecotoxicity potential, kg DCB eq. |
| FAR | floor area ratio |
| GHG | greenhouse gas |
| GWP | global warming potential, kg CO2 eq. |
| Ht | the rainfall on day t, mm |
| HTP | human toxicity potential, kg DCB eq. |
| Ii | investment of community-based rainwater utilization system in year i, yuan |
| ISO | International Organization for Standardization |
| runoff generated on day t | |
| k | the underlying surface types, namely, green land (k = 1), permeable pavement (k = 2), hard pavement (k = 3) and roof (k = 4) |
| LCA | life cycle assessment |
| LID | low-impact development |
| MAETP | marine aquatic ecotoxicity potential, kg DCB eq. |
| Mi | the operation and maintenance costs in year i, yuan |
| n | the daily water used quota of the study aera, L/per−1·d−1 |
| N | the population of the community |
| NSGA-II | the nondominated sorting genetic algorithm II |
| O&M | the operation and maintenance |
| Pi | price of conventional water resources in year i, yuan/m3 |
| POCP | photochemical ozone creation potential, kg Ethene eq. |
| r | annual interest rate |
| RMSE | root mean square error |
| Rt | the remaining rainfall in the reservoir at the end of day t, m3 |
| RWH | rainwater harvesting |
| SC | storage capacity, m3 |
| Si | conventional water resources saved by using rainwater in year i, m3 |
| SS | suspended solids |
| T | total years of operation, y |
| TETP | terrestrial ecotoxicity potential, kg DCB eq. |
| WSE | water-saving efficiency |
| Yt | water used on day t, m3 |
| α | the proportion of non-potable water in the daily water use quota |
| βk | the proportion of area for each underlying surface to total catchment area |
| δk | the abandoned flow at the beginning of rainfall, mm |
| Ψ | the total runoff coefficient of the community |
| Ψk | the runoff coefficient of each underlying surface |
References
- Chao-Hsien, L.; En-Hao, H.; Yie-Ru, C. Designing a rainwater harvesting system for urban green roof irrigation. Water Supply 2014, 15, 271–277. [Google Scholar] [CrossRef]
- Ye, Q.; Li, Y.; Zhuo, L.; Zhang, W.; Xiong, W.; Wang, C.; Wang, P. Optimal allocation of physical water resources integrated with virtual water trade in water scarce regions: A case study for Beijing, China. Water Res. 2018, 129, 264–276. [Google Scholar] [CrossRef]
- Nixdorff, H.; Noga, J.; Amsalu, D.; Springett, J.; Ashbolt, N. Improving the implementation of water and resource recovery in Canada. J. Water Reuse Desalination 2021, 11, 453–463. [Google Scholar] [CrossRef]
- Fonseca, C.R.; Hidalgo, V.; Díaz-Delgado, C.; Vilchis-Francés, A.Y.; Gallego, I. Design of optimal tank size for rainwater harvesting systems through use of a web application and geo-referenced rainfall patterns. J. Clean. Prod. 2017, 145, 323–335. [Google Scholar] [CrossRef]
- Lúcio, C.; Silva, C.M.; Sousa, V. A scale-adaptive method for urban rainwater harvesting simulation. Environ. Sci. Pollut. Res. 2019, 27, 4557–4570. [Google Scholar] [CrossRef] [PubMed]
- Moniruzzaman, M.; Imteaz, M.A. Generalized equations, climatic and spatial variabilities of potential rainwater savings: A case study for Sydney. Resour. Conserv. Recycl. 2017, 125, 139–156. [Google Scholar] [CrossRef]
- Yue, T.; Zhang, S.; Zhang, J.; Zhang, B.; Li, R. Variation of representative rainfall time series length for rainwater harvesting modelling in different climatic zones. J. Environ. Manag. 2020, 269, 110731. [Google Scholar] [CrossRef]
- Neibaur, E.E.; Anderson, E.P. An examination of factors affecting sustainability of domestic rainwater harvesting systems in a rural, semi-arid region of Mexico. Water Supply 2016, 16, 1388–1397. [Google Scholar] [CrossRef]
- Hashim, H.; Hudzori, A.; Yusop, Z.; Ho, W. Simulation based programming for optimization of large-scale rainwater harvesting system: Malaysia case study. Resour. Conserv. Recycl. 2013, 80, 1–9. [Google Scholar] [CrossRef]
- Kim, R.-H.; Lee, S.; Kim, Y.-M.; Lee, J.-H.; Kim, S.-K.; Kim, S.-G. Pollutants in Rainwater Runoff in Korea: Their Impacts on Rainwater Utilization. Environ. Technol. 2005, 26, 411–420. [Google Scholar] [CrossRef]
- Parkinson, J.; Schütze, M.; Butler, D. Modelling the impacts of domestic water conservation on the sustainability of the urban sewerage system. Water Environ. J. 2005, 19, 49–56. [Google Scholar] [CrossRef]
- Sharma, S.K.; Vairavamoorthy, K. Urban water demand management: Prospects and challenges for the developing countries. Water Environ. J. 2009, 23, 210–218. [Google Scholar] [CrossRef]
- Słyś, D. Potential of rainwater utilization in residential housing in Poland. Water Environ. J. 2009, 23, 318–325. [Google Scholar] [CrossRef]
- Villarreal, E.L.; Dixon, A. Analysis of a rainwater collection system for domestic water supply in Ringdansen, Norrköping, Sweden. Build. Environ. 2005, 40, 1174–1184. [Google Scholar] [CrossRef]
- Zhu, K.; Zhang, L.; Hart, W.; Liu, M.; Chen, H. Quality issues in harvested rainwater in arid and semi-arid Loess Plateau of northern China. J. Arid. Environ. 2004, 57, 487–505. [Google Scholar] [CrossRef]
- Morales-Pinzón, T.; Lurueña, R.; Rieradevall, J.; Gasol, C.M.; Gabarrell, X. Financial feasibility and environmental analysis of potential rainwater harvesting systems: A case study in Spain. Resour. Conserv. Recycl. 2012, 69, 130–140. [Google Scholar] [CrossRef]
- Morales-Pinzón, T.; Rieradevall, J.; Gasol, C.M.; Gabarrell, X. Modelling for economic cost and environmental analysis of rainwater harvesting systems. J. Clean. Prod. 2015, 87, 613–626. [Google Scholar] [CrossRef]
- Devkota, J.P.; Burian, S.J.; Tavakol-Davani, H.; Apul, D.S. Introducing demand to supply ratio as a new metric for understanding life cycle greenhouse gas (GHG) emissions from rainwater harvesting systems. J. Clean. Prod. 2017, 163, 274–284. [Google Scholar] [CrossRef]
- Rahman, S.; Khan, M.T.R.; Akib, S.; Din, N.B.C.; Biswas, S.K.; Shirazi, S.M. Sustainability of Rainwater Harvesting System in terms of Water Quality. Sci. World J. 2014, 2014, 721357. [Google Scholar] [CrossRef] [PubMed]
- Vargas-Parra, M.V.; Rovira-Val, M.R.; Gabarrell, X.; Villalba, G. Rainwater harvesting systems reduce detergent use. Int. J. Life Cycle Assess. 2018, 24, 809–823. [Google Scholar] [CrossRef]
- Faragò, M.; Brudler, S.; Godskesen, B.; Rygaard, M. An eco-efficiency evaluation of community-scale rainwater and stormwater harvesting in Aarhus, Denmark. J. Clean. Prod. 2019, 219, 601–612. [Google Scholar] [CrossRef]
- Ghimire, S.R.; Johnston, J.M. Holistic impact assessment and cost savings of rainwater harvesting at the watershed scale. Elem. Sci. Anthr. 2017, 5, 9. [Google Scholar] [CrossRef] [PubMed]
- Li, Y.; Huang, Y.; Ye, Q.; Zhang, W.; Meng, F.; Zhang, S. Multi-objective optimization integrated with life cycle assessment for rainwater harvesting systems. J. Hydrol. 2018, 558, 659–666. [Google Scholar] [CrossRef]
- Yan, X.; Ward, S.; Butler, D.; Daly, B. Performance assessment and life cycle analysis of potable water production from harvested rainwater by a decentralized system. J. Clean. Prod. 2018, 172, 2167–2173. [Google Scholar] [CrossRef]
- Zhang, Y.; Chen, D.; Chen, L.; Ashbolt, S. Potential for rainwater use in high-rise buildings in Australian cities. J. Environ. Manag. 2009, 91, 222–226. [Google Scholar] [CrossRef]
- Sun, W.J.; Li, H.E.; Liu, Q.C.; Jia, B.K.; Zhang, Z.W.; Dang, F. Benefits of rainwater utilization in urban sponge community. Bull. Soil Water Conserv. 2020, 40, 170–175. [Google Scholar] [CrossRef]
- Gu, Y.H.; Zheng, T.; Cheng, W.; Xu, J.C.; Huang, J.W.; Qiao, J.L.; Wang, H.W. Assessment method on control potentiality of rainwater runoff non-point source pollution in urban residential communities. Water Wastewater Eng. 2019, 45, 102–106. [Google Scholar] [CrossRef]
- Li, Y.; Xiong, W.; Zhang, W.; Wang, C.; Wang, P. Life cycle assessment of water supply alternatives in water-receiving areas of the South-to-North Water Diversion Project in China. Water Res. 2016, 89, 9–19. [Google Scholar] [CrossRef]
- Meyer, D.E.; Upadhyayula, V.K.K. The use of life cycle tools to support decision making for sustainable nanotechnologies. Clean Technol. Environ. Policy 2013, 16, 757–772. [Google Scholar] [CrossRef]
- Angrill, S.; Segura-Castillo, L.; Petit-Boix, A.; Rieradevall, J.; Gabarrell, X.; Josa, A. Environmental performance of rainwater harvesting strategies in Mediterranean buildings. Int. J. Life Cycle Assess. 2016, 22, 398–409. [Google Scholar] [CrossRef]
- Spatari, S.; Yu, Z.; Montalto, F.A. Life cycle implications of urban green infrastructure. Environ. Pollut. 2011, 159, 2174–2179. [Google Scholar] [CrossRef] [PubMed]
- Pirouz, B.; Palermo, S.A.; Turco, M.; Piro, P. New Mathematical Optimization Approaches for LID Systems. Lect. Notes Comput. Sci. 2020, 11973, 583–595. [Google Scholar] [CrossRef]
- Taghizadeh, S.; Khani, S.; Rajaee, T. Hybrid SWMM and particle swarm optimization model for urban runoff water quality control by using green infrastructures (LID-BMPs). Urban For. Urban Green. 2021, 60, 127032. [Google Scholar] [CrossRef]
- Gao, J.Y.; Li, J.K.; Li, Y.J.; Xia, J.; Lv, P. A Distribution Optimization Method of Typical LID Facilities for Sponge City Construction. Ecohydrol. Hydrobiol. 2020, 21, 13–22. [Google Scholar] [CrossRef]
- Rezaei, A.R.; Ismail, Z.; Niksokhan, M.H.; Dayarian, M.A.; Ramli, A.H.; Yusoff, S. Optimal implementation of low impact development for urban stormwater quantity and quality control using multi-objective optimization. Environ. Monit. Assess. 2021, 193, 241. [Google Scholar] [CrossRef] [PubMed]
- Xu, T.; Engel, B.A.; Shi, X.M.; Leng, L.Y.; Jia, H.F.; Yu, S.L.; Liu, Y.Z. Marginal-cost-based greedy strategy (MCGS): Fast and reliable optimization of low impact development (LID) layout. Sci. Total Environ. 2018, 640, 570–580. [Google Scholar] [CrossRef]
- Yazdi, J.; Neyshabouri, S.S. Identifying low impact development strategies for flood mitigation using a fuzzy-probabilistic approach. Environ. Model. Softw. 2014, 60, 31–44. [Google Scholar] [CrossRef]
- Liu, Y.; Cibin, R.; Bralts, V.F.; Chaubey, I.; Bowling, L.C.; Engel, B.A. Optimal selection and placement of BMPs and LID practices with a rainfall-runoff model. Environ. Model. Softw. 2016, 80, 281–296. [Google Scholar] [CrossRef]
- Baek, S.-S.; Choi, D.-H.; Jung, J.-W.; Lee, H.-J.; Lee, H.; Yoon, K.-S.; Cho, K.H. Optimizing low impact development (LID) for stormwater runoff treatment in urban area, Korea: Experimental and modeling approach. Water Res. 2015, 86, 122–131. [Google Scholar] [CrossRef]
- Sousa, V.; Silva, C.M.; Meireles, I.C. Technical-financial evaluation of rainwater harvesting systems in commercial buildings–case ase studies from Sonae Sierra in Portugal and Brazil. Environ. Sci. Pollut. Res. 2017, 25, 19283–19297. [Google Scholar] [CrossRef]
- Bakken, T.H.; Killingtveit, A.; Alfredsen, K. The Water Footprint of Hydropower Production-State of the Art and Methodological Challenges. Glob. Chall. 2017, 1, 1600018. [Google Scholar] [CrossRef]
- Berger, M.; Eisner, S.; Van Der Ent, R.; Flörke, M.; Link, A.; Poligkeit, J.; Bach, V.; Finkbeiner, M. Enhancing the Water Accounting and Vulnerability Evaluation Model: WAVE+. Environ. Sci. Technol. 2018, 52, 10757–10766. [Google Scholar] [CrossRef] [PubMed]
- Buxmann, K.; Koehler, A.; Thylmann, D. Water scarcity footprint of primary aluminium. Int. J. Life Cycle Assess. 2016, 21, 1605–1615. [Google Scholar] [CrossRef]
- Herrmann, I.T.; Moltesen, A. Does it matter which Life Cycle Assessment (LCA) tool you choose? A comparative assessment of SimaPro and GaBi. J. Clean. Prod. 2015, 86, 163–169. [Google Scholar] [CrossRef]
- Ghimire, S.R.; Johnston, J.M.; Ingwersen, W.W.; Sojka, S. Life cycle assessment of a commercial rainwater harvesting system compared with a municipal water supply system. J. Clean. Prod. 2017, 151, 74–86. [Google Scholar] [CrossRef] [PubMed]
- Ke, W.L.; Lei, Y.L.; Sha, J.H.; Zhang, G.F.; Yan, J.J.; Lin, X.Y.; Pan, X.P. Dynamic simulation of water resource management focused on water allocation and water reclamation in Chinese mining cities. Water Policy 2016, 18, 844–861. [Google Scholar] [CrossRef]
- O’Sullivan, A.D.; Wicke, D.; Hengen, T.J.; Sieverding, H.L.; Stone, J.J. Life Cycle Assessment modelling of stormwater treatment systems. J. Environ. Manag. 2015, 149, 236–244. [Google Scholar] [CrossRef]
- Wang, R.; Eckelman, M.J.; Zimmerman, J.B. Consequential Environmental and Economic Life Cycle Assessment of Green and Gray Stormwater Infrastructures for Combined Sewer Systems. Environ. Sci. Technol. 2013, 47, 11189–11198. [Google Scholar] [CrossRef]
- Li, J.Q.; Liu, Y.; Liu, X.J. Public Acceptability Survey and Analysis of Urban Stormwater Control and Utilization Policies: Taking Beijing as an Example. Lect. Note Earth Sci. 2011, 276–282. [Google Scholar]
- Leong, J.Y.C.; Balan, P.; Chong, M.N.; Poh, P.E. Life-cycle assessment and life-cycle cost analysis of decentralised rainwater harvesting, greywater recycling and hybrid rainwater-greywater systems. J. Clean. Prod. 2019, 229, 1211–1224. [Google Scholar] [CrossRef]
- Brecklova, V.; Gebeltova, Z. Economic Valuation of Model Cases of Rainwater Utilization. Agrar. Perspect 2020, 66–74. [Google Scholar]
- Alim, M.A.; AliAshraf, A.F.M.; Rahman, A.; Tao, Z.; Roy, R.; Khan, M.M.; Shirin, S. Experimental investigation of an integrated rainwater harvesting unit for drinking water production at the household level. J. Water Process. Eng. 2021, 44, 102318. [Google Scholar] [CrossRef]
- Terêncio, D.; Fernandes, L.S.; Cortes, R.; Pacheco, F. Improved framework model to allocate optimal rainwater harvesting sites in small watersheds for agro-forestry uses. J. Hydrol. 2017, 550, 318–330. [Google Scholar] [CrossRef]
- Liu, J.; Li, H.; Wang, Y.; Zhang, H. Integrated life cycle assessment of permeable pavement: Model development and case study. Transp. Res. Part D Transp. Environ. 2020, 85, 102381. [Google Scholar] [CrossRef]
- Antunes, L.N.; Ghisi, E.; Thives, L.P. Permeable Pavements Life Cycle Assessment: A Literature Review. Water 2018, 10, 1575. [Google Scholar] [CrossRef]
- Jiang, Z.-Y.; Li, X.-Y.; Ma, Y.-J. Water and Energy Conservation of Rainwater Harvesting System in the Loess Plateau of China. J. Integr. Agric. 2013, 12, 1389–1395. [Google Scholar] [CrossRef]
- Adugna, D.; Jensen, M.B.; Lemma, B.; Gebrie, G.S. Assessing the Potential for Rooftop Rainwater Harvesting from Large Public Institutions. Int. J. Environ. Res. Public Heal. 2018, 15, 336. [Google Scholar] [CrossRef]
- Koumoura, K.A.; Feloni, E.G.; Londra, P.A.; Baltas, E.A.; Tsihrintzis, V.A. Uncertainty analysis in sizing rainwater harvesting tanks in an isolated island with limited water resources. Glob. NEST Int. J. 2018, 20, 534–540. [Google Scholar] [CrossRef]
- Silva, A.S.; Ghisi, E. Uncertainty analysis of daily potable water demand on the performance evaluation of rainwater harvesting systems in residential buildings. J. Environ. Manag. 2016, 180, 82–93. [Google Scholar] [CrossRef] [PubMed]
- Vargas, D.; Dominguez, I.; Ward, S.; Oviedo-Ocaña, E.R. Assisting global rainwater harvesting practitioners: A decision support tool for tank sizing method selection under uncertainty. Environ. Sci. Water Res. Technol. 2019, 5, 506–520. [Google Scholar] [CrossRef]
- Shi, L. Research on dynamic model of optimal simulation system for urban water resources sustainable utilization based on complex scientific management. Desalination Water Treat. 2018, 125, 156–163. [Google Scholar] [CrossRef]
- Wang, S.; Xie, Y.L.; Huang, G.H.; Yao, Y.; Wang, S.Y.; Li, Y.F. A Structural Adjustment optimization model for electric-power system management under multiple Uncertainties—A case study of Urumqi city, China. Energy Policy 2021, 149, 112056. [Google Scholar] [CrossRef]
- Oliver-Solà, J.; Josa, A.; Rieradevall, J.; Gabarrell, X. Environmental optimization of concrete sidewalks in urban areas. Int. J. Life Cycle Assess. 2009, 14, 302–312. [Google Scholar] [CrossRef]
- Josa, A.; Aguado, A.; Cardim, A.; Byars, E. Comparative analysis of the life cycle impact assessment of available cement inventories in the EU. Cem. Concr. Res. 2007, 37, 781–788. [Google Scholar] [CrossRef]
- Ghimire, S.R.; Johnston, J.M.; Ingwersen, W.W.; Hawkins, T.R. Life Cycle Assessment of Domestic and Agricultural Rainwater Harvesting Systems. Environ. Sci. Technol. 2014, 48, 4069–4077. [Google Scholar] [CrossRef] [PubMed]
- Vieira, A.S.; Beal, C.D.; Ghisi, E.; Stewart, R.A. Energy intensity of rainwater harvesting systems: A review. Renew. Sustain. Energy Rev. 2014, 34, 225–242. [Google Scholar] [CrossRef]
- Sara, A.; Ramon, F.; Carles, M. Environmental analysis of rainwater harvesting infrastructures in diffuse and compact urban models of Mediterranean climate. Water Use LCA 2012, 17, 25–42. [Google Scholar]
- Farreny, R.; Gabarrell, X.; Rieradevall, J. Cost-efficiency of rainwater harvesting strategies in dense Mediterranean neighbourhoods. Resour. Conserv. Recycl. 2011, 55, 686–694. [Google Scholar] [CrossRef]
- Islam, M.M.; Afrin, S.; Tarek, M.H.; Rahman, M. Reliability and financial feasibility assessment of a community rainwater harvesting system considering precipitation variability due to climate change. J. Environ. Manag. 2021, 289, 112507. [Google Scholar] [CrossRef]
- Ako, A.A.; Nzali, C.T.; Lifongo, L.L.; Nkeng, G.E. Rainwater harvesting (RWH): A supplement to domestic water supply in Mvog-Betsi, Yaoundé-Cameroon. Water Supply 2021, 22, 1141–1154. [Google Scholar] [CrossRef]
- Stec, A.; Zeleňáková, M. An Analysis of the Effectiveness of Two Rainwater Harvesting Systems Located in Central Eastern Europe. Water 2019, 11, 458. [Google Scholar] [CrossRef]


| Category | Indicators | Abbreviation | Unit |
|---|---|---|---|
| Resource depletion | Abiotic Depletion Potential for fossil fuels | ADPF | MJ |
| Abiotic Depletion Potential elements | ADP elements | kg Sb eq. | |
| Ecosystem | Acidification Potential | AP | kg SO2 eq. |
| Eutrophication Potential | EP | kg PO43− eq. | |
| Marine Aquatic Ecotoxicity Potential | MAETP | kg DCB eq. | |
| Freshwater Aquatic Ecotoxicity Potential | FAETP | kg DCB eq. | |
| Terrestrial Ecotoxicity Potential | TETP | kg DCB eq. | |
| Human health | Global Warming Potential | GWP | kg CO2 eq. |
| Human Toxicity Potential | HTP | kg DCB eq. | |
| Photochemical Oxidant Creation Potential | POCP | kg Ethene eq. |
| Number | Underlying Surface Type | Runoff Coefficient (Ψk) |
|---|---|---|
| 1 | Green lands | 0.15 |
| 2 | Permeable pavement | 0.29–0.36 |
| 3 | Hard pavement | 0.80–0.90 |
| 4 | Roof | 0.60–0.70 |
| Parameters | Probability Distribution | Range | Mathematical Expectation |
|---|---|---|---|
| Total runoff coefficient | Normal distribution | [0.09, 0.42] | 0.255 |
| Reservoir volume (m3) | Minimum distribution | [33, 500] | 270.6 |
| Floor area ratio (FAR) | Normal distribution | [1.0, 3.1] | 2.05 |
| Benefit–Cost Ratio | Water-Saving Efficiency | Abiotic Depletion Potential for Fossil Fuels (MJ) | Floor Area Ratio | Total Runoff Coefficient | Reservoir Volume (m3) | |
|---|---|---|---|---|---|---|
| Lexicographic optimization with benefit–cost ratio prioritized above water-saving efficiency and environmental impact | ||||||
| The first-level | 0.3347 | 32.71% * | 26.31 * | 1.000 | 0.420 | 165 |
| The second-level | 0.3288 | 31.63% | 29.24 * | 1.070 | 0.415 | 172 |
| The third-level | 0.3098 | 28.47% | 24.68 | 1.017 | 0.420 | 124 |
| Lexicographic optimization with environmental impact prioritized above water-saving efficiency and benefit–cost ratio | ||||||
| The first-level | 0.2456 | 19.84% | 21.56 | 1.000 | 0.420 | 33 |
| The second-level | 0.3091 | 28.36% | 24.63 | 1.000 | 0.420 | 118 |
| The third-level | 0.3029 | 27.45% | 24.38 | 1.003 | 0.420 | 110 |
| Traditional multi-objective optimization | ||||||
| / | 0.2456 | 19.84% | 21.56 | 1.000 | 0.420 | 33 |
| Number | Underlying Surface Type | Runoff Coefficient (Ψk) | Proportion of Area (βk) |
|---|---|---|---|
| 1 | green lands | 0.15 | 35% |
| 2 | Permeable pavement | 0.36 | 30% |
| 3 | Hard pavement | 0.90 | 10% |
| 4 | Roof | 0.70 | 25% |
| Objective Functions | Average Input 1 | Average 2 | Standard Deviation 2 | Coefficient of Variation (CV) 2 |
|---|---|---|---|---|
| Benefit-cost ratio | 0.217 | 0.238 | 0.094 | 0.395 |
| Water-saving efficiency | 18.5% | 20.5% | 0.089 | 0.433 |
| Abiotic depletion potential for fossil fuels | 92.5 MJ | 118.8 MJ | 75.222 MJ | 0.633 |
| Coefficient of Variation (CV) | Benefit–Cost Ratio (BCR) | Water-Saving Efficiency (WSE) | Abiotic Depletion Potential for Fossil Fuels (ADPF) |
|---|---|---|---|
| Floor-area ratio (FAR) | 0.078 | 0.124 | 0.178 |
| Total runoff coefficient | 0.661 | 0.664 | 1.620 |
| Reservoir volume | 0.087 | 0.182 | 0.121 |
Disclaimer/Publisher’s Note: The statements, opinions and data contained in all publications are solely those of the individual author(s) and contributor(s) and not of MDPI and/or the editor(s). MDPI and/or the editor(s) disclaim responsibility for any injury to people or property resulting from any ideas, methods, instructions or products referred to in the content. |
© 2023 by the authors. Licensee MDPI, Basel, Switzerland. This article is an open access article distributed under the terms and conditions of the Creative Commons Attribution (CC BY) license (https://creativecommons.org/licenses/by/4.0/).
Share and Cite
Li, Y.; Xu, W.; Zhang, W.; Huang, Y.; Wan, F.; Xiong, W. The Life cycle Assessment Integrated with the Lexicographic Method for the Multi-Objective Optimization of Community-Based Rainwater Utilization. Int. J. Environ. Res. Public Health 2023, 20, 2183. https://doi.org/10.3390/ijerph20032183
Li Y, Xu W, Zhang W, Huang Y, Wan F, Xiong W. The Life cycle Assessment Integrated with the Lexicographic Method for the Multi-Objective Optimization of Community-Based Rainwater Utilization. International Journal of Environmental Research and Public Health. 2023; 20(3):2183. https://doi.org/10.3390/ijerph20032183
Chicago/Turabian StyleLi, Yi, Wenjun Xu, Wenlong Zhang, Youyi Huang, Fenfen Wan, and Wei Xiong. 2023. "The Life cycle Assessment Integrated with the Lexicographic Method for the Multi-Objective Optimization of Community-Based Rainwater Utilization" International Journal of Environmental Research and Public Health 20, no. 3: 2183. https://doi.org/10.3390/ijerph20032183
APA StyleLi, Y., Xu, W., Zhang, W., Huang, Y., Wan, F., & Xiong, W. (2023). The Life cycle Assessment Integrated with the Lexicographic Method for the Multi-Objective Optimization of Community-Based Rainwater Utilization. International Journal of Environmental Research and Public Health, 20(3), 2183. https://doi.org/10.3390/ijerph20032183