Highlights
- Southern dietary pattern was characterized by higher vegetable and fruit intakes.
- Southern dietary pattern predicted fewer childhood behavioral problems.
- Latent class analysis was suitable to categorize prenatal food groups intakes.
- The effect of maternal dietary patterns on child behavior displayed sex differences.
Abstract
The relation between maternal dietary patterns during pregnancy and offspring behavioral problems is less verified. Therefore, we have aimed to assess the relationship between them and have hypothesized that children of mothers with healthy dietary patterns during pregnancy have better behavior. The 1612 mother-child pairs of the China-Anhui Birth Cohort Study (C-ABCS) have been enrolled as the study population. The dietary behaviors of mothers during early and mid-pregnancy have been investigated using a semi-quantitative food frequency questionnaire. Preschool child behavioral problems have been assessed. Clusters of maternal food groups intakes have been identified using latent class analysis, and the association between maternal dietary patterns and child behavioral problems has been subsequently analyzed using logistic regression. Maternal age at inclusion is 26.56 ± 3.51 years. There has been a preponderance of boys (53.3%). Maternal food groups intakes have been classified into four groups: “High-consumed pattern (HCP)”, “Southern dietary pattern (SDP)”, “Northern dietary pattern (NDP)”, and “Low-consumed pattern (LCP)”. The offspring with maternal SDP and NDP have lower emotional symptoms compared to the offspring with maternal LCP in the first trimester (p < 0.05). It has been reported to lower conduct problems in children with maternal SDP than the children with maternal LCP in the second trimester (p < 0.05). In boys, we have detected associations between first-trimester SDP and lower emotional symptoms (p < 0.05) and between second-trimester SDP with decreased peer relationship problems (p < 0.05). In girls, total difficulty scores are lower with second-trimester SDP (p < 0.05). Maternal SDP in early and mid-pregnancy predicts reduced behavioral problems in preschool children, while maternal HCP and NDP during pregnancy may result in fewer developmental benefits.
1. Introduction
The importance of maternal nutrition during pregnancy for fetal brain development has been well documented. Beginning from around 18 days post-fertilization, the embryo undergoes a coordinated process of nerve proliferation and migration, synaptogenesis, myelination, and apoptosis to develop and form the fetal brain [1], but the brain is more vulnerable to nutritional deficiencies at this time. Additionally, the hypothesis of the Developmental Origins of Health and Disease (DOHaD) suggests that during this period of rapid development, the brain becomes more sensitive to the environment, and this is a vulnerable and critical period of perturbation that may predispose the fetus to postnatal neuropsychological disorders [2,3,4].
Human epidemiological evidence has identified an association between maternal nutrient deficiencies during pregnancy and cognitive development of their offspring. Prenatal vitamin A, folic acid, and vitamin D deficiencies are associated with subsequent suboptimal neuropsychological development [4,5,6], such as susceptibility to autism and delayed language development, but several nutrients are not sufficient to assess the nutritional status of pregnant women, and fortunately, birth cohorts on the association of maternal dietary patterns during pregnancy with neuropsychological development of offspring have bridged this gap. Cohort findings have implied that unhealthy dietary patterns during pregnancy are associated with reduced executive function, delayed language development, and lower IQ scores in offspring, with the unhealthy diet including lower Mediterranean diet scores [7,8,9,10,11]. However, the western Mediterranean diet (higher intake of fruits, vegetables, fish, pasta, and rice, and lower intake of meat, sugar, and fat) differs from the eastern dietary pattern (predominantly carbohydrates, vegetables, fruits, pork, etc.). Furthermore, another difference is inland and coastal diets in China because of the higher intake of aquatic products in coastal diets. Therefore, it is necessary to investigate the association between dietary patterns of pregnant women and behavioral problems of offspring in China’s inland. In addition, most studies use principal component analysis (PCA) [9,11,12,13] or cluster analysis [14,15] to classify food groups intakes, but some studies prefer to use latent class analysis (LCA), which is recommended for food intakes to study the effects of mutually exclusive categories [16,17].
Accordingly, we hypothesize that children of mothers with healthy dietary patterns during pregnancy have fewer behavioral problems. This paper aims to classify maternal food group intake into appropriate categories during pregnancy in inner-city China by the LCA method and then analyze the association of dietary patterns with behavioral problems of offspring at the preschool age.
2. Methods and Materials
2.1. Study Population
This study is based on the China-Anhui Birth Cohort Study (C-ABCS), which has been established in six municipal health institutions between November 2008 and October 2010 with 5084 pregnant women and their offspring recruited. Specific inclusion and exclusion criteria are described in the team’s previously published literature [18]. After excluding maternal loss (202), spontaneous abortions (92), stillbirths, fetal death, induced labor (55), and twin pregnancy (66), 4669 pairs of mothers and singleton live births have been included in the child follow-up cohort. Between April 2014 and April 2015, we have accessed cognitive and behavioral development at early childhood (4.25 ± 0.41 years) using assessment tools that include Strengths and Difficulties Questionnaire (Edition for parents, SDQ), Clancy Autism Behavior Scale (CABS), and Conner’s Abbreviated Symptom Questionnaire (C-ASQ). However, the team consists of several groups, and our group has participated in a survey of the former 1783 mothers, thus obtaining survey data from 1783 mother-child pairs. Among them, 171 mothers have been excluded for no food intakes data, and the data of 1612 mother-child pairs is finally included in the analysis. Figure 1 provides a more visual description.
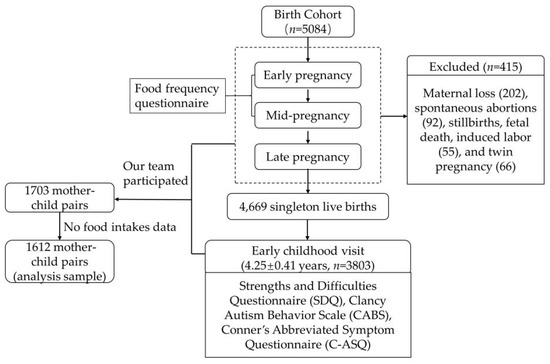
Figure 1.
Flow-diagram of the cohort participants.
2.2. Measurements
2.2.1. Food Groups Intakes Assessment during Pregnancy
Based on collected literatures and consultation with experts, a semi-quantitative food frequency questionnaire (FFQ) has been composed by selecting food items that represent the dietary intakes of pregnant women in Anhui province, China. The questionnaire is administered at 12.13 ± 3.82 and 30 ± 2.11 gestational weeks, asking about dietary intakes during the first and second trimester. A total of 19 food items have been included, which are rice, wheaten food, vegetables, fruits, beef and mutton, poultry, pork, animal fishery products, eggs, dairy products, beans, nuts, fried foods, pickles, animal innards, and garlic. For each food entry, pregnant women are asked about the frequency of intake in a week, and the options are divided into 5 levels: 1 = no intake, 2 = 1 to 3 times per week, 3 = 4 to 5 times per week, 4 = 6 to 8 times per week, and 5 = more than 9 times per week. The data of food intakes are a skewed distribution and we would regroup it. Referring to the relevant literature [16,17] and the actual distribution of the intake frequency, the criteria for regrouping are as follows. The percentage of non-consumers (option was no intake) is less than 7.5%, and variables are transformed into binary variables: above median and below median. The percentage of non-consumers is higher than 7.5% and lower than 45%, and variables are transformed into triple variables: non-consumed, below median, and above median. The percentage of non-consumers is higher than 45%, and variables are transformed into binary variables: non-consumed and consumed.
2.2.2. Outcomes
The behavioral problems in early childhood are assessed by the SDQ, C-ASQ, and CABS, which is fulfilled by a familiar caregiver and then reviewed by trained investigators.
SDQ refers to children’s behavior and emotions over the previous six months. The scale provides balanced coverage of emotional symptoms, conduct problems, hyperactivity/inattention, peer relationship problems, and prosocial behavior. The former four scales are added together to generate a total difficulties score. The higher the score of total difficulties score, the more serious the objective difficulty is, and the delineation criteria of boundary values refer to the scoring rules [19].
The 10-item C-ASQ is derived from the revised Conners Parent Rating Scale. The widely used scale is used to assess attention-deficit hyperactivity disorder (ADHD) symptoms in children. The options in this scale range from 0 (never) to 3 (frequently) according to the frequency of symptoms. ADHD symptoms have been defined as a total score of ≥15 [20].
CABS is used as a screening tool to identify children with autism. The scale consists of 14 items, with scores of 0, 1, and 2 assigned to “never”, “occasionally”, and “often”, respectively, and a total score of ≥14 is considered positive for potential autism [21].
2.2.3. Covariates
Socio-demographic variables have been investigated in a self-administered maternal and child health record form, including mainly maternal age, education level, place of residence, monthly income, type of work, secondhand smoke exposure, and home renovation at the time of inclusion. We have also extracted children’s birth date, sex of the child, birth weight, and gestational weeks of delivery from hospital birth records at the time of delivery. It should be noted that child age is calculated as the date of examination minus the date of birth, and for preterm infants, age is calculated as the date of testing minus the expected date of delivery. As pregestational body mass index (BMI) = pregestational weight (kg)/maternal height2 (m2), BMI categories specific for adult Chinese female are assigned as follows: BMI < 18.5 (underweight), BMI = 18.5–24 (normal), BMI ≥ 24 (obesity or overweight). Maternal depression is assessed by the center for epidemiological survey depression scale (CES-D) [22], with a score above 16 indicating possible depression.
2.3. Statistical Analysis
To identify mutually exclusive groupings, we have used LCA to derive dietary patterns. A trivial 1-class model is first fitted in which all individuals belong to the same category, and then 2 to 5-category models are fitted. The optimal model is selected based on BIC and AIC values while considering the same number of categories and reasonable category probabilities in different trimesters to ensure substantial dimensionality reduction in food intakes, ease of model understanding, and further analysis. The names of the clusters are chosen based on the conditional distribution of food intakes. We have four clusters of food intakes, called “High-consumed pattern (HCP)”, “Southern dietary pattern (SDP)”, “Northern dietary pattern (NDP)”, and “Low-consumed pattern (LCP)”.
Afterward, the response probabilities of the potential classes are described. The covariates in the models include mainly maternal age at inclusion, pregestational BMI, maternal education, residential region, monthly income, maternal depression, child gender, and child age at the visit. We also explore differences in the distribution of dietary patterns across covariates using χ2 test. Finally, we used a logistic regression model to access the association of dietary patterns with behavioral problems in early childhood. To verify the stability of the regression analysis results, three analytical models with different covariates have been constructed. Model 1 only includes the first trimester and second trimester dietary patterns. Secondarily, model 2 includes covariates such as child gender and age, maternal education, residence, maternal age, pregestational BMI, and monthly income, and model 3 takes into account maternal depression during pregnancy on the basis of model 2. All above analyses have been performed in Mplus 7.4 and SPSS 23.0.
3. Results
3.1. Demographic Characteristics of the Study Population
The mean ± SD age of pregnant women at inclusion is 26.56 ± 3.51 years, mostly residing in urban areas, and the highest percentage of those report a monthly income of less than 2000 CNY. There is a preponderance of boys (53.3%).
3.2. Latent Profiles of Food Intakes
Based on the lower BIC and AIC parameters in different classes of the LCA models, we have chosen to classify the first trimester and second trimester food groups intakes into four classes (Table 1). The class probability in the first and second trimesters from HCP, SDP, NDP, to LCP shows as follows: the first trimester: 0.20, 0.39, 0.18, 0.23; the second trimester: 0.19, 0.44, 0.16, 0.21.

Table 1.
Demographic characteristics of analysis samples, n (%).
3.3. Probabilities of Food Groups Intakes
Table 2 and Table 3 present the conditional distribution of food groups intakes in the first and second trimesters, making the latent classes of food intakes clearer in differentiating and labeling the clusters. Cluster 1 has the higher probability of food groups intakes in the questionnaire, so we call this cluster “HCP”. Contrary to cluster 1, cluster 2 has the lowest intakes of food groups under investigation, so we have termed cluster 2 “LCP”. Subjects in cluster 3, “SDP”, report high consumption of rice, vegetables, and fruits, and it is in line with the dietary habits of people in southern China. But compared to the cluster 3, cluster 4 has the higher consumption of wheaten food and meat, and it is similar to that of people in northern China.
Table 2.
Fit statistics for a series of latent class analysis models of prenatal food groups intakes.
Table 3.
Probabilities of the first-trimester food groups intakes derived from LCA, %.
3.4. Distribution of Maternal Diet Patterns
Table 4 reports the differences in the distribution of dietary patterns in the first and second trimester across different demographic characteristics. Higher maternal age, monthly income, place of residence, and education level are associated with significant differences of dietary pattern distribution in both trimesters (p < 0.05). Similarly, the distribution in the first trimester is different among different pre-conceptional BMI groups. In the second trimester, significant differences are observed between depressed and non-depressed mothers in the dietary pattern distribution. Nevertheless, no association is observed between child gender and maternal dietary patterns.
Table 4.
Probabilities of the second-trimester food groups intakes derived from LCA, %.
3.5. Associations of Maternal Dietary Patterns with Child Behavioral Problems
The results of behavioral tests in children are shown in Table 5. The SDQ examination data indicate that 121 (7.8%) of children have presented with behavioral problems, with the highest rate of hyperactive behavior (8.6%) and the lowest rate of peer interaction (2.6%). Meanwhile, the C-ASQ test results suggest 158 (9.8%) children with possible hyperactivity problems, and CABS test results indicate 122 (7.6%) children with a potential autistic behavioral problems.
Table 5.
Distribution of sociodemographic characteristics by prenatal maternal dietary patterns.
After adjusting for child gender and age, maternal sociodemographic characteristics, and depression, the offspring with maternal SDP and NDP have lower emotional symptoms compared to the offspring with maternal LCP in the first trimester [ORSDP (95%CI), 0.4 (0.28, 0.87); ORNDP (95%CI), 0.47 (0.24, 0.95)] (Table 6 and Table 7). Then, it has been reported to lower conduct problems in children with maternal SDP than the children with maternal LCP in the second trimester [OR (95%CI): 0.55 (0.34, 0.9)]. Results in sex-stratified analyses are slightly different. The relation of emotional symptoms and maternal SDP in early pregnancy is only observed in boys [OR (95%CI):0.35 (0.13, 0.95)] (Table 8). In addition, the associations are noted between maternal SDP in the second trimester and decreased peer relationship problems in boys [hyperactivity, OR (95%CI): 0.35 (0.15, 0.85); Peer relationship problems, OR (95%CI): 0.27 (0.09, 0.79)], and between maternal SDP in the second trimester and reduced hyperactivity [OR (95%CI); 0.35 (0.15, 0.85)]. Inversely, the association between conduct problems and maternal dietary patterns during mid-pregnancy is found only in girls. Maternal SDP in the second trimester predicts lower total difficulties score in girls [OR (95%CI): 0.44 (0.2, 0.95)]. No association was observed between dietary patterns during pregnancy and ADHD and autism.
Table 6.
Child behavioral outcomes.
Table 7.
Associations of prenatal dietary maternal patterns with child behavioral problems at preschool age.
Table 8.
Associations of prenatal maternal dietary patterns with the behavioral problems in preschool-age boys and girls.
4. Discussion
In this birth cohort study in inland China, we have observed that maternal SDP (characterized by higher vegetable and fruit intakes), NDP (characterized by higher meat intakes), and HCP (characterized by high food groups intakes) during early pregnancy are associated with lower incidence of emotional symptoms in preschool-age children compared with LCP (characterized by lower food groups intakes), and maternal SDP at mid-pregnancy is associated with reduced conduct problems in children. In addition, we have detected associations between maternal SDP in early pregnancy and lower emotional symptoms, and between maternal SDP in mid-pregnancy with decreased peer relationship problems in boys. In girls, total difficulty scores are lower with maternal SDP in mid-pregnancy. Overall, these findings supported our hypothesis, and maternal SDP in both early and mid-pregnancy may predict fewer childhood behavioral problems, but maternal HCP and NDP during pregnancy unlikely result in reduced behavioral problems.
Several birth cohort studies have reported an association between unhealthy maternal dietary patterns during pregnancy and decreased behavioral problems in the offspring. A few of these studies have had several dietary patterns that are slightly similar to the dietary patterns in this paper. The Avon Longitudinal Study of Parents and Children in the United Kingdom shows that 8-year-old children of mothers in the “vegetables and fruits” dietary cluster have higher IQs, while an unhealthy maternal diet during pregnancy (processed and junk foods) is associated with lower cognitive function in 7- and 8-year-old children [23]. The EDEN mother-child cohort in France reports a positive association between maternal “low health diet (characterized by low intake of fruits, vegetables, fish and whole grains)” and “high Western diet (processed foods and snacks)” during pregnancy and a high symptomatic ADHD-attention trajectory in children aged 3 to 8 years [7]. The Generation R Study and The Norwegian Mother and Child Cohort Study (MoBa) find similar conclusions: unhealthy dietary patterns during pregnancy are positively associated with externalizing behavior (inattention, aggression) in the offspring [8,11]. A US cohort has reported that maternal intake of a higher quality diet during pregnancy (higher Mediterranean diet score or Alternative Health Diet Index) is associated with better visuospatial skills in offspring at 3.2 years of age and better intellectual and executive functioning in offspring at 7.7 years of age [10]. Similarly, a birth cohort study in the coastal city of Jiangsu, China, identifies a high intake of dietary fiber and high-quality protein (aquatic products, fresh vegetables) during mid and late pregnancy as predictive of better gross motor and receptive communication development in 1-year-old children [9]. However, not all studies have found an association between diet during pregnancy and behavior problems in offspring, and data from The Southampton Women’s Survey does not reveal an association between vegetarian consumption during pregnancy and poorer cognitive development in children aged 6–7 years [24]. In addition, two meta-analyses have implied that higher maternal diet quality is associated with a lower risk of poorer cognitive development in offspring [5,25]. The above studies confirm the plausibility of the findings of this study.
This paper represents the children of mothers with a southern dietary pattern of higher vegetable and fruit intake that have reduced behavioral problems compared to mothers with a low intake diet. Vegetables and fruits provide the macronutrients (vitamin A, vitamin C, carotenoids, and small amounts of B vitamins) and key minerals (calcium, magnesium, potassium, and iron) that the fetal brain needs to develop in utero. Moreover, low levels of food intake imply inadequate nutrient intakes. Sub-optimal macronutrient balance and micronutrient deficiencies can lead to poor maternal body composition and metabolism, which in turn can affect maternal health and lead to intrauterine programming of the fetus, altering fetal brain morphogenesis, brain neurochemistry, and neurophysiology long-term metabolic and cognitive health consequences [2,26,27].
This study has several strengths. To our knowledge, this study is one of the few studies to use the LCA method to categorize food groups intakes during pregnancy and then explore the association with reduced behavioral problems of offspring in early childhood. LCA is applicable to a wide range of variable types (categorical and continuous variables) and provides higher classification accuracy, for it is based on probabilistic mixture modeling. It is also suitable for missing data [28,29]. This study is an inland Chinese prospective birth cohort study that investigates maternal diets at both early and mid-pregnancy visits. However, this study also has several limitations. Firstly, the main drawback of this study is that dietary patterns are assessed based on frequency of intake rather than the actual amount consumed. Secondly, the data is part of the cohort study data and not all data are available. Thirdly, it is unable to investigate the food intakes in late pregnancy and could not assess dietary information throughout pregnancy. Fourthly, the evaluation results of children’s behavioral problems, especially ASD and ADHD, are obtained through questionnaires and have not been diagnosed by special clinicians, which makes the evaluation results reliable. In addition, C-ABCS is not a national cohort and the dietary patterns in the paper are only representative of the diet of people living in central China, which makes extrapolation of the results of this study limited. Finally, although the design of the food frequency questionnaire has been discussed and modified several times, it could not cover all types of foods consumed by pregnant women, such as the lack of root and tuber crops. The deficiencies of the study do not deny its value.
5. Conclusions
This study finds that the maternal southern dietary pattern (characterized by higher vegetable and fruit intakes) is predictive of reduced behavior problems in early childhood, suggesting that health care providers should strengthen maternal knowledge about nutrition during pregnancy, especially to ensure fruit and vegetable intake.
Author Contributions
L.D.: Conceptualization, Writing—Original Draft Preparation, Writing—Review & Editing, Methodology, Formal Analysis. J.G.: Methodology, Validation, Writing—Review & Editing. Y.P.: Methodology, Writing—Review & Editing. D.H.: Methodology, Writing—Review & Editing. Z.H.: Methodology, Validation, Writing—Review & Editing. H.B.: Investigation., W.W.: Investigation. P.Z.: Conceptualization, Project Administration, Resources, Supervision. F.T.: Conceptualization, Project Administration, Resources, Supervision. J.H.: Conceptualization, Project Administration, Resources, Supervision, Funding Acquisition. All authors have read and agreed to the published version of the manuscript.
Funding
Sources of support comes from National Natural Science Foundation of China (Grant Number: 81872635, 81573164), which have provided economic support for the establishment and operation of the cohort.
Institutional Review Board Statement
This study has been conducted according to the guidelines laid down in the Declaration of Helsinki and all procedures involving research study participants have been approved by the Ethics Committee of Anhui Medical University (Grant no. 2008020).
Informed Consent Statement
Informed consent was obtained from all subjects involved in the study.
Data Availability Statement
The datasets analyzed during the current study are available from the corresponding author upon reasonable request.
Acknowledgments
The authors would like to thank Tao and Hao, other faculty members of the Department of Maternal, Child & Adolescent Health for building and running cohort and collecting data, and all the families involved for their cooperation. We would also like to thank all the medical staff from Ma’anshan maternal and child health care hospital for their support and help.
Conflicts of Interest
No potential conflict of interest was reported by the authors, and all authors have participated sufficiently in the work and have approved the final version of the manuscript.
Abbreviations
AIC, Akaike information criterion; aBIC, adjusted Bayesian information criterion; BIC, Bayesian information criterion; BLRT (p), p-Value for the bootstrapped likelihood ratio test; CABS, Clancy Autism Behavior Scale; C-ASQ, Conner’s Abbreviated Symptom Questionnaire; CNY, Chinese Yuan; HCP, High-consumed pattern; LCA, latent class analysis; LCP, Low-consumed pattern; LMR (p): p-Value for the adjusted Lo-Mendell-Rubin-test; Log (L), Log-likelihood; NDP, Northern dietary pattern; PCA, principal component analysis; SDQ, Strengths and Difficulties Questionnaire (Edition for parents); SDP, Southern dietary pattern.
References
- Tau, G.Z.; Peterson, B.S. Normal development of brain circuits. Neuropsychopharmacology 2010, 35, 147–168. [Google Scholar] [CrossRef] [PubMed]
- Georgieff, M.K. Nutrition and the developing brain: Nutrient priorities and measurement. Am. J. Clin. Nutr. 2007, 85, 614S–620S. [Google Scholar] [CrossRef] [PubMed]
- Power, C.; Kuh, D.; Morton, S. From developmental origins of adult disease to life course research on adult disease and aging: Insights from birth cohort studies. Annu. Rev. Public Health 2013, 34, 7–28. [Google Scholar] [CrossRef] [PubMed]
- Voltas, N.; Canals, J.; Hernandez-Martinez, C.; Serrat, N.; Basora, J.; Arija, V. Effect of Vitamin D Status during Pregnancy on Infant Neurodevelopment: The ECLIPSES Study. Nutrients 2020, 12, 3196. [Google Scholar] [CrossRef]
- Borge, T.C.; Aase, H.; Brantsaeter, A.L.; Biele, G. The importance of maternal diet quality during pregnancy on cognitive and behavioural outcomes in children: A systematic review and meta-analysis. BMJ Open 2017, 7, e016777. [Google Scholar] [CrossRef]
- Tan, M.; Yang, T.; Zhu, J.; Li, Q.; Lai, X.; Li, Y.; Tang, T.; Chen, J.; Li, T. Maternal folic acid and micronutrient supplementation is associated with vitamin levels and symptoms in children with autism spectrum disorders. Reprod. Toxicol. 2020, 91, 109–115. [Google Scholar] [CrossRef]
- Galera, C.; Heude, B.; Forhan, A.; Bernard, J.Y.; Peyre, H.; Van der Waerden, J.; Pryor, L.; Bouvard, M.-P.; Melchior, M.; Lioret, S.; et al. Prenatal diet and children’s trajectories of hyperactivity-inattention and conduct problems from 3 to 8 years: The EDEN mother-child cohort. J. Child Psychol. Psychiatry 2018, 59, 1003–1011. [Google Scholar] [CrossRef]
- Jacka, F.N.; Ystrom, E.; Brantsaeter, A.L.; Karevold, E.; Roth, C.; Haugen, M.; Meltzer, H.M.; Schjolberg, S.; Berk, M. Maternal and early postnatal nutrition and mental health of offspring by age 5 years: A prospective cohort study. J. Am. Acad. Child Adolesc. Psychiatry 2013, 52, 1038–1047. [Google Scholar] [CrossRef]
- Lv, S.; Qin, R.; Jiang, Y.; Lv, H.; Lu, Q.; Tao, S.; Huang, L.; Liu, C.; Xu, X.; Wang, Q.; et al. Association of Maternal Dietary Patterns during Gestation and Offspring Neurodevelopment. Nutrients 2022, 14, 730. [Google Scholar] [CrossRef]
- Mahmassani, H.A.; Switkowski, K.M.; Scott, T.M.; Johnson, E.J.; Rifas-Shiman, S.L.; Oken, E.; Jacques, P.F. Maternal diet quality during pregnancy and child cognition and behavior in a US cohort. Am. J. Clin. Nutr. 2022, 115, 128–141. [Google Scholar] [CrossRef]
- Steenweg-de Graaff, J.; Tiemeier, H.; Steegers-Theunissen, R.P.; Hofman, A.; Jaddoe, V.W.; Verhulst, F.C.; Roza, S.J. Maternal dietary patterns during pregnancy and child internalising and externalising problems. The Generation R Study. Clin. Nutr. 2014, 33, 115–121. [Google Scholar] [CrossRef] [PubMed]
- Parisi, F.; Rousian, M.; Huijgen, N.A.; Koning, A.H.J.; Willemsen, S.P.; de Vries, J.H.M.; Cetin, I.; Steegers, E.A.P.; Steegers-Theunissen, R.P.M. Periconceptional maternal ’high fish and olive oil, low meat’ dietary pattern is associated with increased embryonic growth: The Rotterdam Periconceptional Cohort (Predict) Study. Ultrasound Obstet. Gynecol. 2017, 50, 709–716. [Google Scholar] [CrossRef] [PubMed]
- Zamora, A.N.; Peterson, K.E.; Téllez-Rojo, M.M.; Cantoral, A.; Song, P.X.K.; Mercado-García, A.; Solano-González, M.; Fossee, E.; Jansen, E.C. Third trimester maternal dietary patterns are associated with sleep health among adolescent offspring in a Mexico City cohort. J. Nutr. 2022, 152, 1487–1495. [Google Scholar] [CrossRef] [PubMed]
- Emmett, P.M.; Jones, L.R.; Northstone, K. Dietary patterns in the Avon Longitudinal Study of Parents and Children. Nutr. Rev. 2015, 73 (Suppl. 3), 207–230. [Google Scholar] [CrossRef] [PubMed]
- Huang, P.; Wei, D.; Xiao, W.; Yuan, M.; Chen, N.; Wei, X.; Xie, J.; Lu, J.; Xia, X.; Lu, M.; et al. Maternal dietary patterns and depressive symptoms during pregnancy: The Born in Guangzhou Cohort Study. Clin. Nutr. 2021, 40, 3485–3494. [Google Scholar] [CrossRef]
- Dalmartello, M.; Decarli, A.; Ferraroni, M.; Bravi, F.; Serraino, D.; Garavello, W.; Negri, E.; Vermunt, J.; La Vecchia, C. Dietary patterns and oral and pharyngeal cancer using latent class analysis. Int. J. Cancer 2020, 147, 719–727. [Google Scholar] [CrossRef]
- Sotres-Alvarez, D.; Herring, A.H.; Siega-Riz, A.M. Latent class analysis is useful to classify pregnant women into dietary patterns. J. Nutr. 2010, 140, 2253–2259. [Google Scholar] [CrossRef]
- Tao, F.B.; Hao, J.H.; Huang, K.; Su, P.Y.; Cheng, D.J.; Xing, X.Y.; Huang, Z.H.; Zhang, J.L.; Tong, S.L. Cohort Profile: The China-Anhui Birth Cohort Study. Int. J. Epidemiol. 2013, 42, 709–721. [Google Scholar] [CrossRef]
- Belfer, M.L. Child and adolescent mental disorders: The magnitude of the problem across the globe. J. Child Psychol. Psychiatry 2008, 49, 226–236. [Google Scholar] [CrossRef]
- Bussing, R.; Schuhmann, E.; Belin, T.R.; Widawski, M.; Perwien, A.R. Diagnostic utility of two commonly used ADHD screening measures among special education students. J. Am. Acad. Child Adolesc. Psychiatry 1998, 37, 74–82. [Google Scholar] [CrossRef]
- Sun, X.; Allison, C.; Auyeung, B.; Matthews, F.E.; Zhang, Z.; Baron-Cohen, S.; Brayne, C. Comparison between a Mandarin Chinese version of the Childhood Autism Spectrum Test and the Clancy Autism Behaviour Scale in mainland China. Res. Dev. Disabil. 2014, 35, 1599–1608. [Google Scholar] [CrossRef] [PubMed]
- Gui, Y.; Deng, Y.; Sun, X.; Li, W.; Rong, T.; Wang, X.; Jiang, Y.; Zhu, Q.; Liu, J.; Wang, G.; et al. Early childhood sleep trajectories and association with maternal depression: A prospective cohort study. Sleep 2022, 45, zsac037. [Google Scholar] [CrossRef] [PubMed]
- Freitas-Vilela, A.A.; Pearson, R.M.; Emmett, P.; Heron, J.; Smith, A.D.A.C.; Emond, A.; Hibbeln, J.R.; Castro, M.B.T.; Kac, G. Maternal dietary patterns during pregnancy and intelligence quotients in the offspring at 8 years of age: Findings from the ALSPAC cohort. Matern. Child Nutr. 2018, 14, e12431. [Google Scholar] [CrossRef] [PubMed]
- Crozier, S.R.; Godfrey, K.M.; Calder, P.C.; Robinson, S.M.; Inskip, H.M.; Baird, J.; Gale, C.R.; Cooper, C.; Sibbons, C.M.; Fisk, H.L.; et al. Vegetarian Diet during Pregnancy Is Not Associated with Poorer Cognitive Performance in Children at Age 6–7 Years. Nutrients 2019, 11, 3029. [Google Scholar] [CrossRef] [PubMed]
- Polanska, K.; Kaluzny, P.; Aubert, A.M.; Bernard, J.Y.; Duijts, L.; El Marroun, H.; Hanke, W.; Hébert, J.R.; Heude, B.; Jankowska, A.; et al. Dietary Quality and Dietary Inflammatory Potential During Pregnancy and Offspring Emotional and Behavioral Symptoms in Childhood: An Individual Participant Data Meta-analysis of Four European Cohorts. Biol. Psychiatry 2021, 89, 550–559. [Google Scholar] [CrossRef] [PubMed]
- Anjos, T.; Altmäe, S.; Emmett, P.; Tiemeier, H.; Closa-Monasterolo, R.; Luque, V.; Wiseman, S.; Pérez-García, M.; Lattka, E.; Demmelmair, H.; et al. Nutrition and neurodevelopment in children: Focus on NUTRIMENTHE project. Eur. J. Nutr. 2013, 52, 1825–1842. [Google Scholar] [CrossRef]
- Chong, M.F.; Godfrey, K.M.; Gluckman, P.; Tan, K.H.; Shek, L.P.; Meaney, M.; Chan, J.K.Y.; Yap, F.; Lee, Y.S.; Chong, Y.S. Influences of the perinatal diet on maternal and child health: Insights from the GUSTO study. Proc. Nutr. Soc. 2020, 79, 253–258. [Google Scholar] [CrossRef]
- Kent, P.; Jensen, R.K.; Kongsted, A. A comparison of three clustering methods for finding subgroups in MRI, SMS or clinical data: SPSS TwoStep Cluster analysis, Latent Gold and SNOB. BMC Med. Res. Methodol. 2014, 14, 113. [Google Scholar] [CrossRef]
- Leech, R.M.; Boushey, C.J.; McNaughton, S.A. What do Australian adults eat for breakfast? A latent variable mixture modelling approach for understanding combinations of foods at eating occasions. Int. J. Behav. Nutr. Phys. Act 2021, 18, 46. [Google Scholar] [CrossRef]

Disclaimer/Publisher’s Note: The statements, opinions and data contained in all publications are solely those of the individual author(s) and contributor(s) and not of MDPI and/or the editor(s). MDPI and/or the editor(s) disclaim responsibility for any injury to people or property resulting from any ideas, methods, instructions or products referred to in the content. |
© 2023 by the authors. Licensee MDPI, Basel, Switzerland. This article is an open access article distributed under the terms and conditions of the Creative Commons Attribution (CC BY) license (https://creativecommons.org/licenses/by/4.0/).