
Alterations in Serum Concentration of Soluble CD163 within Five Study Days from ICU Admission Are Associated with In-Hospital Mortality of Septic Patients—A Preliminary Study
 , and
, and
Abstract
:1. Introduction
2. Materials and Methods
2.1. Study Population
2.2. Ethical Considerations
2.3. Laboratory Analysis
2.4. Statistical Analysis
3. Results
3.1. Characteristics of the Studied Population
3.2. The Values of sCD163 and IL-18 in the Control Group and Septic Patients on the 1st Study Day
3.3. Values of SOFA, Creatinine, WBC, PCT, CRP, IL-18 and sCD163 in Sepsis during the Five-Day Follow-Up
3.4. Values of SOFA, Creatinine, WBC, PCT, CRP, IL-18 and sCD163 in Septic Shock during the Five-Day Follow-Up
3.5. Logistic Regression Analysis
3.6. Cox Proportional Hazards Regression Models
4. Discussion
5. Conclusions
Author Contributions
Funding
Institutional Review Board Statement
Informed Consent Statement
Data Availability Statement
Conflicts of Interest
Appendix A

| Variable (Effect) | p (LR Test) |
|---|---|
| sCD163 (1st day) | 0.0687 |
| sqrt[(sCD163 (1st day)] | 0.0319 |
| log1.1[sCD163 (1st day)] | 0.0155 |
| SOFA (1st day) | 0.1069 |
| APACHE II (1st day) | 0.1121 |
| Age | 0.1856 |
| PCT (1st day) | 0.2265 |
| Sex | 0.3036 |
| IL-18 (1st day) | 0.4530 |
| Variable (Effect) | p (Box-Tidwell LR Test) |
|---|---|
| sCD163 (1st day) | 0.022 |
| sqrt[(sCD163 (1st day)] | 0.037 |
| log1.1[sCD163 (1st day)] | 0.069 |
| SOFA (1st day) | 0.273 |
| APACHE II (1st day) | 0.528 |
| Age | 0.224 |
| PCT (1st day) | 0.060 |
| Sex | - |
| IL-18 (1st day) | 0.692 |
| DERIVATION OF MODEL 1 (Table 4: MODEL 1) | |||||||
|---|---|---|---|---|---|---|---|
| Step | Variable | Df | Wald Statistic | Wald p | Score Statistic | Score p | Variable Status |
| Step 1 | Sex | 1 | 0.0600 | 0.8065 | Excluded in this step | ||
| Age [years] | 1 | 1.6501 | 0.1989 | Included | |||
| APACHE II | 1 | 3.5446 | 0.0597 | Included | |||
| SOFA | 1 | 0.2545 | 0.6139 | Included | |||
| PCT | 1 | 1.2519 | 0.2632 | Included | |||
| CRP | 1 | 2.3330 | 0.1267 | Included | |||
| IL-18 | 1 | 0.6098 | 0.4349 | Included | |||
| log1.1(sCD163) | 1 | 4.5740 | 0.0325 | Included | |||
| Step 2 | log1.1(sCD163) | 1 | 5.0940 | 0.0240 | Included | ||
| Age [years] | 1 | 1.7706 | 0.1833 | Included | |||
| APACHE II | 1 | 3.5580 | 0.0593 | Included | |||
| SOFA | 1 | 0.1985 | 0.6560 | Excluded in this step | |||
| PCT | 1 | 1.2639 | 0.2609 | Included | |||
| CRP | 1 | 2.4544 | 0.1172 | Included | |||
| IL-18 | 1 | 0.6129 | 0.4337 | Included | |||
| Sex | 1 | 0.0602 | 0.8062 | Excluded in previous step(s) | |||
| Step 3 | log1.1(sCD163) | 1 | 4.7327 | 0.0296 | Included | ||
| Age [years] | 1 | 2.1135 | 0.1460 | Included | |||
| APACHE II | 1 | 3.6993 | 0.0544 | Included | |||
| IL-18 | 1 | 0.7151 | 0.3978 | Excluded in this step | |||
| PCT | 1 | 1.3753 | 0.2409 | Included | |||
| CRP | 1 | 2.6729 | 0.1021 | Included | |||
| SOFA | 1 | 0.2006 | 0.6542 | Excluded in previous step(s) | |||
| Sex | 1 | 0.0044 | 0.9469 | Excluded in previous step(s) | |||
| Step 4 | log1.1(sCD163) | 1 | 4.6420 | 0.0312 | Included | ||
| Age [years] | 1 | 2.2676 | 0.1321 | Included | |||
| APACHE II | 1 | 3.2961 | 0.0694 | Included | |||
| CRP | 1 | 2.7062 | 0.1000 | Included | |||
| PCT | 1 | 1.4510 | 0.2284 | Excluded in this step | |||
| IL-18 | 1 | 0.7334 | 0.3918 | Excluded in previous step(s) | |||
| SOFA | 1 | 0.3195 | 0.5719 | Excluded in previous step(s) | |||
| Sex | 1 | 0.0005 | 0.9820 | Excluded in previous step(s) | |||
| Step 5 | log1.1(sCD163) | 1 | 5.4258 | 0.0198 | Included | ||
| Age [years] | 1 | 3.1289 | 0.0769 | Included | |||
| APACHE II | 1 | 2.4603 | 0.1168 | Excluded in this step | |||
| CRP | 1 | 3.2470 | 0.0716 | Included | |||
| PCT | 1 | 1.5585 | 0.2119 | Excluded in previous step(s) | |||
| IL-18 | 1 | 0.8276 | 0.3630 | Excluded in previous step(s) | |||
| SOFA | 1 | 0.4829 | 0.4871 | Excluded in previous step(s) | |||
| Sex | 1 | 0.0028 | 0.9578 | Excluded in previous step(s) | |||
| Step 6 | log1.1(sCD163) | 1 | 6.0906 | 0.0136 | Included | ||
| Age [years] | 1 | 4.3653 | 0.0367 | Included | |||
| CRP | 1 | 2.1866 | 0.1392 | Excluded in this step | |||
| APACHE II | 1 | 2.7142 | 0.0995 | Excluded in previous step(s) | |||
| PCT | 1 | 0.3377 | 0.5612 | Excluded in previous step(s) | |||
| IL-18 | 1 | 0.0866 | 0.7685 | Excluded in previous step(s) | |||
| SOFA | 1 | 0.1842 | 0.6678 | Excluded in previous step(s) | |||
| Sex | 1 | 0.1092 | 0.7411 | Excluded in previous step(s) | |||
| Step 7 | log1.1(sCD163) | 1 | 7.0492 | 0.0079 | Included | ||
| Age [years] | 1 | 4.7444 | 0.0294 | Included | |||
| CRP | 1 | 2.4553 | 0.1171 | Excluded in previous step(s) | |||
| APACHE II | 1 | 1.4682 | 0.2256 | Excluded in previous step(s) | |||
| PCT | 1 | 0.7156 | 0.3976 | Excluded in previous step(s) | |||
| IL-18 | 1 | 0.2549 | 0.6136 | Excluded in previous step(s) | |||
| SOFA | 1 | 0.6647 | 0.4149 | Excluded in previous step(s) | |||
| Sex | 1 | 0.4795 | 0.4886 | Excluded in previous step(s) | |||
| DERIVATION OF MODEL 2 (Table 4: MODEL 2) | |||||||
| Step | Variable | Df | Wald Statistic | Wald p | Score Statistic | Score p | Variable Status |
| Step 1 | Sex | 1 | 0.3606 | 0.5482 | Excluded in this step | ||
| Age [years] | 1 | 0.8126 | 0.3673 | Included | |||
| APACHE II | 1 | 2.8470 | 0.0915 | Included | |||
| SOFA | 1 | 0.5340 | 0.4649 | Included | |||
| PCT | 1 | 1.5332 | 0.2156 | Included | |||
| CRP | 1 | 3.7175 | 0.0538 | Included | |||
| CD163/IL18 | 1 | 1.9653 | 0.1609 | Included | |||
| Step 2 | CD163/IL18 | 1 | 2.4879 | 0.1147 | Included | ||
| Age [years] | 1 | 1.4536 | 0.2280 | Included | |||
| APACHE II | 1 | 2.9883 | 0.0839 | Included | |||
| SOFA | 1 | 0.3895 | 0.5326 | Excluded in this step | |||
| PCT | 1 | 1.7419 | 0.1869 | Included | |||
| CRP | 1 | 3.7658 | 0.0523 | Included | |||
| Sex | 1 | 0.3651 | 0.5457 | Excluded in previous step(s) | |||
| Step 3 | CD163/IL18 | 1 | 2.8612 | 0.0907 | W modelu | ||
| Age [years] | 1 | 1.2449 | 0.2645 | Excluded in this step | |||
| APACHE II (1) | 1 | 4.9921 | 0.0255 | Included | |||
| CRP | 1 | 4.8904 | 0.0270 | Included | |||
| PCT | 1 | 1.8200 | 0.1773 | Included | |||
| SOFA | 1 | 0.3967 | 0.5288 | Excluded in previous step(s) | |||
| Sex | 1 | 0.2164 | 0.6418 | Excluded in previous step(s) | |||
| Step 4 | CD163/IL18 | 1 | 2.9564 | 0.0855 | Included | ||
| PCT | 1 | 1.9032 | 0.1677 | Excluded in this step | |||
| APACHE II | 1 | 5.5489 | 0.0185 | Included | |||
| CRP | 1 | 4.9039 | 0.0268 | Included | |||
| Age [years] | 1 | 1.3066 | 0.2530 | Excluded in previous step(s) | |||
| SOFA | 1 | 0.1433 | 0.7050 | Excluded in previous step(s) | |||
| Sex | 1 | 0.8073 | 0.3689 | Excluded in previous step(s) | |||
| Step 5 | CD163/IL18 | 1 | 3.9246 | 0.0476 | Included | ||
| CRP | 1 | 4.9330 | 0.0263 | Included | |||
| APACHE II | 1 | 5.0929 | 0.0240 | Included | |||
| PCT | 1 | 2.1109 | 0.1463 | Excluded in previous step(s) | |||
| Age [years] | 1 | 1.3539 | 0.2446 | Excluded in previous step(s) | |||
| SOFA | 1 | 0.2179 | 0.6406 | Excluded in previous step(s) | |||
| Sex | 1 | 1.1732 | 0.2787 | Excluded in previous step(s) | |||
| Metrics Regarding Logistic Logistic Regression Model 1 (Table 4: Model 1) | |||||||
|---|---|---|---|---|---|---|---|
| P(Y) | Sensitivity | Specificity | 1-Specificity | Youden’s J Statistic | Accuracy | PPV | NPV |
| 0.925 | 0.091 | 1.000 | 0.000 | 0.091 | 0.750 | 1.000 | 0.744 |
| 0.854 | 0.182 | 1.000 | 0.000 | 0.182 | 0.775 | 1.000 | 0.763 |
| 0.845 | 0.273 | 1.000 | 0.000 | 0.273 | 0.800 | 1.000 | 0.784 |
| 0.784 | 0.273 | 0.966 | 0.034 | 0.238 | 0.775 | 0.750 | 0.778 |
| 0.693 | 0.273 | 0.931 | 0.069 | 0.204 | 0.750 | 0.600 | 0.771 |
| 0.605 | 0.273 | 0.897 | 0.103 | 0.169 | 0.725 | 0.500 | 0.765 |
| 0.56 | 0.273 | 0.862 | 0.138 | 0.135 | 0.700 | 0.429 | 0.758 |
| 0.553 | 0.273 | 0.828 | 0.172 | 0.100 | 0.675 | 0.375 | 0.750 |
| 0.542 | 0.364 | 0.828 | 0.172 | 0.191 | 0.700 | 0.444 | 0.774 |
| 0.499 | 0.455 | 0.828 | 0.172 | 0.282 | 0.725 | 0.500 | 0.800 |
| 0.482 | 0.455 | 0.793 | 0.207 | 0.248 | 0.700 | 0.455 | 0.793 |
| 0.435 | 0.545 | 0.793 | 0.207 | 0.339 | 0.725 | 0.500 | 0.821 |
| 0.41 | 0.545 | 0.759 | 0.241 | 0.304 | 0.700 | 0.462 | 0.815 |
| 0.294 | 0.636 | 0.759 | 0.241 | 0.395 | 0.725 | 0.500 | 0.846 |
| 0.288 | 0.636 | 0.724 | 0.276 | 0.361 | 0.700 | 0.467 | 0.840 |
| 0.256 | 0.636 | 0.690 | 0.310 | 0.326 | 0.675 | 0.438 | 0.833 |
| 0.249 | 0.636 | 0.655 | 0.345 | 0.292 | 0.650 | 0.412 | 0.826 |
| 0.232 | 0.727 | 0.655 | 0.345 | 0.382 | 0.675 | 0.444 | 0.864 |
| 0.202 | 0.818 | 0.655 | 0.345 | 0.473 | 0.700 | 0.474 | 0.905 |
| 0.176 | 0.818 | 0.621 | 0.379 | 0.439 | 0.675 | 0.450 | 0.900 |
| 0.172 | 0.909 | 0.621 | 0.379 | 0.530 | 0.700 | 0.476 | 0.947 |
| 0.128 | 0.909 | 0.586 | 0.414 | 0.495 | 0.675 | 0.455 | 0.944 |
| 0.124 | 1.000 | 0.552 | 0.448 | 0.552 | 0.675 | 0.458 | 1.000 |
| 0.123 | 1.000 | 0.517 | 0.483 | 0.517 | 0.650 | 0.440 | 1.000 |
| 0.122 | 1.000 | 0.483 | 0.517 | 0.483 | 0.625 | 0.423 | 1.000 |
| 0.116 | 1.000 | 0.448 | 0.552 | 0.448 | 0.600 | 0.407 | 1.000 |
| 0.112 | 1.000 | 0.414 | 0.586 | 0.414 | 0.575 | 0.393 | 1.000 |
| 0.103 | 1.000 | 0.379 | 0.621 | 0.379 | 0.550 | 0.379 | 1.000 |
| 0.096 | 1.000 | 0.345 | 0.655 | 0.345 | 0.525 | 0.367 | 1.000 |
| 0.088 | 1.000 | 0.310 | 0.690 | 0.310 | 0.500 | 0.355 | 1.000 |
| 0.06 | 1.000 | 0.276 | 0.724 | 0.276 | 0.475 | 0.344 | 1.000 |
| 0.058 | 1.000 | 0.241 | 0.759 | 0.241 | 0.450 | 0.333 | 1.000 |
| 0.044 | 1.000 | 0.207 | 0.793 | 0.207 | 0.425 | 0.324 | 1.000 |
| 0.039 | 1.000 | 0.172 | 0.828 | 0.172 | 0.400 | 0.314 | 1.000 |
| 0.019 | 1.000 | 0.138 | 0.862 | 0.138 | 0.375 | 0.306 | 1.000 |
| 0.014 | 1.000 | 0.103 | 0.897 | 0.103 | 0.350 | 0.297 | 1.000 |
| 0.012 | 1.000 | 0.069 | 0.931 | 0.069 | 0.325 | 0.289 | 1.000 |
| 0.003 | 1.000 | 0.000 | 1.000 | 0.000 | 0.275 | 0.275 | |
| Metrics Regarding Logistic Logistic Regression Model 1 (Table 4: model 2) | |||||||
| P(Y) | Sensitivity | Specificity | 1-Specificity | Youden’s J Statistic | Accuracy | Ppv | Npv |
| 0.818 | 0.091 | 1.000 | 0.000 | 0.091 | 0.750 | 1.000 | 0.744 |
| 0.709 | 0.091 | 0.966 | 0.034 | 0.056 | 0.725 | 0.500 | 0.737 |
| 0.676 | 0.182 | 0.966 | 0.034 | 0.147 | 0.750 | 0.667 | 0.757 |
| 0.659 | 0.182 | 0.931 | 0.069 | 0.113 | 0.725 | 0.500 | 0.750 |
| 0.642 | 0.273 | 0.931 | 0.069 | 0.204 | 0.750 | 0.600 | 0.771 |
| 0.596 | 0.364 | 0.931 | 0.069 | 0.295 | 0.775 | 0.667 | 0.794 |
| 0.59 | 0.455 | 0.931 | 0.069 | 0.386 | 0.800 | 0.714 | 0.818 |
| 0.588 | 0.545 | 0.931 | 0.069 | 0.476 | 0.825 | 0.750 | 0.844 |
| 0.52 | 0.545 | 0.897 | 0.103 | 0.442 | 0.800 | 0.667 | 0.839 |
| 0.427 | 0.545 | 0.862 | 0.138 | 0.408 | 0.775 | 0.600 | 0.833 |
| 0.404 | 0.636 | 0.862 | 0.138 | 0.498 | 0.800 | 0.636 | 0.862 |
| 0.387 | 0.636 | 0.828 | 0.172 | 0.464 | 0.775 | 0.583 | 0.857 |
| 0.337 | 0.727 | 0.828 | 0.172 | 0.555 | 0.800 | 0.615 | 0.889 |
| 0.335 | 0.727 | 0.793 | 0.207 | 0.520 | 0.775 | 0.571 | 0.885 |
| 0.333 | 0.727 | 0.759 | 0.241 | 0.486 | 0.750 | 0.533 | 0.880 |
| 0.29 | 0.727 | 0.724 | 0.276 | 0.451 | 0.725 | 0.500 | 0.875 |
| 0.28 | 0.727 | 0.690 | 0.310 | 0.417 | 0.700 | 0.471 | 0.870 |
| 0.256 | 0.818 | 0.690 | 0.310 | 0.508 | 0.725 | 0.500 | 0.909 |
| 0.236 | 0.818 | 0.655 | 0.345 | 0.473 | 0.700 | 0.474 | 0.905 |
| 0.217 | 0.909 | 0.655 | 0.345 | 0.564 | 0.725 | 0.500 | 0.950 |
| 0.213 | 0.909 | 0.621 | 0.379 | 0.530 | 0.700 | 0.476 | 0.947 |
| 0.204 | 0.909 | 0.586 | 0.414 | 0.495 | 0.675 | 0.455 | 0.944 |
| 0.188 | 0.909 | 0.552 | 0.448 | 0.461 | 0.650 | 0.435 | 0.941 |
| 0.16 | 0.909 | 0.517 | 0.483 | 0.426 | 0.625 | 0.417 | 0.938 |
| 0.159 | 0.909 | 0.483 | 0.517 | 0.392 | 0.600 | 0.400 | 0.933 |
| 0.107 | 0.909 | 0.448 | 0.552 | 0.357 | 0.575 | 0.385 | 0.929 |
| 0.103 | 0.909 | 0.414 | 0.586 | 0.323 | 0.550 | 0.370 | 0.923 |
| 0.08 | 0.909 | 0.345 | 0.655 | 0.254 | 0.500 | 0.345 | 0.909 |
| 0.07 | 0.909 | 0.310 | 0.690 | 0.219 | 0.475 | 0.333 | 0.900 |
| 0.069 | 1.000 | 0.310 | 0.690 | 0.310 | 0.500 | 0.355 | 1.000 |
| 0.059 | 1.000 | 0.276 | 0.724 | 0.276 | 0.475 | 0.344 | 1.000 |
| 0.048 | 1.000 | 0.241 | 0.759 | 0.241 | 0.450 | 0.333 | 1.000 |
| 0.045 | 1.000 | 0.207 | 0.793 | 0.207 | 0.425 | 0.324 | 1.000 |
| 0.039 | 1.000 | 0.172 | 0.828 | 0.172 | 0.400 | 0.314 | 1.000 |
| 0.018 | 1.000 | 0.138 | 0.862 | 0.138 | 0.375 | 0.306 | 1.000 |
| 0.016 | 1.000 | 0.103 | 0.897 | 0.103 | 0.350 | 0.297 | 1.000 |
| 0.015 | 1.000 | 0.034 | 0.966 | 0.034 | 0.300 | 0.282 | 1.000 |
| 0.012 | 1.000 | 0.000 | 1.000 | 0.000 | 0.275 | 0.275 | |
| Variable | Chi-Square | p-Value | −95% CI (p-Value) | 95% CI (p-Value) | Hazard Ratio (HR) | −95% CI (HR) | 95% CI (HR) |
|---|---|---|---|---|---|---|---|
| Age | 0.0942 | 0.7589 | −0.0726 | 0.0995 | 1.0136 | 0.9300 | 1.1046 |
| APACHE II | 2.4644 | 0.1165 | −0.0716 | 0.6477 | 1.3338 | 0.9309 | 1.9110 |
| SOFA | 0.7327 | 0.3920 | −0.8067 | 0.3163 | 0.7825 | 0.4463 | 1.3720 |
| WBC | 1.7380 | 0.1874 | −0.0316 | 0.1617 | 1.0672 | 0.9689 | 1.1755 |
| RBC | 0.2594 | 0.6105 | −1.3919 | 2.3694 | 1.6303 | 0.2486 | 10.6910 |
| PLT | 1.7779 | 0.1824 | −0.0040 | 0.0210 | 1.0085 | 0.9960 | 1.0212 |
| PCT | 1.1487 | 0.2838 | −0.0159 | 0.0542 | 1.0194 | 0.9842 | 1.0557 |
| CRP | 3.4353 | 0.0638 | −0.0006 | 0.0231 | 1.0113 | 0.9994 | 1.0234 |
| IL-18 | 3.9913 | 0.0457 | −0.0022 | 0.0000 | 0.9989 | 0.9978 | 1.0000 |
| CD163 | 3.5551 | 0.0594 | −0.0001 | 0.0051 | 1.0025 | 0.9999 | 1.0051 |
| Sex (male) | 0.1932 | 0.6603 | −1.2481 | 0.7909 | 0.6330 | 0.0824 | 4.8636 |
| Variable | Wald Statistic | p-Value |
|---|---|---|
| Age | 0.0942 | 0.7589 |
| APACHE II | 2.4644 | 0.1165 |
| SOFA | 0.7327 | 0.3920 |
| WBC | 1.7380 | 0.1874 |
| RBC | 0.2594 | 0.6105 |
| PLT | 1.7779 | 0.1824 |
| PCT | 1.1487 | 0.2838 |
| CRP | 3.4353 | 0.0638 |
| IL-18 | 3.9913 | 0.0457 |
| CD163 | 3.5551 | 0.0594 |
| Sex | 0.1932 | 0.6603 |
| MODEL 1 (Table 6: Model 1) | ||
|---|---|---|
| Variable | Chi-Square | p-Value |
| APACHE II | 0.2346 | 0.6281 |
| WBC | 0.0043 | 0.9480 |
| PLT | 0.7417 | 0.3891 |
| PCT | 0.0616 | 0.8040 |
| CRP | 0.1118 | 0.7381 |
| IL-18 | 3.7134 | 0.0540 |
| CD163 | 0.2356 | 0.6274 |
| (Overall) | 6.6675 | 0.4643 |
| MODEL 2 (Table 6: Model 2) | ||
| Variable | Chi-Square | p-Value |
| APACHE II | 0.3725 | 0.5417 |
| PLT | 0.3709 | 0.5425 |
| CRP | 1.1381 | 0.2861 |
| IL-18 | 3.0759 | 0.0795 |
| CD163 | 0.4640 | 0.4958 |
| Sex (male) | 1.9566 | 0.1619 |
| (Overall) | 7.4978 | 0.2773 |
References
- Singer, M.; Deutschman, C.S.; Seymour, C.; Shankar-Hari, M.; Annane, D.; Bauer, M.; Bellomo, R.; Bernard, G.R.; Chiche, J.D.; Coopersmith, C.M.; et al. The third international consensus definitions for sepsis and septic shock (sepsis-3). JAMA 2016, 315, 801–810. [Google Scholar] [CrossRef] [PubMed]
- Fabriek, B.O.; Dijkstra, C.D.; van den Berg, T.K. The macrophage scavenger receptor CD163. Immunobiology 2005, 210, 153–160. [Google Scholar] [CrossRef] [PubMed]
- Thomsen, J.H.; Etzerodt, A.; Svendsen, P.; Moestrup, S.K. The haptoglobin-CD163-heme oxygenase-1 pathway for hemoglobin scavenging. Oxid. Med. Cell. Longev. 2013, 2013, 523652. [Google Scholar] [CrossRef] [Green Version]
- Sulahian, T.H.; Pioli, P.A.; Wardwell, K.; Guyre, P.M. Cross-linking of FcgammaR triggers shedding of the hemoglobin-haptoglobin scavenger receptor CD163. J. Leukoc. Biol. 2004, 76, 271–277. [Google Scholar] [CrossRef] [PubMed]
- Kristiansen, M.; Graversen, J.H.; Jacobsen, C.; Sonne, O.; Hoffman, H.J.; Law, S.K.A.; Moestrup, S.K. Identification of the haemoglobin scavenger receptor. Nature 2001, 409, 198–201. [Google Scholar] [CrossRef]
- Moeller, J.B.; Nielsen, M.J.; Reichhardt, M.P.; Schlosser, A.; Sorensen, G.L.; Nielsen, O.; Tornøe, I.; Grønlund, J.; Nielsen, M.E.; Jørgensen, J.S.; et al. CD163-L1 Is an Endocytic Macrophage Protein Strongly Regulated by Mediators in the Inflammatory Response. J. Immunol. 2012, 188, 2399–2409. [Google Scholar] [CrossRef] [Green Version]
- Sulahian, T.H.; Högger, P.; Wahner, A.E.; Wardwell, K.; Goulding, N.J.; Sorg, C.; Droste, A.; Stehling, M.; Wallace, P.K.; Morganelli, P.M.; et al. Human monocytes express CD163, which is upregulated by IL-10 and identical to p155. Cytokine 2000, 12, 1312–1321. [Google Scholar] [CrossRef]
- Weaver, L.K.; Hintz-Goldstein, K.A.; Pioli, P.A.; Wardwell, K.; Qureshi, N.; Vogel, S.N.; Guyre, P.M. Pivotal advance: Activation of cell surface Toll-like receptors causes shedding of the hemoglobin scavenger receptor CD163. J. Leukoc. Biol. 2006, 80, 26–35. [Google Scholar] [CrossRef]
- Reeder, B.J.; Wilson, M.T. Hemoglobin and myoglobin associated oxidative stress: From molecular mechanisms to disease states. Curr. Med. Chem. 2005, 12, 2741–2751. [Google Scholar] [CrossRef]
- Austermann, J.; Roth, J.; Barczyk-Kahlert, K. The Good and the Bad: Of treatment monocytes’ and macrophages’ diverse functions in inflammation. Cells 2022, 11, 1979. [Google Scholar] [CrossRef]
- Møller, H.J.; Peterslund, N.A.; Graversen, J.H.; Moestrup, S.K. Identification of the hemoglobin scavenger receptor/CD163 as a natural soluble protein in plasma. Blood 2002, 99, 378–380. [Google Scholar] [CrossRef]
- Schaer, D.J.; Schleiffenbaum, B.; Kurrer, M.; Imhof, A.; Bächli, E.; Fehr, J.; Moller, H.J.; Moestrup, S.K.; Schaffner, A. Soluble hemoglobin-haptoglobin scavenger receptor CD163 as a lineage-specific marker in the reactive hemophagocytic syndrome. Eur. J. Haematol. 2005, 74, 6–10. [Google Scholar] [CrossRef] [PubMed]
- Weaver, L.K.; Pioli, P.A.; Wardwell, K.; Vogel, S.N.; Guyre, P.M. Up-regulation of human monocyte CD163 upon activation of cell-surface Toll-like receptors. J. Leukoc. Biol. 2007, 81, 663–671. [Google Scholar] [CrossRef] [PubMed]
- Sims, J.E.; Smith, D.E. The IL-1 family: Regulators of immunity. Nat. Rev. Immunol. 2010, 10, 89–102. [Google Scholar] [CrossRef] [PubMed]
- Nicoletti, F.; Di Marco, R.; Mangano, K.; Patti, F.; Reggio, E.; Nicoletti, A.; Bendtzen, K.; Reggio, A. Increased serum levels of interleukin-18 in patients with multiple sclerosis. Neurology 2001, 57, 342–344. [Google Scholar] [CrossRef] [PubMed]
- Hoshino, T.; Kawase, Y.; Okamoto, M.; Yokota, K.; Yoshino, K.; Yamamura, K.; Miyazaki, J.; Young, H.A.; Oizumi, K. Cutting edge: IL-18-transgenic mice: In vivo evidence of a broad role for IL-18 in modulating immune function. J. Immunol. 2001, 166, 7014–7018. [Google Scholar] [CrossRef] [Green Version]
- Nakanishi, K.; Yoshimoto, T.; Tsutsui, H.; Okamura, H. Interleukin-18 regulates both Th1 and Th2 responses. Annu. Rev. Immunol. 2001, 19, 423–474. [Google Scholar] [CrossRef]
- Kim, Y.-M.; Im, J.Y.; Han, S.H.; Kang, H.S.; Choi, I. IFN-γ Up-Regulates IL-18 Gene Expression Via IFN Consensus Sequence-Binding Protein and Activator Protein-1 Elements in Macrophages. J. Immunol. 2000, 165, 3198–3205. [Google Scholar] [CrossRef] [Green Version]
- Kaplanski, G. Interleukin-18: Biological properties and role in disease pathogenesis. Immunol. Rev. 2018, 281, 138–153. [Google Scholar] [CrossRef] [Green Version]
- Oberholzer, A.; Steckholzer, U.; Kurimoto, M.; Trentz, O.; Ertel, W. Interleukin-18 plasma levels are increased in patients with sepsis compared to severely injured patients. Shock 2001, 16, 411–414. [Google Scholar] [CrossRef] [PubMed] [Green Version]
- Vincent, J.L.; Moreno, R.; Takala, J.; Willatts, S.; De Mendonça, A.; Bruining, H.; Reinhart, C.K.; Suter, P.M.; Thijs, L.G. The SOFA (Sepsis-related Organ Failure Assessment) score to describe organ dysfunction/failure. Intensive Care Med. 1996, 22, 707–710. [Google Scholar] [CrossRef] [PubMed]
- Knaus, W.A.; Draper, E.A.; Wagner, D.P.; Zimmerman, J.E. APACHE II: A severity of disease classification system. Crit. Care Med. 1985, 13, 818–829. [Google Scholar] [CrossRef] [PubMed]
- Siegel, S.; Castellan, N., Jr. Nonparametric Statistics for The Behavioral Sciences, 2nd ed.; McGraw-Hill: New York, NY, USA, 1988. [Google Scholar]
- Wong, T.-T. Performance evaluation of classification algorithms by k-fold and leave-one-out cross validation. Pattern Recognit. 2015, 48, 2839–2846. Available online: https://www.sciencedirect.com/science/article/pii/S0031320315000989 (accessed on 27 December 2022). [CrossRef]
- Stolk, R.F.; Van Der Poll, T.; Angus, D.C.; Van Der Hoeven, J.G.; Pickkers, P.; Kox, M. Potentially Inadvertent Immunomodulation: Norepinephrine Use in Sepsis. Am. J. Respir. Crit. Care Med. 2016, 194, 550–558. [Google Scholar] [CrossRef] [PubMed]
- Pène, F.; Pickkers, P.; Hotchkiss, R.S. Is this critically ill patient immunocompromised? Intensive Care Med. 2016, 42, 1051–1054. [Google Scholar] [CrossRef] [Green Version]
- Kjærgaard, A.G.; Rødgaard-Hansen, S.; Dige, A.; Krog, J.; Møller, H.J.; Tønnesen, E. Monocyte expression and soluble levels of the haemoglobin receptor (CD163/sCD163) and the mannose receptor (MR/sMR) in septic and critically ill non-septic ICU patients. PLoS ONE 2014, 9, e92331. [Google Scholar] [CrossRef]
- Weiss, E.S.; Girard-Guyonvarc’, C.; Holzinger, D.; De Jesus, A.A.; Tariq, Z.; Picarsic, J.; Schiffrin, E.J.; Foell, D.; Grom, A.A.; Ammann, S.; et al. Interleukin-18 diagnostically distinguishes and pathogenically promotes human and murine macrophage activation syndrome. Blood 2018, 131, 1442–1455. [Google Scholar] [CrossRef]
- Girard-Guyonvarc’, C.; Palomo, J.; Martin, P.; Rodriguez, E.; Troccaz, S.; Palmer, G.; Gabay, C. Unopposed IL-18 signaling leads to severe TLR9-induced macrophage activation syndrome in mice. Blood 2018, 131, 1430–1441. [Google Scholar] [CrossRef]
- Kyriazopoulou, E.; Leventogiannis, K.; Norrby-Teglund, A.; Dimopoulos, G.; Pantazi, A.; Orfanos, S.E.; Rovina, N.; Tsangaris, I.; Gkavogianni, T.; Botsa, E.; et al. Macrophage activation-like syndrome: An immunological entity associated with rapid progression to death in sepsis. BMC Med. 2017, 15, 172. [Google Scholar] [CrossRef] [Green Version]
- Dinarello, C.A.; Novick, D.; Soohyun Kim, S.; Kaplanski, G. Interleukin-18 and IL-18 binding protein. Front. Immunol. 2013, 11, 185. [Google Scholar] [CrossRef] [Green Version]
- Aristoteli, L.P.; Møller, H.J.; Bailey, B.; Moestrup, S.K.; Kritharides, L. The monocytic lineage specific soluble CD163 is a plasma marker of coronary atherosclerosis. Atherosclerosis 2006, 184, 342–347. [Google Scholar] [CrossRef] [PubMed]
- Axelsson, J.; Møller, H.J.; Witasp, A.; Qureshi, A.R.; Carrero, J.J.; Heimbürger, O.; Bárány, P.; Alvestrand, A.; Lindholm, B.; Moestrup, S.K.; et al. Changes in fat mass correlate with changes in soluble sCD163, a marker of mature macrophages, in patients with CKD. Am. J. Kidney Dis. 2006, 48, 916–925. [Google Scholar] [CrossRef] [PubMed]
- Knudsen, T.B.; Gustafson, P.; Kronborg, G.; Kristiansen, T.B.; Moestrup, S.K.; Nielsen, J.O.; Gomes, V.; Aaby, P.; Lisse, I.; Møller, H.J.; et al. Predictive value of soluble haemoglobin scavenger receptor CD163 serum levels for survival in verified tuberculosis patients. Clin. Microbiol. Infect. 2005, 11, 730–735. [Google Scholar] [CrossRef] [PubMed] [Green Version]
- Møller, H.J.; Moestrup, S.K.; Weis, N.; Wejse, C.; Nielsen, H.; Pedersen, S.S.; Attermann, J.; Nexø, E.; Kronborg, G. Macrophage serum markers in pneumococcal bacteremia: Prediction of survival by soluble CD163. Crit. Care Med. 2006, 34, 2561–2566. [Google Scholar] [CrossRef]
- Møller, H.J.; De Fost, M.; Aerts, H.; Hollak, C.; Moestrup, S.K. Plasma level of the macrophage-derived soluble CD163 is increased and positively correlates with severity in Gaucher’s disease. Eur. J. Haematol. 2004, 72, 135–139. [Google Scholar] [CrossRef]
- Ingels, C.; Møller, H.J.; Hansen, T.K.; Wouters, P.J.; Vanhorebeek, I.; Van den Berghe, G. Circulating levels of the shed scavenger receptor sCD163 and association with outcome of critically ill patients. J. Clin. Immunol. 2013, 33, 619–629. [Google Scholar] [CrossRef] [Green Version]
- Barba Alves-Januzzi, A.; Karina, M.; Brunialti, C.; Salomao, R. CD163 and CD206 Expression Does Not Correlate with Tolerance and Cytokine Production in LPS-Tolerant Human Monocytes. Cytom. B Clin. Cytom. 2017, 92, 192–199. [Google Scholar] [CrossRef] [Green Version]
- Mosser, D.M.; Edwards, J.P. Exploring the full spectrum of macrophage activation. Nat. Rev. Immunol. 2008, 8, 958. [Google Scholar] [CrossRef]
- Santos, S.S.; Carmo, A.M.; Brunialti, M.K.C.; Machado, F.R.; Azevedo, L.C.; Assunção, M.; Trevelin, S.C.; Cunha, F.Q.; Salomao, R. Modulation of monocytes in septic patients: Preserved phagocytic activity, increased ROS and NO generation, and decreased production of inflammatory cytokines. Intensive Care Med. Exp. 2011, 4, 5. [Google Scholar] [CrossRef] [Green Version]
- Salomão, R.; Ferreira, B.L.; Salomão, M.C.; Santos, S.S.; Azevedo, L.C.P.; Brunialti, M.K.C. Sepsis: Evolving concepts and challenges. Braz. J. Med. Biol. Res. 2019, 52, e8595. [Google Scholar] [CrossRef]
- Volfovitch, Y.; Tsur, A.M.; Gurevitch, M.; Novick, D.; Rabinowitz, R.; Mandel, M.; Achiron, A.; Rubinstein, M.; Shoenfeld, Y.; Amital, H. The intercorrelations between blood levels of ferritin, sCD163, and IL-18 in COVID 19 patients and their association to prognosis. Immunol. Res. 2022, 70, 817–828. [Google Scholar] [CrossRef] [PubMed]
- Feng, L.; Zhou, X.; Su, L.X.; Feng, D.; Jia, Y.H.; Xie, L.X. Clinical significance of soluble hemoglobin scavenger receptor CD163 (sCD163) in sepsis, a prospective study. PLoS ONE 2012, 7, e38400. [Google Scholar] [CrossRef] [PubMed]

| Variable | Controls | Septic Patients | ||
|---|---|---|---|---|
| Total Count (c) | 30 | 40 | ||
| Diagnosis (c) | (Non-Applicable) | Sepsis | Septic Shock | |
| 16 | 24 | |||
| Age [years] | (a) | 62.5 ± 8.57 {55; 61; 67} | 65.5 ± 15.84 {58; 63; 78} | 64.12 ± 13.13 {54.5; 65.5; 73} |
| (b) | ||||
| APACHE II (upon admission) | (a) | - | 20.75 ± 5.81 {16.5; 20.0; 26.0} | 21.17 ± 7.81 {13.5; 22.0; 26.5} |
| (b) | ||||
| SOFA (upon admission) | (a) | - | 8.12 ± 3.55 {6.0; 7.0; 9.5} | 9.46 ± 2.69 {7.5; 10.0; 11.0} |
| (b) | ||||
| Female (c) | 23 | 9 | 15 | |
| Male (c) | 7 | 7 | 9 | |
| Source of infection: abdomen (c) | (non-specified) | 8 | 22 | |
| Source of infection: lungs (c) | 8 | 2 | ||
| Survival status: survival (c) | 16 | 13 | ||
| Survival status: death (c) | 0 | 11 | ||
| Treatment: mechanical ventilation (c) | 12 | 22 | ||
| Treatment: catecholamines (c) | 11 | 23 | ||
| Organ failure: respiratory system (c) | 13 | 23 | ||
| Organ failure: cardiovascular system (c) | 11 | 22 | ||
| Organ failure: hematological system (c) | 5 | 9 | ||
| Organ failure: liver (c) | 4 | 6 | ||
| Organ failure: metabolic implications (c) | 6 | 18 | ||
| Organ failure: kidney(s) (c) | 7 | 10 | ||
| Organ failure: central nervous system (c) | 10 | 13 | ||
| Organ failure count: 2 (c) | 4 | 3 | ||
| Organ failure count: 3 (c) | 8 | 4 | ||
| Organ failure count: 4 (c) | 0 | 7 | ||
| Organ failure count: 5 (c) | 1 | 6 | ||
| Organ failure count: 6 (c) | 2 | 3 | ||
| Organ failure count: 7 (c) | 1 | 1 | ||
| Type of infection: bacterial Gram-negative (c) | 8 | 12 | ||
| Type of infection: bacterial, Gram-positive (c) | 5 | 13 | ||
| Type of infection: fungal (c) | 2 | 4 | ||
| Type of infection: unknown (c) | 5 | 4 | ||
| Mixed infection (2 or more pathogens) (c) | 4 | 9 | ||
| Parameters | Control Group (C) | Sepsis (A) | Septic Shock (B) | p (C vs. A) | p (C vs. B) | p (A vs. B) | Global p (Ranked ANOVA) |
|---|---|---|---|---|---|---|---|
| IL-18 [pg/mL] | {126.24; 182.54; 263.70} | {598.00; 735.50; 877.00} | {849.50; 1243.00; 1703.50} | <0.0001 | <0.0001 | 0.3340 | <0.0001 |
| sCD163 [ng/mL] | {504.50; 661.90; 777.10} | {509.95; 895.55; 1230.85} | {945.20; 1240.15; 1852.60} | 0.2522 | <0.0001 | 0.0486 | <0.0001 |
| sCD163/IL-18 ratio [ng/pg] | {2.67; 3.61; 5.63} | {0.65; 0.99; 1.64} | {0.55; 1.20; 1.98} | <0.0001 | <0.000001 | 1.000 | <0.0001 |
| A: SEPSIS | ||||||||
|---|---|---|---|---|---|---|---|---|
| Parameters | 1st Day (1) | 3rd Day (3) | 5th Day (5) | p (1 vs. 3) | p (1 vs. 5) | p (3 vs 5) | Global p | Sphericity p |
| SOFA [values] | 8.13 ± 3.56 | 7.44 ± 3.97 | 6.63 ± 3.58 | 0.1494 | 0.0007 | 0.0752 | 0.0010 | 0.3107 |
| Creatinine [mg/dL] | 1.85 ± 0.96 | 1.69 ± 0.82 | 1.53 ± 0.67 | 0.3360 | 0.0237 | 0.3746 | 0.0310 | 0.4544 |
| WBC [×103/mm3] | 13.27 ± 7.05 | 13.12 ± 5.26 | 13.24 ± 4.92 | - | - | - | 0.9464 | 0.0005 |
| PCT [µg/L] | {2.27; 5.00; 16.01} | {1.57; 3.51; 11.30} | {0.95; 2.23; 6.84} | 0.3400 | 0.1000 | <0.010 | 0.0010 | - |
| CRP [mg/L] | 170.08 ± 100.93 | 157.20 ± 88.34 | 114.92 ± 56.96 | 0.6429 | 0.0024 | 0.0186 | 0.0334 | 0.0290 |
| IL-18 [pg/mL] | {598.00; 735.50; 877.00} | {448.00; 600.00; 944.50} | {444.00; 554.00; 1191.50} | - | - | - | 0.0874 | - |
| sCD163 [ng/mL] | 915.91 ± 429.14 | 937.51 ± 457.22 | 965.19 ± 491.24 | - | - | - | 0.8591 | 0.9793 |
| sCD163/IL-18 ratio [ng/pg] | 1.24 ± 0.80 | 1.66 ± 1.45 | 1.60 ± 1.41 | - | - | - | 0.2321 | 0.0117 |
| B: SEPTIC SHOCK | ||||||||
| Parameters | 1st Day (1) | 3rd Day (3) | 5th Day (5) | p (1 vs. 3) | p (1 vs. 5) | p (3 vs 5) | Global p | Sphericity p |
| SOFA [values] | {7.50; 10.00; 11.00} | {7.50; 9.50; 12.00} | {7.00; 10.00; 12.00} | - | - | - | 0.8698 | - |
| Creatinine [mg/dL] | {0.98; 1.28; 1.65} | {0.78; 1.12; 1.46} | {0.69; 0.97; 1.42} | 0.93 | <0.01 | 0.035 | 0.0012 | - |
| WBC [×103/mm3] | {11.35; 15.41; 22.09} | {11.63; 12.72; 24.26} | {8.54; 12.68; 19.06} | - | - | - | 0.4378 | - |
| PCT [µg/L] | {4.93; 25.82; 43.15} | {7.97; 20.93; 44.28} | {7.51; 15.91; 30.48} | 1 | <0.01 | 0.09 | 0.0076 | - |
| CRP [mg/L] | {192.15; 235.48; 257.65} | {125.30; 200.72; 226.14} | {114.00; 163.00; 219.00} | 0.19 | 0.02 | <0.01 | <0.0001 | - |
| IL-18 [pg/mL] | {849.50; 1243.00; 1703.50} | {881.00; 1241.50; 1636.00} | {795.50; 1081.50; 1521.50} | - | - | - | 0.0787 | - |
| sCD163 [ng/mL] | {945.20; 1240.15; 1852.60} | {967.65; 1352.30; 1993.65} | {904.30; 1361.60; 2163.30} | - | - | - | 0.4169 | - |
| sCD163/IL-18 ratio [ng/pg] | 1.26 ± 0.73 | 1.40 ± 0.96 | 1.59 ± 1.20 | - | - | - | 0.1088 | <0.0001 |
| PREDICTION MODEL 1 (Null Hypothesis Score Test p = 0.0064) In the process of deriving this model, sCD163 and IL-18 were used as separate features | ||||||
| AIC | BIC | Pseudo-R2 (Nagelkerke) | Hosmer-Lemeshow Test p | AUC (Learning) | AUC (Testing) | |
| 40.82 | 45.88 | 0.3811 | 0.6811 | 0.828 ± 0.0655 | 0.792 ± 0.0709 | |
| Variable | βi | OR | OR CI (−95%) | OR CI (95%) | p | |
| y intercept (β0) | −27.345 | - | - | - | - | |
| Age | 0.087 | 1.091 | 1.009 | 1.179 | 0.029 | |
| log1.1[sCD163] | 0.277 | 1.319 | 1.075 | 1.618 | 0.008 | |
| PREDICTION MODEL 2 (Null Hypothesis Score Test p = 0.0220) In the process of deriving this model, the sCD163/IL-18 ratio was used instead of its components: sCD163 and IL-18 | ||||||
| AIC | BIC | Pseudo-R2 (Nagelkerke) | Hosmer-Lemeshow Test p | AUC (Learning) | AUC (Testing) | |
| 43.54 | 50.29 | 0.3617 | 0.3228 | 0.821 ± 0.0733 | 0.729 ± 0.0899 | |
| Variable | βi | OR | OR CI (−95%) | OR CI (95%) | p | |
| y intercept (β0) | −8.877 | - | - | - | - | |
| sCD163/IL-18 | 1.361 | 3.900 | 1.015 | 14.989 | 0.048 | |
| CRP | 0.009 | 1.009 | 1.001 | 1.018 | 0.026 | |
| APACHE II | 0.174 | 1.190 | 1.023 | 1.384 | 0.024 | |
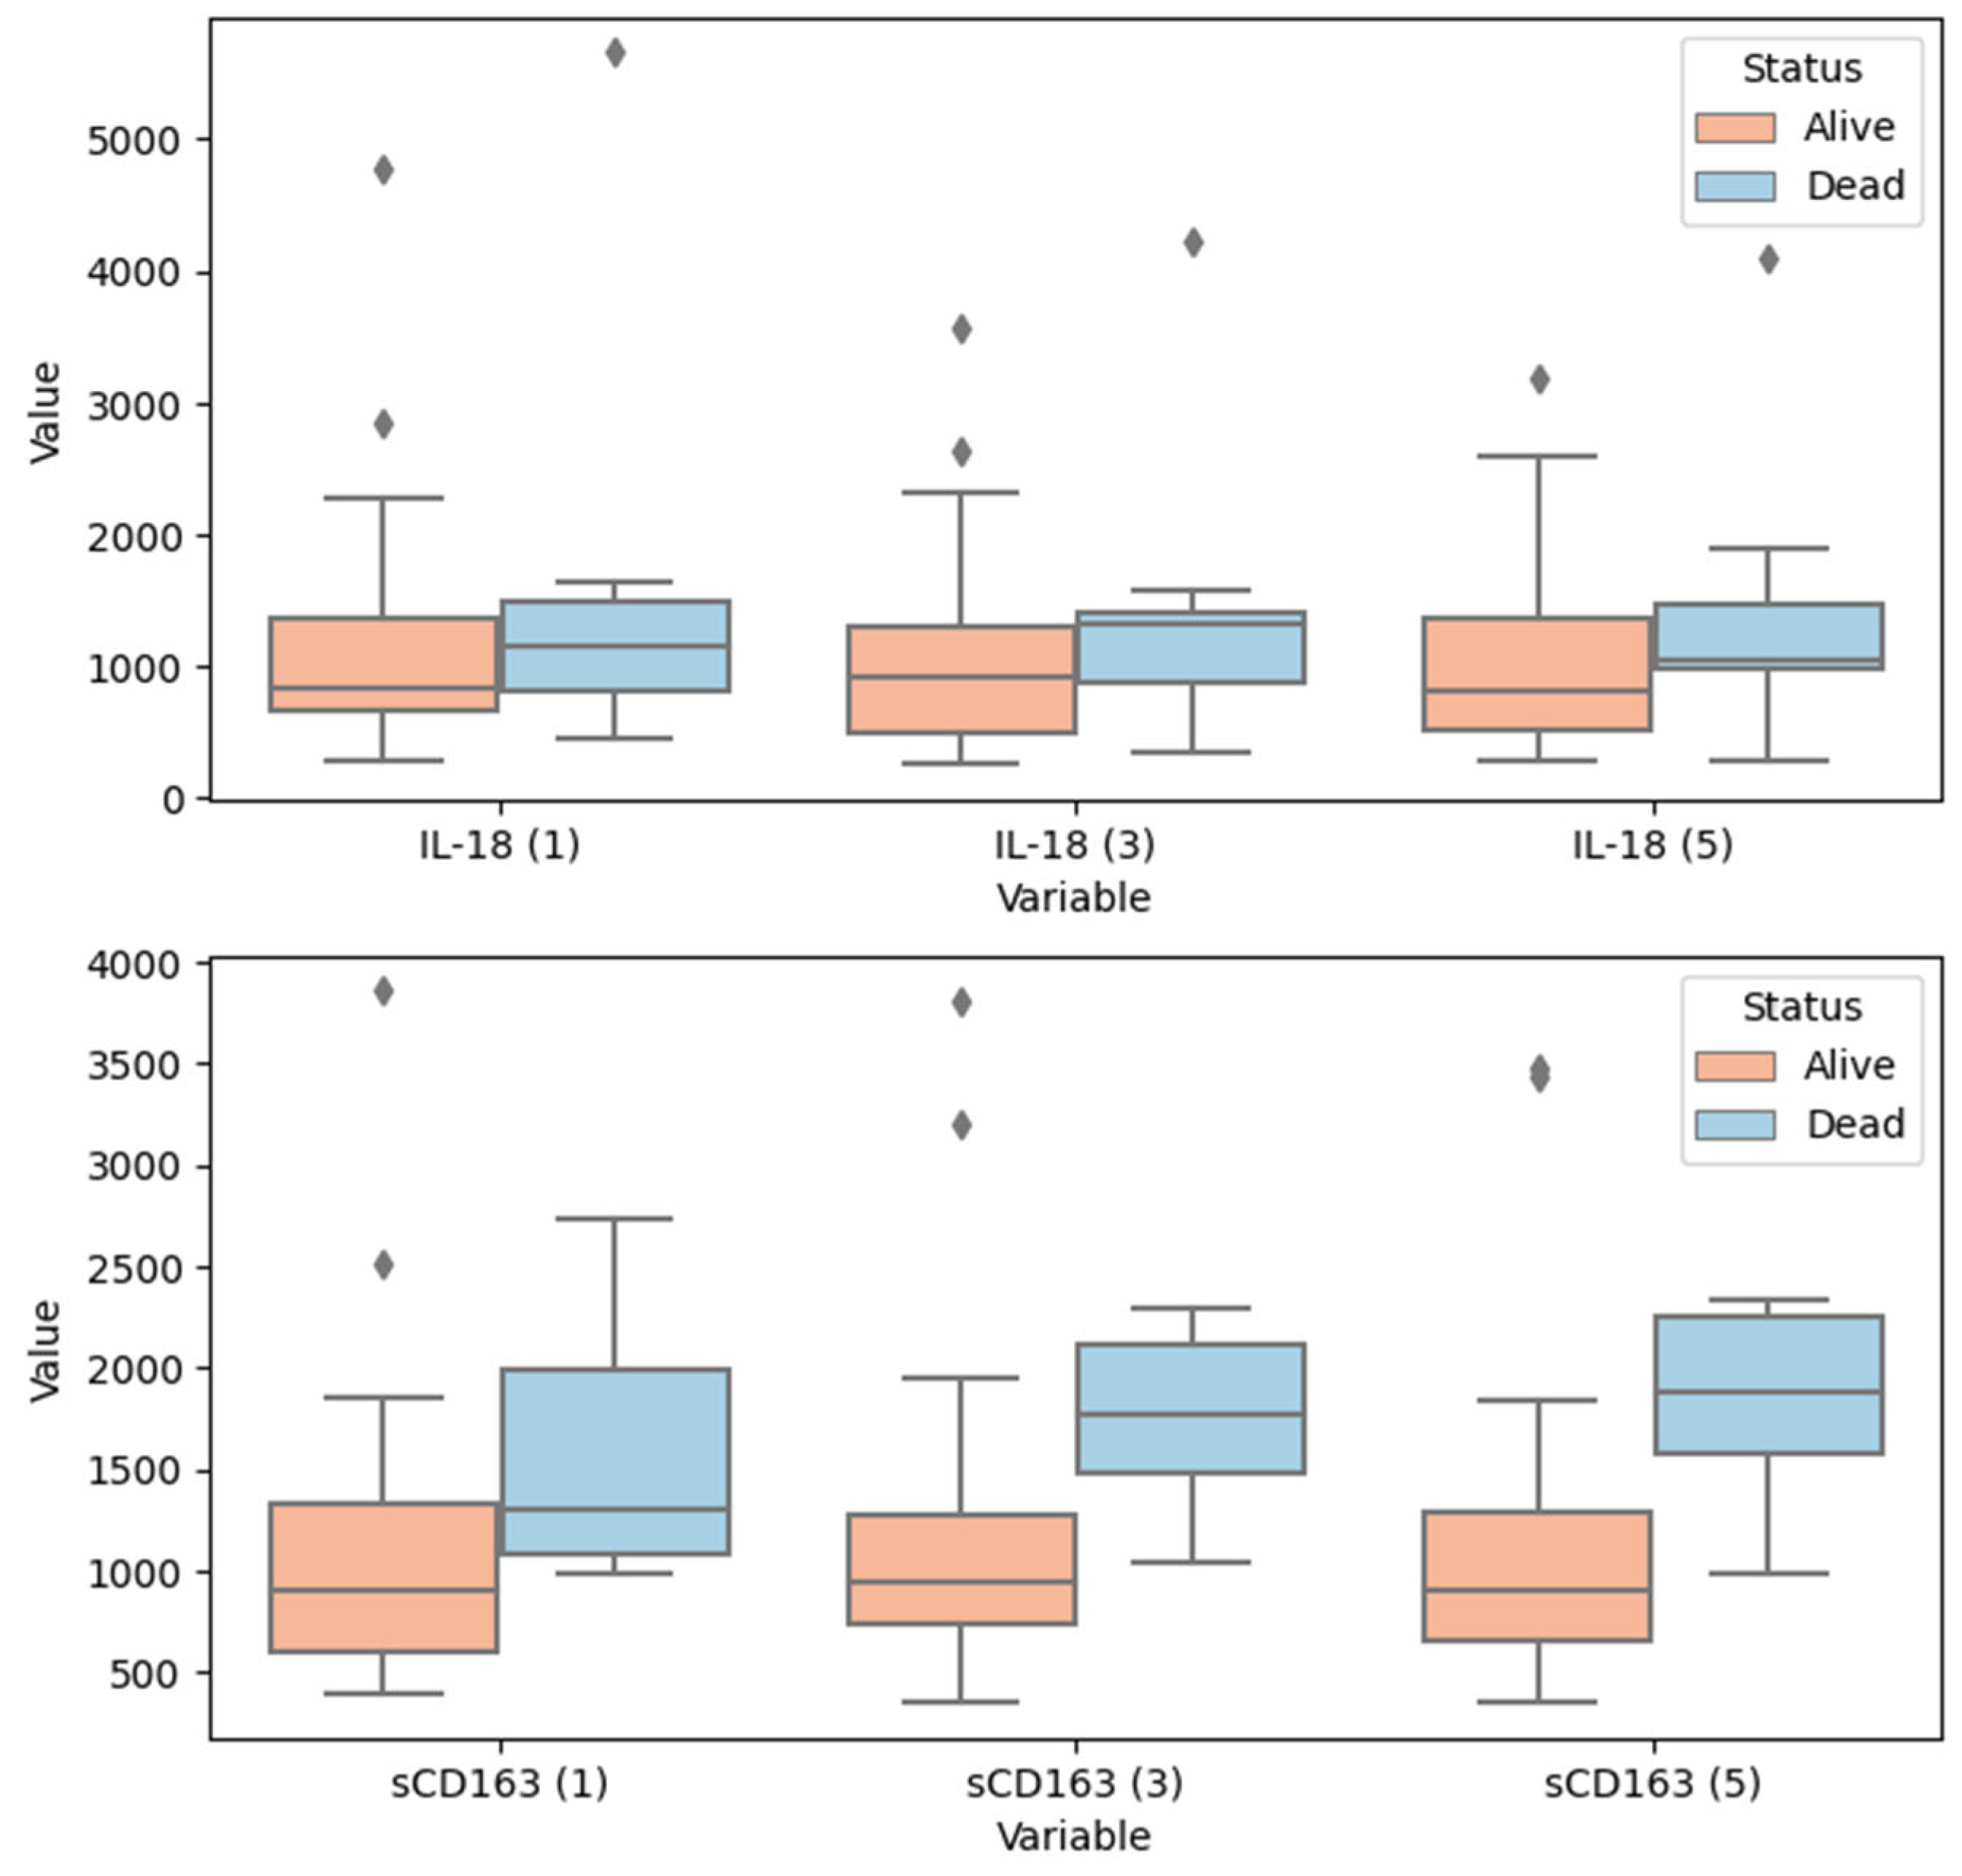
| Parameters (Timepoints) | Survival Status: Alive | Survival Status: Dead | p |
|---|---|---|---|
| IL-18 [pg/mL] (1st day) | {671.00; 846.00; 1372.00} | {762.00; 1147.00; 1629.00} | 0.455 |
| IL-18 [pg/mL] (3rd day) | {504.00; 926.00; 1296.00} | {804.00; 1328.00; 1420.00} | 0.254 |
| IL-18 [pg/mL] (5th day) | {528.00; 818.00; 1364.00} | {985.00; 1037.00; 1611.00} | 0.241 |
| sCD163 [ng/mL] (1st day) | {596.90; 906.50; 1323.20} | {1074.10; 1294.20; 2114.10} | 0.017 |
| sCD163 [ng/mL] (3rd day) | {736.80; 942.30; 1276.80} | {1386.10; 1763.60; 2176.20} | 0.0005 |
| sCD163 [ng/mL] (5th day) | {653.70; 898.80; 1280.30} | {1546.20; 1880.80; 2307.00} | 0.0001 |
| MODEL 1 (Model of the Best Fit; Iterative Process: Inclusion if p < 0.05; Exclusion if p > 0.10) | |||||||
|---|---|---|---|---|---|---|---|
| −2LogL | AIC | BIC | R2 | ||||
| 46.84 | 60.84 | 63.62 | 0.7600 | ||||
| Variable | βi | βi SE | Χ2 | p | HR | HR −95% CI | HR 95% CI |
| APACHE II | 0.1980 | 0.0804 | 6.0569 | 0.0139 | 1.2189 | 1.0411 | 1.4271 |
| WBC | 0.0757 | 0.0429 | 3.1135 | 0.0776 | 1.0786 | 0.9917 | 1.1732 |
| PLT | 0.0074 | 0.0046 | 2.5453 | 0.1106 | 1.0074 | 0.9983 | 1.0166 |
| PCT | 0.0211 | 0.0119 | 3.1606 | 0.0754 | 1.0214 | 0.9978 | 1.0455 |
| CRP | 0.0073 | 0.0037 | 3.9736 | 0.0462 | 1.0073 | 1.0001 | 1.0145 |
| IL-18 | −0.0009 | 0.0004 | 4.7997 | 0.0285 | 0.9991 | 0.9982 | 0.9999 |
| sCD163 | 0.0018 | 0.0008 | 5.0452 | 0.0247 | 1.0018 | 1.0002 | 1.0033 |
| MODEL 2 (Alternative Model—Model 1 without the Information on CD163 and IL-18) | |||||||
| −2LogL | AIC | BIC | R2 | ||||
| 55.13 | 65.13 | 67.12 | 0.4831 | ||||
| Variable | βi | βi SE | Χ2 | p | HR | HR −95% CI | HR 95% CI |
| APACHE II | 0.0837 | 0.0553 | 2.2909 | 0.1301 | 1.0873 | 0.9756 | 1.2118 |
| WBC | 0.0429 | 0.0319 | 1.8051 | 0.1791 | 1.0438 | 0.9805 | 1.1112 |
| PLT | 0.0028 | 0.0036 | 0.5988 | 0.4391 | 1.0028 | 0.9957 | 1.0099 |
| PCT | 0.0124 | 0.0103 | 1.4652 | 0.2261 | 1.0125 | 0.9923 | 1.0331 |
| CRP | 0.0042 | 0.0030 | 1.9091 | 0.1671 | 1.0042 | 0.9982 | 1.0102 |
Disclaimer/Publisher’s Note: The statements, opinions and data contained in all publications are solely those of the individual author(s) and contributor(s) and not of MDPI and/or the editor(s). MDPI and/or the editor(s) disclaim responsibility for any injury to people or property resulting from any ideas, methods, instructions or products referred to in the content. |
© 2023 by the authors. Licensee MDPI, Basel, Switzerland. This article is an open access article distributed under the terms and conditions of the Creative Commons Attribution (CC BY) license (https://creativecommons.org/licenses/by/4.0/).
Share and Cite
Mierzchała-Pasierb, M.; Lipińska-Gediga, M.; Lewandowski, Ł.; Krzystek-Korpacka, M. Alterations in Serum Concentration of Soluble CD163 within Five Study Days from ICU Admission Are Associated with In-Hospital Mortality of Septic Patients—A Preliminary Study. Int. J. Environ. Res. Public Health 2023, 20, 2263. https://doi.org/10.3390/ijerph20032263
Mierzchała-Pasierb M, Lipińska-Gediga M, Lewandowski Ł, Krzystek-Korpacka M. Alterations in Serum Concentration of Soluble CD163 within Five Study Days from ICU Admission Are Associated with In-Hospital Mortality of Septic Patients—A Preliminary Study. International Journal of Environmental Research and Public Health. 2023; 20(3):2263. https://doi.org/10.3390/ijerph20032263
Chicago/Turabian StyleMierzchała-Pasierb, Magdalena, Małgorzata Lipińska-Gediga, Łukasz Lewandowski, and Małgorzata Krzystek-Korpacka. 2023. "Alterations in Serum Concentration of Soluble CD163 within Five Study Days from ICU Admission Are Associated with In-Hospital Mortality of Septic Patients—A Preliminary Study" International Journal of Environmental Research and Public Health 20, no. 3: 2263. https://doi.org/10.3390/ijerph20032263