
What Factors Dominate the Change of PM2.5 in the World from 2000 to 2019? A Study from Multi-Source Data

Abstract
:1. Introduction
2. Materials and Methods
2.1. Global Datasets
2.1.1. Global Estimates PM2.5 Dataset
2.1.2. MODIS Vegetation Indices
2.1.3. Meteorological Datasets
2.1.4. Nighttime Light Dataset
2.1.5. Global Statistical Data
2.2. Methods
2.2.1. Theil–Sen Median Trend Analysis and the Mann–Kendall Test
2.2.2. Multi-Scale Geographically Weighted Regression (MGWR)
3. Results
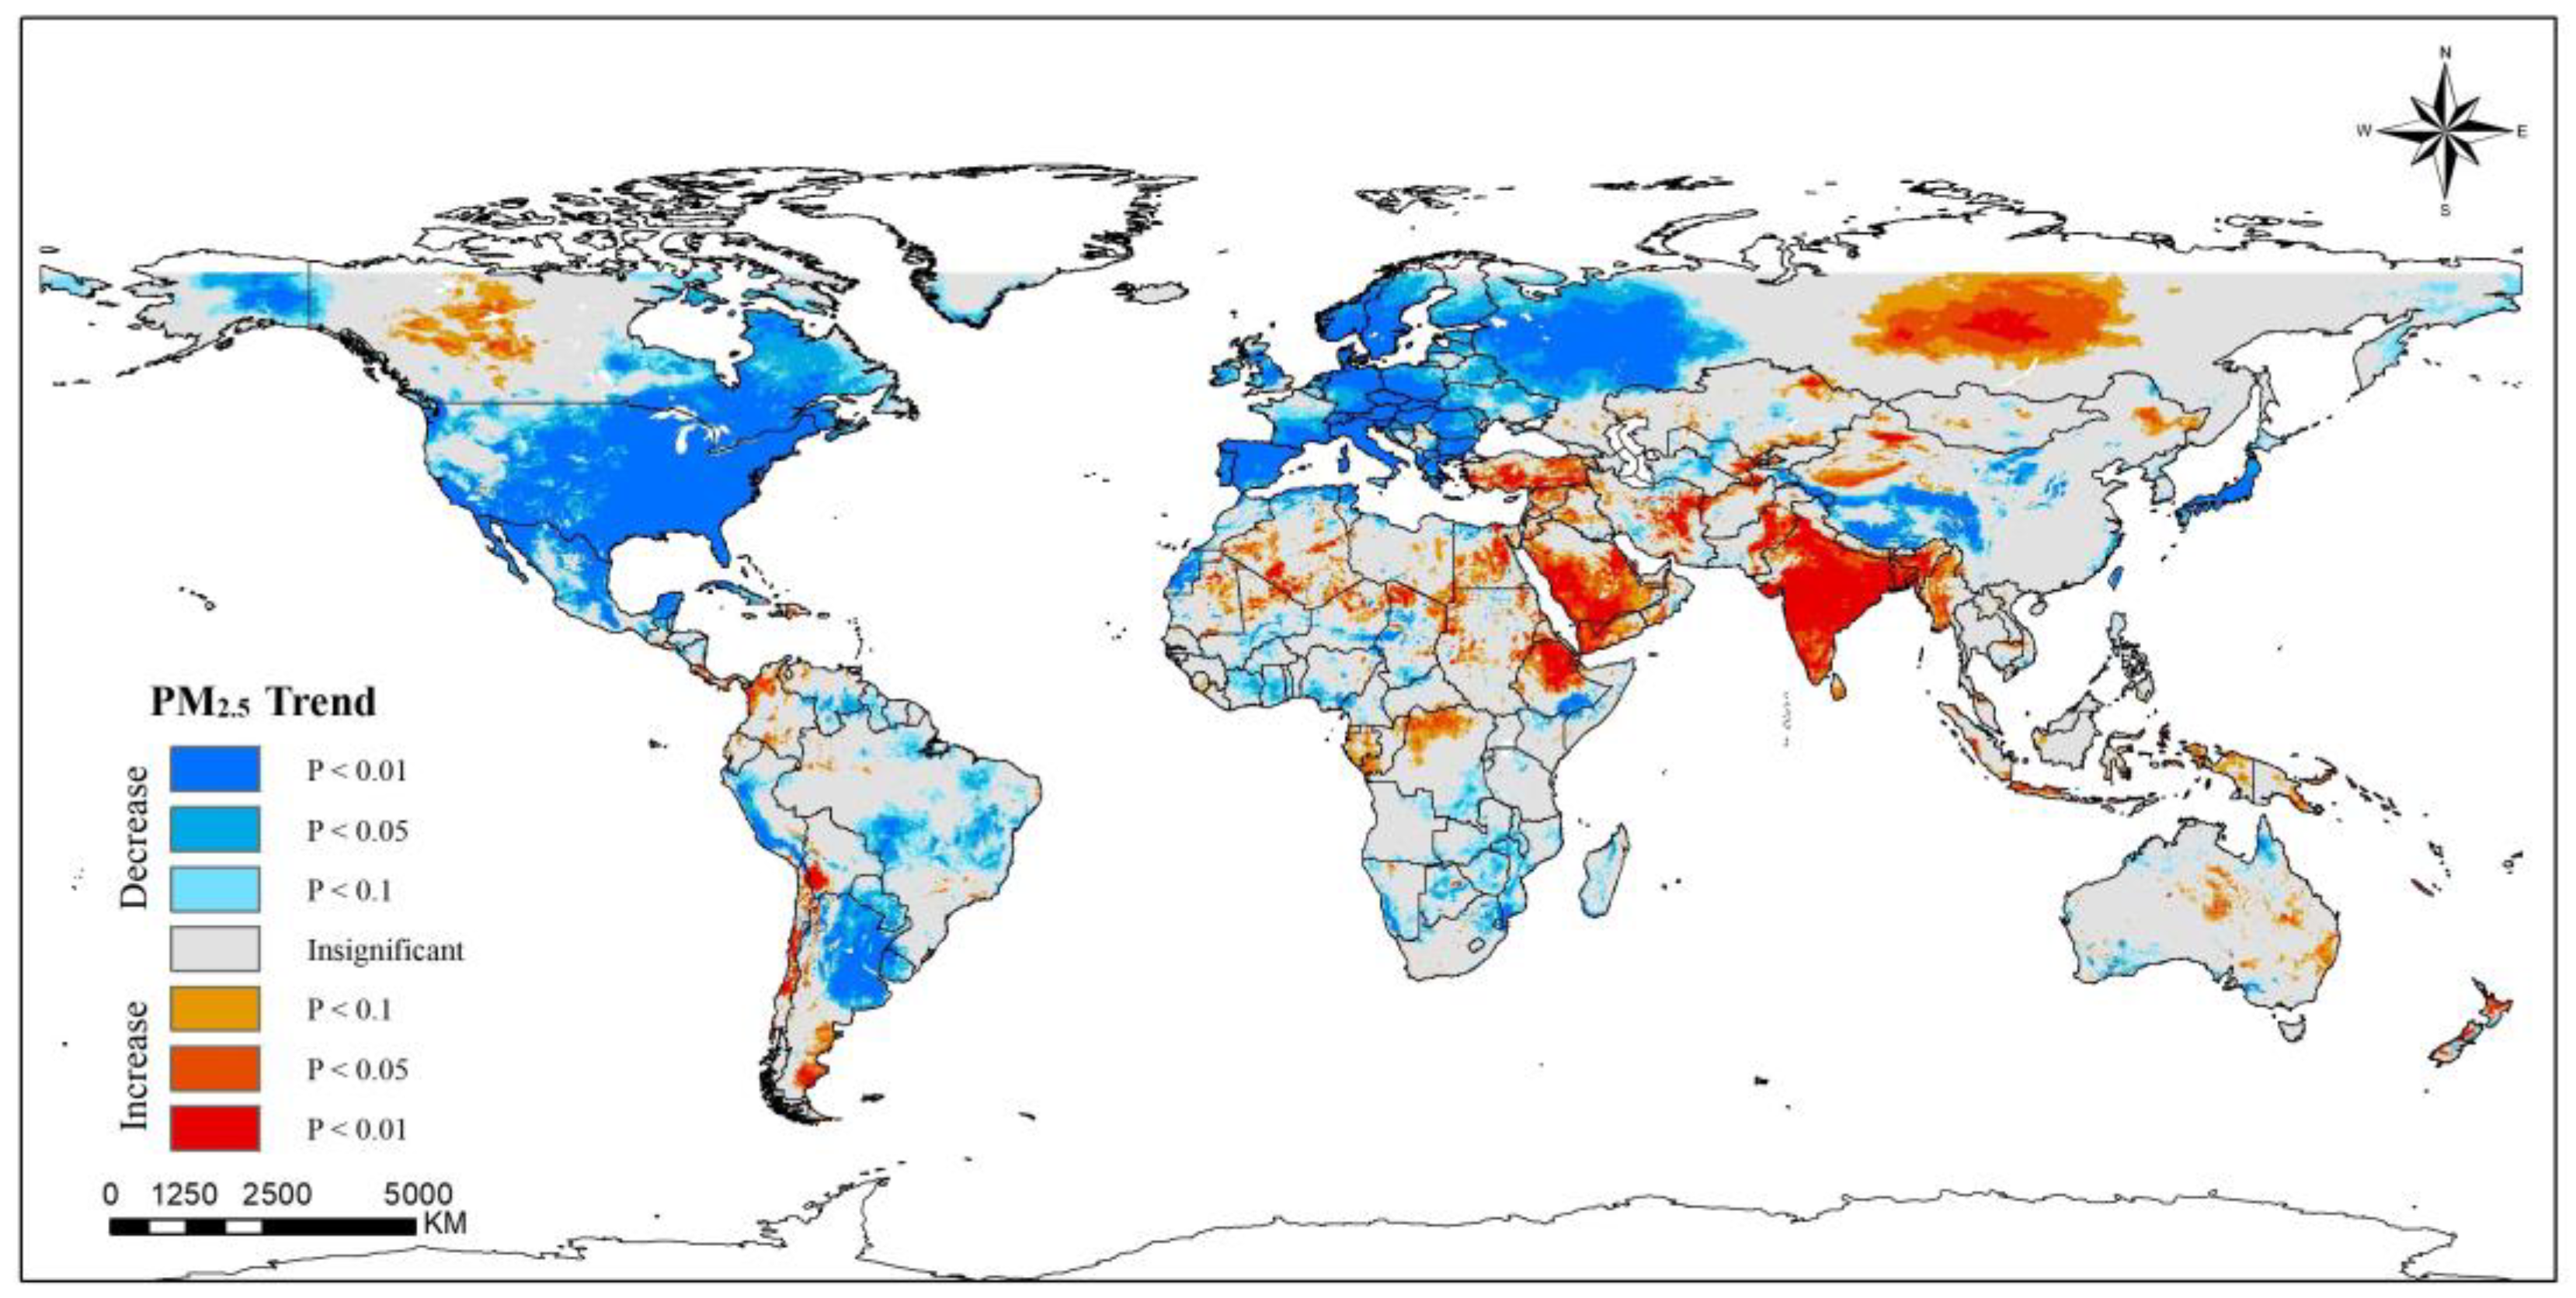
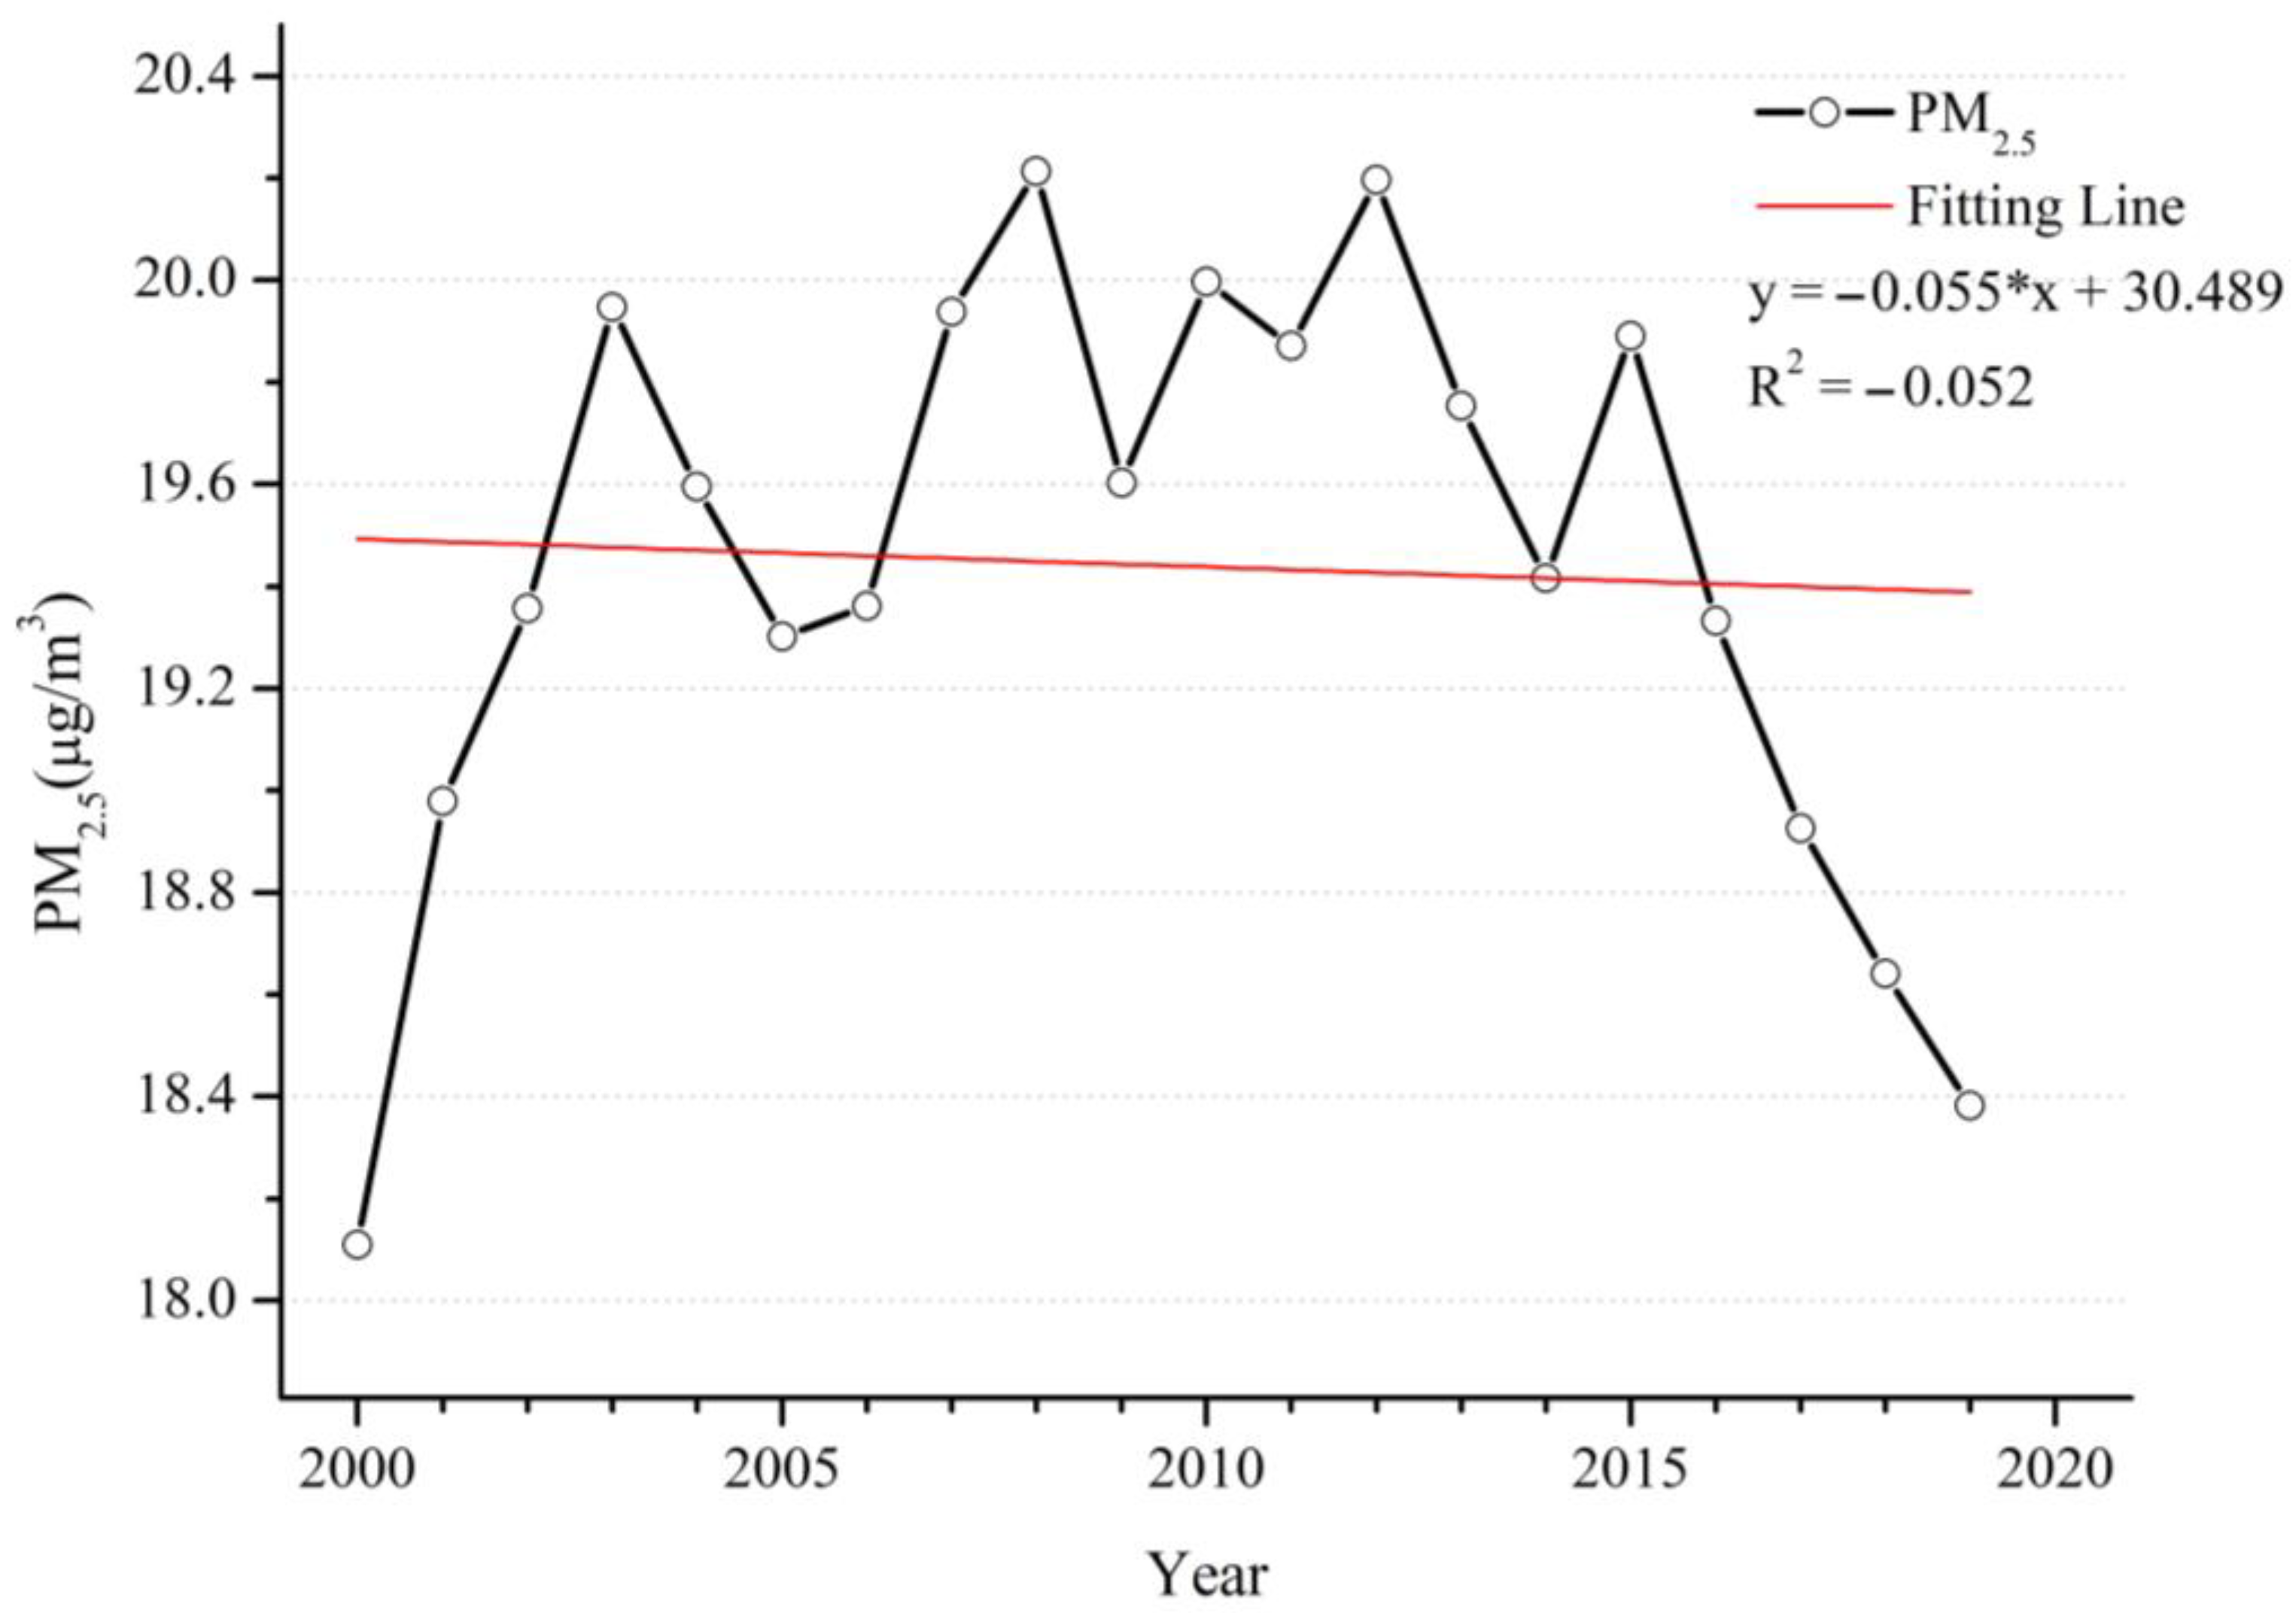
3.1. Global Spatiotemporal Patterns of PM2.5 in 2000–2019
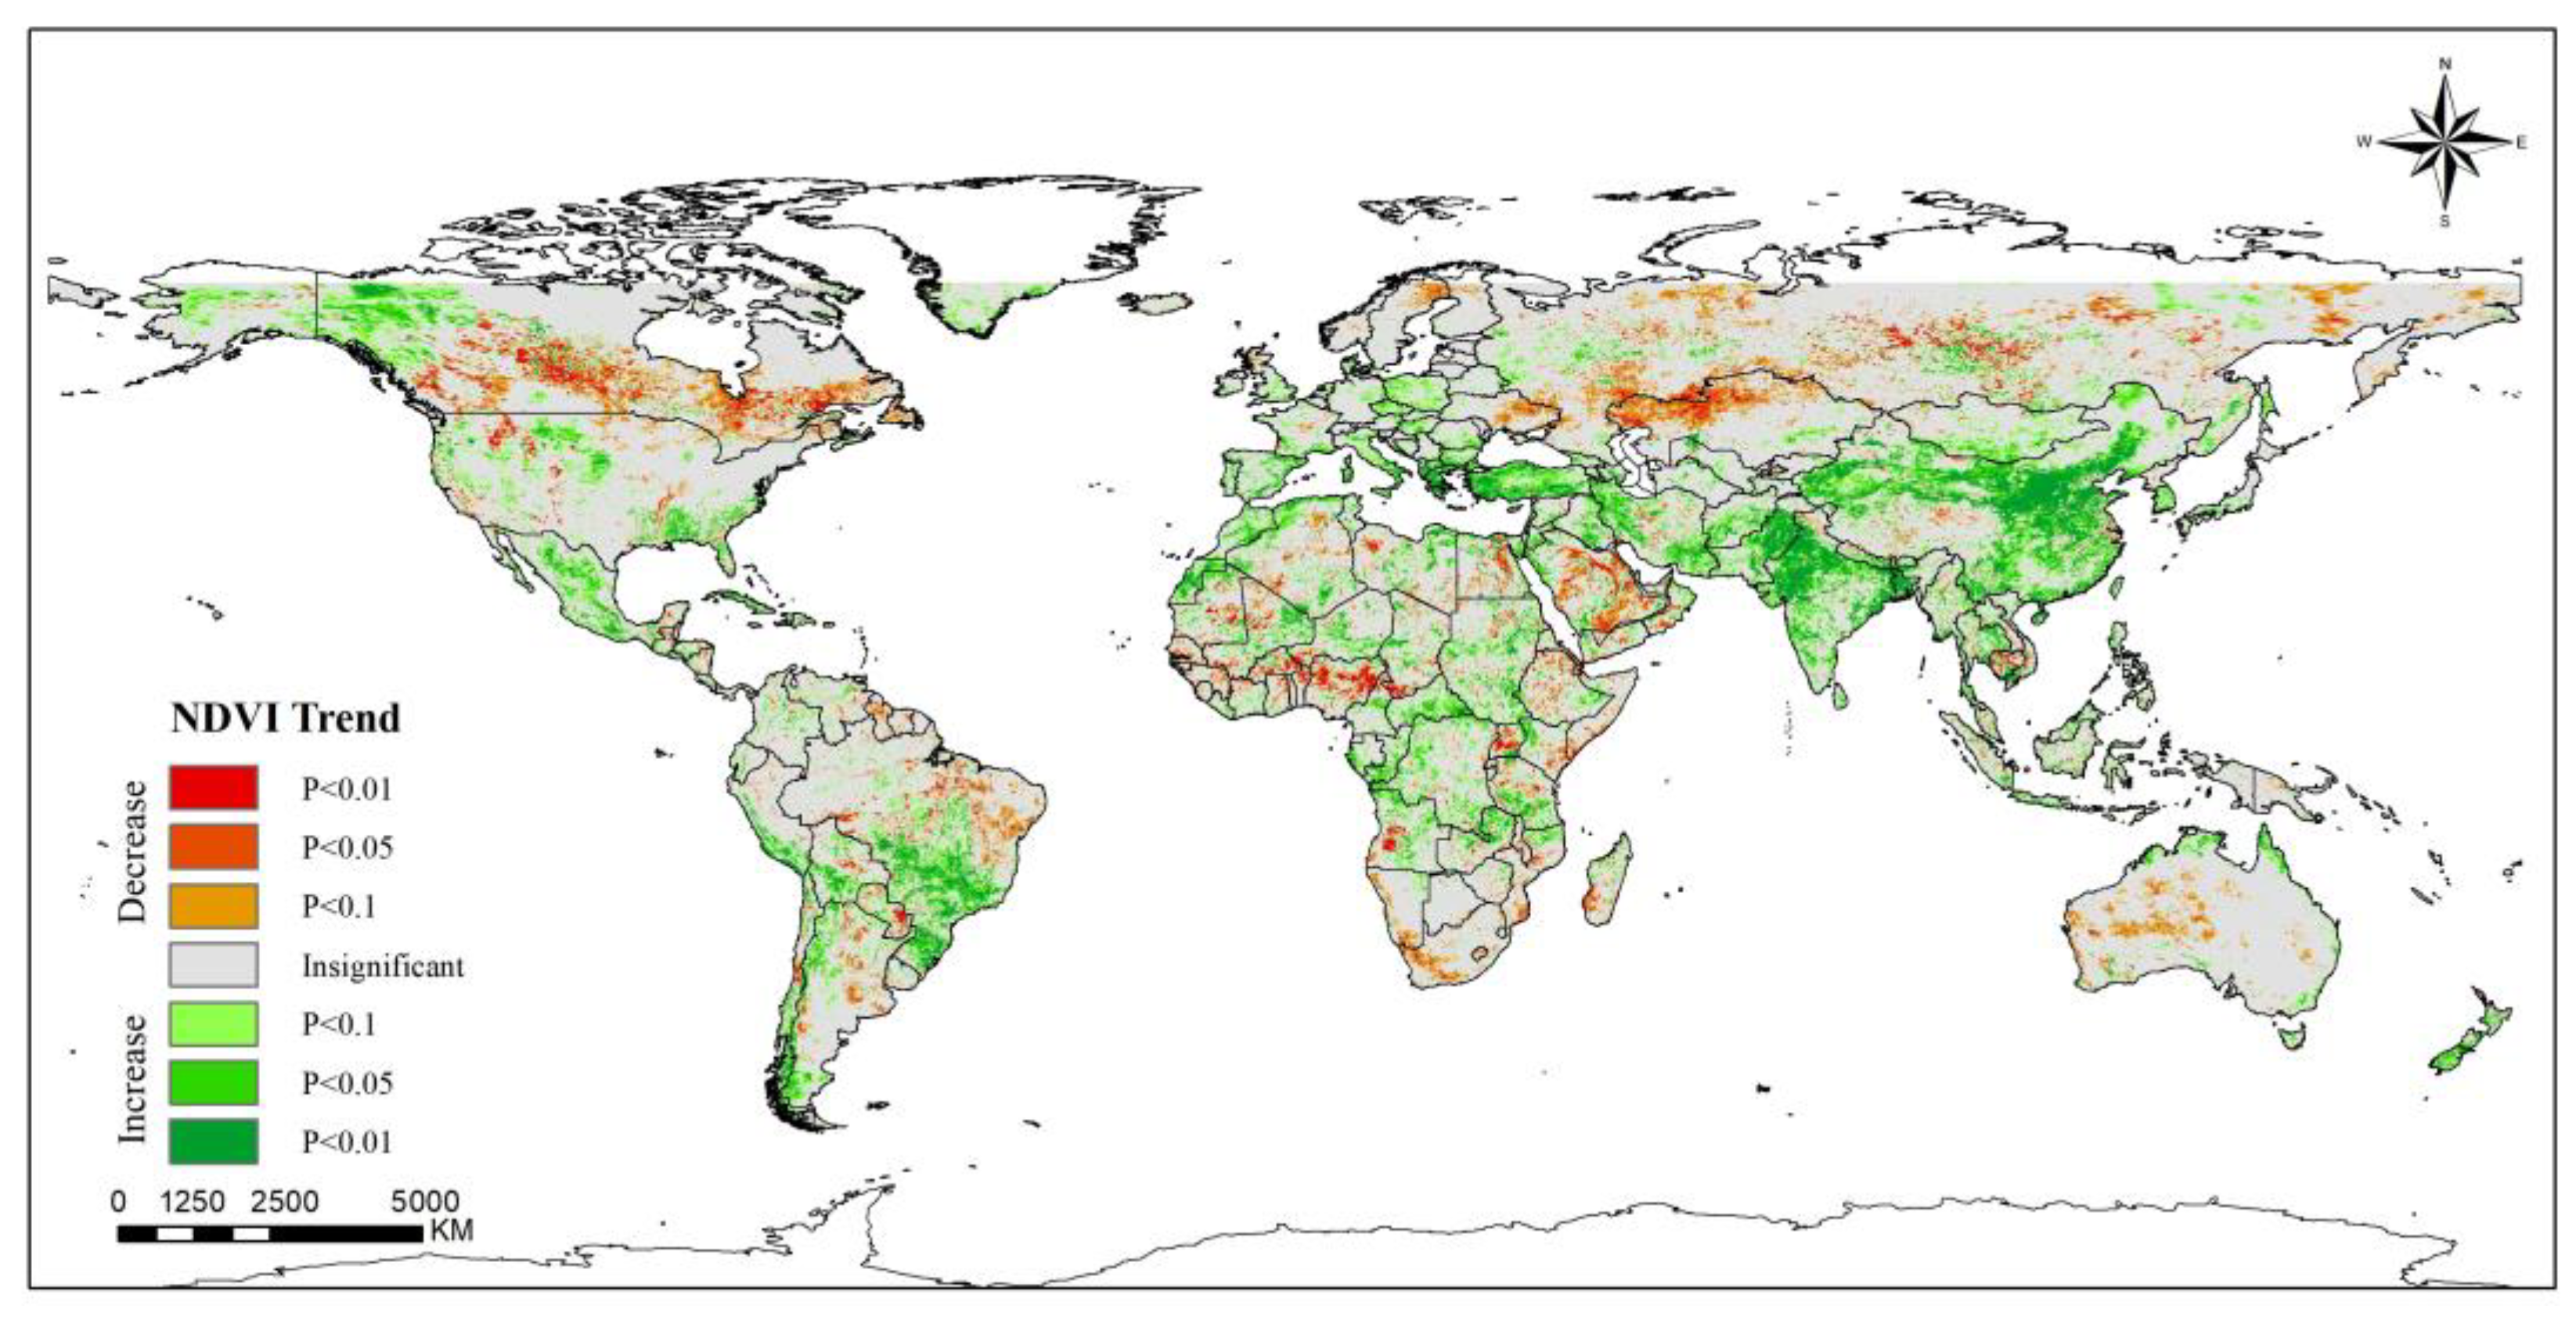
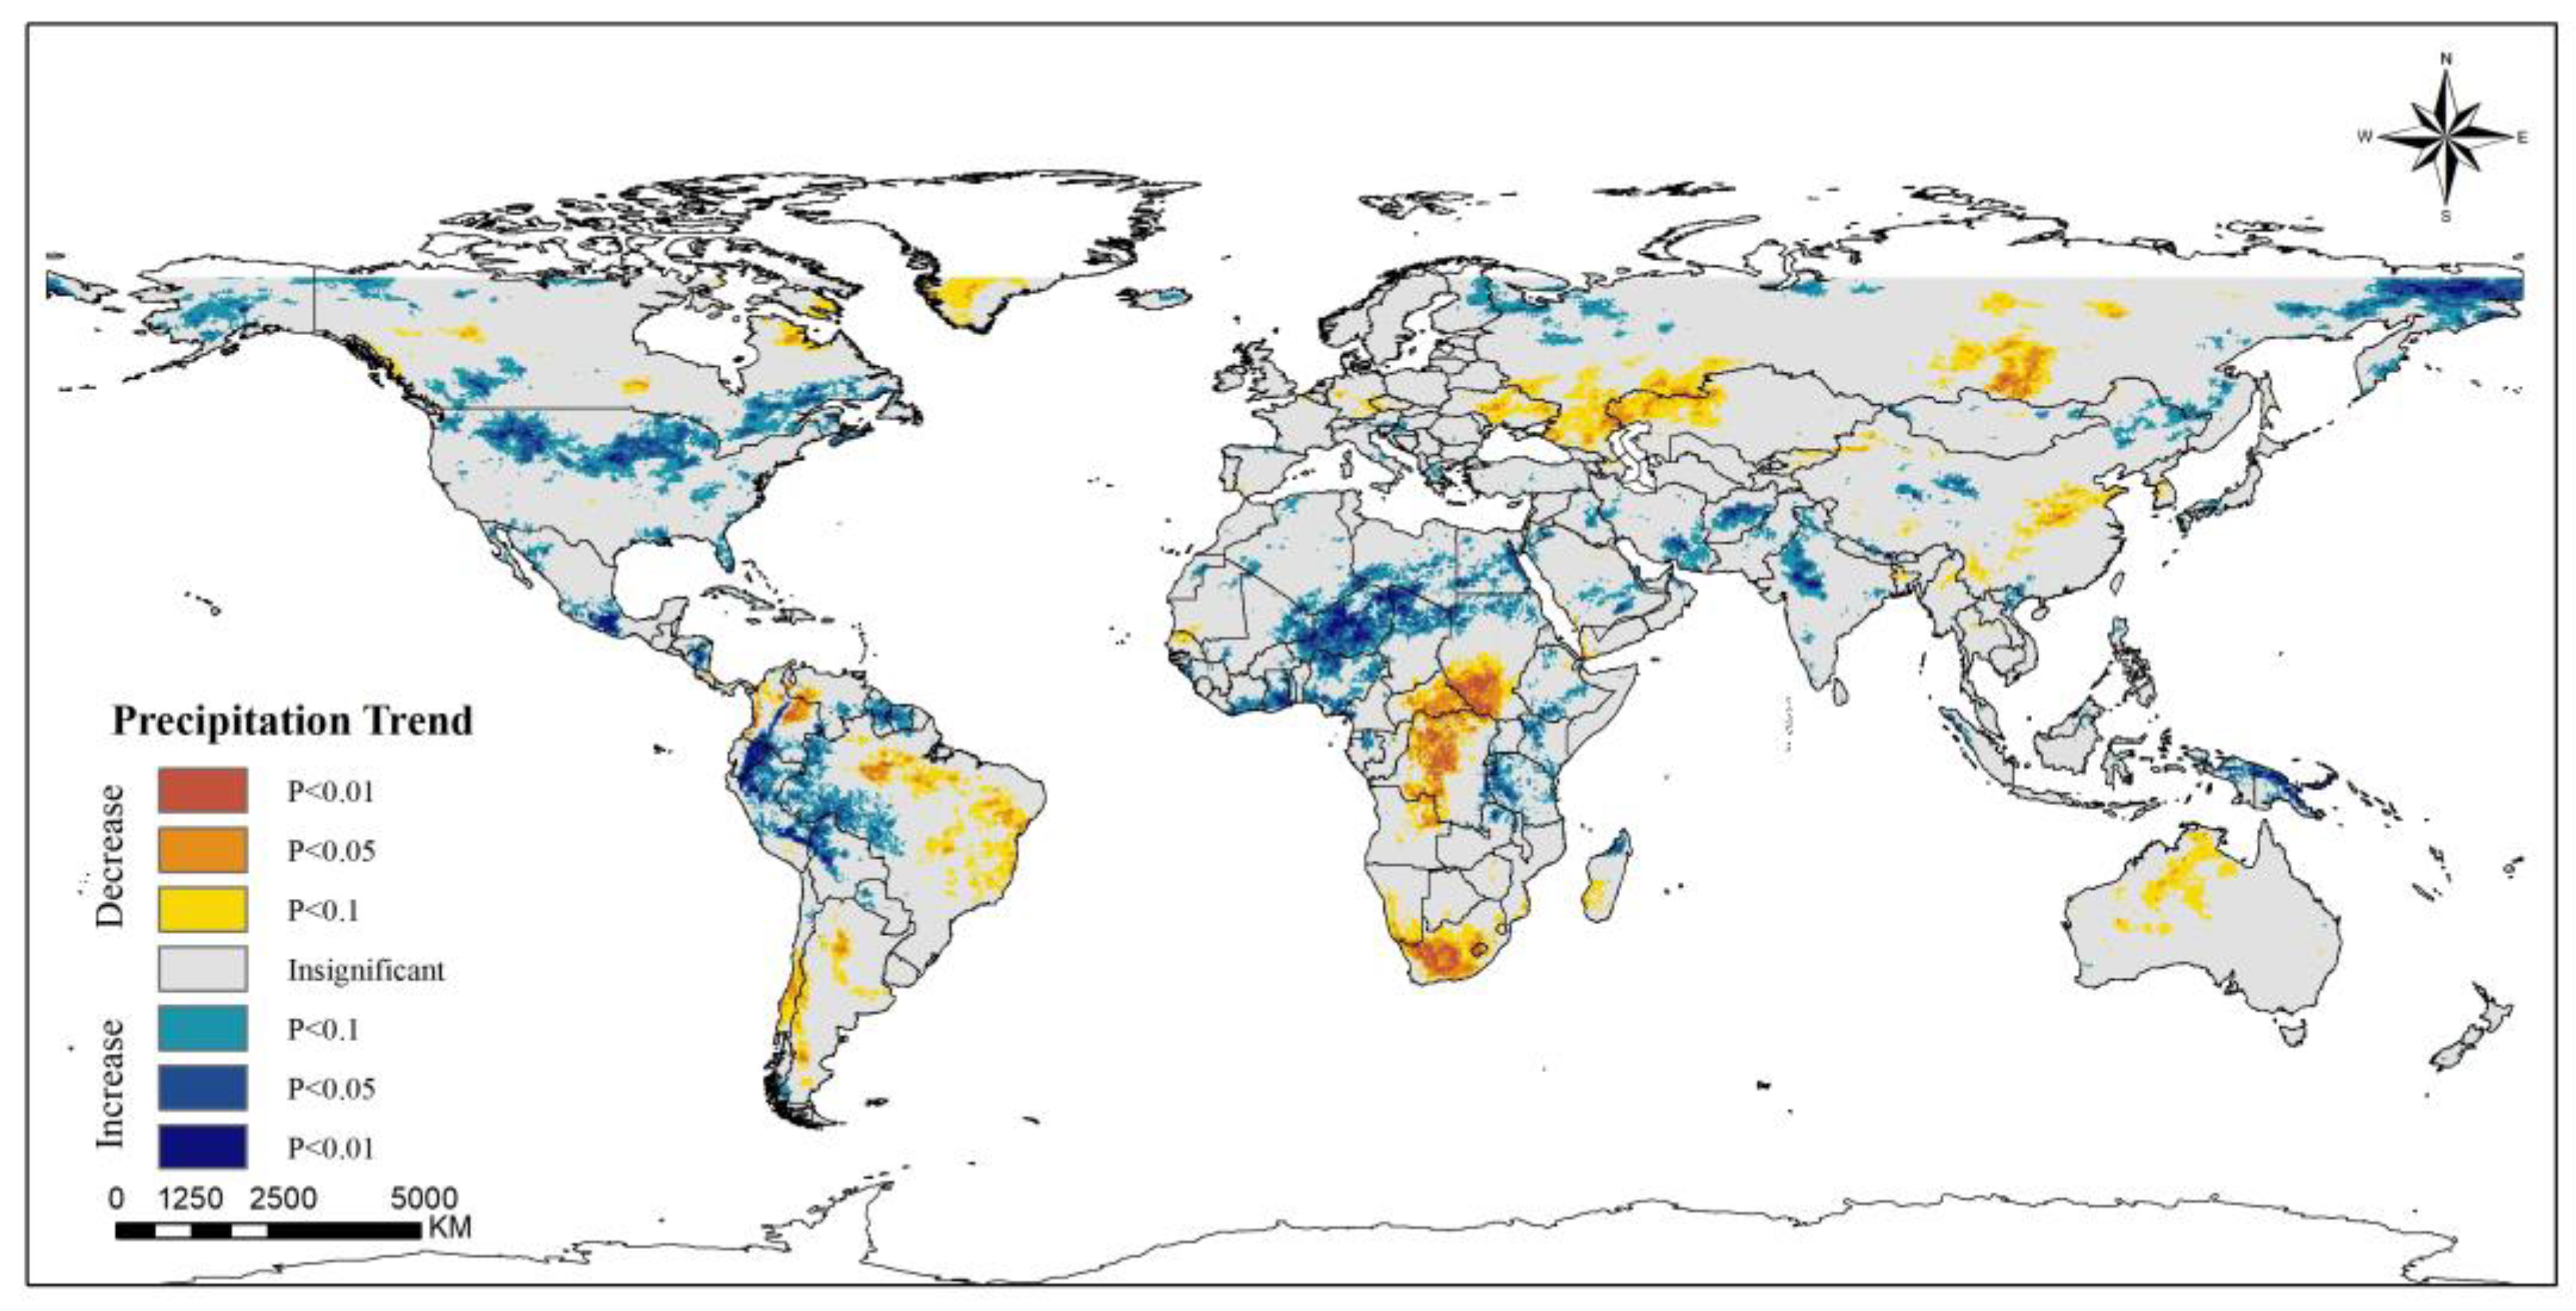
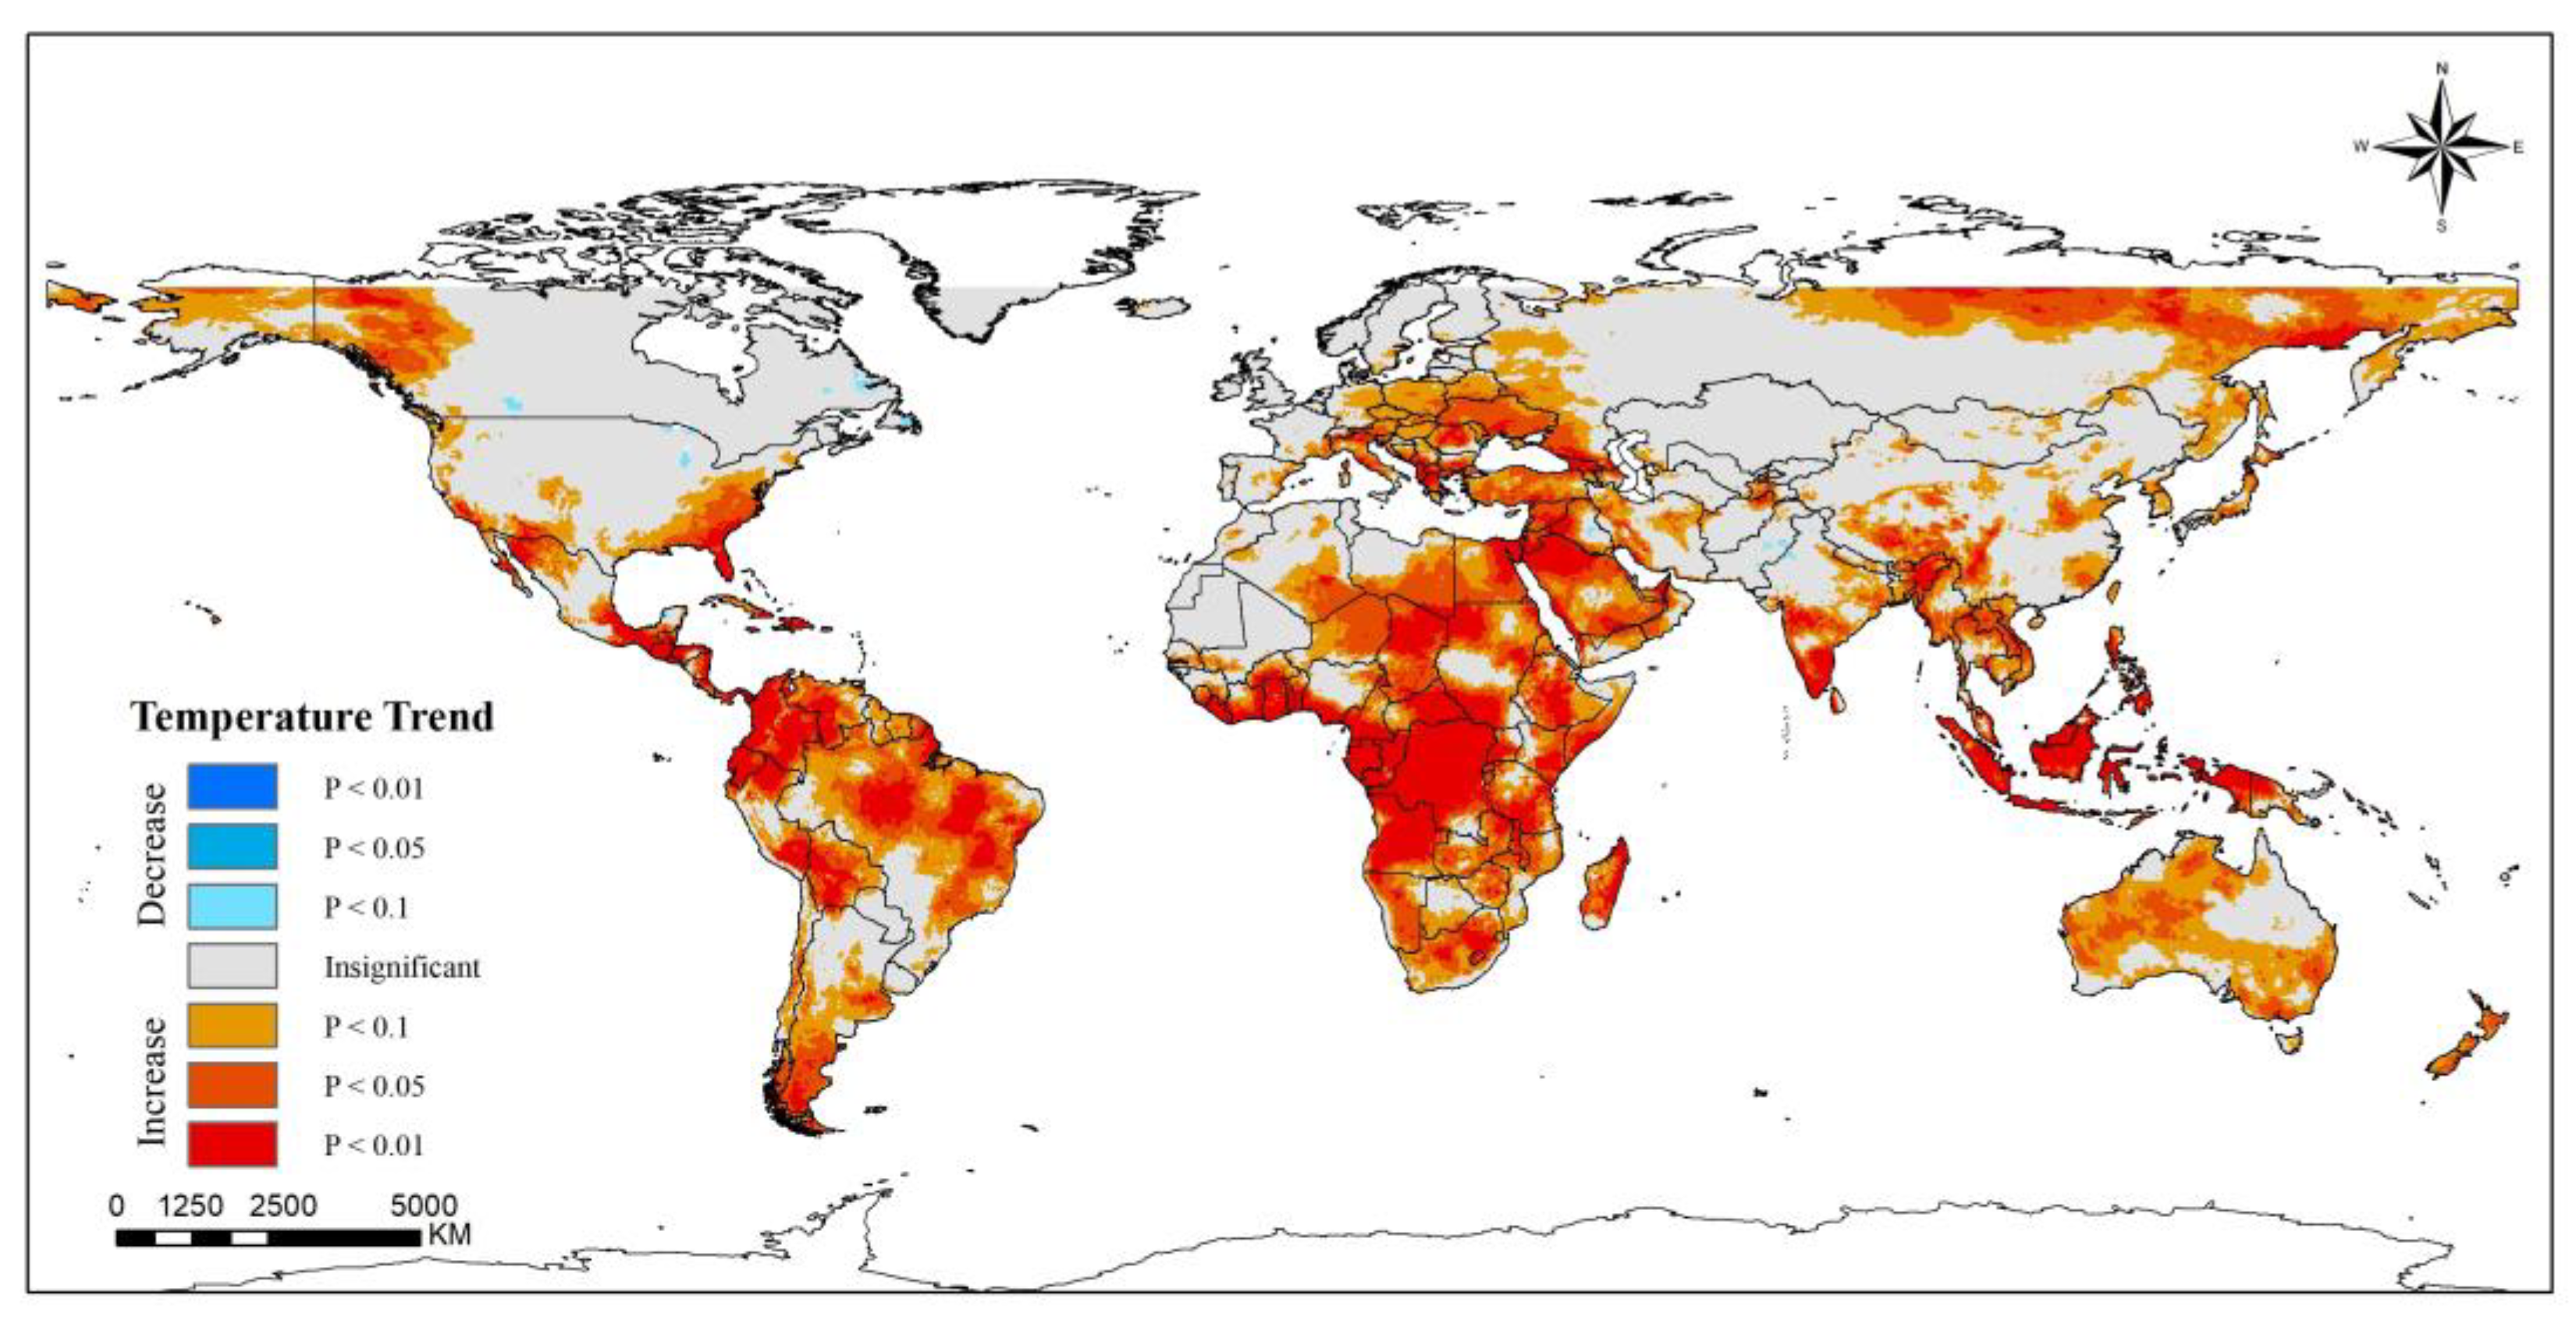
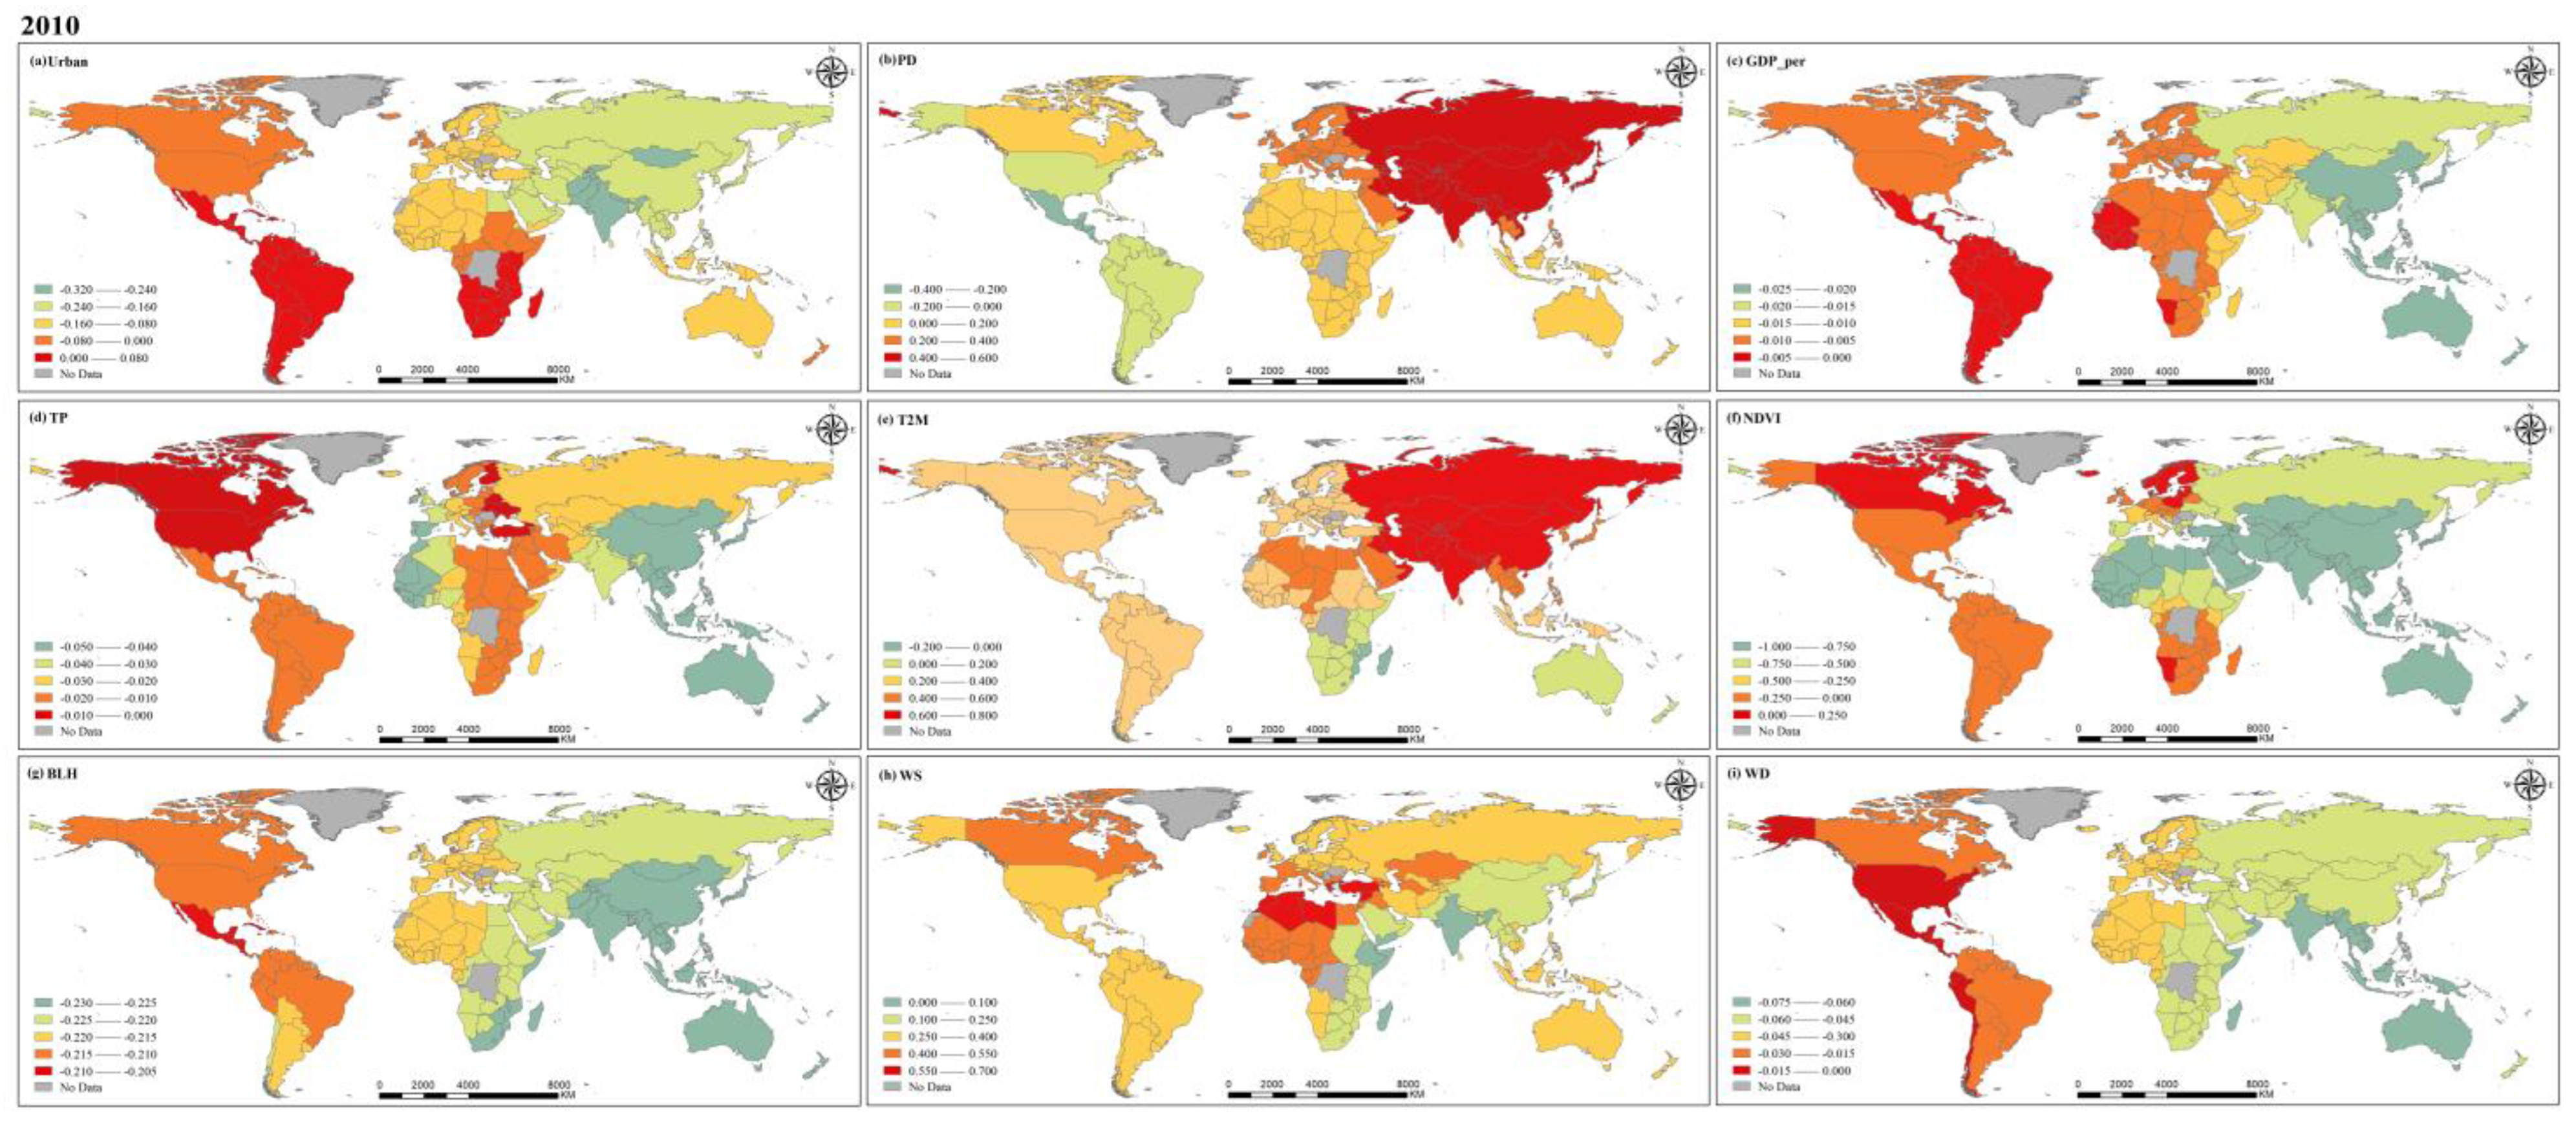
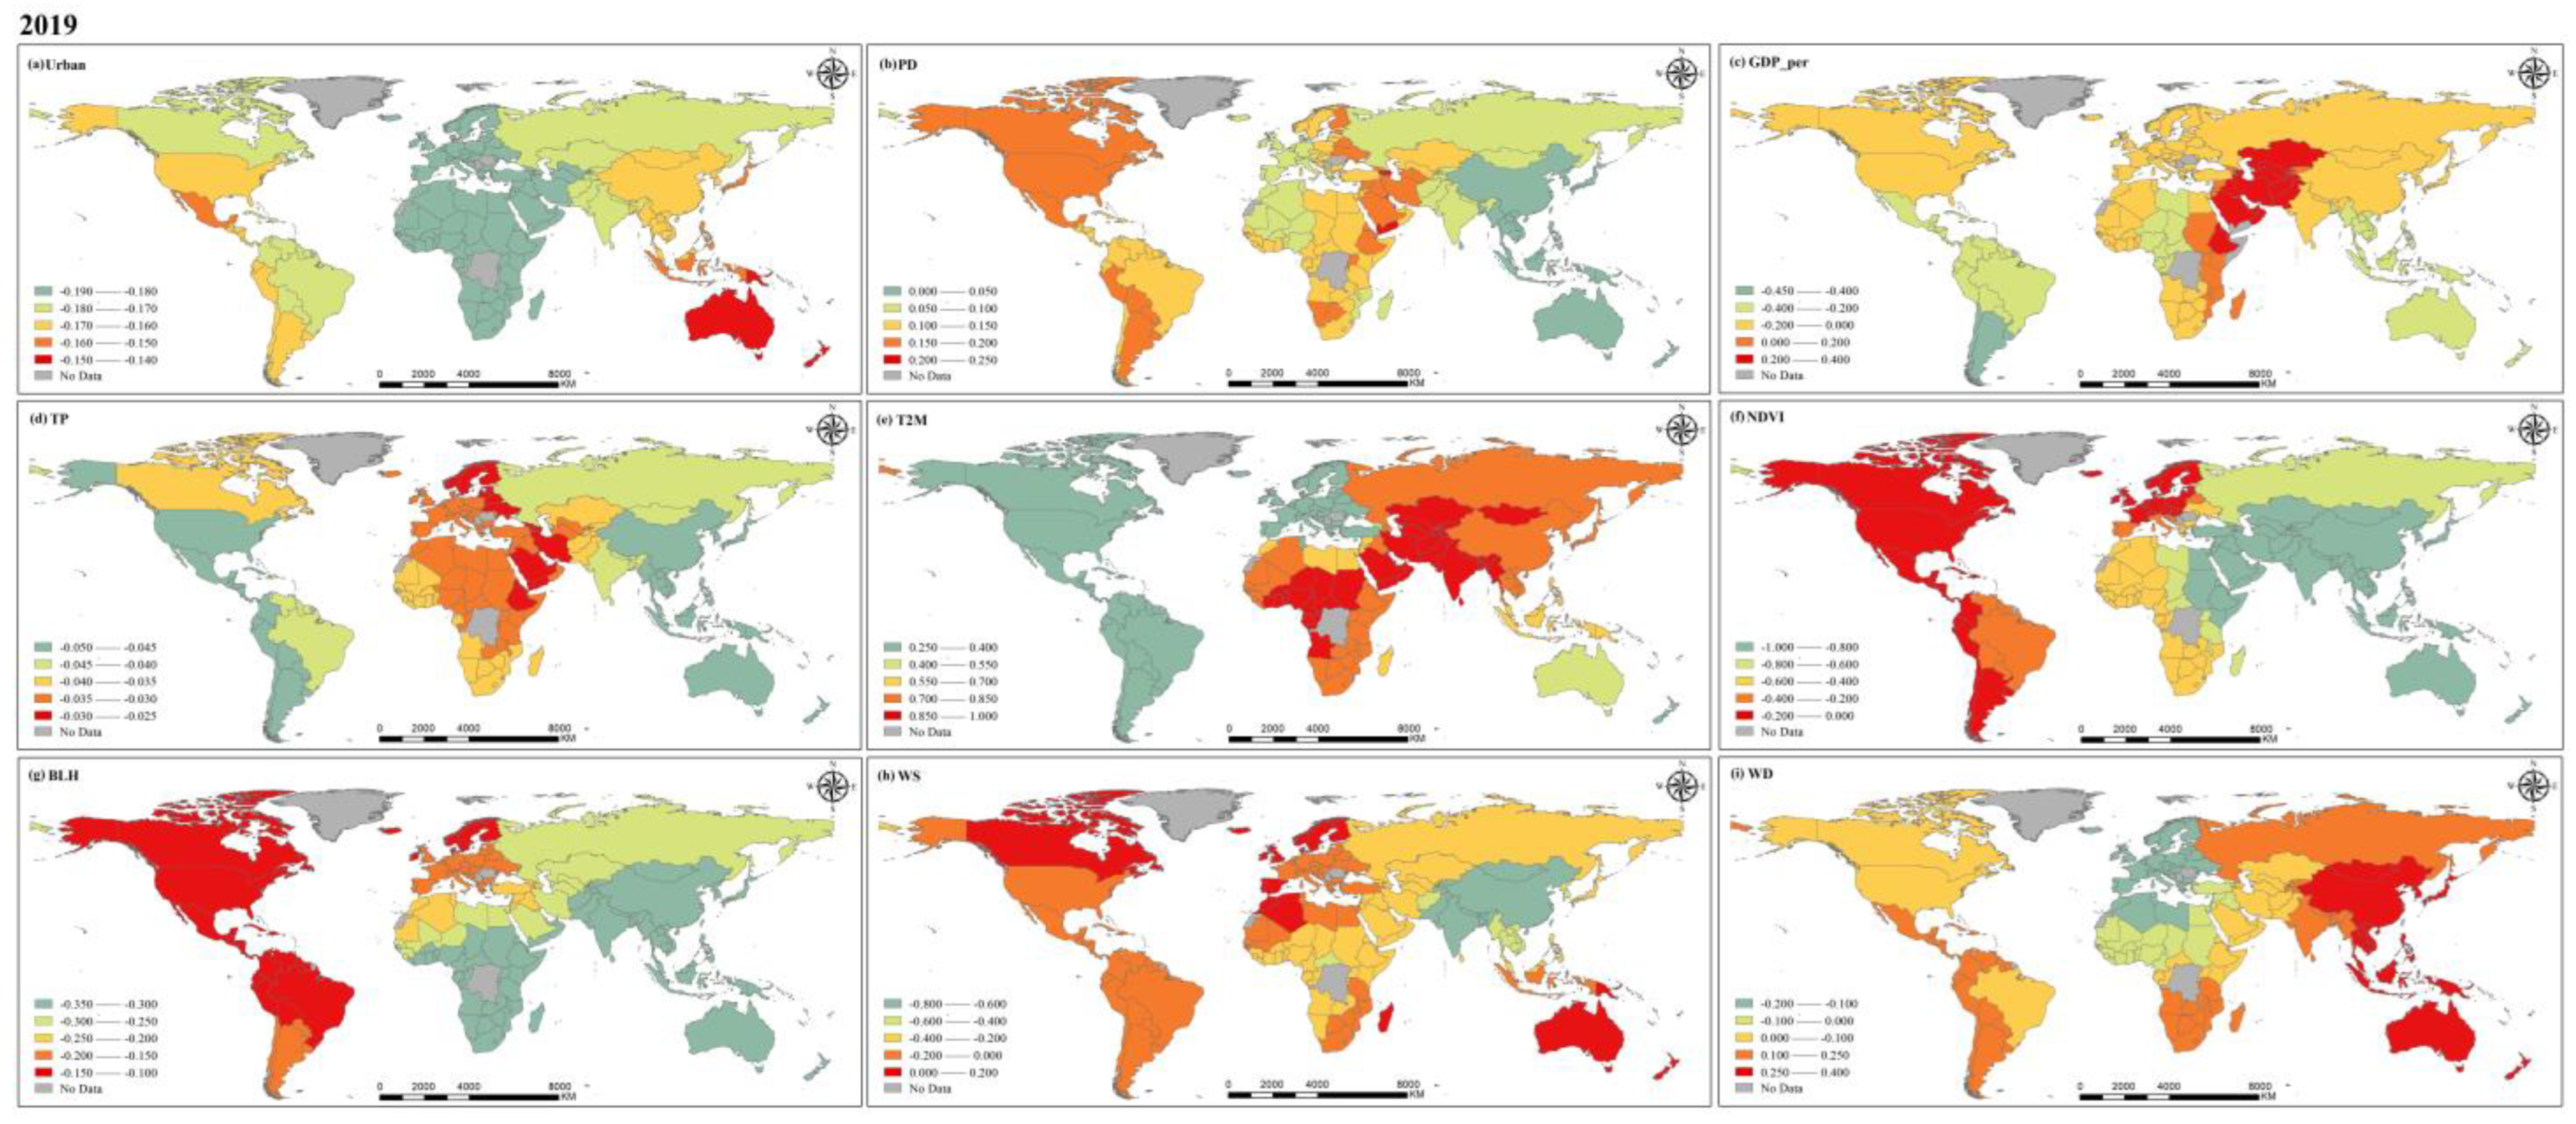
3.2. Spatial-Temporal Patterns of Natural Driving Factors
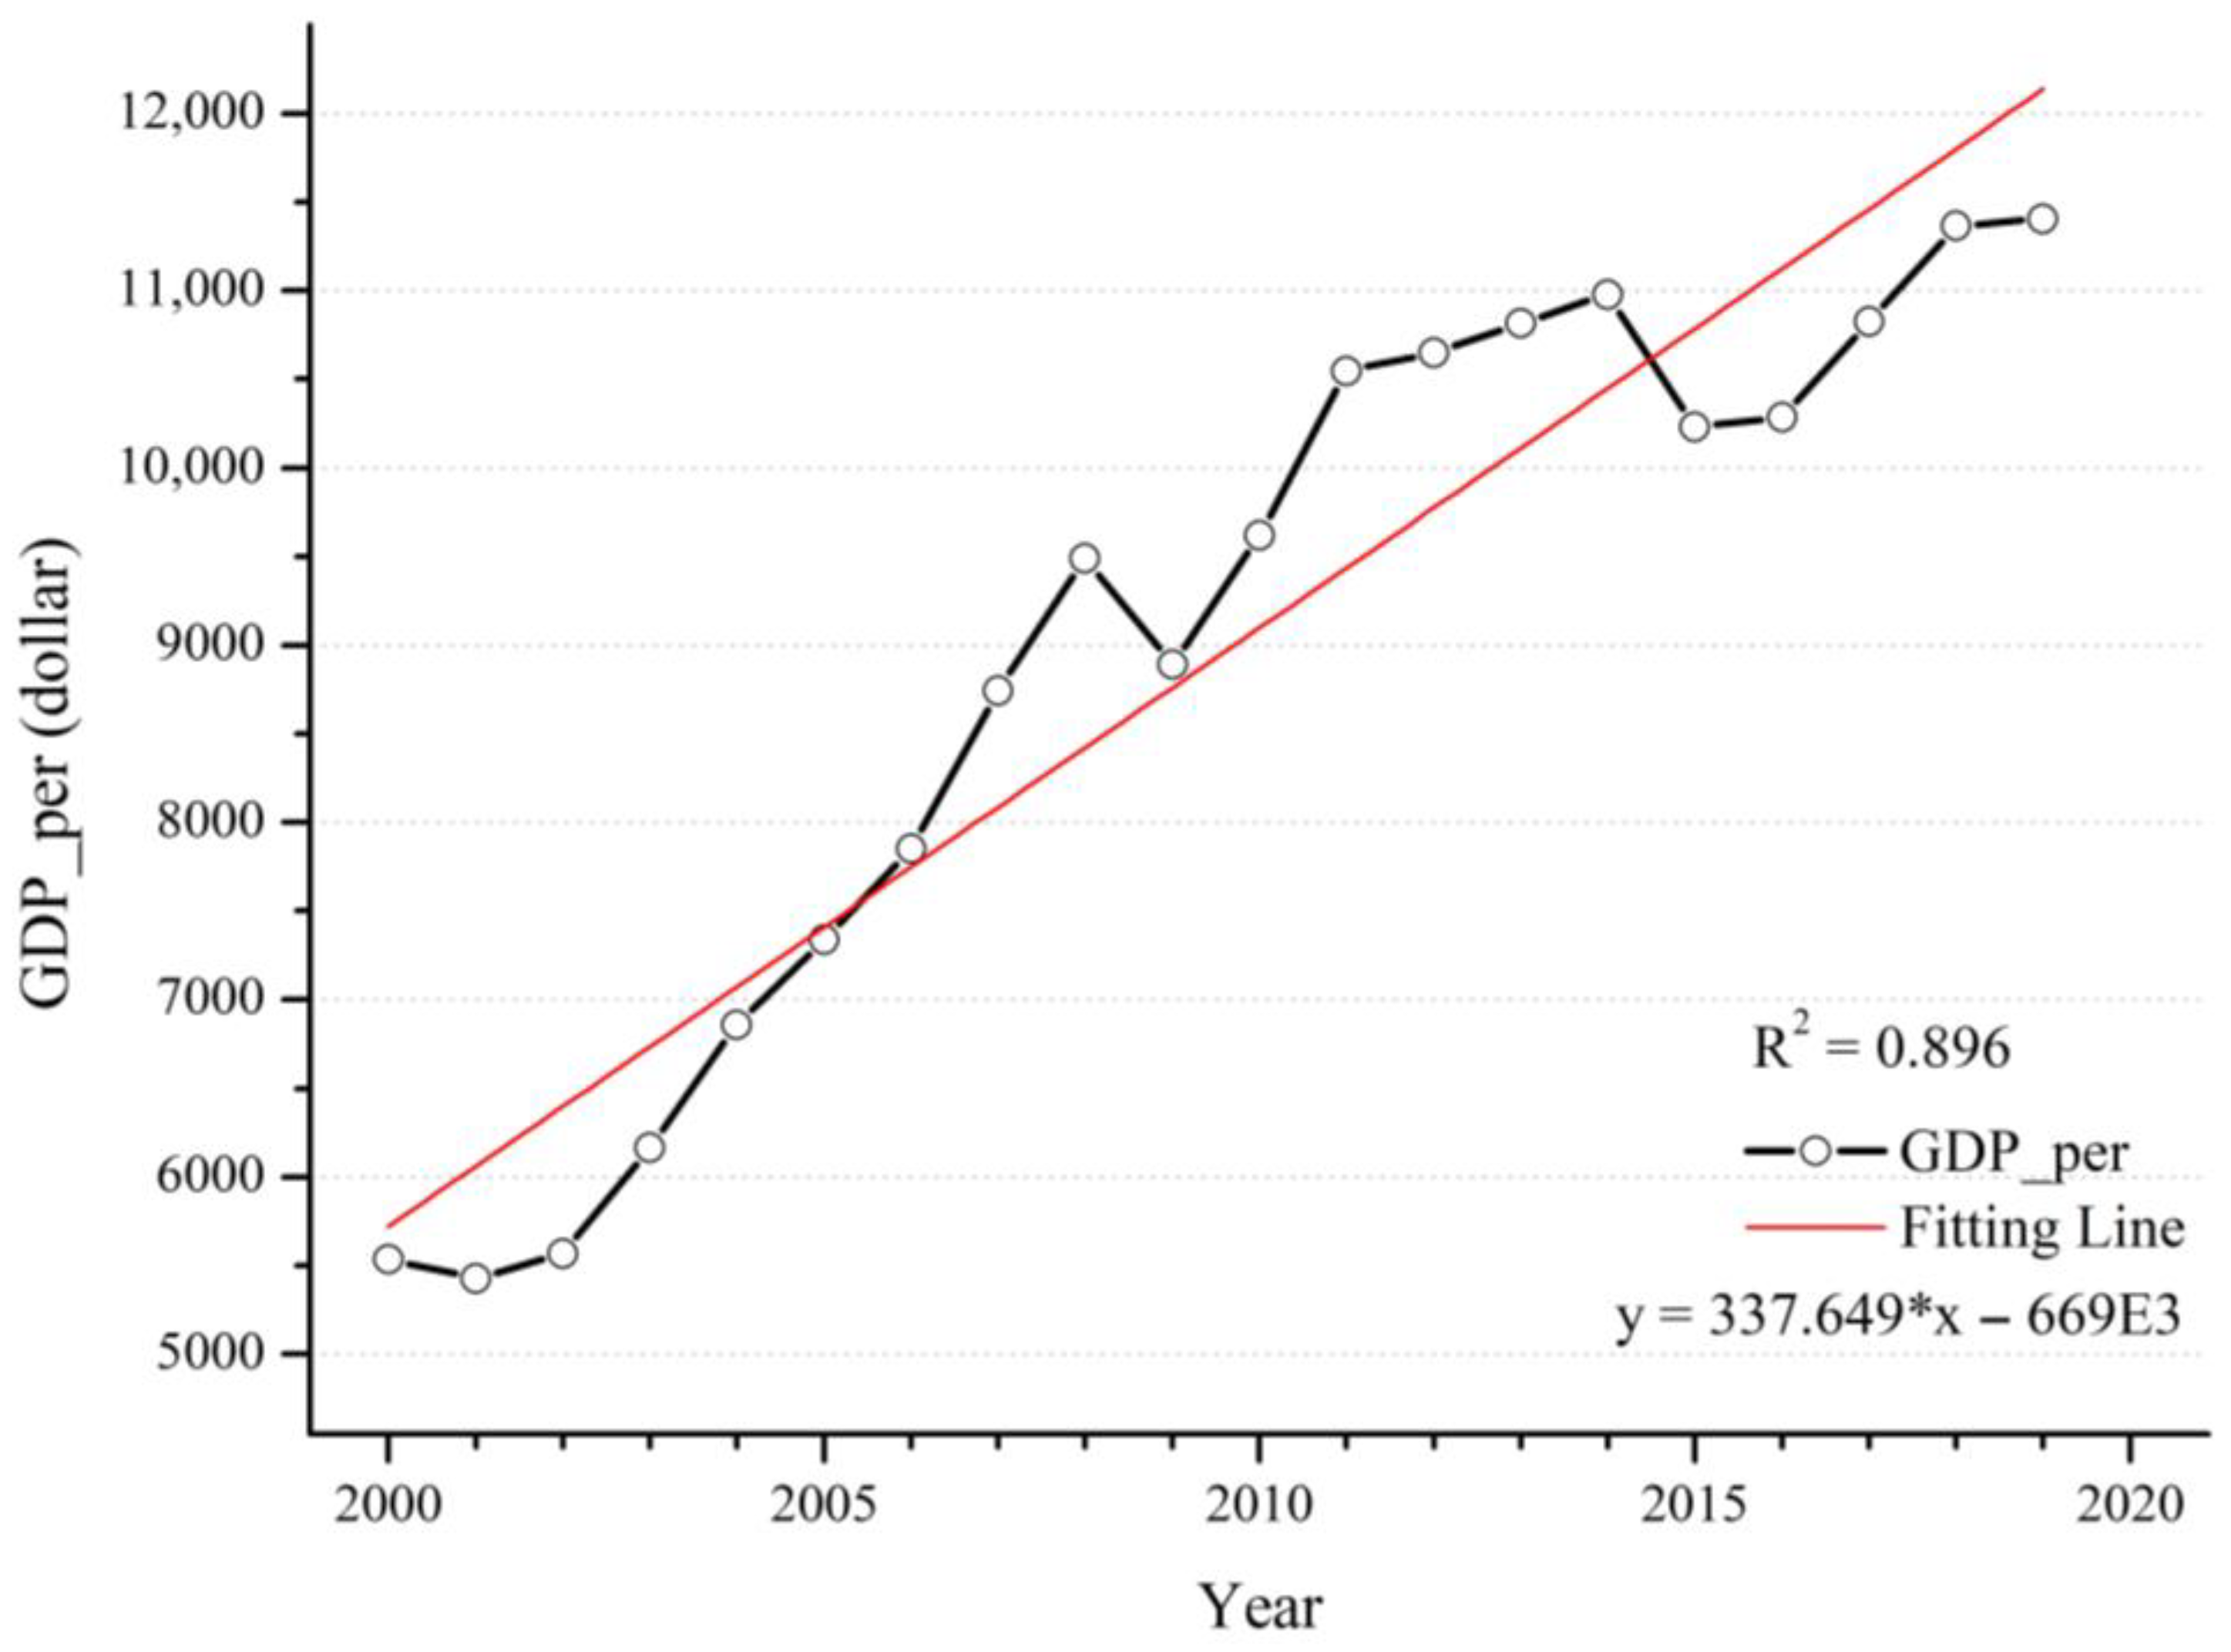
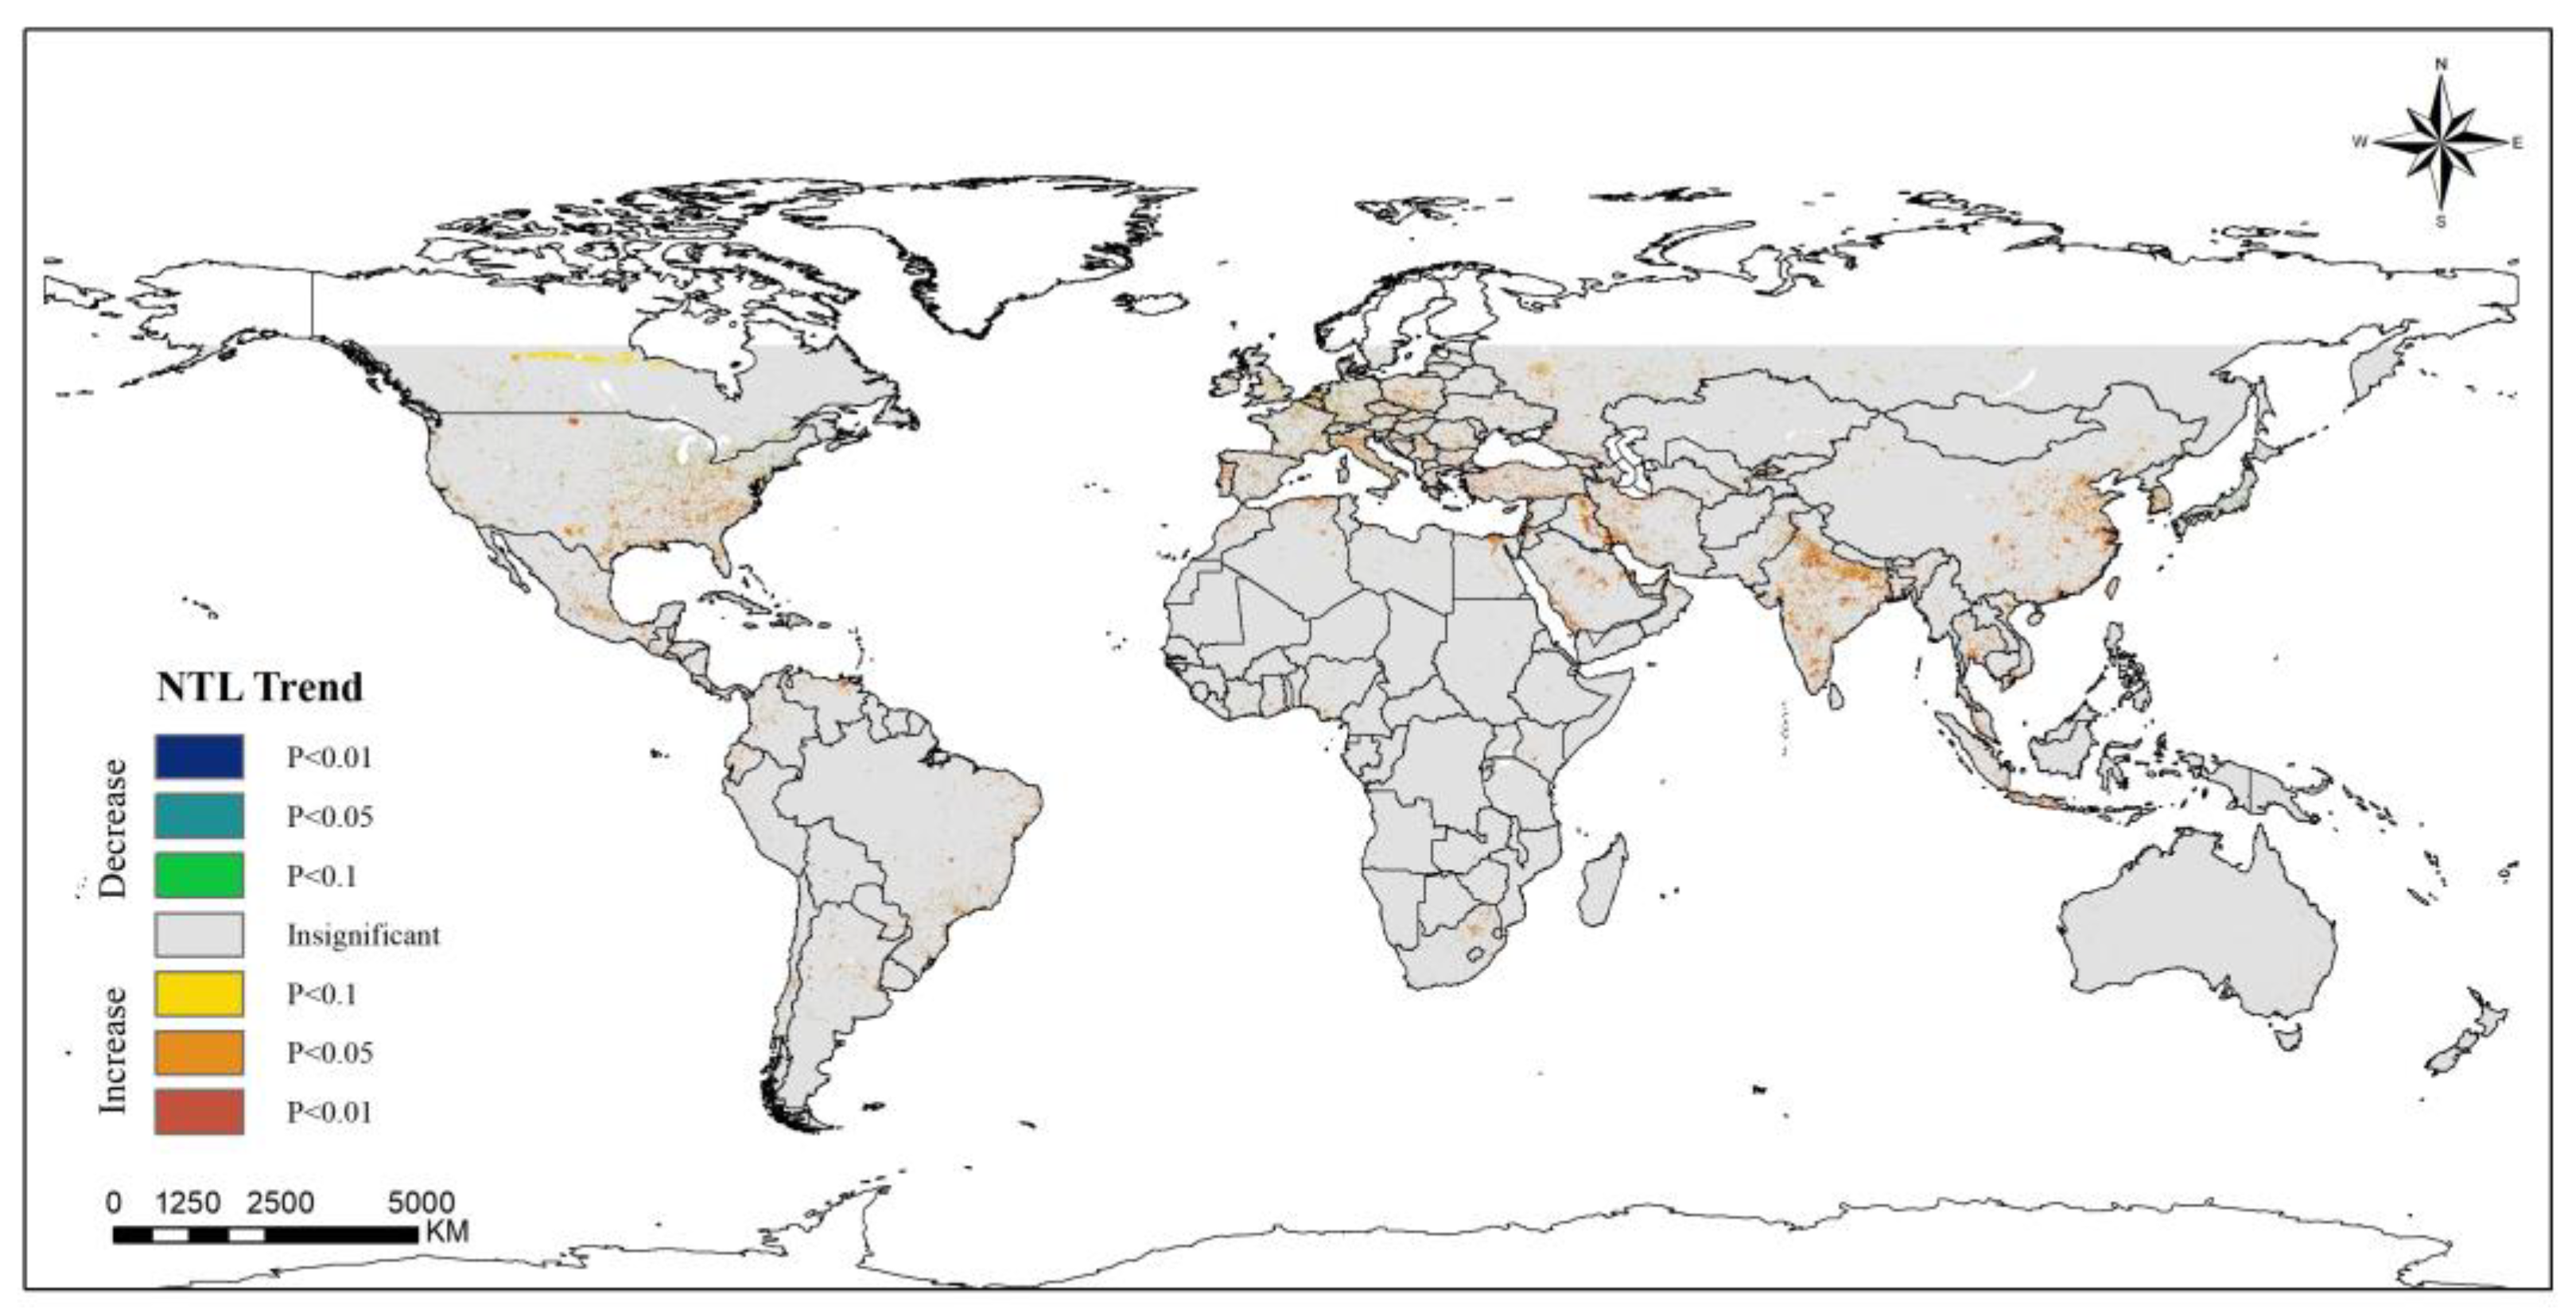
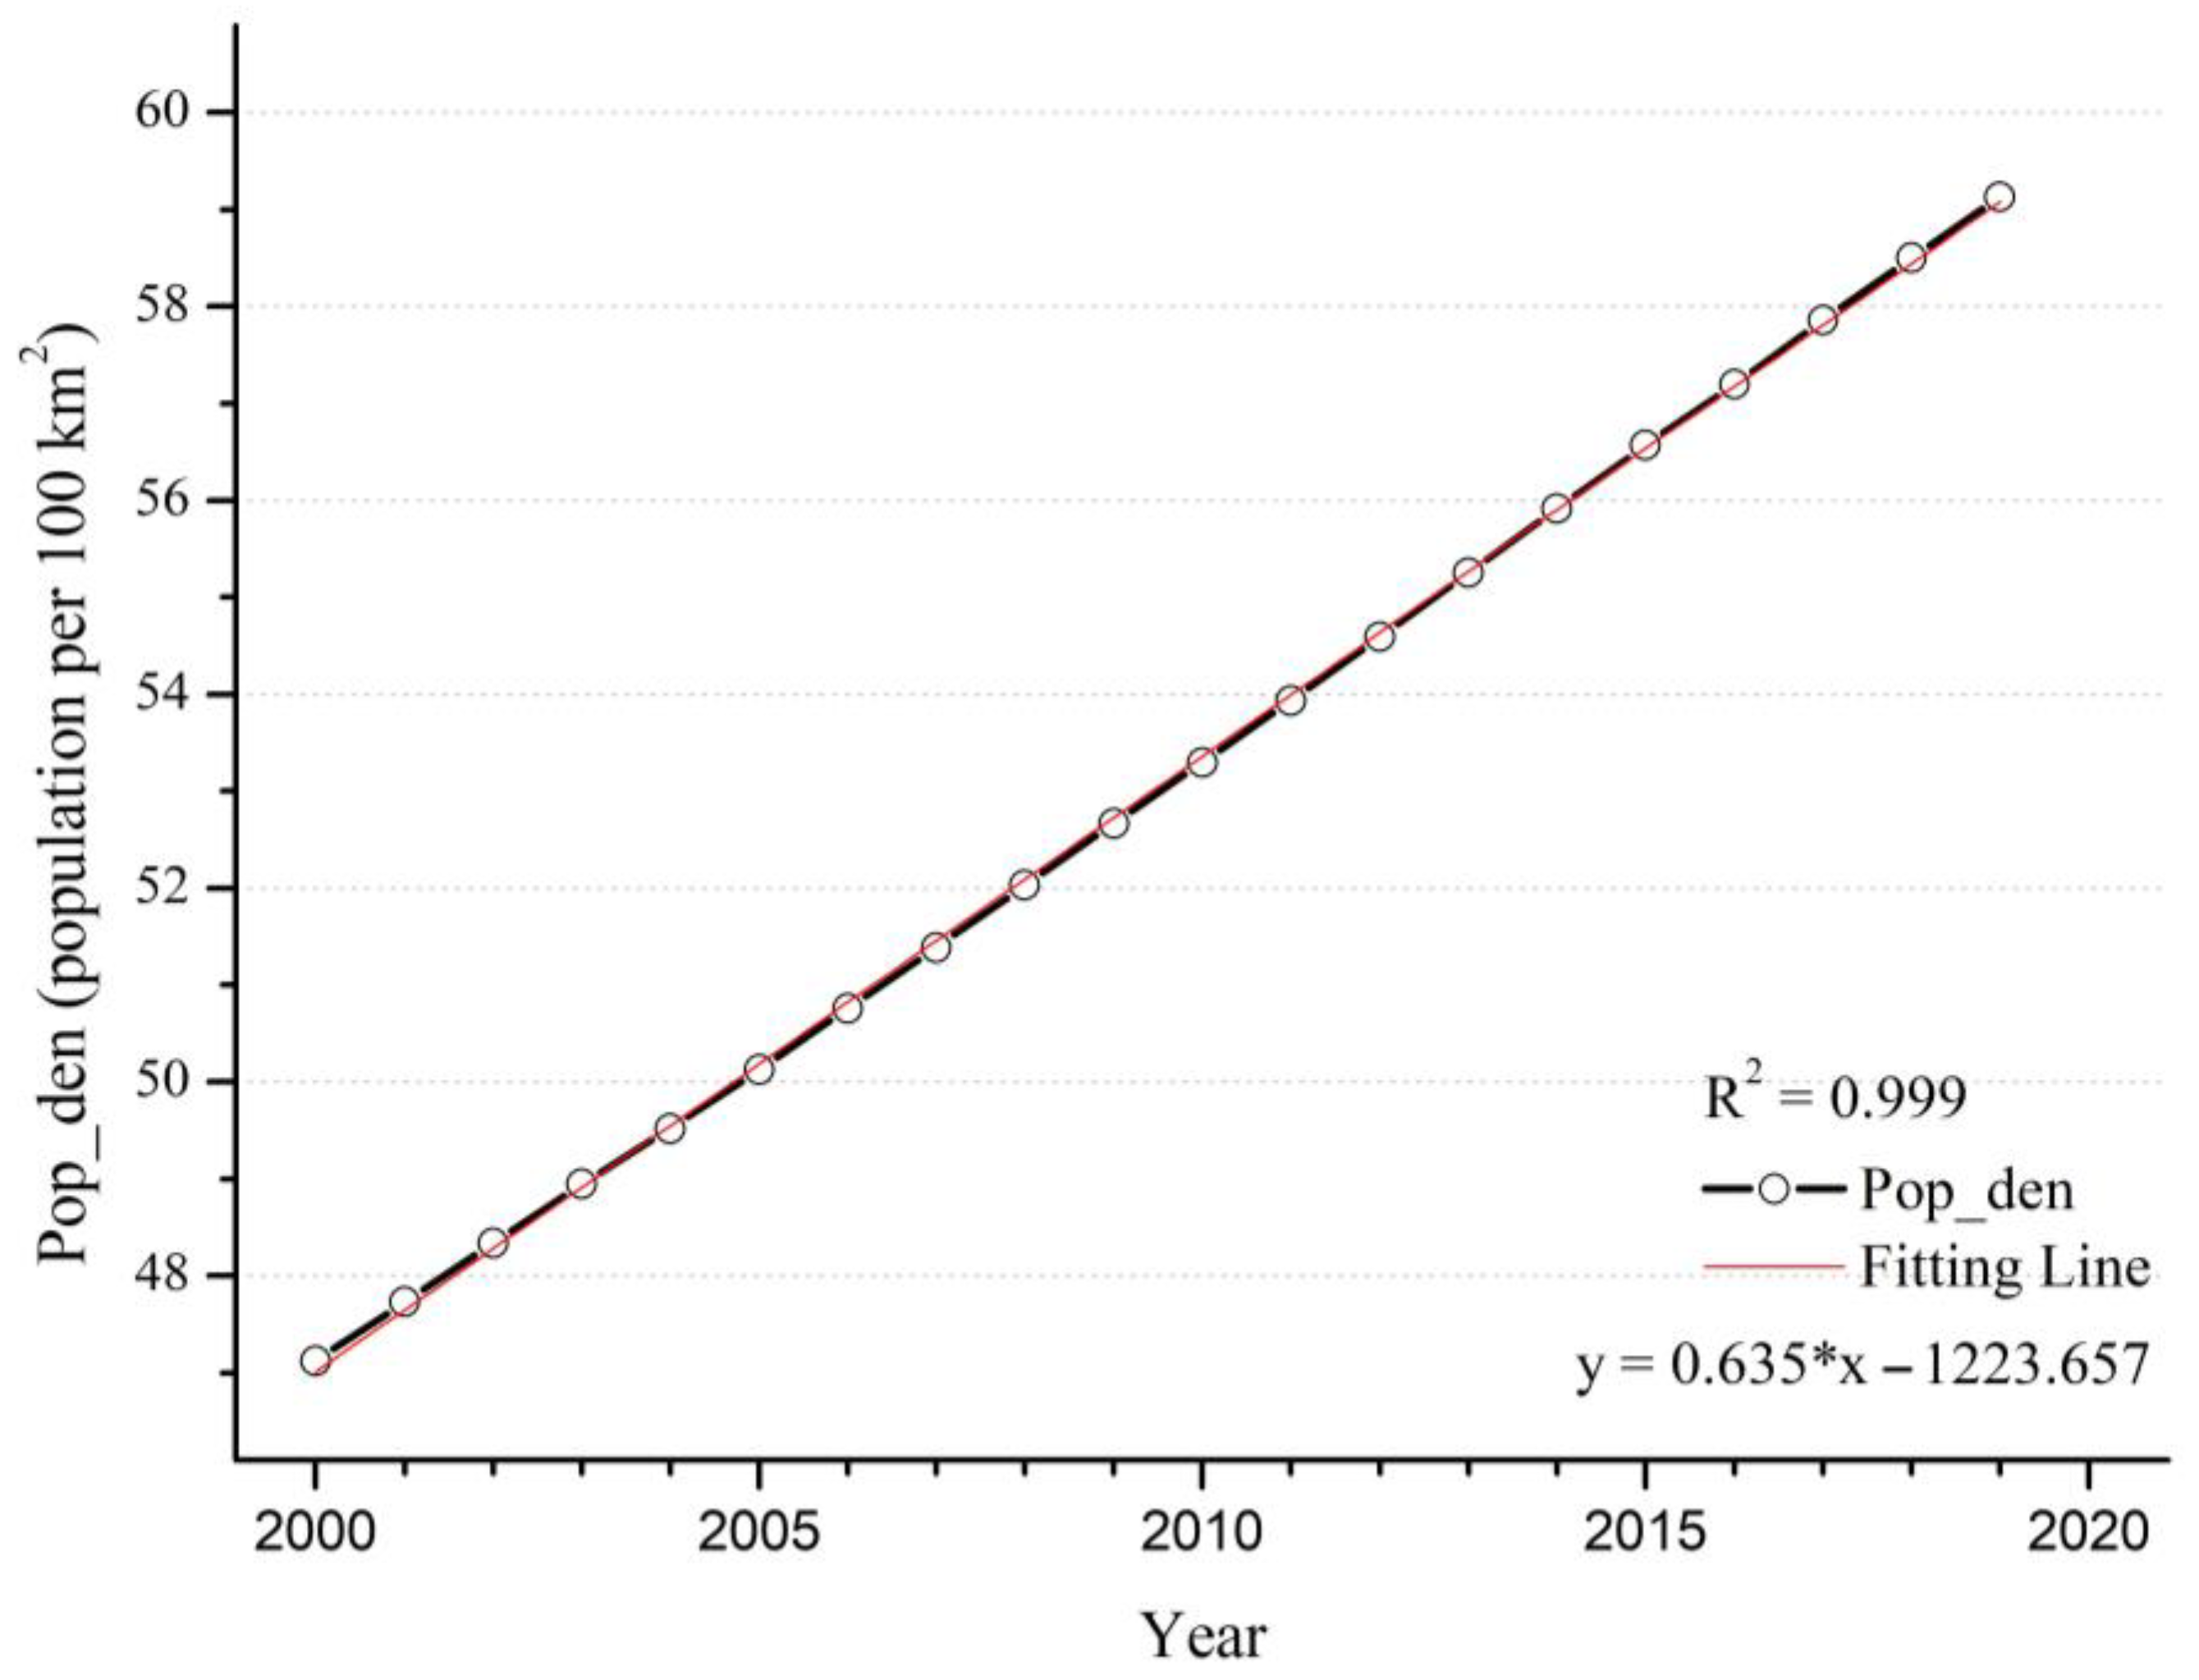
3.3. Spatial-Temporal Patterns of Socioeconomic Driving Factors
4. Discussion
4.1. Comparison with Traditional Linear Models
4.2. PM2.5 Concentrations Driving Factor Analysis
5. Conclusions and Limitation
Author Contributions
Funding
Institutional Review Board Statement
Informed Consent Statement
Data Availability Statement
Conflicts of Interest
Appendix A

| County | UR | PD | GDP_per | PM25 | TP | T2M | NDVI | BLH | WS | WD |
|---|---|---|---|---|---|---|---|---|---|---|
| AFG | 22.0780 | 31.8291 | 179.4266 | 33.8495 | 0.0006 | 285.5928 | 0.1100 | 602.1169 | 1.5467 | 241.9826 |
| ALB | 41.7410 | 112.7382 | 1126.6833 | 21.7811 | 0.0029 | 286.1560 | 0.4692 | 393.1855 | 4.2350 | 241.0956 |
| DZA | 59.9190 | 13.0334 | 1765.0271 | 32.1160 | 0.0001 | 296.3192 | 0.1169 | 759.3276 | 2.7035 | 145.9869 |
| AGO | 50.0870 | 13.1511 | 556.8362 | 20.2957 | 0.0029 | 295.0195 | 0.5204 | 629.8076 | 4.7150 | 85.6959 |
| ARG | 89.1420 | 13.4728 | 7708.0991 | 15.1521 | 0.0026 | 286.4868 | 0.3726 | 662.6028 | 4.1936 | 210.3534 |
| ARM | 64.6660 | 107.8187 | 622.7409 | 23.8468 | 0.0020 | 279.2242 | 0.3108 | 411.0739 | 2.5497 | 284.8812 |
| AUS | 84.2350 | 2.4931 | 21,697.7085 | 4.6080 | 0.0018 | 294.3353 | 0.3452 | 760.6279 | 1.6857 | 113.0352 |
| AUT | 60.2130 | 97.0158 | 24,625.6007 | 15.4217 | 0.0035 | 280.4046 | 0.5436 | 434.3101 | 4.4736 | 239.8334 |
| AZE | 51.3860 | 97.4348 | 655.1199 | 26.1463 | 0.0013 | 286.8007 | 0.2662 | 459.8327 | 2.7473 | 307.7411 |
| BGD | 23.5900 | 980.7011 | 418.0689 | 52.7968 | 0.0068 | 297.9745 | 0.4662 | 433.1246 | 4.2884 | 92.8961 |
| BLR | 69.9730 | 49.1994 | 1276.2880 | 16.7132 | 0.0020 | 281.0086 | 0.5070 | 570.2219 | 3.3204 | 232.1806 |
| BEL | 97.1290 | 338.5485 | 23,098.8865 | 13.3689 | 0.0029 | 283.8709 | 0.6302 | 606.3830 | 2.9343 | 251.8785 |
| BLZ | 45.3980 | 10.8422 | 3364.4917 | 18.3197 | 0.0038 | 297.7080 | 0.6944 | 530.6097 | 1.5121 | 240.5799 |
| BEN | 38.3330 | 60.8899 | 512.6739 | 48.8258 | 0.0028 | 300.5466 | 0.5026 | 646.1343 | 6.8092 | 75.5987 |
| BTN | 25.4180 | 14.8496 | 718.1963 | 20.8942 | 0.0085 | 279.4159 | 0.4793 | 281.6225 | 1.9581 | 99.0074 |
| BOL | 61.7870 | 7.7709 | 997.5818 | 25.1072 | 0.0039 | 292.7631 | 0.5652 | 562.5574 | 2.5150 | 158.8676 |
| BIH | 42.3840 | 73.2652 | 1484.1761 | 27.5371 | 0.0026 | 284.2731 | 0.5966 | 473.5262 | 4.7509 | 239.8284 |
| BWA | 53.2190 | 2.8997 | 3522.3108 | 17.8380 | 0.0019 | 294.1540 | 0.3554 | 720.8429 | 3.4470 | 98.1352 |
| BRA | 81.1920 | 20.9126 | 3749.9108 | 14.8498 | 0.0052 | 297.5663 | 0.6446 | 480.5716 | 1.4058 | 146.6187 |
| BRN | 71.1640 | 63.2194 | 18,012.5022 | 5.6315 | 0.0069 | 299.8415 | 0.6924 | 380.4360 | 0.8500 | 74.4657 |
| BGR | 68.8990 | 73.8513 | 1621.2430 | 26.0335 | 0.0013 | 284.9830 | 0.5071 | 506.0910 | 4.1326 | 246.6907 |
| BFA | 17.8440 | 42.4267 | 255.7187 | 40.7396 | 0.0016 | 301.4529 | 0.3537 | 682.2506 | 7.3906 | 75.8445 |
| BDI | 8.2460 | 248.3984 | 136.4640 | 31.9833 | 0.0038 | 293.5932 | 0.4995 | 586.9069 | 6.1900 | 87.9110 |
| KHM | 18.5860 | 68.8604 | 300.6137 | 17.3857 | 0.0056 | 300.1102 | 0.5829 | 495.5282 | 8.7732 | 70.0928 |
| CMR | 45.5420 | 32.8192 | 681.1020 | 46.4291 | 0.0050 | 297.1607 | 0.5602 | 492.6553 | 6.1173 | 88.5900 |
| CAN | 79.4780 | 3.4226 | 24,271.0021 | 3.6574 | 0.0016 | 267.0108 | 0.2358 | 401.5914 | 0.9749 | 217.8069 |
| CAF | 37.6390 | 5.8436 | 251.8328 | 32.3960 | 0.0036 | 298.4704 | 0.6555 | 560.6827 | 5.8547 | 86.8668 |
| TCD | 21.6370 | 6.6357 | 166.1757 | 50.6063 | 0.0007 | 299.4048 | 0.2114 | 681.5718 | 7.3860 | 75.8585 |
| CHL | 86.0730 | 20.6344 | 5100.2541 | 13.7580 | 0.0042 | 281.9560 | 0.3043 | 504.8170 | 6.2987 | 227.9254 |
| CHN | 35.8770 | 133.9719 | 959.3725 | 27.8467 | 0.0022 | 279.4784 | 0.2905 | 542.6256 | 1.5997 | 213.1305 |
| COL | 73.9570 | 35.7188 | 2520.4811 | 16.7692 | 0.0099 | 296.4643 | 0.6055 | 346.5086 | 0.5432 | 181.0906 |
| COM | 28.0800 | 291.4336 | 647.4258 | 10.6556 | 0.0024 | 298.1979 | 0.6449 | 585.0796 | 6.3745 | 91.0849 |
| COG | 58.6950 | 9.1579 | 1032.1376 | 34.2481 | 0.0045 | 297.2450 | 0.5938 | 392.7598 | 6.0708 | 88.7862 |
| COD | 35.1220 | 20.7785 | 405.2162 | 35.1962 | 0.0045 | 296.8253 | 0.6821 | 433.8509 | 5.9154 | 88.6850 |
| CRI | 59.0520 | 77.6022 | 3789.0539 | 14.9833 | 0.0089 | 295.8813 | 0.6398 | 415.7976 | 1.6097 | 238.0919 |
| CIV | 43.1550 | 51.7442 | 1007.4674 | 26.8967 | 0.0032 | 299.0755 | 0.5293 | 566.5360 | 6.2012 | 78.4459 |
| HRV | 53.4280 | 79.9195 | 4887.7137 | 20.0698 | 0.0026 | 285.7910 | 0.5890 | 474.9056 | 4.7876 | 239.8142 |
| CUB | 75.3230 | 103.5980 | 2747.1003 | 11.9491 | 0.0020 | 298.2920 | 0.6334 | 670.7790 | 0.4833 | 175.6806 |
| CYP | 68.6480 | 102.0874 | 14,388.3477 | 20.6622 | 0.0013 | 292.7031 | 0.3167 | 553.2762 | 1.1752 | 254.4217 |
| CZE | 73.9880 | 132.7173 | 6029.0382 | 19.3637 | 0.0022 | 282.3130 | 0.5611 | 547.9158 | 4.0450 | 238.6683 |
| DNK | 85.1000 | 125.8453 | 30,743.5477 | 2.2790 | 0.0010 | 253.7751 | −0.0335 | 199.3058 | 0.8690 | 172.3289 |
| DJI | 76.5320 | 30.9567 | 768.1836 | 35.7283 | 0.0007 | 301.5547 | 0.1125 | 802.4154 | 7.1028 | 64.7858 |
| DMA | 65.2650 | 92.8667 | 4787.8014 | 12.5750 | 0.0020 | 298.7954 | 0.7040 | 787.4301 | 0.7327 | 40.9683 |
| DOM | 61.7530 | 175.3533 | 2869.1781 | 11.5998 | 0.0023 | 296.8789 | 0.6506 | 546.2463 | 1.6014 | 84.6368 |
| ECU | 60.2990 | 51.0594 | 1445.2793 | 13.7362 | 0.0087 | 292.7888 | 0.4890 | 316.9937 | 0.4371 | 249.6579 |
| EGY | 42.7970 | 69.1462 | 1450.4762 | 40.9264 | 0.0000 | 295.3019 | 0.1124 | 611.8229 | 4.5002 | 87.9643 |
| SLV | 58.9120 | 284.1665 | 2001.5400 | 28.1796 | 0.0036 | 297.7833 | 0.6780 | 594.0580 | 1.4049 | 226.3673 |
| GNQ | 49.0920 | 21.6107 | 1725.5576 | 31.2369 | 0.0089 | 296.6764 | 0.4818 | 356.0040 | 6.1448 | 94.8720 |
| ERI | 26.5870 | 22.6972 | 308.1342 | 34.0939 | 0.0008 | 299.9710 | 0.1626 | 690.7507 | 8.1488 | 67.6865 |
| EST | 69.3680 | 32.9555 | 4070.6090 | 9.0725 | 0.0021 | 280.1713 | 0.4808 | 561.5966 | 0.8786 | 88.1589 |
| ETH | 14.7400 | 66.2248 | 124.4608 | 19.0285 | 0.0026 | 296.0029 | 0.3899 | 768.6521 | 5.6664 | 83.9350 |
| FJI | 47.9080 | 44.3903 | 2069.3175 | 6.3497 | 0.0071 | 297.6915 | 0.7419 | 487.4509 | 6.9668 | 126.4357 |
| FIN | 82.1830 | 16.9940 | 24,345.9148 | 5.7739 | 0.0020 | 276.7162 | 0.4203 | 537.4464 | 0.8106 | 96.9632 |
| FRA | 75.8710 | 111.2421 | 22,419.6948 | 12.5566 | 0.0029 | 284.7556 | 0.6148 | 547.0696 | 4.0811 | 255.9357 |
| GAB | 78.8790 | 4.7672 | 4135.9924 | 25.5043 | 0.0057 | 297.2041 | 0.4620 | 398.9363 | 6.0869 | 88.3177 |
| GEO | 52.6380 | 71.3309 | 749.9085 | 19.6521 | 0.0030 | 280.2393 | 0.4869 | 321.5960 | 2.7419 | 268.9658 |
| DEU | 74.9650 | 235.5968 | 23,694.7605 | 14.4042 | 0.0025 | 283.1206 | 0.6122 | 578.5321 | 3.0288 | 235.6645 |
| GHA | 43.9290 | 84.7273 | 258.4710 | 38.9228 | 0.0027 | 300.2450 | 0.4944 | 595.5582 | 6.3969 | 78.3945 |
| GRC | 72.7160 | 83.8309 | 12,072.9294 | 18.9479 | 0.0015 | 287.4909 | 0.4884 | 471.7066 | 3.4461 | 241.5302 |
| GTM | 45.3320 | 108.1538 | 1664.2990 | 29.2672 | 0.0049 | 295.3244 | 0.6869 | 458.7450 | 1.5379 | 222.1088 |
| GIN | 30.8690 | 33.5371 | 363.4823 | 31.1368 | 0.0048 | 298.8392 | 0.5809 | 554.7373 | 6.7179 | 76.1871 |
| GNB | 36.2430 | 42.7207 | 308.9103 | 39.1327 | 0.0033 | 300.8018 | 0.5674 | 510.8033 | 6.6601 | 78.3687 |
| GUY | 28.6940 | 3.7933 | 954.4003 | 13.7076 | 0.0055 | 297.9446 | 0.6759 | 472.8967 | 0.4275 | 149.9103 |
| HTI | 35.6000 | 307.1046 | 805.0256 | 12.3057 | 0.0019 | 298.0041 | 0.5760 | 515.2011 | 2.1137 | 88.6423 |
| HND | 45.4580 | 58.7587 | 1093.1081 | 25.1281 | 0.0040 | 295.9077 | 0.6654 | 511.7707 | 1.5186 | 245.6845 |
| HUN | 64.5750 | 113.9363 | 4624.2817 | 22.0857 | 0.0014 | 285.0736 | 0.4931 | 538.7070 | 4.7223 | 238.8301 |
| ISL | 92.4010 | 2.8050 | 32,096.3723 | 4.5094 | 0.0034 | 274.5433 | 0.1527 | 508.5296 | 0.5950 | 189.5988 |
| IND | 27.6670 | 355.3677 | 443.3142 | 34.9695 | 0.0032 | 296.5155 | 0.3923 | 581.7520 | 1.8893 | 162.2188 |
| IDN | 42.0020 | 116.7572 | 780.1902 | 10.8315 | 0.0092 | 297.9742 | 0.6675 | 325.5052 | 1.3315 | 95.2109 |
| IRN | 64.0420 | 40.2904 | 1670.0097 | 39.8337 | 0.0007 | 291.2217 | 0.1177 | 707.7281 | 4.2147 | 290.1329 |
| IRQ | 68.4960 | 53.7247 | 2058.2644 | 47.3930 | 0.0005 | 295.9818 | 0.1214 | 714.0609 | 1.9945 | 204.3714 |
| IRL | 59.1550 | 55.2355 | 26,334.5672 | 8.8693 | 0.0034 | 282.8344 | 0.6870 | 720.5282 | 1.8207 | 318.4994 |
| ISR | 91.2030 | 290.6192 | 21,061.4823 | 23.1614 | 0.0008 | 292.8159 | 0.2026 | 507.2279 | 1.1623 | 67.9278 |
| ITA | 67.2220 | 193.6082 | 20,137.5912 | 18.0839 | 0.0029 | 285.9755 | 0.5266 | 414.2281 | 4.5311 | 242.0215 |
| JAM | 51.8140 | 245.1245 | 3392.1239 | 16.2660 | 0.0028 | 298.2675 | 0.7028 | 528.4640 | 0.4771 | 124.8375 |
| JPN | 78.6490 | 347.9918 | 39,169.3596 | 12.5862 | 0.0047 | 284.6239 | 0.5852 | 518.8859 | 2.7491 | 230.1247 |
| JOR | 78.2700 | 58.0518 | 1651.6218 | 26.7614 | 0.0002 | 292.2210 | 0.1132 | 660.0089 | 1.2624 | 66.0555 |
| KAZ | 56.0980 | 5.5131 | 1229.0012 | 15.1920 | 0.0010 | 280.1412 | 0.1870 | 564.2142 | 1.0764 | 250.5042 |
| KEN | 19.8920 | 56.1629 | 397.4827 | 16.3608 | 0.0013 | 298.2487 | 0.3205 | 939.0473 | 5.7940 | 101.6190 |
| KWT | 99.0000 | 114.7656 | 18,440.3785 | 52.6699 | 0.0003 | 299.0618 | 0.0839 | 677.1914 | 3.4631 | 26.9840 |
| KGZ | 35.2980 | 25.5391 | 279.6196 | 23.1515 | 0.0027 | 274.2499 | 0.1863 | 292.7439 | 1.6498 | 250.5258 |
| LAO | 21.9770 | 23.0663 | 325.1869 | 22.9004 | 0.0056 | 295.7368 | 0.6422 | 402.0839 | 5.1345 | 74.4398 |
| LVA | 68.0670 | 38.0660 | 3361.6409 | 14.9601 | 0.0019 | 280.6965 | 0.5192 | 580.0885 | 0.8342 | 179.7964 |
| LBN | 86.0000 | 375.6377 | 4491.6419 | 27.0500 | 0.0018 | 290.4683 | 0.3016 | 454.8156 | 0.5243 | 268.4361 |
| LSO | 19.5480 | 66.9567 | 436.4881 | 23.6788 | 0.0034 | 284.1797 | 0.3842 | 529.9560 | 0.9590 | 106.4457 |
| LBR | 44.3310 | 29.5727 | 306.8339 | 19.7021 | 0.0058 | 297.7780 | 0.5444 | 423.0724 | 5.6095 | 80.5398 |
| LBY | 76.3870 | 3.0451 | 7142.7718 | 34.1456 | 0.0001 | 294.7351 | 0.1071 | 613.1045 | 3.7460 | 107.4708 |
| LTU | 66.9860 | 55.8318 | 3293.2300 | 15.8328 | 0.0020 | 281.2286 | 0.5123 | 590.3737 | 1.7673 | 220.0129 |
| LUX | 84.2160 | 179.5473 | 48,659.5989 | 12.5844 | 0.0031 | 282.4963 | 0.6448 | 563.4920 | 3.4993 | 247.1581 |
| MKD | 58.5480 | 79.6834 | 1861.8981 | 30.2412 | 0.0014 | 284.0713 | 0.4836 | 494.2013 | 4.2231 | 243.0377 |
| MDG | 27.1210 | 27.1122 | 293.6072 | 9.9970 | 0.0039 | 295.6260 | 0.4926 | 612.3831 | 4.4417 | 85.8211 |
| MWI | 14.6100 | 118.2515 | 156.3858 | 16.3842 | 0.0040 | 294.5150 | 0.4333 | 576.2796 | 5.3808 | 86.4732 |
| MYS | 61.9770 | 70.5958 | 4043.6629 | 10.6796 | 0.0080 | 298.5966 | 0.7057 | 329.2694 | 1.1416 | 164.3602 |
| MLI | 28.3560 | 8.9711 | 270.5430 | 42.4320 | 0.0006 | 301.5000 | 0.1922 | 740.7580 | 6.2072 | 84.1524 |
| MLT | 92.3680 | 1219.0219 | 10,432.3281 | 13.7500 | 0.0010 | 292.3575 | 0.2484 | 612.6875 | 3.1328 | 228.2837 |
| MRT | 38.0910 | 2.5519 | 676.5690 | 52.1978 | 0.0002 | 300.4292 | 0.1116 | 674.1965 | 4.9332 | 86.6109 |
| MUS | 42.6700 | 584.6665 | 3929.0755 | 14.5286 | 0.0019 | 296.7129 | 0.6466 | 850.4476 | 4.5999 | 89.5251 |
| MEX | 74.7220 | 50.8757 | 7157.8145 | 13.9014 | 0.0020 | 293.8660 | 0.4250 | 641.3558 | 1.1471 | 247.7002 |
| MDA | 44.5890 | 101.8137 | 440.6720 | 18.1592 | 0.0015 | 284.0422 | 0.4543 | 586.3882 | 4.4783 | 245.3239 |
| MNG | 57.1330 | 1.5432 | 474.2171 | 14.7267 | 0.0007 | 273.8502 | 0.1689 | 588.8943 | 1.0681 | 270.4900 |
| MAR | 53.3350 | 64.5164 | 1334.9435 | 21.9904 | 0.0007 | 291.2152 | 0.1744 | 628.4530 | 1.6099 | 227.1025 |
| MOZ | 29.0980 | 22.5234 | 319.3596 | 16.5914 | 0.0033 | 296.3921 | 0.5950 | 632.4653 | 4.5914 | 89.7289 |
| MMR | 27.0250 | 71.4871 | 146.6046 | 24.3684 | 0.0067 | 296.0873 | 0.5785 | 391.8436 | 4.1761 | 74.0680 |
| NAM | 32.3730 | 2.1798 | 2185.6041 | 13.1942 | 0.0009 | 294.0247 | 0.2344 | 731.0292 | 3.3325 | 96.6204 |
| NPL | 13.3970 | 167.0115 | 229.4904 | 32.7714 | 0.0058 | 284.5282 | 0.4414 | 326.2043 | 2.6105 | 129.7383 |
| NLD | 76.7950 | 471.7273 | 26,214.4986 | 14.8299 | 0.0027 | 283.9303 | 0.6037 | 632.3657 | 2.1224 | 245.3230 |
| NZL | 86.0210 | 14.6508 | 13,641.1027 | 6.8349 | 0.0048 | 283.4144 | 0.6530 | 556.9278 | 5.1602 | 283.4279 |
| NIC | 55.1850 | 42.1249 | 1007.4998 | 16.0619 | 0.0039 | 297.8682 | 0.5990 | 649.7882 | 1.5067 | 242.0101 |
| NER | 16.1860 | 8.9457 | 197.8327 | 60.7594 | 0.0002 | 299.8333 | 0.1248 | 692.1315 | 7.1578 | 81.7072 |
| NGA | 34.8400 | 134.2643 | 567.9307 | 68.0144 | 0.0027 | 299.8735 | 0.4332 | 610.3793 | 6.8835 | 76.9425 |
| PRK | 59.4120 | 190.4250 | 462.0000 | 23.1494 | 0.0029 | 279.5835 | 0.4881 | 438.4716 | 3.0490 | 244.1590 |
| NOR | 76.0200 | 12.2958 | 38,131.4606 | 6.6647 | 0.0038 | 276.1095 | 0.3001 | 455.3105 | 2.3991 | 69.1475 |
| OMN | 71.5690 | 7.3279 | 8601.2719 | 63.8336 | 0.0000 | 301.0708 | 0.0980 | 611.3024 | 5.8749 | 39.3910 |
| PAK | 32.9820 | 184.6508 | 576.1956 | 49.0836 | 0.0008 | 293.1199 | 0.1628 | 590.8792 | 2.2058 | 267.5996 |
| PAN | 62.1980 | 40.7632 | 4060.3178 | 13.6348 | 0.0089 | 297.2569 | 0.5840 | 394.5247 | 0.7364 | 244.9138 |
| PNG | 13.2040 | 12.9126 | 602.1865 | 9.0796 | 0.0106 | 296.5839 | 0.6776 | 327.0453 | 5.1675 | 112.5378 |
| PRY | 55.3310 | 13.3984 | 1663.6049 | 17.9527 | 0.0040 | 296.6231 | 0.6604 | 635.5005 | 2.0899 | 119.2261 |
| PER | 73.0420 | 20.6718 | 1955.5880 | 24.1718 | 0.0059 | 291.4839 | 0.5188 | 357.6134 | 2.4140 | 153.8799 |
| PHL | 46.1350 | 261.5681 | 1072.8018 | 18.4934 | 0.0086 | 298.6937 | 0.6469 | 412.0124 | 6.9327 | 75.0888 |
| POL | 61.7160 | 124.9098 | 4501.4541 | 22.6760 | 0.0020 | 282.7454 | 0.5454 | 562.3428 | 3.1817 | 233.2714 |
| PRT | 54.3990 | 112.4579 | 11,526.3721 | 10.2574 | 0.0028 | 288.0355 | 0.4980 | 543.3709 | 3.9791 | 269.3716 |
| PRI | 94.3870 | 429.6060 | 16,192.1270 | 7.6076 | 0.0023 | 298.2824 | 0.6881 | 670.5095 | 3.6219 | 72.3817 |
| QAT | 96.3110 | 51.0307 | 29,976.1676 | 80.0247 | 0.0002 | 300.3638 | 0.0733 | 469.5788 | 4.9598 | 39.7064 |
| ROU | 53.0040 | 97.7013 | 1659.9076 | 19.8515 | 0.0017 | 283.4783 | 0.5147 | 470.6392 | 4.5113 | 243.7243 |
| RUS | 73.3500 | 8.9490 | 1771.5941 | 8.7891 | 0.0015 | 267.7990 | 0.3076 | 416.1997 | 1.8080 | 223.8098 |
| RWA | 14.9260 | 321.5925 | 260.6077 | 34.7283 | 0.0039 | 291.8890 | 0.5219 | 571.9293 | 6.1396 | 89.7848 |
| SAU | 79.8480 | 9.6125 | 9171.3315 | 56.2450 | 0.0001 | 298.8600 | 0.0978 | 757.0784 | 5.4815 | 57.9364 |
| SEN | 40.3200 | 50.8894 | 613.7324 | 49.8031 | 0.0014 | 301.5726 | 0.3611 | 579.2657 | 6.4565 | 81.4271 |
| SCG | 55.6565 | 65.4590 | 1270.9292 | 22.7359 | 0.0016 | 284.7935 | 0.5190 | 522.1836 | 4.5595 | 241.4637 |
| SLE | 35.6260 | 63.5158 | 138.6987 | 26.1347 | 0.0070 | 298.6507 | 0.6086 | 463.2504 | 6.1708 | 75.8043 |
| SGP | 100.0000 | 6011.7716 | 23,852.3270 | 16.5333 | 0.0075 | 299.7349 | 0.3583 | 396.5966 | 0.0295 | 310.9979 |
| SVK | 56.2330 | 112.0316 | 5426.6243 | 22.8983 | 0.0023 | 282.2880 | 0.5555 | 488.4059 | 4.5387 | 238.1577 |
| SVN | 50.7540 | 98.7550 | 10,201.3035 | 19.5636 | 0.0036 | 283.2516 | 0.6602 | 407.7590 | 4.6899 | 240.2064 |
| SLB | 15.8130 | 14.7433 | 1017.3997 | 6.6717 | 0.0099 | 298.9251 | 0.7601 | 427.6718 | 7.3600 | 113.8153 |
| SOM | 33.2470 | 14.1426 | 138.0000 | 24.1472 | 0.0007 | 299.4842 | 0.2422 | 950.0417 | 5.2746 | 93.1439 |
| ZAF | 56.8910 | 37.0687 | 3374.7184 | 15.8417 | 0.0020 | 290.3620 | 0.3521 | 634.4547 | 1.4766 | 122.9264 |
| KOR | 79.6210 | 487.3327 | 12,256.9936 | 21.5060 | 0.0034 | 285.0842 | 0.5530 | 506.4678 | 3.5008 | 235.0233 |
| ESP | 76.2620 | 81.2983 | 14,749.6874 | 11.6369 | 0.0019 | 287.0505 | 0.4220 | 587.5106 | 4.1237 | 261.1680 |
| LKA | 18.3800 | 299.4356 | 869.6963 | 19.0157 | 0.0048 | 299.2747 | 0.6486 | 604.7394 | 1.5733 | 117.1275 |
| SDN | 32.4950 | 10.9920 | 366.1727 | 34.7812 | 0.0011 | 299.9408 | 0.2570 | 705.5234 | 7.3465 | 75.2464 |
| SUR | 66.4440 | 3.0189 | 2012.2817 | 12.6231 | 0.0052 | 298.5469 | 0.7257 | 517.6283 | 0.5135 | 112.1216 |
| SWE | 84.0260 | 21.6214 | 29,624.9127 | 6.2024 | 0.0026 | 277.2268 | 0.4447 | 532.5994 | 1.3699 | 89.5126 |
| CHE | 73.3830 | 181.7693 | 38,952.0342 | 14.2803 | 0.0047 | 279.5672 | 0.4802 | 348.6885 | 4.4889 | 244.4236 |
| SYR | 51.9470 | 89.2962 | 4910.7777 | 35.0439 | 0.0007 | 291.8141 | 0.1419 | 648.5038 | 1.2378 | 276.7992 |
| TJK | 26.5010 | 44.4150 | 138.4291 | 20.6490 | 0.0018 | 272.7145 | 0.1199 | 333.8860 | 0.9743 | 236.1803 |
| TZA | 22.3090 | 37.8180 | 410.9524 | 16.9708 | 0.0027 | 295.6497 | 0.4592 | 712.6197 | 6.0892 | 89.5988 |
| THA | 31.3860 | 123.2215 | 2007.7353 | 21.6337 | 0.0053 | 298.9750 | 0.5636 | 454.1186 | 5.9974 | 98.3362 |
| BHS | 82.0070 | 29.7747 | 27,098.1563 | 8.9429 | 0.0019 | 297.8790 | 0.4217 | 753.1452 | 1.1274 | 177.7540 |
| GMB | 47.8680 | 130.2083 | 594.1494 | 47.3966 | 0.0020 | 300.6097 | 0.4439 | 492.6517 | 6.5275 | 80.7165 |
| TLS | 24.2630 | 59.4732 | 415.0859 | 11.1325 | 0.0052 | 297.6300 | 0.6283 | 418.8668 | 0.5893 | 65.4982 |
| TGO | 32.9070 | 90.5388 | 302.9586 | 45.5305 | 0.0033 | 299.9210 | 0.5112 | 575.6099 | 6.5277 | 76.7960 |
| TTO | 23.0120 | 247.0096 | 6435.1342 | 16.1513 | 0.0037 | 298.9956 | 0.7225 | 656.3816 | 0.9006 | 95.0152 |
| TUN | 63.4320 | 62.4894 | 2211.8350 | 26.7292 | 0.0004 | 293.3065 | 0.1652 | 567.7196 | 2.4768 | 214.9042 |
| TUR | 64.7410 | 82.1696 | 4337.4780 | 27.5412 | 0.0018 | 284.2063 | 0.3164 | 508.6591 | 2.6696 | 262.8761 |
| TKM | 45.9130 | 9.6102 | 643.1754 | 38.3680 | 0.0004 | 289.8442 | 0.1026 | 592.8558 | 1.6951 | 261.2224 |
| UGA | 14.7860 | 118.3632 | 261.8691 | 26.2175 | 0.0037 | 296.1132 | 0.5103 | 571.3354 | 5.8946 | 100.5396 |
| UKR | 67.1450 | 84.8822 | 658.3486 | 18.6947 | 0.0018 | 282.4762 | 0.4637 | 554.5069 | 4.1270 | 244.4423 |
| ARE | 80.2360 | 44.1294 | 33,291.3663 | 63.9781 | 0.0000 | 300.9181 | 0.0994 | 538.2136 | 5.1435 | 33.8981 |
| GBR | 78.6510 | 243.4279 | 28,223.0676 | 10.5769 | 0.0034 | 282.5327 | 0.6028 | 660.2248 | 2.0750 | 228.4969 |
| USA | 79.0570 | 30.7973 | 36,329.9561 | 8.1234 | 0.0021 | 280.6254 | 0.3747 | 549.6992 | 1.0730 | 182.9310 |
| URY | 92.0280 | 18.9677 | 6875.0255 | 10.8090 | 0.0041 | 290.4875 | 0.6370 | 577.5936 | 0.6709 | 158.1804 |
| UZB | 46.1260 | 57.9464 | 558.2268 | 32.6027 | 0.0005 | 286.6472 | 0.1388 | 587.7854 | 0.9237 | 239.2938 |
| VUT | 21.6730 | 15.1734 | 1470.6359 | 7.8214 | 0.0083 | 298.2466 | 0.7490 | 565.9593 | 6.9639 | 109.6799 |
| VEN | 87.5590 | 27.4275 | 4842.0366 | 16.6986 | 0.0059 | 297.9843 | 0.6371 | 492.0027 | 0.6772 | 209.1847 |
| VNM | 24.3740 | 256.8971 | 390.0933 | 21.7131 | 0.0057 | 296.5575 | 0.5708 | 424.6761 | 5.5972 | 88.0971 |
| YEM | 26.2670 | 32.9736 | 554.4487 | 49.7422 | 0.0004 | 298.8508 | 0.1278 | 744.9897 | 7.6840 | 61.2422 |
| ZMB | 34.8020 | 14.0114 | 345.6896 | 19.4540 | 0.0033 | 294.8242 | 0.5256 | 722.4590 | 4.9860 | 87.8069 |
| ZWE | 33.7580 | 30.7134 | 563.0575 | 15.4038 | 0.0030 | 293.8599 | 0.4818 | 663.2904 | 3.9495 | 92.1134 |
| County | UR | PD | GDP_per | PM25 | TP | T2M | NDVI | BLH | WS | WD |
|---|---|---|---|---|---|---|---|---|---|---|
| AFG | 23.7370 | 44.7041 | 543.3065 | 40.7204 | 0.0009 | 286.4250 | 0.1258 | 582.9946 | 1.5712 | 238.5367 |
| ALB | 59.7830 | 18.7345 | 3497.9745 | 20.5700 | 0.0056 | 286.2711 | 0.4979 | 411.7556 | 4.2603 | 261.3849 |
| DZA | 52.1630 | 106.3146 | 4094.3484 | 37.7796 | 0.0002 | 297.8995 | 0.1255 | 782.0035 | 2.4855 | 135.5287 |
| AGO | 84.0870 | 120.3886 | 33,893.2773 | 27.3842 | 0.0033 | 295.5125 | 0.5584 | 606.2822 | 4.8289 | 86.5153 |
| ARG | 90.8490 | 14.9043 | 10,385.9644 | 16.5901 | 0.0019 | 287.1481 | 0.3549 | 704.5626 | 4.1713 | 196.0700 |
| ARM | 63.4400 | 101.0648 | 3218.3783 | 29.5612 | 0.0026 | 281.4223 | 0.3561 | 382.7114 | 3.7551 | 279.0243 |
| AUS | 85.1820 | 2.8679 | 52,087.9723 | 5.4536 | 0.0017 | 294.7844 | 0.3313 | 773.0299 | 1.6386 | 101.3626 |
| AUT | 57.3990 | 101.2874 | 46,903.7616 | 15.5127 | 0.0036 | 279.2503 | 0.4544 | 423.9552 | 3.7114 | 270.2746 |
| AZE | 53.4060 | 109.5423 | 5843.5338 | 29.3589 | 0.0013 | 288.2518 | 0.2954 | 409.4935 | 3.4296 | 293.1673 |
| BGD | 10.6420 | 337.8351 | 234.2355 | 65.4100 | 0.0063 | 298.9940 | 0.4803 | 452.3087 | 3.5927 | 85.0009 |
| BLR | 97.6510 | 359.8278 | 44,184.9464 | 18.9133 | 0.0022 | 280.0730 | 0.4540 | 504.5311 | 2.7671 | 265.3468 |
| BEL | 43.0930 | 81.5826 | 1036.5345 | 15.9062 | 0.0025 | 282.2197 | 0.5250 | 550.7787 | 2.0266 | 278.5898 |
| BLZ | 24.6330 | 57.0366 | 647.8361 | 16.4686 | 0.0039 | 298.7081 | 0.7285 | 567.6204 | 1.6053 | 230.9991 |
| BEN | 30.4620 | 1133.7131 | 781.1536 | 36.8136 | 0.0030 | 301.2797 | 0.5018 | 622.5555 | 7.4702 | 72.5202 |
| BTN | 72.3020 | 68.1245 | 6853.0029 | 21.1219 | 0.0099 | 280.5868 | 0.5184 | 270.8777 | 1.6595 | 89.9351 |
| BOL | 82.4270 | 35.4581 | 28,443.8885 | 34.8114 | 0.0035 | 293.7833 | 0.5590 | 606.6375 | 3.1015 | 162.1895 |
| BIH | 45.5580 | 72.3726 | 4635.5102 | 30.3548 | 0.0043 | 283.3393 | 0.5302 | 428.5856 | 4.4372 | 266.4097 |
| BWA | 74.6720 | 46.7414 | 6033.6862 | 23.4656 | 0.0015 | 295.2420 | 0.3574 | 725.7447 | 5.1183 | 99.7233 |
| BRA | 45.2280 | 14.1370 | 4304.1111 | 19.1522 | 0.0046 | 298.4231 | 0.6565 | 527.3657 | 1.5089 | 132.6561 |
| BRN | 66.4300 | 9.2759 | 1955.4602 | 8.5111 | 0.0086 | 300.1388 | 0.7268 | 350.6426 | 0.5654 | 87.0220 |
| BGR | 84.3350 | 23.4159 | 11,286.0715 | 23.9984 | 0.0024 | 284.7768 | 0.5340 | 443.5187 | 4.8532 | 260.0481 |
| BFA | 74.9610 | 73.7446 | 35,270.6421 | 37.8638 | 0.0019 | 302.3370 | 0.3541 | 665.5900 | 7.7266 | 73.5709 |
| BDI | 34.7930 | 17.9842 | 2258.1864 | 36.2426 | 0.0048 | 294.1609 | 0.5589 | 529.2802 | 6.5576 | 94.0927 |
| KHM | 62.4120 | 3.5063 | 6434.8125 | 19.4808 | 0.0047 | 301.0983 | 0.5857 | 528.4165 | 6.1715 | 69.9110 |
| CMR | 38.9040 | 7.0416 | 488.4217 | 39.3817 | 0.0045 | 298.2797 | 0.5566 | 514.8801 | 6.4620 | 84.5962 |
| CAN | 80.9370 | 3.7928 | 47,562.0834 | 4.0408 | 0.0016 | 269.5186 | 0.2325 | 418.8888 | 1.0153 | 226.3978 |
| CAF | 73.6070 | 198.0188 | 77,117.1260 | 30.2462 | 0.0037 | 299.2786 | 0.6538 | 569.4739 | 6.2528 | 84.2769 |
| TCD | 87.0740 | 22.9479 | 12,724.1041 | 47.5292 | 0.0009 | 301.2740 | 0.2104 | 711.4191 | 7.3593 | 74.7617 |
| CHL | 49.2260 | 141.9361 | 4550.4531 | 17.1131 | 0.0044 | 282.1471 | 0.3218 | 530.3233 | 6.4737 | 222.0735 |
| CHN | 47.3300 | 64.5690 | 1701.4757 | 33.5316 | 0.0022 | 279.8398 | 0.2917 | 562.5896 | 1.5989 | 224.9424 |
| COL | 51.5590 | 43.0311 | 1352.3023 | 19.6749 | 0.0100 | 297.4497 | 0.6436 | 334.4057 | 0.9222 | 123.3522 |
| COM | 40.0130 | 28.4792 | 334.0216 | 12.2778 | 0.0026 | 298.7503 | 0.6891 | 594.0341 | 6.9941 | 90.0638 |
| COG | 63.2560 | 12.5146 | 3076.5564 | 38.5241 | 0.0039 | 298.2270 | 0.6236 | 411.5523 | 5.6358 | 88.5784 |
| COD | 77.9640 | 40.7595 | 6336.7095 | 40.1152 | 0.0044 | 297.6502 | 0.7110 | 448.2185 | 5.8985 | 89.9481 |
| CRI | 27.9730 | 370.6051 | 1316.4912 | 17.5967 | 0.0130 | 296.7344 | 0.6700 | 357.9722 | 0.7398 | 225.9937 |
| CIV | 71.7360 | 89.6469 | 8227.1275 | 22.6921 | 0.0037 | 299.9743 | 0.5623 | 559.6354 | 6.9273 | 74.5711 |
| HRV | 76.5970 | 105.4663 | 5305.8836 | 20.5528 | 0.0039 | 284.4250 | 0.5424 | 440.8613 | 4.2722 | 267.6474 |
| CUB | 67.5510 | 120.4131 | 31,023.6387 | 9.7600 | 0.0028 | 298.1095 | 0.6683 | 664.9447 | 0.5620 | 194.1925 |
| CYP | 73.2550 | 135.6086 | 19,960.0685 | 22.8102 | 0.0010 | 293.8294 | 0.3730 | 511.1199 | 1.8997 | 273.7738 |
| CZE | 76.9660 | 234.6069 | 41,572.4560 | 20.1978 | 0.0026 | 280.3871 | 0.4437 | 504.3881 | 3.2755 | 275.2004 |
| DNK | 76.9990 | 36.2465 | 1343.2751 | 1.8124 | 0.0009 | 256.2492 | −0.0304 | 209.7019 | 0.9164 | 148.4681 |
| DJI | 68.0940 | 94.5027 | 6967.3650 | 34.4946 | 0.0007 | 301.5621 | 0.1089 | 806.9927 | 7.5302 | 60.3222 |
| DMA | 86.7950 | 130.7491 | 58,041.3984 | 13.8750 | 0.0033 | 299.8107 | 0.7526 | 728.0241 | 1.3721 | 38.2577 |
| DOM | 73.7530 | 200.6855 | 5555.3920 | 12.5096 | 0.0035 | 297.4771 | 0.6906 | 484.9965 | 1.8477 | 112.2349 |
| ECU | 67.5400 | 15.1055 | 4480.7863 | 18.8808 | 0.0083 | 294.1817 | 0.5549 | 341.0703 | 0.5654 | 263.1343 |
| EGY | 62.6900 | 60.4409 | 4633.5913 | 48.1878 | 0.0000 | 297.6498 | 0.1154 | 601.6020 | 3.4849 | 79.6426 |
| SLV | 43.0190 | 83.1395 | 2645.9688 | 27.8099 | 0.0060 | 298.2016 | 0.6729 | 531.1998 | 1.1308 | 210.9113 |
| GNQ | 35.1750 | 31.3905 | 501.3553 | 34.2131 | 0.0072 | 297.5292 | 0.4614 | 374.2530 | 5.8789 | 89.9145 |
| ERI | 78.4420 | 93.1519 | 30,532.4805 | 34.7674 | 0.0009 | 300.5296 | 0.1592 | 710.7175 | 8.2645 | 66.4203 |
| EST | 68.0940 | 31.4101 | 14,663.0446 | 10.4435 | 0.0022 | 278.0834 | 0.4123 | 486.3156 | 0.8620 | 99.9942 |
| ETH | 17.3190 | 77.6088 | 341.5541 | 22.4263 | 0.0029 | 296.6997 | 0.3831 | 750.3512 | 5.8186 | 82.3852 |
| FJI | 83.7700 | 17.6484 | 46,505.3032 | 6.3517 | 0.0055 | 298.0352 | 0.7669 | 543.7714 | 6.7525 | 127.0238 |
| FIN | 52.1710 | 47.0616 | 3652.5359 | 6.6236 | 0.0018 | 274.2084 | 0.4011 | 485.6330 | 0.7865 | 92.5167 |
| FRA | 78.3690 | 118.7593 | 40,677.9851 | 14.5677 | 0.0026 | 283.5292 | 0.5657 | 550.2120 | 3.0208 | 266.7231 |
| GAB | 85.5330 | 6.3032 | 8849.3226 | 28.6259 | 0.0050 | 298.1025 | 0.4853 | 418.5210 | 5.4973 | 84.8032 |
| GEO | 81.3020 | 259.4402 | 39,688.6150 | 23.0475 | 0.0037 | 282.8617 | 0.4921 | 322.5517 | 4.1843 | 270.0103 |
| DEU | 55.5350 | 66.2496 | 3233.2959 | 15.0321 | 0.0026 | 281.2116 | 0.4723 | 552.1991 | 2.5113 | 287.3649 |
| GHA | 50.7130 | 108.9022 | 1299.3452 | 28.2610 | 0.0032 | 301.0210 | 0.5140 | 574.2501 | 7.0283 | 73.9627 |
| GRC | 33.6780 | 41.4788 | 672.4249 | 17.8012 | 0.0027 | 288.3139 | 0.5350 | 487.4592 | 3.8180 | 257.7429 |
| GTM | 55.6620 | 177.1936 | 860.6364 | 23.6332 | 0.0060 | 296.2301 | 0.6984 | 460.7317 | 1.6965 | 211.6805 |
| GIN | 40.1110 | 54.1466 | 558.1747 | 29.9936 | 0.0047 | 299.5000 | 0.5690 | 554.3768 | 7.3328 | 73.9678 |
| GNB | 65.9400 | 33.6414 | 17,288.8413 | 34.3831 | 0.0034 | 301.2685 | 0.5760 | 506.7190 | 7.2528 | 75.1912 |
| GUY | 76.2920 | 86.2788 | 26,716.6488 | 19.2081 | 0.0063 | 298.5927 | 0.6857 | 436.3221 | 1.3986 | 83.1539 |
| HTI | 48.4030 | 133.0691 | 2852.5473 | 13.6283 | 0.0035 | 298.5115 | 0.6289 | 482.3432 | 2.5021 | 108.7013 |
| HND | 26.6340 | 3.8071 | 4580.6988 | 23.7494 | 0.0054 | 296.6075 | 0.7097 | 459.8782 | 1.3912 | 242.3355 |
| HUN | 51.8850 | 74.3361 | 1904.3472 | 19.8155 | 0.0029 | 283.6719 | 0.4845 | 461.2708 | 4.2378 | 269.3359 |
| ISL | 55.1550 | 76.7589 | 14,067.5231 | 5.1105 | 0.0029 | 275.2911 | 0.1557 | 474.0290 | 0.4757 | 176.7534 |
| IND | 47.5090 | 361.0057 | 1191.9727 | 45.5661 | 0.0039 | 297.2297 | 0.4219 | 558.1978 | 1.6909 | 171.6800 |
| IDN | 68.9110 | 110.4609 | 13,223.0830 | 13.8318 | 0.0104 | 298.5568 | 0.7013 | 303.7251 | 1.4201 | 96.7373 |
| IRN | 49.9140 | 133.4943 | 3122.3627 | 41.0969 | 0.0006 | 292.3816 | 0.1351 | 714.8023 | 4.3480 | 308.9607 |
| IRQ | 30.9300 | 415.1370 | 1357.5637 | 56.5689 | 0.0004 | 297.6370 | 0.1351 | 697.2399 | 2.0903 | 268.1486 |
| IRL | 61.5420 | 66.1947 | 48,655.3662 | 9.2998 | 0.0025 | 281.7896 | 0.6377 | 605.3116 | 0.7395 | 278.0849 |
| ISR | 70.6260 | 45.2875 | 6599.6609 | 27.3870 | 0.0006 | 294.8444 | 0.2070 | 490.9759 | 0.8147 | 126.4837 |
| ITA | 69.1030 | 68.4794 | 4657.2803 | 16.5809 | 0.0037 | 285.2070 | 0.5284 | 421.8136 | 3.7691 | 264.5229 |
| JAM | 93.5740 | 3.1725 | 43,237.0730 | 16.8277 | 0.0042 | 298.7094 | 0.7376 | 518.1663 | 0.5266 | 123.4435 |
| JPN | 91.8260 | 352.2921 | 30,780.0238 | 10.3896 | 0.0052 | 285.1543 | 0.5632 | 537.7658 | 2.9139 | 242.7836 |
| JOR | 68.3270 | 201.5279 | 36,035.6450 | 33.6382 | 0.0002 | 294.4903 | 0.1226 | 655.6845 | 0.9674 | 164.3673 |
| KAZ | 53.7430 | 259.5073 | 4704.0478 | 17.1464 | 0.0008 | 280.3791 | 0.1589 | 574.3142 | 1.0340 | 234.9184 |
| KEN | 86.0880 | 81.7925 | 3736.6455 | 18.7693 | 0.0020 | 298.6075 | 0.3634 | 887.2977 | 6.0978 | 108.3308 |
| KWT | 90.8120 | 351.3580 | 44,968.1562 | 55.6635 | 0.0001 | 300.5263 | 0.0848 | 676.3921 | 2.7809 | 16.7101 |
| KGZ | 56.8270 | 6.0458 | 9070.4883 | 23.1768 | 0.0029 | 274.8617 | 0.1842 | 273.0803 | 1.6108 | 242.2357 |
| LAO | 23.5710 | 73.8495 | 1080.2962 | 31.7077 | 0.0052 | 296.6715 | 0.6831 | 428.5346 | 4.3811 | 73.6964 |
| LVA | 35.3060 | 28.4041 | 880.0378 | 16.8554 | 0.0024 | 278.7494 | 0.4569 | 504.1107 | 1.3196 | 292.6289 |
| LBN | 20.2940 | 81.0798 | 785.5027 | 29.4808 | 0.0013 | 292.1864 | 0.3321 | 454.8625 | 1.4076 | 292.7077 |
| LSO | 81.9360 | 509.8160 | 23,087.2256 | 30.9382 | 0.0029 | 285.4497 | 0.3767 | 618.2869 | 2.3187 | 101.5551 |
| LBR | 100.0000 | 167.8947 | 38,577.4983 | 20.8104 | 0.0069 | 298.3473 | 0.5726 | 405.1455 | 6.4145 | 76.4804 |
| LBY | 30.0640 | 27.0761 | 1141.2357 | 44.9146 | 0.0000 | 297.0999 | 0.1089 | 639.5184 | 2.9280 | 99.6819 |
| LTU | 87.3340 | 484.1705 | 7761.6415 | 18.8983 | 0.0024 | 279.3566 | 0.4402 | 519.3005 | 2.1780 | 299.6535 |
| LUX | 47.8130 | 40.4003 | 513.4456 | 14.5062 | 0.0026 | 280.9109 | 0.5379 | 537.4608 | 2.4119 | 274.8031 |
| MKD | 78.0520 | 3.5223 | 12,162.6687 | 28.5769 | 0.0027 | 284.4014 | 0.5094 | 489.8313 | 4.4800 | 261.3908 |
| MDG | 18.2260 | 323.1022 | 2799.6487 | 14.2395 | 0.0037 | 296.2955 | 0.4989 | 612.5914 | 5.9437 | 87.6547 |
| MWI | 24.7980 | 65.7304 | 1119.8436 | 23.1781 | 0.0035 | 295.1841 | 0.4354 | 583.2161 | 5.9511 | 86.2580 |
| MYS | 66.7570 | 49.4181 | 11,987.5084 | 11.8684 | 0.0085 | 299.0985 | 0.7260 | 322.4270 | 1.0603 | 164.5732 |
| MLI | 88.5470 | 208.6226 | 110,885.9914 | 43.6481 | 0.0008 | 302.9405 | 0.1930 | 734.4775 | 6.4881 | 78.4974 |
| MLT | 67.8410 | 33.7011 | 11,420.9940 | 14.7000 | 0.0010 | 292.4508 | 0.2650 | 644.2999 | 2.3978 | 252.1285 |
| MRT | 58.0180 | 72.4701 | 2839.9260 | 49.4271 | 0.0002 | 301.7911 | 0.1163 | 667.7209 | 5.5606 | 80.9139 |
| MUS | 42.6200 | 99.7486 | 2437.5377 | 14.9643 | 0.0018 | 297.6239 | 0.6674 | 832.2022 | 6.3819 | 91.2177 |
| MEX | 31.9380 | 36.3718 | 471.9592 | 10.7505 | 0.0025 | 293.5143 | 0.4538 | 622.6082 | 1.0130 | 242.3290 |
| MDA | 77.8150 | 58.6913 | 9271.3984 | 17.1430 | 0.0021 | 283.4861 | 0.4243 | 511.0675 | 4.9533 | 261.5537 |
| MNG | 57.0890 | 81.4831 | 4577.6888 | 20.3286 | 0.0007 | 273.3294 | 0.1509 | 605.1658 | 1.1409 | 292.6526 |
| MAR | 35.9990 | 12.3336 | 710.2743 | 23.8466 | 0.0013 | 291.8975 | 0.2227 | 635.2521 | 1.2974 | 212.5027 |
| MOZ | 94.0720 | 1295.3375 | 21,799.1743 | 21.1780 | 0.0024 | 297.3460 | 0.5703 | 681.6963 | 5.5648 | 90.3917 |
| MMR | 28.8850 | 77.4589 | 746.9454 | 32.3807 | 0.0063 | 297.0950 | 0.5897 | 425.0941 | 3.4974 | 70.7156 |
| NAM | 67.5670 | 1.7508 | 2643.2871 | 17.8317 | 0.0011 | 294.6526 | 0.2440 | 706.3795 | 4.9635 | 100.6480 |
| NPL | 31.8300 | 29.9239 | 471.9044 | 33.6434 | 0.0058 | 285.5679 | 0.4564 | 352.1509 | 2.0649 | 125.1047 |
| NLD | 46.5880 | 3.3901 | 1610.9206 | 15.4084 | 0.0024 | 282.1098 | 0.5103 | 561.5207 | 1.7501 | 294.1775 |
| NZL | 41.5550 | 615.9606 | 8000.3764 | 7.6132 | 0.0050 | 283.7062 | 0.6549 | 537.2214 | 5.1672 | 278.0932 |
| NIC | 15.5440 | 154.2173 | 478.6687 | 17.8166 | 0.0056 | 298.5502 | 0.6385 | 554.3769 | 1.0923 | 236.3933 |
| NER | 70.9120 | 85.8561 | 9040.5685 | 61.9910 | 0.0003 | 301.7717 | 0.1266 | 706.7643 | 6.9274 | 78.2103 |
| NGA | 41.6160 | 2.5737 | 5394.9967 | 54.4786 | 0.0030 | 300.9623 | 0.4178 | 611.8713 | 7.4695 | 74.0082 |
| PRK | 16.2210 | 12.9976 | 476.8695 | 22.1498 | 0.0039 | 279.6718 | 0.4537 | 457.9945 | 3.6046 | 257.7851 |
| NOR | 43.4800 | 174.0321 | 2280.4373 | 6.2609 | 0.0030 | 273.7207 | 0.2744 | 397.2826 | 2.4269 | 39.2756 |
| OMN | 56.9170 | 48.3967 | 1503.8722 | 54.1434 | 0.0001 | 301.6586 | 0.1020 | 634.2790 | 5.6934 | 35.3926 |
| PAK | 87.1340 | 492.5999 | 50,999.7451 | 50.6556 | 0.0013 | 293.5166 | 0.1867 | 552.6995 | 2.3629 | 265.0578 |
| PAN | 79.1020 | 13.3863 | 87,693.7901 | 14.9683 | 0.0112 | 298.2721 | 0.6080 | 377.9468 | 0.7914 | 191.1319 |
| PNG | 16.7680 | 188.4423 | 592.4012 | 14.3755 | 0.0110 | 297.0078 | 0.7099 | 320.3813 | 5.4797 | 117.6067 |
| PRY | 86.1600 | 16.5231 | 33,676.7741 | 17.6271 | 0.0034 | 296.7699 | 0.6201 | 662.0198 | 2.1740 | 124.1355 |
| PER | 75.1610 | 9.8269 | 21,369.3530 | 29.1773 | 0.0053 | 292.2713 | 0.5492 | 380.9177 | 2.8653 | 173.1772 |
| PHL | 34.9970 | 232.7530 | 987.4097 | 19.1501 | 0.0070 | 299.4058 | 0.6799 | 428.2899 | 5.6060 | 81.2701 |
| POL | 65.1400 | 49.0004 | 8082.0162 | 25.3577 | 0.0026 | 280.6870 | 0.4420 | 514.8395 | 3.0274 | 283.8089 |
| PRT | 76.4300 | 22.6779 | 5082.3537 | 8.3592 | 0.0030 | 288.2484 | 0.5331 | 555.1662 | 2.6697 | 268.5799 |
| PRI | 45.3320 | 315.1450 | 2217.4722 | 6.3975 | 0.0040 | 299.0158 | 0.7279 | 582.3037 | 3.2937 | 91.3208 |
| QAT | 13.0190 | 16.1430 | 1949.3512 | 77.0309 | 0.0001 | 301.2879 | 0.0789 | 432.1830 | 4.5870 | 35.5800 |
| ROU | 60.8920 | 124.2092 | 12,613.0110 | 18.2238 | 0.0027 | 282.9693 | 0.5020 | 410.9185 | 4.9553 | 263.3766 |
| RUS | 93.8250 | 419.5631 | 26,435.7488 | 8.9189 | 0.0015 | 267.9939 | 0.2840 | 439.2652 | 1.5646 | 181.0101 |
| RWA | 60.3770 | 203.8771 | 571.0000 | 37.3556 | 0.0047 | 292.6306 | 0.5793 | 527.0604 | 6.2825 | 94.5689 |
| SAU | 59.2610 | 15.7262 | 4342.0658 | 62.9081 | 0.0001 | 300.0993 | 0.0997 | 788.9404 | 4.8292 | 59.2396 |
| SEN | 98.5010 | 159.8905 | 67,403.0877 | 42.2514 | 0.0015 | 302.3778 | 0.3715 | 584.6552 | 7.0620 | 77.3037 |
| SCG | 53.8290 | 88.0107 | 8214.0769 | 23.0210 | 0.0031 | 284.1093 | 0.5089 | 461.0485 | 4.6190 | 264.2004 |
| SLE | 73.6870 | 8.7226 | 10,674.9961 | 25.4695 | 0.0068 | 299.0767 | 0.6069 | 454.3014 | 6.9283 | 73.9357 |
| SGP | 16.9340 | 406.9452 | 609.7543 | 12.7667 | 0.0077 | 300.3449 | 0.3782 | 382.4692 | 0.0733 | 266.9524 |
| SVK | 82.0840 | 12.7560 | 19,262.5476 | 22.4561 | 0.0032 | 281.0620 | 0.5077 | 448.5882 | 3.8797 | 272.7194 |
| SVN | 59.5665 | 64.7115 | 6211.9526 | 18.5665 | 0.0041 | 282.1086 | 0.5702 | 409.4799 | 4.0335 | 268.6721 |
| SLB | 33.0890 | 13.9218 | 1683.2119 | 9.4798 | 0.0101 | 299.4975 | 0.7754 | 473.4059 | 7.5332 | 116.0296 |
| SOM | 43.7730 | 65.8502 | 1271.5833 | 20.5293 | 0.0006 | 300.1017 | 0.2314 | 962.1868 | 5.2201 | 95.2566 |
| ZAF | 100.0000 | 7231.8120 | 47,236.9602 | 20.4826 | 0.0015 | 291.3567 | 0.3396 | 687.0730 | 2.5442 | 97.3376 |
| KOR | 20.0480 | 18.8589 | 1604.1489 | 21.4609 | 0.0033 | 285.1610 | 0.5397 | 509.4174 | 4.2969 | 251.6809 |
| ESP | 38.8560 | 88.8838 | 401.8349 | 9.9437 | 0.0023 | 286.5493 | 0.4453 | 592.2915 | 2.7447 | 263.7488 |
| LKA | 65.4520 | 298.4497 | 2983.2288 | 25.3155 | 0.0060 | 299.8506 | 0.6618 | 586.3166 | 1.3345 | 166.5525 |
| SDN | 39.3100 | 19.1983 | 340.0000 | 38.9988 | 0.0011 | 301.3470 | 0.2519 | 738.0433 | 7.3270 | 74.6513 |
| SUR | 64.9520 | 187.8875 | 1090.2608 | 16.9544 | 0.0063 | 299.2193 | 0.7294 | 472.5307 | 2.1512 | 82.3240 |
| SWE | 66.3440 | 3.3918 | 8255.8749 | 5.7732 | 0.0021 | 274.3062 | 0.3890 | 469.8716 | 1.5591 | 71.7317 |
| CHE | 54.6850 | 112.1089 | 16,841.7677 | 14.9906 | 0.0045 | 278.4398 | 0.3945 | 363.3662 | 3.4651 | 266.6112 |
| SYR | 52.6580 | 101.6858 | 23,532.4809 | 40.9309 | 0.0005 | 293.6260 | 0.1708 | 645.8788 | 2.0639 | 292.5738 |
| TJK | 85.0560 | 22.8545 | 52,869.0443 | 21.2128 | 0.0022 | 273.5668 | 0.1295 | 293.0872 | 0.9914 | 233.3864 |
| TZA | 55.6000 | 116.3347 | 1182.6078 | 23.7108 | 0.0027 | 296.2039 | 0.4929 | 700.7487 | 6.6704 | 92.9072 |
| THA | 21.9850 | 9.4918 | 892.5689 | 27.1362 | 0.0046 | 299.9986 | 0.5820 | 490.1417 | 4.6816 | 99.8046 |
| BHS | 37.5330 | 118.0672 | 534.0448 | 7.7060 | 0.0028 | 297.7795 | 0.4434 | 807.5737 | 1.2382 | 185.8730 |
| GMB | 43.8560 | 131.5254 | 5076.3399 | 40.4773 | 0.0023 | 301.3224 | 0.4435 | 489.6556 | 7.1401 | 76.6141 |
| TLS | 26.5200 | 53.7825 | 749.5524 | 11.6718 | 0.0056 | 298.3395 | 0.6927 | 383.0494 | 0.8008 | 89.9006 |
| TGO | 48.4910 | 10.8255 | 4439.2021 | 32.3445 | 0.0035 | 300.6441 | 0.5188 | 549.1817 | 7.1811 | 72.9087 |
| TTO | 27.7320 | 73.5385 | 806.4143 | 18.2077 | 0.0043 | 300.0594 | 0.7054 | 621.9412 | 2.2701 | 65.9014 |
| TUN | 54.0250 | 258.8975 | 16,683.3931 | 26.6958 | 0.0006 | 293.7851 | 0.1735 | 608.7419 | 1.5471 | 233.4501 |
| TUR | 66.6570 | 68.4555 | 4344.6194 | 30.0736 | 0.0022 | 286.3770 | 0.3624 | 541.6698 | 3.8240 | 268.8586 |
| TKM | 70.8250 | 93.9763 | 10,742.7750 | 35.6079 | 0.0004 | 290.5273 | 0.1137 | 568.9996 | 1.6084 | 258.3359 |
| TCA | 28.1140 | 50.0638 | 743.4037 | 6.5000 | 0.0047 | 296.4078 | 0.2566 | 522.6992 | 6.0258 | 105.3096 |
| UGA | 19.3830 | 161.7203 | 822.5394 | 28.7182 | 0.0019 | 282.6911 | 0.5464 | 534.6531 | 4.3630 | 258.9520 |
| ARE | 68.5960 | 79.1803 | 3078.4299 | 60.7467 | 0.0001 | 301.9237 | 0.1055 | 529.0540 | 4.9619 | 29.6262 |
| GBR | 94.4140 | 19.1937 | 11,992.0238 | 10.6468 | 0.0024 | 281.3542 | 0.5298 | 587.7255 | 1.1419 | 220.0884 |
| USA | 80.7720 | 33.8158 | 48,650.6431 | 6.5162 | 0.0021 | 280.7282 | 0.3657 | 546.2695 | 1.1354 | 181.6406 |
| URY | 50.9560 | 67.1425 | 1742.3493 | 10.1519 | 0.0035 | 290.6031 | 0.6071 | 551.7682 | 1.3857 | 120.9040 |
| UZB | 88.0830 | 32.2430 | 13,825.3571 | 32.7840 | 0.0006 | 287.1962 | 0.1537 | 568.6717 | 0.9337 | 230.7533 |
| VUT | 30.4170 | 283.7026 | 1673.3293 | 8.6629 | 0.0057 | 298.5864 | 0.7746 | 605.4128 | 6.8839 | 109.8597 |
| VEN | 24.4620 | 19.3779 | 2839.4063 | 20.2724 | 0.0073 | 299.1591 | 0.6504 | 449.7746 | 1.4295 | 85.8965 |
| VNM | 31.7760 | 43.8564 | 1334.7849 | 28.2711 | 0.0059 | 297.3987 | 0.5967 | 448.5403 | 4.5158 | 89.2613 |
| YEM | 62.2180 | 42.2203 | 8148.9612 | 44.7159 | 0.0005 | 299.2449 | 0.1327 | 764.0328 | 7.6672 | 57.8002 |
| ZMB | 39.3550 | 18.3026 | 1489.4591 | 26.0485 | 0.0033 | 295.2124 | 0.5530 | 695.4833 | 5.4526 | 87.0685 |
| ZWE | 33.1960 | 32.8234 | 948.3315 | 20.7320 | 0.0022 | 295.0207 | 0.4670 | 698.6781 | 5.3556 | 94.2311 |
| Country | UR | PD | GDP_per | PM25 | T2M | TP | NDVI | BLH | WS | WD |
|---|---|---|---|---|---|---|---|---|---|---|
| AFG | 25.7540 | 58.2694 | 494.1793 | 38.0847 | 285.9910 | 0.0012 | 0.1220 | 576.7270 | 1.1174 | 192.4120 |
| ALB | 61.2290 | 104.1676 | 5396.2159 | 18.4450 | 287.0500 | 0.0037 | 0.5194 | 420.1060 | 0.5200 | 86.7770 |
| DZA | 73.1890 | 18.0763 | 3989.6683 | 30.8674 | 296.9940 | 0.0002 | 0.1241 | 804.5470 | 1.3350 | 112.8540 |
| AGO | 66.1770 | 25.5276 | 2177.7990 | 22.8370 | 296.4210 | 0.0029 | 0.5436 | 643.1190 | 0.9093 | 149.4730 |
| ARG | 91.9910 | 16.4208 | 10,076.3552 | 15.2006 | 287.6710 | 0.0019 | 0.3775 | 695.4480 | 1.7135 | 183.4740 |
| ARM | 63.2190 | 103.8893 | 4604.6463 | 25.2962 | 280.2240 | 0.0021 | 0.3240 | 401.6270 | 0.3271 | 152.5670 |
| AUS | 86.1240 | 3.2977 | 54,875.2860 | 6.7456 | 296.1620 | 0.0007 | 0.2789 | 888.7900 | 1.7871 | 140.7900 |
| AUT | 58.5150 | 107.6093 | 50,114.4011 | 10.2758 | 281.2490 | 0.0035 | 0.5170 | 441.2720 | 0.5876 | 262.1070 |
| AZE | 56.0310 | 121.2801 | 4805.7537 | 24.6990 | 287.5710 | 0.0012 | 0.2915 | 445.8150 | 1.1048 | 114.1380 |
| BGD | 37.4050 | 1252.5634 | 2154.2268 | 66.1645 | 298.7430 | 0.0057 | 0.5475 | 429.5680 | 0.6691 | 142.3130 |
| BLR | 79.0440 | 46.4073 | 6837.7178 | 12.7372 | 281.9500 | 0.0018 | 0.5131 | 597.0160 | 0.9863 | 236.0810 |
| BEL | 98.0410 | 379.4247 | 46,599.1113 | 9.6846 | 284.1720 | 0.0025 | 0.6249 | 595.0370 | 1.5952 | 222.0780 |
| BLZ | 45.8660 | 17.1132 | 4983.3361 | 16.5686 | 299.5650 | 0.0028 | 0.7292 | 630.8900 | 1.9661 | 82.6295 |
| BEN | 47.8610 | 104.6572 | 1219.5155 | 38.4915 | 301.1550 | 0.0033 | 0.4941 | 601.6600 | 0.8456 | 188.9890 |
| BTN | 41.6120 | 20.0077 | 3322.8633 | 22.2679 | 280.0860 | 0.0085 | 0.5505 | 268.1330 | 0.3853 | 180.7190 |
| BOL | 69.7730 | 10.6278 | 3552.0681 | 28.5346 | 293.8780 | 0.0041 | 0.5769 | 558.7200 | 0.7500 | 223.5320 |
| BIH | 48.6260 | 64.4726 | 6119.7624 | 24.1778 | 284.5840 | 0.0035 | 0.5902 | 433.3170 | 0.3310 | 146.7670 |
| BWA | 70.1720 | 4.0649 | 7247.4295 | 17.6292 | 296.5670 | 0.0009 | 0.2981 | 841.4250 | 1.9023 | 67.4814 |
| BRA | 86.8240 | 25.2508 | 8876.0598 | 17.7093 | 298.6320 | 0.0046 | 0.6579 | 527.5280 | 1.1408 | 82.4332 |
| BRN | 77.9420 | 82.2194 | 31,085.9619 | 11.1185 | 300.5500 | 0.0064 | 0.7576 | 366.5130 | 0.2535 | 184.3600 |
| BGR | 75.3470 | 64.2572 | 9879.2685 | 20.2587 | 285.7290 | 0.0018 | 0.5366 | 473.0070 | 0.4082 | 163.8010 |
| BFA | 29.9800 | 74.2741 | 796.1152 | 33.3853 | 302.1930 | 0.0017 | 0.3440 | 651.9520 | 0.3447 | 165.9440 |
| BDI | 13.3660 | 449.0100 | 223.8629 | 33.3833 | 294.2130 | 0.0054 | 0.5516 | 491.9110 | 0.7624 | 155.1150 |
| KHM | 23.8050 | 93.3976 | 1643.1214 | 19.0451 | 301.2210 | 0.0043 | 0.5770 | 579.4180 | 0.6272 | 203.3360 |
| CMR | 56.9680 | 54.7405 | 1533.0957 | 39.5674 | 298.1940 | 0.0053 | 0.5745 | 496.3120 | 0.7571 | 231.8490 |
| CAN | 81.4820 | 4.1939 | 46,328.6718 | 3.7887 | 267.7350 | 0.0017 | 0.2210 | 415.1060 | 1.0458 | 232.4510 |
| CAF | 41.7700 | 7.6169 | 468.1175 | 29.9804 | 299.7250 | 0.0032 | 0.6687 | 607.9740 | 0.5128 | 190.3200 |
| TCD | 23.2790 | 12.6643 | 709.5400 | 45.7528 | 300.7440 | 0.0009 | 0.2158 | 694.0220 | 1.8188 | 99.1951 |
| CHL | 87.6430 | 25.4892 | 14,699.4628 | 15.6574 | 282.9200 | 0.0042 | 0.3270 | 513.9030 | 1.6353 | 261.0210 |
| CHN | 60.3080 | 149.3676 | 10,143.8382 | 25.5362 | 280.2820 | 0.0020 | 0.3143 | 548.3210 | 1.0782 | 193.2240 |
| COL | 81.1040 | 45.3713 | 6418.6158 | 20.0078 | 297.5740 | 0.0085 | 0.6356 | 355.1230 | 0.5836 | 125.3620 |
| COM | 29.1640 | 457.2225 | 1404.4332 | 11.4444 | 298.9590 | 0.0037 | 0.6562 | 563.6050 | 1.2153 | 152.7340 |
| COG | 67.3730 | 15.7555 | 2369.7294 | 35.3891 | 298.4350 | 0.0045 | 0.6474 | 402.2990 | 0.9475 | 238.3690 |
| COD | 45.0460 | 38.2835 | 596.5606 | 37.0104 | 297.9160 | 0.0043 | 0.7050 | 450.7590 | 0.5152 | 189.8170 |
| CRI | 80.0760 | 98.8555 | 12,762.1380 | 16.5802 | 296.9290 | 0.0077 | 0.6854 | 402.6680 | 1.6485 | 95.5486 |
| CIV | 51.2390 | 80.8697 | 2276.3324 | 22.0734 | 299.8870 | 0.0039 | 0.5649 | 557.8230 | 1.1970 | 205.1350 |
| HRV | 57.2420 | 71.8369 | 15,311.7669 | 15.6601 | 286.0370 | 0.0034 | 0.5945 | 442.2140 | 0.5484 | 139.2350 |
| CUB | 77.1090 | 109.1858 | 9125.8787 | 10.1175 | 299.2330 | 0.0026 | 0.6975 | 619.1490 | 2.1725 | 73.5690 |
| CYP | 66.8050 | 129.7158 | 29,206.0762 | 17.3184 | 293.4220 | 0.0020 | 0.4344 | 514.9480 | 1.1033 | 280.8170 |
| CZE | 73.9210 | 138.2367 | 23,660.1488 | 12.3749 | 282.9200 | 0.0021 | 0.5658 | 558.9770 | 0.8069 | 252.8090 |
| DNK | 87.9940 | 145.3606 | 59,775.7351 | 1.8211 | 255.3890 | 0.0008 | −0.0289 | 199.5540 | 4.5992 | 196.7030 |
| DJI | 77.9150 | 41.9999 | 3172.7507 | 36.1669 | 302.1320 | 0.0005 | 0.1061 | 833.7160 | 1.7137 | 109.2990 |
| DMA | 70.7860 | 95.7440 | 8516.2800 | 10.8750 | 299.3400 | 0.0023 | 0.7133 | 760.6850 | 7.0991 | 82.9319 |
| DOM | 81.8280 | 222.2926 | 8282.1171 | 12.3714 | 297.8290 | 0.0023 | 0.6724 | 540.1800 | 1.7639 | 99.3554 |
| ECU | 63.9860 | 69.9535 | 6222.5247 | 16.5185 | 294.3210 | 0.0097 | 0.5203 | 327.1850 | 0.8564 | 177.1230 |
| EGY | 42.7300 | 100.8469 | 3019.0923 | 45.6146 | 296.3580 | 0.0000 | 0.1163 | 647.5970 | 2.2996 | 237.8120 |
| SLV | 72.7460 | 311.4648 | 4167.7309 | 28.4136 | 299.2960 | 0.0039 | 0.6899 | 609.6880 | 0.6856 | 99.3884 |
| GNQ | 72.6270 | 48.3416 | 8380.7411 | 32.5806 | 297.8800 | 0.0091 | 0.5520 | 368.3300 | 1.1905 | 245.0380 |
| ERI | 88.7850 | 34.6249 | 879.7500 | 35.2604 | 300.4940 | 0.0011 | 0.1773 | 683.8020 | 0.7730 | 127.0570 |
| EST | 69.0510 | 30.5235 | 23,397.8783 | 6.6522 | 280.5120 | 0.0022 | 0.4676 | 577.9460 | 1.4355 | 232.5920 |
| ETH | 21.2250 | 99.2462 | 855.7609 | 21.4045 | 297.0090 | 0.0031 | 0.3999 | 738.1400 | 0.9869 | 146.1410 |
| FJI | 56.7500 | 48.7113 | 6175.8907 | 6.4917 | 298.0460 | 0.0075 | 0.7729 | 528.3190 | 2.4432 | 117.4620 |
| FIN | 85.4460 | 18.1680 | 48,628.6418 | 4.1757 | 275.9150 | 0.0021 | 0.3976 | 514.1460 | 0.5794 | 248.4900 |
| FRA | 80.7090 | 122.8163 | 40,578.6443 | 8.6285 | 285.2670 | 0.0027 | 0.6039 | 574.8230 | 0.9587 | 244.9160 |
| GAB | 89.7410 | 8.4316 | 7766.9966 | 27.3496 | 298.3740 | 0.0063 | 0.5362 | 401.3820 | 1.0735 | 237.0970 |
| GEO | 59.0390 | 65.0856 | 4696.1506 | 20.5521 | 281.8770 | 0.0030 | 0.4900 | 329.1450 | 0.3831 | 166.2410 |
| DEU | 77.3760 | 237.8298 | 46,794.8993 | 9.6144 | 283.6320 | 0.0023 | 0.6098 | 589.4600 | 1.2873 | 238.8680 |
| GHA | 56.7070 | 133.6814 | 2246.6256 | 28.3200 | 301.1960 | 0.0036 | 0.5091 | 568.7270 | 1.2022 | 203.5150 |
| GRC | 79.3880 | 83.1775 | 19,133.7578 | 15.4170 | 288.4520 | 0.0025 | 0.5523 | 504.4960 | 0.6131 | 177.9470 |
| GTM | 51.4390 | 154.9461 | 4638.6349 | 24.2976 | 296.9800 | 0.0042 | 0.7107 | 520.3380 | 0.8342 | 94.0165 |
| GIN | 36.5000 | 51.9748 | 1052.5881 | 26.8087 | 299.7110 | 0.0047 | 0.5822 | 566.5580 | 0.6415 | 228.1720 |
| GNB | 43.7770 | 68.3114 | 749.4537 | 30.4515 | 301.1960 | 0.0031 | 0.5734 | 518.2760 | 0.8025 | 271.5200 |
| GUY | 26.6890 | 3.9765 | 6609.5113 | 16.6437 | 298.7880 | 0.0056 | 0.6699 | 503.5820 | 1.7712 | 51.5988 |
| HTI | 56.1920 | 408.6749 | 1312.7706 | 13.0648 | 298.9520 | 0.0026 | 0.6046 | 486.0390 | 1.3718 | 71.3106 |
| HND | 57.7300 | 87.1044 | 2574.3568 | 25.1231 | 297.5060 | 0.0037 | 0.6992 | 543.1380 | 1.2021 | 63.4658 |
| HUN | 71.6440 | 107.0693 | 16,735.6598 | 14.7373 | 285.6490 | 0.0020 | 0.5244 | 508.8610 | 0.3774 | 281.7820 |
| ISL | 93.8550 | 3.5759 | 68,941.4622 | 4.6877 | 275.1510 | 0.0035 | 0.1591 | 499.5160 | 1.3305 | 95.8075 |
| IND | 34.4720 | 459.5797 | 2072.2449 | 47.7395 | 297.0040 | 0.0039 | 0.4375 | 570.4330 | 0.6883 | 227.2730 |
| IDN | 55.9850 | 144.1400 | 4135.2333 | 19.3366 | 298.7120 | 0.0080 | 0.6920 | 366.1870 | 0.4894 | 157.6720 |
| IRN | 75.3910 | 50.9061 | 3514.0422 | 39.2695 | 291.6150 | 0.0011 | 0.1417 | 706.7170 | 0.9124 | 184.8040 |
| IRQ | 70.6780 | 90.5488 | 5943.4585 | 41.0859 | 296.4490 | 0.0009 | 0.1950 | 653.7620 | 1.4538 | 277.4360 |
| IRL | 63.4050 | 71.6264 | 80,886.6157 | 8.3900 | 283.1850 | 0.0033 | 0.7052 | 683.9150 | 1.5995 | 229.9180 |
| ISR | 92.5010 | 418.3919 | 43,951.2477 | 24.7428 | 293.7420 | 0.0009 | 0.2257 | 531.0790 | 1.2911 | 294.0130 |
| ITA | 70.7360 | 200.6149 | 33,673.4755 | 12.8533 | 286.4040 | 0.0033 | 0.5514 | 422.3290 | 0.5586 | 193.7010 |
| JAM | 55.9850 | 272.2324 | 5369.4984 | 16.7798 | 299.6320 | 0.0031 | 0.7483 | 556.2090 | 2.2790 | 86.7641 |
| JPN | 91.6980 | 347.4156 | 40,458.0019 | 10.0334 | 285.4470 | 0.0046 | 0.5885 | 536.0390 | 0.8988 | 263.3480 |
| JOR | 91.2030 | 113.7835 | 4405.4871 | 29.7442 | 293.1010 | 0.0003 | 0.1269 | 691.4660 | 1.5888 | 284.3500 |
| KAZ | 57.5400 | 6.8577 | 9812.5958 | 15.8898 | 280.8730 | 0.0008 | 0.1711 | 578.5250 | 0.9060 | 150.6460 |
| KEN | 27.5070 | 92.3744 | 1909.3045 | 17.3898 | 299.0080 | 0.0024 | 0.3672 | 880.3930 | 2.5551 | 128.7880 |
| KWT | 100.0000 | 236.0874 | 32,373.2511 | 49.3006 | 299.8690 | 0.0004 | 0.0944 | 705.1380 | 2.0729 | 315.0530 |
| KGZ | 36.5910 | 33.6611 | 1374.0321 | 20.9686 | 275.0740 | 0.0024 | 0.1847 | 318.9340 | 0.6110 | 174.5800 |
| LAO | 35.6450 | 31.0635 | 2613.9444 | 28.1527 | 297.2150 | 0.0043 | 0.6666 | 478.0500 | 0.5116 | 155.9140 |
| LVA | 68.2220 | 30.8234 | 17,926.8416 | 11.4510 | 281.2190 | 0.0021 | 0.5086 | 601.8390 | 1.3511 | 229.9350 |
| LBN | 88.7580 | 670.1573 | 7527.4431 | 28.1058 | 291.2930 | 0.0023 | 0.3510 | 472.8410 | 1.2080 | 228.9240 |
| LSO | 28.5850 | 70.0022 | 1153.3881 | 25.2854 | 286.5400 | 0.0021 | 0.3611 | 713.2940 | 1.1283 | 296.3580 |
| LBR | 51.6150 | 51.2601 | 672.3405 | 20.7036 | 298.8470 | 0.0076 | 0.5940 | 426.6500 | 1.1926 | 228.4800 |
| LBY | 80.3930 | 3.8518 | 10,218.0430 | 38.7454 | 295.7350 | 0.0001 | 0.1101 | 676.7930 | 1.6116 | 113.0800 |
| LTU | 67.8550 | 44.6134 | 19,575.7685 | 12.6261 | 281.9140 | 0.0018 | 0.4940 | 625.8760 | 1.1782 | 227.3760 |
| LUX | 91.2230 | 255.1444 | 113,218.7133 | 8.3344 | 282.8150 | 0.0028 | 0.6410 | 563.4620 | 1.1463 | 227.9150 |
| MKD | 58.2080 | 82.3431 | 6070.3881 | 24.0747 | 285.1600 | 0.0019 | 0.4955 | 531.3080 | 0.4045 | 238.2810 |
| MDG | 37.8610 | 46.3549 | 526.2246 | 12.1826 | 296.4980 | 0.0040 | 0.5163 | 583.1610 | 1.2896 | 127.2640 |
| MWI | 17.1740 | 197.5896 | 591.8471 | 21.9481 | 295.3550 | 0.0043 | 0.4373 | 573.6070 | 1.7421 | 124.7420 |
| MYS | 76.6070 | 97.2448 | 11,432.8260 | 16.0935 | 299.4560 | 0.0068 | 0.7413 | 355.8280 | 0.2674 | 119.3260 |
| MLI | 43.1360 | 16.1106 | 879.0432 | 37.2800 | 301.9070 | 0.0007 | 0.1943 | 737.5190 | 1.2539 | 59.9142 |
| MLT | 94.6780 | 1575.1938 | 31,185.6496 | 12.5500 | 292.6660 | 0.0015 | 0.2972 | 636.0850 | 2.0472 | 296.7260 |
| MRT | 54.5070 | 4.3909 | 1743.3013 | 47.0931 | 300.3140 | 0.0002 | 0.1110 | 675.0430 | 2.4489 | 53.1952 |
| MUS | 40.7660 | 623.5030 | 11,097.1690 | 14.9857 | 297.9390 | 0.0022 | 0.6978 | 798.3020 | 4.4339 | 107.4560 |
| MEX | 80.4440 | 65.6270 | 9950.2176 | 11.4090 | 294.4040 | 0.0020 | 0.4537 | 641.2160 | 1.0560 | 176.7620 |
| MDA | 42.7260 | 92.7841 | 4492.1057 | 14.4353 | 284.9030 | 0.0013 | 0.4343 | 560.0100 | 0.3871 | 302.3710 |
| MNG | 68.5430 | 2.0711 | 4404.8458 | 16.9930 | 274.8340 | 0.0007 | 0.1783 | 592.7250 | 1.2935 | 270.1860 |
| MAR | 62.9940 | 81.7203 | 3235.0007 | 19.8356 | 291.6200 | 0.0006 | 0.2021 | 628.2860 | 1.1931 | 248.2390 |
| MOZ | 36.5280 | 38.6150 | 506.8171 | 19.1836 | 297.5160 | 0.0028 | 0.5734 | 677.4150 | 1.4815 | 129.0600 |
| MMR | 30.8520 | 82.7914 | 1271.1115 | 31.3504 | 297.0020 | 0.0056 | 0.6225 | 428.0970 | 0.5503 | 203.3390 |
| NAM | 51.0420 | 3.0299 | 5028.2953 | 13.7310 | 296.2790 | 0.0005 | 0.1939 | 792.7700 | 1.2406 | 135.3750 |
| NPL | 20.1530 | 199.5725 | 1194.9572 | 35.3453 | 284.8090 | 0.0060 | 0.4904 | 317.6700 | 0.2982 | 199.8580 |
| NLD | 91.8760 | 515.1433 | 52,476.2733 | 10.3351 | 284.2960 | 0.0024 | 0.6263 | 614.1070 | 1.6971 | 229.9490 |
| NZL | 86.6150 | 18.9100 | 42,865.2336 | 8.2814 | 284.0760 | 0.0049 | 0.6630 | 564.6350 | 1.4978 | 291.8250 |
| NIC | 58.7600 | 54.3917 | 1924.4718 | 17.4163 | 299.0100 | 0.0043 | 0.6269 | 614.1830 | 2.3357 | 56.4603 |
| NER | 16.5170 | 18.4027 | 554.0994 | 52.5541 | 301.0240 | 0.0003 | 0.1285 | 716.1880 | 1.5739 | 73.4185 |
| NGA | 51.1570 | 220.6524 | 2229.8587 | 56.4806 | 300.4600 | 0.0033 | 0.4262 | 572.1060 | 0.8015 | 194.9070 |
| PRK | 62.1340 | 213.1564 | 31,902.2435 | 19.0533 | 281.0850 | 0.0023 | 0.5019 | 484.3070 | 0.9032 | 278.8070 |
| NOR | 82.6160 | 14.6474 | 75,719.7529 | 5.2319 | 275.7580 | 0.0037 | 0.2848 | 428.8400 | 0.6042 | 215.2790 |
| OMN | 85.4430 | 16.0743 | 17,700.7035 | 57.6261 | 301.5860 | 0.0001 | 0.1000 | 662.1160 | 1.2113 | 169.2910 |
| PAK | 36.9070 | 280.9326 | 1481.8139 | 48.5352 | 292.9330 | 0.0014 | 0.2009 | 571.4580 | 0.8369 | 193.6570 |
| PAN | 68.0590 | 57.2474 | 15,774.2550 | 14.8707 | 298.4130 | 0.0073 | 0.6259 | 389.2420 | 1.3280 | 189.5370 |
| PNG | 13.2500 | 19.3793 | 2820.3064 | 12.4012 | 296.7420 | 0.0118 | 0.6730 | 345.0370 | 0.5988 | 187.4480 |
| PRY | 61.8790 | 17.7313 | 5383.5744 | 17.8334 | 297.7010 | 0.0035 | 0.6478 | 645.6430 | 0.9680 | 79.5810 |
| PER | 78.0990 | 25.3988 | 7023.0775 | 26.7666 | 292.1290 | 0.0065 | 0.5226 | 361.7310 | 0.6057 | 164.2370 |
| PHL | 47.1490 | 362.6006 | 3485.3408 | 19.4999 | 299.4700 | 0.0064 | 0.7016 | 476.7210 | 0.6597 | 106.2000 |
| POL | 60.0370 | 124.0013 | 15,732.2031 | 16.3124 | 283.4590 | 0.0018 | 0.5542 | 603.7460 | 1.1526 | 242.8570 |
| PRT | 65.7640 | 112.2886 | 23,330.8173 | 6.9603 | 288.3190 | 0.0021 | 0.5310 | 552.3540 | 1.4215 | 305.3360 |
| PRI | 93.5760 | 360.0557 | 32,850.5486 | 6.5975 | 299.0080 | 0.0024 | 0.7144 | 608.7930 | 2.9053 | 88.8691 |
| QAT | 99.1880 | 246.4814 | 62,087.9741 | 84.4423 | 301.1310 | 0.0003 | 0.0796 | 487.5470 | 1.9445 | 349.3780 |
| ROU | 54.0840 | 84.1953 | 12,899.3461 | 15.8196 | 284.3510 | 0.0020 | 0.5149 | 440.4420 | 0.5124 | 169.2870 |
| RUS | 74.5870 | 8.8177 | 11,536.2510 | 9.5408 | 269.5330 | 0.0016 | 0.2893 | 446.3880 | 1.0627 | 212.2090 |
| RWA | 17.3130 | 511.8337 | 820.1772 | 35.1657 | 292.7650 | 0.0049 | 0.5440 | 494.8830 | 0.5002 | 147.2600 |
| STP | 73.5980 | 224.0083 | 1987.5797 | 15.5200 | 299.1360 | 0.0040 | 0.5494 | 482.4470 | 3.9310 | 201.5850 |
| SAU | 84.0650 | 15.9411 | 23,450.5620 | 61.9292 | 299.7860 | 0.0002 | 0.1054 | 804.9950 | 1.0991 | 169.7930 |
| SEN | 47.6530 | 84.6432 | 1435.8304 | 41.3382 | 302.0240 | 0.0011 | 0.3343 | 608.2480 | 1.3218 | 323.5690 |
| SLE | 42.4840 | 108.2461 | 521.7548 | 25.2171 | 299.5970 | 0.0081 | 0.6111 | 477.3480 | 1.1576 | 227.5600 |
| SGP | 100.0000 | 8044.5261 | 65,831.1894 | 18.9333 | 300.6100 | 0.0064 | 0.4149 | 441.5890 | 0.7305 | 77.1261 |
| SVK | 53.7290 | 113.4390 | 19,303.5457 | 15.3297 | 282.9830 | 0.0024 | 0.5620 | 496.2970 | 0.3968 | 191.0500 |
| SVN | 54.8220 | 103.7119 | 25,942.9548 | 12.9523 | 283.9230 | 0.0040 | 0.6477 | 394.5650 | 0.3443 | 196.2730 |
| SLB | 24.2100 | 23.9307 | 2344.0490 | 10.1254 | 299.5710 | 0.0117 | 0.7169 | 475.2730 | 1.2920 | 133.6140 |
| SOM | 45.5540 | 24.6165 | 419.3948 | 22.1128 | 300.1780 | 0.0011 | 0.2472 | 898.5060 | 2.0717 | 170.4720 |
| ZAF | 66.8560 | 48.2720 | 6624.7619 | 16.9129 | 292.2730 | 0.0011 | 0.3138 | 722.0870 | 0.9336 | 202.9530 |
| KOR | 81.4300 | 530.8124 | 31,902.4169 | 20.0633 | 286.0840 | 0.0031 | 0.5821 | 488.9350 | 0.8403 | 290.4310 |
| ESP | 80.5650 | 94.3445 | 29,554.4905 | 8.5732 | 287.5050 | 0.0018 | 0.4497 | 623.3620 | 0.8944 | 269.4560 |
| LKA | 18.5850 | 352.4344 | 3848.2124 | 22.6617 | 300.0680 | 0.0046 | 0.6573 | 607.7990 | 1.1082 | 224.2200 |
| SDN | 34.9360 | 23.1519 | 755.3290 | 35.9188 | 300.8210 | 0.0012 | 0.2713 | 730.9470 | 1.6993 | 112.8630 |
| SUR | 66.0950 | 3.7267 | 6853.6934 | 15.5669 | 299.4120 | 0.0052 | 0.7282 | 561.0120 | 2.0139 | 53.1437 |
| SWE | 87.7080 | 25.2360 | 51,939.4297 | 4.7841 | 276.6110 | 0.0024 | 0.4247 | 517.3740 | 0.7624 | 262.2180 |
| CHE | 73.8490 | 217.0076 | 85,334.5195 | 9.4789 | 280.1400 | 0.0046 | 0.4526 | 353.3350 | 0.3907 | 212.1300 |
| SYR | 54.8210 | 92.9594 | 1116.0000 | 33.6416 | 292.6530 | 0.0010 | 0.2275 | 625.9540 | 1.6093 | 264.8740 |
| TJK | 27.3090 | 67.1592 | 890.5444 | 20.0940 | 273.9880 | 0.0019 | 0.1264 | 366.9720 | 0.6048 | 166.8300 |
| TZA | 34.5000 | 65.4837 | 1085.8849 | 21.9575 | 296.3970 | 0.0034 | 0.5043 | 654.8030 | 1.4502 | 115.6950 |
| THA | 50.6920 | 136.2829 | 7814.3844 | 25.3366 | 300.1650 | 0.0039 | 0.5937 | 536.7530 | 0.5997 | 191.6000 |
| BHS | 83.1320 | 38.9097 | 33,872.3343 | 8.0357 | 298.9800 | 0.0031 | 0.4323 | 711.3870 | 3.0489 | 97.5827 |
| GMB | 61.9310 | 231.9858 | 772.5056 | 39.1057 | 300.8000 | 0.0017 | 0.4342 | 489.6130 | 1.3197 | 312.5200 |
| TLS | 30.9470 | 86.9617 | 1583.7136 | 11.8034 | 298.0910 | 0.0036 | 0.6329 | 470.7030 | 0.7706 | 133.0200 |
| TGO | 42.2480 | 148.6001 | 893.3525 | 33.1021 | 300.7360 | 0.0039 | 0.5133 | 539.2930 | 0.9114 | 194.8140 |
| TTO | 53.1870 | 271.9238 | 17,123.1163 | 14.6974 | 299.7350 | 0.0030 | 0.7140 | 695.1390 | 4.4938 | 84.0839 |
| TUN | 69.2540 | 75.2750 | 3571.9450 | 23.0214 | 293.4340 | 0.0007 | 0.1920 | 627.1390 | 1.0385 | 176.1760 |
| TUR | 75.6300 | 108.4022 | 9121.5152 | 28.3322 | 285.6730 | 0.0020 | 0.3548 | 543.2650 | 0.5421 | 159.6310 |
| TKM | 52.0480 | 12.6446 | 7612.0352 | 29.2526 | 290.4090 | 0.0006 | 0.1424 | 575.1930 | 1.4389 | 64.5967 |
| UGA | 24.3610 | 220.7739 | 798.5857 | 26.8675 | 296.7500 | 0.0048 | 0.5295 | 549.3080 | 0.6165 | 137.2290 |
| UKR | 69.4730 | 76.6072 | 3661.4563 | 15.8626 | 283.7390 | 0.0015 | 0.4390 | 569.6410 | 0.5252 | 198.9210 |
| ARE | 86.7890 | 137.5743 | 42,701.4431 | 60.7550 | 301.6990 | 0.0001 | 0.1018 | 575.1930 | 1.1469 | 216.7460 |
| GBR | 83.6520 | 276.2631 | 43,070.4984 | 9.3161 | 282.8030 | 0.0032 | 0.6187 | 618.2250 | 1.5383 | 231.0650 |
| USA | 82.4590 | 35.8932 | 65,094.7994 | 5.5864 | 281.2720 | 0.0025 | 0.3772 | 543.0490 | 0.9203 | 200.5650 |
| URY | 95.4260 | 19.7791 | 17,688.0150 | 9.6553 | 290.9350 | 0.0044 | 0.6432 | 511.6710 | 0.9447 | 97.6735 |
| UZB | 50.4330 | 76.2228 | 1784.0098 | 29.1380 | 287.4520 | 0.0007 | 0.1688 | 594.1620 | 1.1283 | 64.2448 |
| VUT | 25.3940 | 24.6007 | 3122.9826 | 7.8357 | 298.3150 | 0.0057 | 0.7847 | 685.0010 | 4.1995 | 119.4330 |
| VEN | 88.2400 | 32.3290 | 4400.0000 | 18.3805 | 298.9910 | 0.0055 | 0.6473 | 523.0590 | 1.4287 | 87.0029 |
| VNM | 36.6280 | 311.0978 | 3425.0893 | 24.7097 | 297.8150 | 0.0050 | 0.6229 | 473.6980 | 0.5059 | 157.3470 |
| YEM | 37.2730 | 55.2341 | 750.5546 | 52.8095 | 299.5080 | 0.0004 | 0.1360 | 772.2610 | 1.3657 | 128.3160 |
| ZMB | 44.0720 | 24.0265 | 1305.0010 | 22.5334 | 295.7210 | 0.0028 | 0.5334 | 718.8830 | 1.7153 | 102.2290 |
| ZWE | 32.2100 | 37.8583 | 1316.7407 | 16.2415 | 295.6630 | 0.0017 | 0.4246 | 784.6430 | 2.0616 | 94.4050 |
References
- Kaufman, Y.J.; Tanré, D.; Boucher, O. A satellite view of aerosols in the climate system. Nature 2002, 419, 215–223. [Google Scholar] [CrossRef] [PubMed]
- Zhang, Q.; Jiang, X.; Tong, D.; Davis, S.J.; Zhao, H.; Geng, G.; Feng, T.; Zheng, B.; Lu, Z.; Streets, D.G.; et al. Transboundary health impacts of transported global air pollution and international trade. Nature 2017, 543, 705–709. [Google Scholar] [CrossRef] [PubMed] [Green Version]
- Kelly, F.J.; Fussell, J.C. Air pollution and public health: Emerging hazards and improved understanding of risk. Environ. Geochem. Health 2015, 37, 631–649. [Google Scholar] [CrossRef] [PubMed] [Green Version]
- Wang, W.; Yu, T.; Ciren, P.; Jiang, P. Assessment of human health impact from PM10 exposure in China based on satellite observations. J. Appl. Remote Sens. 2015, 9, 096027. [Google Scholar] [CrossRef] [Green Version]
- Wang, J.; Xing, J.; Mathur, R.; Pleim, J.E.; Wang, S.; Hogrefe, C.; Gan, C.M.; Wong, D.C.; Hao, J. Historical Trends in PM2.5-Related Premature Mortality during 1990–2010 across the Northern Hemisphere. Environ. Health Perspect. 2017, 125, 400–408. [Google Scholar] [CrossRef] [Green Version]
- Li, J.; Liu, H.; Lv, Z.; Zhao, R.; Deng, F.; Wang, C.; Qin, A.; Yang, X. Estimation of PM2.5 mortality burden in China with new exposure estimation and local concentration-response function. Environ. Pollut. 2018, 243, 1710–1718. [Google Scholar] [CrossRef]
- Le, T.H.; Chang, Y.; Park, D. Governance, environmental vulnerability, and PM2.5 concentrations: International evidence. Energy J. 2021, 42, 1–24. [Google Scholar] [CrossRef]
- Diao, M.; Holloway, T.; Choi, S.; O’Neill, S.M.; Hamdan, M.Z.; Van, D.A.; Martin, R.V.; Jin, X.; Fiore, A.M.; Henze, D.K.; et al. Methods, availability, and applications of PM2.5 exposure estimates derived from ground measurements, satellite, and atmospheric models. J. Air Waste Manag. Assoc. 2019, 69, 1391–1414. [Google Scholar] [CrossRef]
- Wei, J.; Li, Z.; Lyapustin, A.; Sun, L.; Peng, Y.; Xue, W.; Su, T.; Cribb, M. Reconstructing 1-km-resolution high-quality PM2.5 data records from 2000 to 2018 in China: Spatiotemporal variations and policy implications. Remote Sens. Environ. 2021, 252, 112136. [Google Scholar] [CrossRef]
- Hammer, M.S.; Van Donkelaar, A.; Li, C.; Lyapustin, A.; Sayer, A.M.; Hsu, N.C.; Levy, R.C.; Garay, M.J.; Kalashnikova, O.V.; Kahn, R.A.; et al. Global estimates and long-term trends of fine particulate matter concentrations (1998–2018). Environ. Sci. Technol. 2020, 54, 7879–7890. [Google Scholar] [CrossRef]
- Yuan, M.; Song, Y.; Huang, Y.; Shen, H.; Li, T. Exploring the association between the built environment and remotely sensed PM2.5 concentrations in urban areas. J. Clean. Prod. 2019, 220, 1014–1023. [Google Scholar] [CrossRef]
- Zhang, X.; Geng, Y.; Shao, S.; Song, X.; Fan, M.; Yang, L.; Song, J. Decoupling PM2.5 emissions and economic growth in China over 1998–2016: A regional investment perspective. Sci. Total Environ. 2020, 714, 136841. [Google Scholar] [CrossRef] [PubMed]
- Wang, S.; Liu, X.; Yang, X.; Zou, B.; Wang, J. Spatial variations of PM2.5 in Chinese cities for the joint impacts of human activities and natural conditions: A global and local regression perspective. J. Clean. Prod. 2018, 203, 143–152. [Google Scholar] [CrossRef]
- Zhou, B.; Liu, D.; Yan, W. A simple new method for calculating precipitation scavenging effect on particulate matter: Based on five-year data in eastern China. Atmosphere 2021, 12, 759. [Google Scholar] [CrossRef]
- Zheng, Z.; Xu, G.; Li, Q.; Chen, C.; Li, J. Effect of precipitation on reducing atmospheric pollutant over Beijing. Atmos. Pollut. Res. 2019, 10, 1443–1453. [Google Scholar] [CrossRef]
- Wu, D.; Zhang, F.; Ge, X.; Yang, M.; Xia, J.; Liu, G.; Li, F. Chemical and light extinction characteristics of atmospheric aerosols in suburban Nanjing, China. Atmosphere 2017, 8, 149. [Google Scholar] [CrossRef] [Green Version]
- Han, L.; Zhou, W.; Li, W.; Qian, Y. Urbanization Strategy and Environmental Changes: An insight with relationship between population change and fine particulate pollution. Sci. Total Environ. 2018, 642, 789–799. [Google Scholar] [CrossRef]
- Wang, S.; Xu, L.; Ge, S.; Jiao, J.; Pan, B.; Shu, Y. Driving force heterogeneity of urban PM2.5 pollution: Evidence from the Yangtze River Delta, China. Ecol. Indic. 2020, 113, 106210. [Google Scholar] [CrossRef]
- Zhang, L.; Wilson, J.P.; MacDonald, B.; Zhang, W.; Yu, T. The changing PM2.5 dynamics of global megacities based on long-term remotely sensed observations. Environ. Int. 2020, 142, 105862. [Google Scholar] [CrossRef]
- Yang, D.; Ye, C.; Wang, X.; Lu, D.; Xu, J.; Yang, H. Global distribution and evolvement of urbanization and PM2.5 (1998–2015). Atmos. Environ. 2018, 182, 171–178. [Google Scholar] [CrossRef]
- Westervelt, D.M.; Horowitz, L.W.; Naik, V.; Tai, A.P.K.; Fiore, A.M.; Mauzerall, D.L. Quantifying PM2.5-meteorology sensitivities in a global climate model. Atmos. Environ. 2016, 142, 43–56. [Google Scholar] [CrossRef]
- Lim, C.H.; Ryu, J.; Choi, Y.; Jeon, S.W.; Lee, W. Understanding global PM2.5 concentrations and their drivers in recent decades (1998–2016). Environ. Int. 2020, 144, 106011. [Google Scholar] [CrossRef] [PubMed]
- van Donkelaar, A.; Hammer, M.S.; Bindle, L.; Brauer, M.; Brook, J.R.; Garay, M.J.; Hsu, N.C.; Kalashnikova, O.V.; Kahn, R.A.; Lee, C.; et al. Monthly global estimates of fine particulate matter and their uncertainty. Environ. Sci. Technol. 2021, 55, 15287–15300. [Google Scholar] [CrossRef] [PubMed]
- van Donkelaar, A.; Martin, R.V.; Brauer, M.; Hsu, N.C.; Kahn, R.A.; Levy, R.C.; Lyapustin, A.; Sayer, A.M.; Winker, D.M. Global estimates of fine particulate matter using a combined geophysical-statistical method with information from satellites, models, and monitors. Environ. Sci. Technol. 2016, 50, 3762–3772. [Google Scholar] [CrossRef]
- Wang, Z.; Chen, L.; Tao, J.; Zhang, Y.; Su, L. Satellite-based estimation of regional particulate matter (PM) in Beijing using vertical-and-RH correcting method. Remote Sens. Environ. 2010, 114, 50–63. [Google Scholar] [CrossRef]
- Zhao, N.; Liu, Y.; Cao, G.; Samson, E.L.; Zhang, J. Forecasting China’s GDP at the pixel level using nighttime lights time series and population images. GIScience Remote Sens. 2017, 54, 407–425. [Google Scholar] [CrossRef]
- Yu, B.; Shi, K.; Hu, Y.; Huang, C.; Chen, Z.; Wu, J. Poverty evaluation using NPP-VIIRS nighttime light composite data at the county level in China. IEEE J. Sel. Top. Appl. Earth Obs. Remote Sens. 2015, 8, 1217–1229. [Google Scholar] [CrossRef]
- Jeswani, R.; Kulshrestha, A.; Gupta, P.K.; Srivastav, S. Evaluation of the consistency of DMSP-OLS and SNPP-VIIRS Night-time Light Datasets. J. Geomat 2019, 13, 98–105. [Google Scholar]
- Chen, Z.; Yu, B.; Yang, C.; Zhou, Y.; Yao, S.; Qian, X.; Wang, C.; Wu, B.; Wu, J. An extended time series (2000–2018) of global NPP-VIIRS-like nighttime light data from a cross-sensor calibration. Earth Syst. Sci. Data 2021, 13, 889–906. [Google Scholar] [CrossRef]
- Sen, P.K. Estimates of the regressions coefficient based on Kendall’s tau. J. Am. Stat. Assoc. 1968, 63, 1379–1389. [Google Scholar] [CrossRef]
- Mann, H.B. Nonparametric test against trend. Econometrica 1945, 13, 245–259. [Google Scholar] [CrossRef]
- Kendall, M.G. Rank correlation methods. Br. J. Psychol. 1955, 25, 86–91. [Google Scholar] [CrossRef]
- Brunsdon, C.E.; Fotheringham, A.S.; Charlton, M.E. Some notes on parametric significance test for geographically weighted regression. J. Reg. Sci. 1999, 39, 497–524. [Google Scholar] [CrossRef]
- Oshan, T.M.; Smith, J.P.; Fotheringham, A.S. Targeting the spatial context of obesity determinants via multiscale geographically weighted regression. Int. J. Health Geogr. 2020, 19, 11. [Google Scholar] [CrossRef] [PubMed]
- Xiao, Q.; Geng, G.; Liang, F.; Wang, X.; Lv, Z.; Lei, Y.; Huang, X.; Zhang, Q.; Liu, Y.; He, K. Changes in spatial patterns of PM2.5 pollution in China 2000–2018: Impact of clean air policies. Environ. Int. 2020, 141, 105776. [Google Scholar] [CrossRef]
- Chen, T.F.; Chang, K.H.; Tsai, C.Y. A modelling study of assessment of the effectiveness of combining foreign and local emission control strategies. Atmos. Res. 2019, 224, 114–126. [Google Scholar] [CrossRef]
- Lurmann, F.; Avol, E.; Gilliland, F. Emissions reduction policies and recent trends in Southern California’s ambient air quality. J. Air Waste Manag. Assoc. 2015, 65, 324–335. [Google Scholar] [CrossRef] [Green Version]
- Nowak, D.J.; Crane, D.E.; Stevens, J.C. Air pollution removal by urban trees and shrubs in the United States. Urban For. Urban Green. 2006, 4, 115–123. [Google Scholar] [CrossRef]
- Wróblewska, K.; Jeong, B.R. Effectiveness of plants and green infrastructure utilization in ambient particulate matter removal. Environ. Sci. Eur. 2021, 33, 110. [Google Scholar] [CrossRef]
- McDonald, J.D.; Reed, M.D.; Campen, M.J.; Barrett, E.G.; Seagrave, J.C.; Mauderly, J.L. Health effects of inhaled gasoline engine emissions. Inhal. Toxicol. 2007, 19 (Suppl. 1), 107–116. [Google Scholar] [CrossRef]
- Song, X.P.; Hansen, M.C.; Stehman, S.V.; Potapov, P.V.; Tyukavina, A.; Vermote, E.F.; Townshend, J. Global land change from 1982 to 2016. Nature 2018, 560, 639–643. [Google Scholar] [CrossRef]
- Pande, C.B.; Moharir, K.N.; Khadri, S.F.R. Assessment of land-use and land-cover changes in Pangari watershed area (MS), India, based on the remote sensing and GIS techniques. Appl. Water Sci. 2021, 11, 96. [Google Scholar] [CrossRef]
- Zhao, X.; Sun, Y.; Zhao, C.; Jiang, H. Impact of precipitation with different intensity on PM2.5 over typical regions of China. Atmosphere 2020, 11, 906. [Google Scholar] [CrossRef]
- Piao, S.; Mohammat, A.; Fang, J.; Cai, Q.; Feng, J. NDVI-based increase in growth of temperate grasslands and its responses to climate changes in China. Glob. Environ. Chang. 2006, 16, 340–348. [Google Scholar] [CrossRef]
- Guan, Y.; Lu, H.; Jiang, Y.; Tian, P.; Qiu, L.; Pellikka, P.; Heiskanen, J. Changes in global climate heterogeneity under the 21st century global warming. Ecol. Indic. 2021, 130, 108075. [Google Scholar] [CrossRef]
- Tai, A.P.K.; Mickley, L.J.; Jacob, D.J. Correlations between fine particulate matter (PM2.5) and meteorological variables in the United States: Implications for the sensitivity of PM2.5 to climate change. Atmos. Environ. 2010, 44, 3976–3984. [Google Scholar] [CrossRef]
- Jiang, N.; Jiang, W.; Zhang, J.; Chen, H. Can national urban agglomeration construction reduce PM2.5 pollution? Evidence from a quasi-natural experiment in China. Urban Clim. 2022, 46, 101302. [Google Scholar] [CrossRef]
- Su, F.; Fu, D.; Yan, F.; Xiao, H.; Pan, T.; Xiao, Y.; Kang, L.; Zhou, C.; Meadows, M.; Lyne, V.; et al. Rapid greening response of China’s 2020 spring vegetation to COVID-19 restrictions: Implications for climate change. Sci. Adv. 2021, 7, eabe8044. [Google Scholar] [CrossRef]
- Yan, D.; Ren, X.; Zhang, W.; Li, Y.; Miao, Y. Exploring the real contribution of socioeconomic variation to urban PM2.5 pollution: New evidence from spatial heteroscedasticity. Sci. Total Environ. 2022, 806, 150929. [Google Scholar] [CrossRef]
- Salim, R.A.; Shafiei, S. Urbanization and renewable and non-renewable energy consumption in OECD countries: An empirical analysis. Econ. Model. 2014, 38, 581–591. [Google Scholar] [CrossRef] [Green Version]
- Jin, Y.; Andersson, H.; Zhang, S. Air pollution control policies in China: A retrospective and prospects. Int. J. Environ. Res. Public Health 2016, 13, 1219. [Google Scholar] [CrossRef] [Green Version]
- Jonidi, J.A.; Charkhloo, E.; Pasalari, H. Urban air pollution control policies and strategies: A systematic review. J. Environ. Health Sci. Eng. 2021, 19, 1911–1940. [Google Scholar] [CrossRef] [PubMed]
- Luo, J.; Du, P.; Samat, A.; Xia, J.; Che, M.; Xue, Z. Spatiotemporal Pattern of PM2.5 Concentrations in Mainland China and Analysis of Its Influencing Factors using Geographically Weighted Regression. Sci. Rep. 2017, 7, 40607. [Google Scholar] [CrossRef] [Green Version]
- Hajiloo, F.; Hamzeh, S.; Gheysari, M. Impact assessment of meteorological and environmental parameters on PM2.5 concentrations using remote sensing data and GWR analysis (case study of Tehran). Environ. Sci. Pollut. Res. 2019, 26, 24331–24345. [Google Scholar] [CrossRef] [PubMed]
- Liu, Q.; Wu, R.; Zhang, W.; Li, W.; Wang, S. The varying driving forces of PM2.5 concentrations in Chinese cities: Insights from a geographically and temporally weighted regression model. Environ. Int. 2020, 145, 106168. [Google Scholar] [CrossRef] [PubMed]
- Zhan, D.; Kwan, M.; Zhang, W.; Yu, X.; Meng, B.; Liu, Q. The driving factors of air quality index in China. J. Clean. Prod. 2018, 197, 1342–1351. [Google Scholar] [CrossRef]
- Zhou, N.; Dai, H.; Zha, W.; Lv, Y. The impact of meteorological factors and PM2.5 on COVID-19 transmission. Epidemiol. Infect. 2022, 150, e164. [Google Scholar] [CrossRef]
- Yang, Q.; Wang, B.; Wang, Y.; Yuan, Q.; Jin, C.; Wang, J.; Li, S.; Li, M.; Li, T.; Liu, S.; et al. Global air quality change during COVID-19: A synthetic analysis of satellite, reanalysis and ground station data. Environ. Res. Lett. 2021, 16, 074052. [Google Scholar] [CrossRef]
- Zhang, B.; Jiao, L.; Xu, G.; Zhao, S.; Tang, X.; Zhou, Y.; Gong, C. Influences of wind and precipitation on different-sized particulate matter concentrations (PM2.5, PM10, PM2.5–10). Meteorol. Atmos. Phys. 2018, 130, 383–392. [Google Scholar] [CrossRef]


| Z Value | p Value | Significance Level |
|---|---|---|
| 2.58 < |Z| | p < 0.01 | extremely significant |
| 1.96 < |Z| 2.58 | p < 0.05 | generally significant |
| 1.65 < |Z| 1.96 | p < 0.1 | slightly significant |
| |Z| 1.65 | p > 0.1 | insignificant |
| Models | R2 | Adjusted R2 | AIC | AICc | RSS |
|---|---|---|---|---|---|
| OLS | 0.648 | 0.628 | 314.139 | 317.876 | 57.715 |
| GWR | 0.786 | 0.729 | 283.407 | 303.760 | 35.054 |
| MGWR | 0.853 | 0.805 | 238.586 | 267.371 | 24.707 |
Disclaimer/Publisher’s Note: The statements, opinions and data contained in all publications are solely those of the individual author(s) and contributor(s) and not of MDPI and/or the editor(s). MDPI and/or the editor(s) disclaim responsibility for any injury to people or property resulting from any ideas, methods, instructions or products referred to in the content. |
© 2023 by the authors. Licensee MDPI, Basel, Switzerland. This article is an open access article distributed under the terms and conditions of the Creative Commons Attribution (CC BY) license (https://creativecommons.org/licenses/by/4.0/).
Share and Cite
Xu, X.; Shi, K.; Huang, Z.; Shen, J. What Factors Dominate the Change of PM2.5 in the World from 2000 to 2019? A Study from Multi-Source Data. Int. J. Environ. Res. Public Health 2023, 20, 2282. https://doi.org/10.3390/ijerph20032282
Xu X, Shi K, Huang Z, Shen J. What Factors Dominate the Change of PM2.5 in the World from 2000 to 2019? A Study from Multi-Source Data. International Journal of Environmental Research and Public Health. 2023; 20(3):2282. https://doi.org/10.3390/ijerph20032282
Chicago/Turabian StyleXu, Xiankang, Kaifang Shi, Zhongyu Huang, and Jingwei Shen. 2023. "What Factors Dominate the Change of PM2.5 in the World from 2000 to 2019? A Study from Multi-Source Data" International Journal of Environmental Research and Public Health 20, no. 3: 2282. https://doi.org/10.3390/ijerph20032282