
Rural–Urban Differences in Physical Fitness and Overweight Prevalence of Children and Adolescents from Central South China


Abstract
1. Introduction
2. Methods
2.1. Source of Data
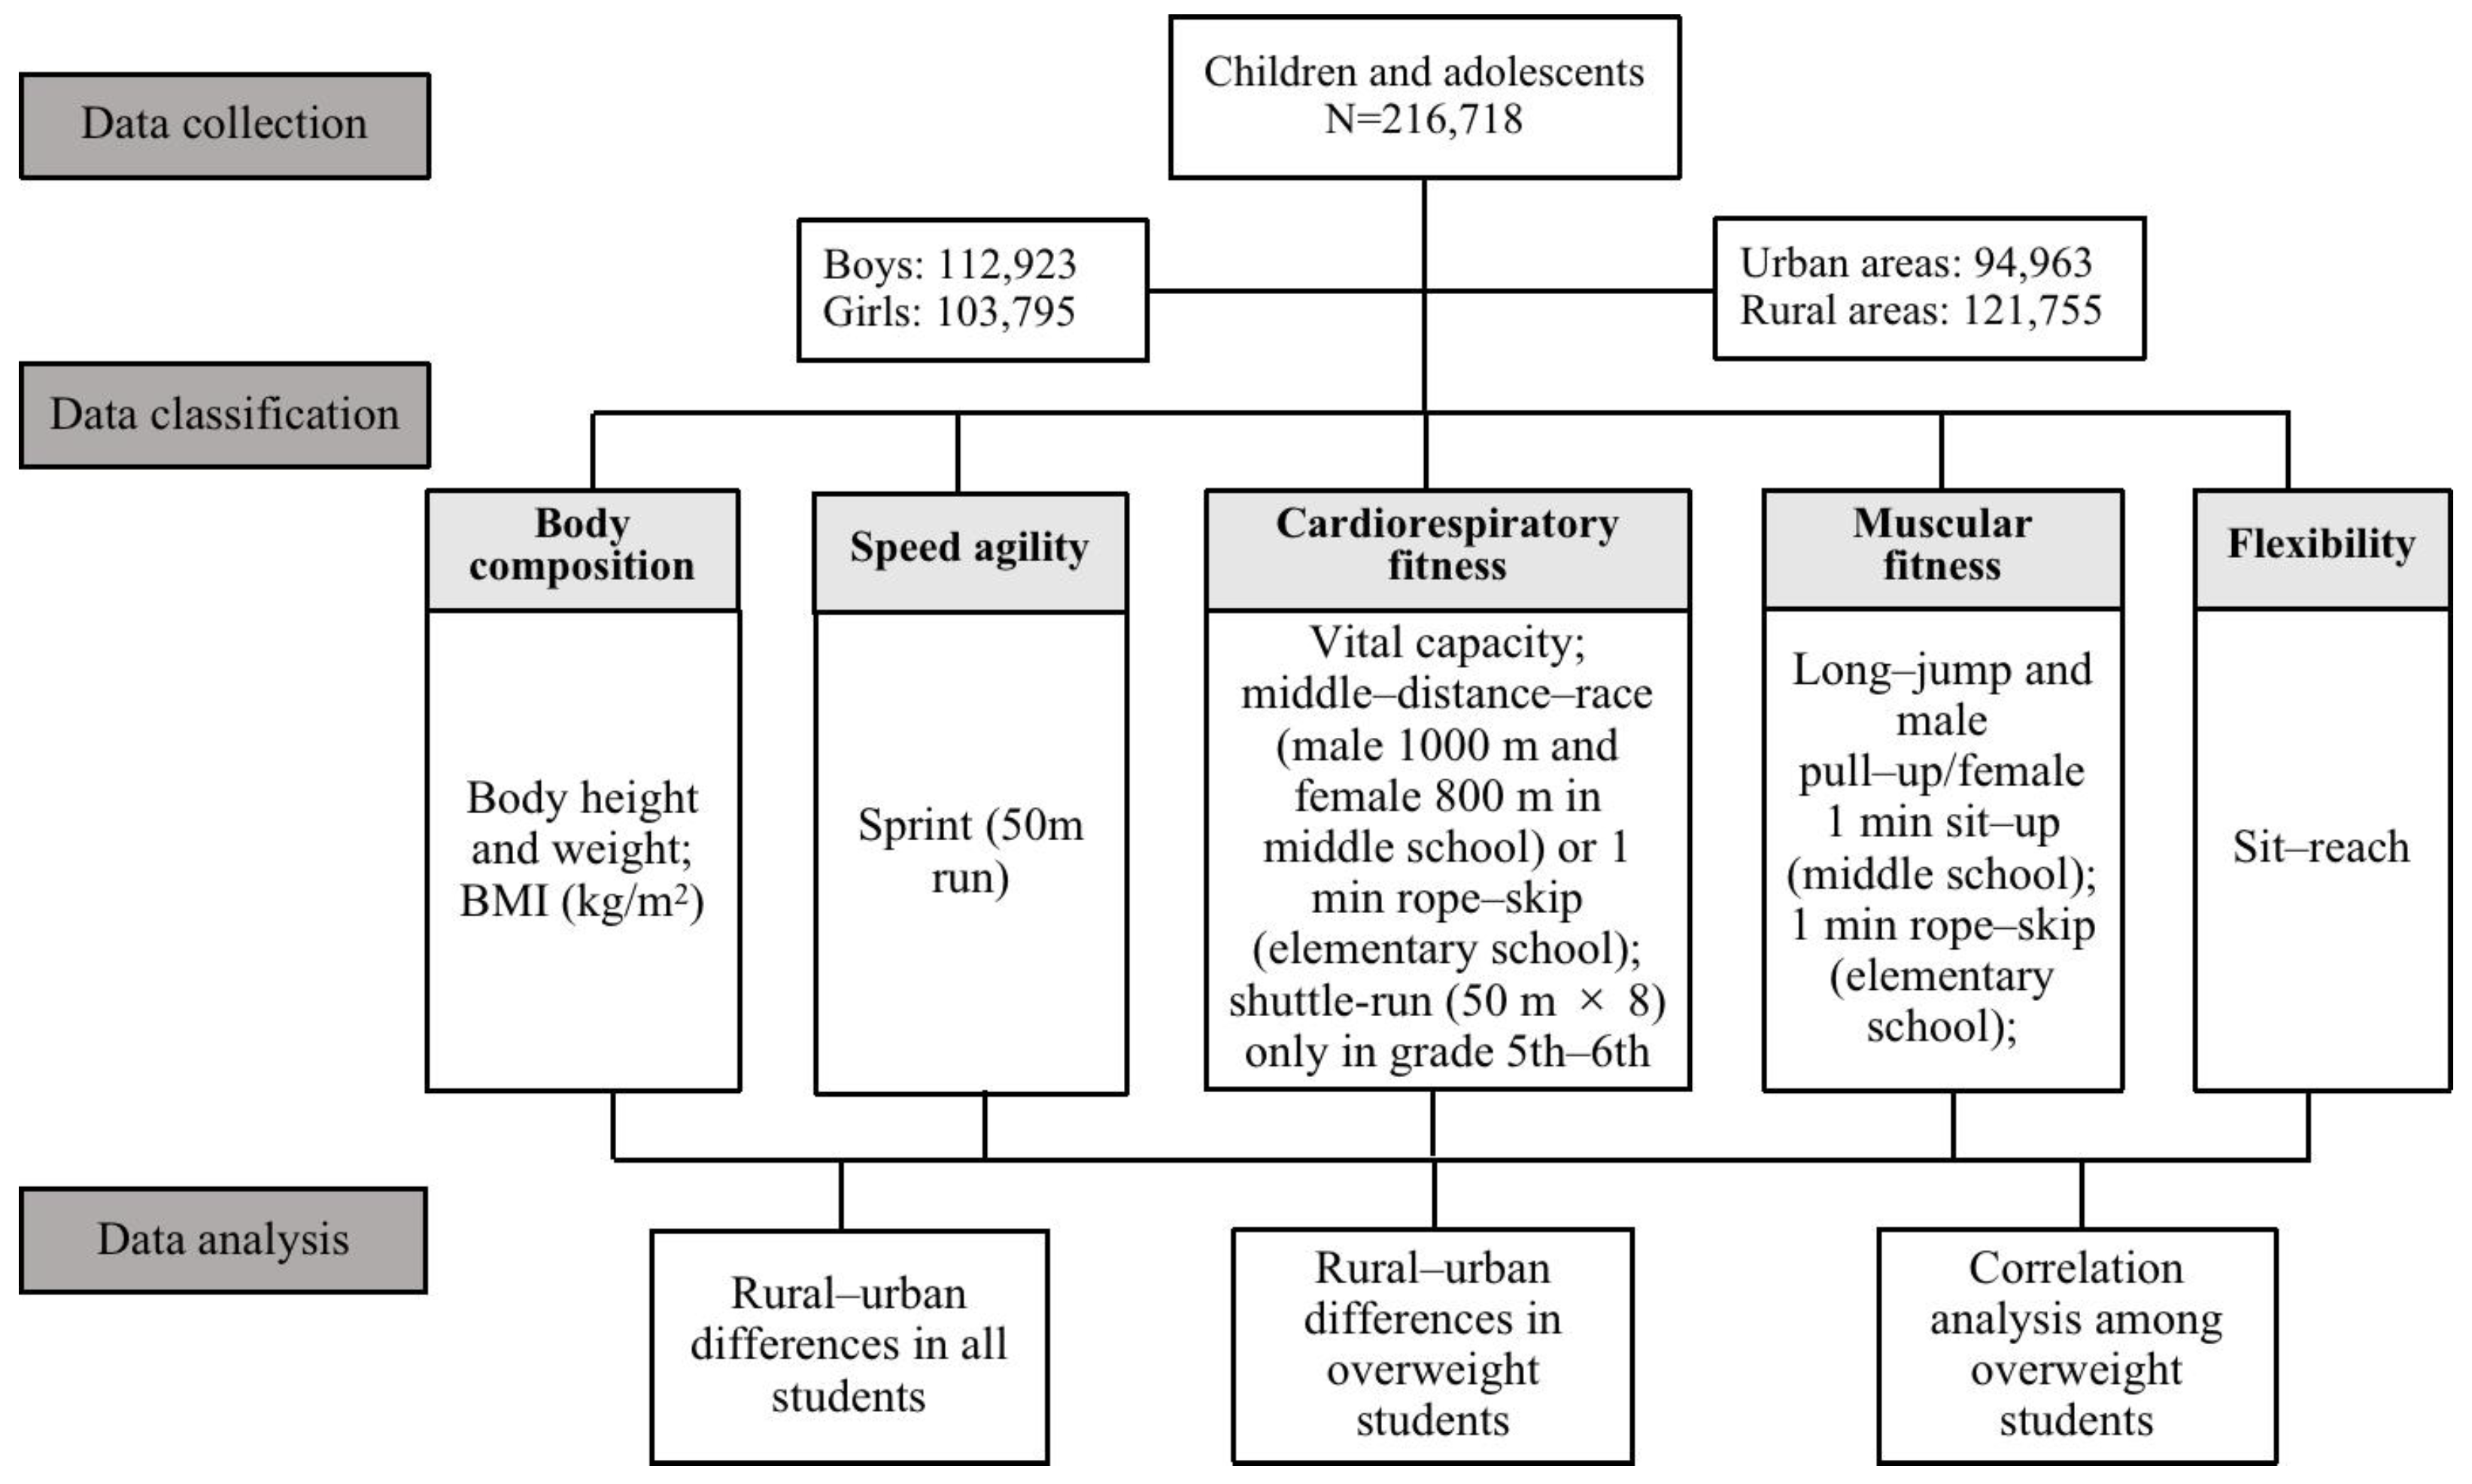
2.2. Study Design
2.3. Statistical Analysis
3. Results
3.1. Urban–Rural Disparity in Physical Fitness in Overall Samples
3.2. Overweight Prevalence of Children and Adolescents and Their Urban–Rural Disparity in Physical Fitness
3.3. Physical Fitness Correlation Analysis of Overweight Prevalence
4. Discussion
5. Limitations
6. Conclusions
Supplementary Materials
Author Contributions
Funding
Institutional Review Board Statement
Informed Consent Statement
Data Availability Statement
Acknowledgments
Conflicts of Interest
References
- Ministry of Education of the People’s Republic of China. Notice of the Ministry of Education on the National Student Physical Fitness Standards; Ministry of Education of the People’s Republic of China: Beijing, China, 2014.
- Dong, Y.; Lau, P.W.; Dong, B.; Zou, Z.; Yang, Y.; Wen, B.; Patton, G.C. Trends in physical fitness, growth, and nutritional status of Chinese children and adolescents: A retrospective analysis of 1.5 million students from six successive national surveys between 1985 and 2014. Lancet Child Adolesc. Health 2019, 3, 871–880. [Google Scholar] [CrossRef]
- Twisk, J.W.R. Predicition of cardiovascular disease risk factors later in life by physical activity and physical fitness in youth: General comments and conclusions. Int. J. Sports Exerc. Med. 2002, 23, 44–49. [Google Scholar] [CrossRef]
- Wiskemann, J.; Scharhag-Rosenberger, F. The evolving role of exercise in cancer patients: Recent developments, recommendations and future directions 2016. Future Oncol. 2016, 12, 1541–1544. [Google Scholar] [CrossRef]
- Bakker, E.A.; Sui, X.; Brellenthin, A.G.; Lee, D.C. Physical activity and fitness for the prevention of hypertension. Curr. Opin. Cardiol. 2018, 33, 394–401. [Google Scholar] [CrossRef] [PubMed]
- Belcher, B.R.; Zink, J.; Azad, A.; Campbell, C.E.; Chakravartti, S.P.; Herting, M.M. The roles of physical activity, exercise, and fitness in promoting resilience during adolescence: Effects on mental well-being and brain development. Biol. Psychiatry Cogn. Neurosci. Neuroimag. 2021, 6, 225–237. [Google Scholar] [CrossRef]
- Chillon, P.; Ortega, F.B.; Ferrando, J.A.; Casajus, J.A. Physical fitness in rural and urban children and adolescents from Spain. J. Sci. Med. Sport 2011, 14, 417–423. [Google Scholar] [CrossRef] [PubMed]
- Rivera-Ochoa, M.; Brazo-Sayavera, J.; Vizmanos-Lamotte, B.; Mañas, A.; López-Taylor, J.R.; González-Gross, M.; Guadalupe-Grau, A. Health-related factors in rural and urban Mexican adolescents from the state of Jalisco: The HELENA-MEX Study. Int. J. Environ. Res. Public Health 2020, 17, 8959. [Google Scholar] [CrossRef] [PubMed]
- Drenowatz, C.; Hinterkorner, F.; Greier, K. Physical fitness in upper Austrian children living in urban and rural areas: A cross-sectional analysis with more than 18,000 children. Int. J. Environ. Res. Public Health 2020, 17, 1045. [Google Scholar] [CrossRef]
- Patton, G.C.; Sawyer, S.M.; Santelli, J.S.; Ross, D.A.; Afifi, R.; Allen, N.B.; Arora, M.; Azzopardi, P.; Baldwin, W.; Bonell, C.; et al. Our future: A Lancet commission on adolescent health and wellbeing. Lancet 2016, 387, 2423–2478. [Google Scholar] [CrossRef] [PubMed]
- Tishukaj, F.; Shalaj, I.; Gjaka, M.; Ademi, B.; Ahmetxhekaj, R.; Bachl, N.; Tschan, H.; Wessner, B. Physical fitness and anthropometric characteristics among adolescents living in urban or rural areas of Kosovo. BMC Public Health 2017, 17, 711. [Google Scholar] [CrossRef]
- Howe, C.A.; Casapulla, S.; Shubrook, J.H.; Lopez, P.; Grijalva, M.; Berryman, D.E. Regional variations in physical fitness and activity in healthy and overweight ecuadorian adolescents. Children 2018, 5, 104. [Google Scholar] [CrossRef] [PubMed]
- WHO. Obesity and Overweight; WHO: Geneva, Switzerland, 2021. [Google Scholar]
- China Children’s Center. The Annual Report on Chinese Children’s Development; Social Sciences Academic Press: Beijing, China, 2021. [Google Scholar]
- Drenowatz, C.; Chen, S.T.; Cocca, A.; Ferrari, G.; Ruedl, G.; Greier, K. Association of body weight and physical fitness during the elementary school years. Int. J. Environ. Res. Public Health 2022, 19, 3441. [Google Scholar] [CrossRef] [PubMed]
- Marko, M.; Pawliczak, R. Obesity and asthma: Risk, control and treatment. Postepy Dermatol. Alergol. 2018, 35, 563–571. [Google Scholar] [CrossRef] [PubMed]
- Umer, A.; Kelley, G.A.; Cottrell, L.E.; Giacobbi, P.; Innes, K.E.; Lilly, C.L. Childhood obesity and adult cardiovascular disease risk factors: A systematic review with meta-analysis. BMC Public Health 2017, 17, 683. [Google Scholar] [CrossRef] [PubMed]
- Zhou, T.; Zhai, X.; Wu, N.; Koriyama, S.; Wang, D.; Jin, Y.; Fan, X. Changes in physical fitness during COVID-19 pandemic lockdown among adolescents: A longitudinal study. Healthcare 2022, 10, 351. [Google Scholar] [CrossRef]
- Hall, S.A.; Kaufman, J.S.; Ricketts, T.C. Defining urban and rural areas in U.S. epidemiologic studies. J. Urban Health 2006, 83, 162–175. [Google Scholar] [CrossRef]
- Ao, D.; Wu, F.; Yun, C.F.; Zheng, X.Y. Trends in physical fitness among 12-year-old children in urban and rural areas during the social transformation period in China. J. Adolesc. Health 2019, 64, 250–257. [Google Scholar] [CrossRef]
- Tinazci, C.; Emiroglu, O. Physical fitness of rural children compared with urban children in North Cyprus: A normative study. J. Phys. Act. Health 2009, 6, 88–92. [Google Scholar] [CrossRef]
- Hermosillo-Gallardo, M.E.; Jago, R.; Sebire, S.J. Association between urbanicity and physical activity in Mexican adolescents: The use of a composite urbanicity measure. PLoS ONE 2018, 13, e204739. [Google Scholar] [CrossRef]
- Koulouvaris, P.; Tsolakis, C.; Tsekouras, Y.E.; Donti, O.; Papagelopoulos, P.J. Obesity and physical fitness indices of children aged 5–12 years living on remote and isolated islands. Rural Remote Health 2018, 18, 4425. [Google Scholar] [CrossRef]
- China food safety information traceability platform. Research report on food nutrition status and countermeasures of Chinese children and adolescents. Available online: http://www.chinafoods.org.cn/news/202176/202176110618.html. (accessed on 21 July 2022).
- Norris, S.A.; Frongillo, E.A.; Black, M.M.; Dong, Y.; Fall, C.; Lampl, M.; Patton, G.C. Nutrition in adolescent growth and development. Lancet 2022, 399, 172–184. [Google Scholar] [CrossRef] [PubMed]
- Lee, C.K.; Sim, Y.K.; Lee, J.H.; Yook, J.S.; Ha, S.-M.; Seo, E.C.; So, W.-Y.; Kim, H.R.; Jeong, W.M.; Goo, B.O.; et al. The relationship between body composition and physical fitness and the effect of exercise according to the level of childhood obesity using the MGPA model. Int. J. Environ. Res. Public Health 2022, 19, 487. [Google Scholar] [CrossRef]
- Huang, Y.C.; Malina, R.M. Body mass index and individual physical fitness tests in Taiwanese youth aged 9–18 years. Int. J. Pediatr. Obes. 2010, 5, 404–411. [Google Scholar] [CrossRef]
- Tambalis, K.D.; Panagiotakos, D.B.; Psarra, G.; Sidossis, L.S. Concomitant associations between lifestyle characteristics and physical activity status in children and adolescents. J. Res. Health Sci. 2019, 19, e439. [Google Scholar]
- Zhang, L.; Chen, J.; Zhang, J.; Wu, W.; Huang, K.; Chen, R.; Fu, J. Regional disparities in obesity among a heterogeneous population of Chinese children and adolescents. JAMA Netw. Open 2021, 4, e2131040. [Google Scholar] [CrossRef] [PubMed]
- Pan, X.F.; Wang, L.; Pan, A. Epidemiology and determinants of obesity in China. Lancet Diabetes Endocrinol. 2021, 9, 373–392. [Google Scholar] [CrossRef] [PubMed]
- Liu, N.; Li, H.; Guo, Z.; Chen, X.; Cheng, P.; Wang, B.; Huang, G.; Shen, M.; Lin, Q.; Wu, J. Prevalence and factors associated with overweight or obesity among 2- to 6-year-old children in Hunan, China: A cross-sectional study. Public Health Nutr. 2022, 25, 3487–3498. [Google Scholar] [CrossRef] [PubMed]
- Liu, Y.; Zhao, J.; Zhong, H. Grandparental care and childhood obesity in China. SSM Popul. Health 2022, 17, 101003. [Google Scholar] [CrossRef]
- Guo, Y.; Yin, X.; Wu, H.; Chai, X.; Yang, X. Trends in overweight and obesity among children and adolescents in China from 1991 to 2015: A meta-analysis. Int. J. Environ. Res. Public Health 2019, 16, 4656. [Google Scholar] [CrossRef]
- Hu, L.; Huang, X.; You, C.; Li, J.; Hong, K.; Li, P.; Cheng, X. Prevalence of overweight, obesity, abdominal obesity and obesity-related risk factors in southern China. PLoS ONE 2017, 12, e183934. [Google Scholar] [CrossRef]
- Nurwanti, E.; Hadi, H.; Chang, J.S.; Chao, J.C.J.; Paramashanti, B.A.; Gittelsohn, J.; Bai, C.H. Rural-urban differences in dietary behavior and obesity: Results of the riskesdas study in 10–18-year-old Indonesian children and adolescents. Nutrients 2019, 11, 2813. [Google Scholar] [CrossRef] [PubMed]
- Cabanas-Sánchez, V.; Martínez-Gómez, D.; Izquierdo-Gómez, R.; Segura-Jiménez, V.; Castro-Piñero, J.; Veiga, O.L. Association between clustering of lifestyle behaviors and health-related physical fitness in youth: The UP&DOWN study. J. Pediatr. 2018, 199, 41–48. [Google Scholar] [PubMed]


| Grade | Total (N) | Boys | Girls | ||
|---|---|---|---|---|---|
| Urban (N, %) | Rural (N, %) | Urban (N, %) | Rural (N, %) | ||
| 1st–2nd | 51,148 | 12,333 (46.19) | 14,368 (53.81) | 10,832 (44.31) | 13,615 (55.69) |
| 3rd–4th | 52,368 | 10,884 (39.98) | 16,366 (60.02) | 9483 (37.75) | 15,635 (62.25) |
| 5th–6th | 42,578 | 7298 (33.07) | 14,770 (66.93) | 6213 (30.29) | 14,297 (69.71) |
| 7th–9th | 70,624 | 20,256 (54.89) | 16,648 (45.11) | 17,664 (52.38) | 16,056 (47.62) |
| Total | 216,718 | 50,771 (44.96) | 62,152 (55.04) | 44,192 (42.58) | 59,603 (57.42) |
| Grade | BMI | Vital Capacity | 50 m Run | Sit Reach | 1 min Rope Skip | 1 min Sit Up | Pull Up | Shuttle Run | Long Jump | 800 m Run | 1000 m Run |
|---|---|---|---|---|---|---|---|---|---|---|---|
| 1st–2nd | 15% | 15% | 20% | 30% | 20% | / | / | / | / | / | / |
| 3rd–4th | 20% | 20% | 10% | / | / | / | / | / | |||
| 5th–6th | 10% | 10% | 20% | / | 10% | / | / | / | |||
| 7th–9th | 10% | / | 10% (girls) | 10% (boys) | / | 10% | 20% (girls) | 20% (boys) |
| Grade | Low Weight | Normal Weight | Overweight | Obesity | ||||
|---|---|---|---|---|---|---|---|---|
| Boys | Girls | Boys | Girls | Boys | Girls | Boys | Girls | |
| 1st | ≤13.4 | ≤13.2 | 13.5~18.1 | 13.3~17.3 | 18.2~20.3 | 17.4~19.2 | ≥20.4 | ≥19.3 |
| 2nd | ≤13.6 | ≤13.4 | 13.7~18.4 | 13.5~17.8 | 18.5~20.4 | 17.9~20.2 | ≥20.5 | ≥20.3 |
| 3rd | ≤13.8 | ≤13.5 | 13.9~19.4 | 13.6~18.6 | 19.5~22.1 | 18.7~21.1 | ≥22.2 | ≥21.2 |
| 4th | ≤14.1 | ≤13.6 | 14.2~20.1 | 13.7~19.4 | 20.2~22.6 | 19.5~22.0 | ≥22.7 | ≥22.1 |
| 5th | ≤14.3 | ≤13.7 | 14.4~21.4 | 13.8~20.5 | 21.5~24.1 | 20.6~22.9 | ≥24.2 | ≥23.0 |
| 6th | ≤14.6 | ≤14.1 | 14.7~21.8 | 14.2~20.8 | 21.9~24.5 | 20.9~23.6 | ≥24.6 | ≥23.7 |
| 7th | ≤15.4 | ≤14.7 | 15.5~22.1 | 14.8~21.7 | 22.2~24.9 | 21.8~24.4 | ≥25.0 | ≥24.5 |
| 8th | ≤15.6 | ≤15.2 | 15.7~22.5 | 15.3~22.2 | 22.6~25.2 | 22.3~24.8 | ≥25.3 | ≥24.9 |
| 9th | ≤15.7 | ≤15.9 | 15.8~22.8 | 16.0~22.6 | 22.9~26.0 | 22.7~25.1 | ≥26.1 | ≥25.2 |
| Grade | Sex | Excellent | Good | Pass | Fail | ||||
|---|---|---|---|---|---|---|---|---|---|
| Urban (N, %) | Rural (N, %) | Urban (N, %) | Rural (N, %) | Urban (N, %) | Rural (N, %) | Urban (N, %) | Rural (N, %) | ||
| 1st–2nd | Boys | 2545 (20.64) | 465 (3.24) ** | 3366 (27.29) | 3013 (20.97) | 6045 (49.01) | 9768 (67.98) | 377 (3.06) | 1122 (7.81) ** |
| Girls | 2610 (24.10) | 505 (3.71) ** | 4415 (40.76) | 3723 (27.34) | 3676 (33.94) | 8649 (63.53) | 131 (1.21) | 738 (5.42) ** | |
| Total | 5155 (22.26) | 970 (3.47) ** | 7781 (33.59) | 6736 (24.07) | 9721 (41.96) | 18,417 (65.81) | 508 (2.19) | 1860 (6.65) ** | |
| 3rd–4th | Boys | 2716 (24.95) | 685 (4.19) ** | 3169 (29.12) | 3209 (19.61) | 4769 (43.82) | 11,251 (68.75) | 230 (2.11) | 1221 (7.46) ** |
| Girls | 2045 (21.56) | 487 (3.11) ** | 3723 (39.26) | 3727 (23.84) | 3619 (38.16) | 10,361 (66.27) | 96 (1.01) | 1060 (6.78) ** | |
| Total | 4761 (23.38) | 1172 (3.66) ** | 6892 (33.84) | 6936 (21.67) | 8388 (41.18) | 21,582 (67.44) | 326 (1.60) | 2281 (7.13) ** | |
| 5th–6th | Boys | 1337 (18.32) | 454 (3.07) ** | 2298 (31.49) | 3314 (22.44) | 3486 (47.77) | 9960 (67.43) | 177 (2.43) | 1042 (7.05) ** |
| Girls | 1006 (16.19) | 440 (3.08) ** | 2651 (42.67) | 4095 (28.64) | 2466 (39.69) | 9060 (63.37) | 90 (1.45) | 702 (4.91) ** | |
| Total | 2343 (17.34) | 894 (3.08) ** | 4949 (36.63) | 7409 (25.49) | 5952 (44.05) | 19,020 (65.44) | 267 (1.98) | 1744 (6.00) ** | |
| 7th–9th | Boys | 420 (2.07) | 422 (2.53) * | 2841 (14.03) | 2794 (16.78) | 13,133 (64.84) | 11,400 (68.48) | 3862 (19.07) | 2032 (12.21) ** |
| Girls | 882 (4.99) | 608 (3.79) ** | 6363 (36.02) | 5080 (31.64) | 9612 (54.42) | 9551 (59.49) | 807 (4.57) | 817 (5.09) * | |
| Total | 1302 (3.43) | 1030 (3.15) ** | 9204 (24.27) | 7874 (24.08) | 22,745 (59.98) | 20,978 (64.15) | 4669 (12.31) | 2849 (8.72) * | |
| Total | Boys | 7018 (13.82) | 2026 (3.26) ** | 11,674 (22.99) | 12,330 (19.84) | 27,433 (54.03) | 42,379 (68.18) | 4646 (9.15) | 5417 (8.72) * |
| Girls | 6543 (14.81) | 2040 (3.42) ** | 17,152 (38.81) | 16,625 (27.89) | 19,373 (43.84) | 37,621(63.12) | 1124 (2.54) | 3317 (5.57) ** | |
| Total | 13,561 (14.28) | 4066 (3.34) ** | 28,826 (30.35) | 28,955 (23.78) | 46,806 (49.29) | 80,000 (65.71) | 5770 (6.08) | 8734 (7.17) ** | |
| Grade | Sex | Low Weight | Normal Weight | Overweight | Obesity | ||||
|---|---|---|---|---|---|---|---|---|---|
| Urban (N, %) | Rural (N, %) | Urban (N, %) | Rural (N, %) | Urban (N, %) | Rural (N, %) | Urban (N, %) | Rural (N, %) | ||
| 1st–2nd | Boys | 1006 (8.16) | 1581 (11.00) ** | 9329 (75.64) | 10,764 (74.91) | 1137 (9.22) | 1013 (7.05) ** | 861 (6.98) | 1010 (7.03) |
| Girls | 1119 (10.33) | 1498 (11.00) | 8163 (75.36) | 9885 (72.60) | 1021 (9.43) | 1320 (9.70) | 529 (4.88) | 912 (6.70) ** | |
| 3rd–4th | Boys | 1010 (9.28) | 2147 (13.12) ** | 7859 (72.21) | 11,984 (73.22) | 1298 (11.93) | 1250 (7.64) ** | 717 (6.59) | 985 (6.02) |
| Girls | 913 (9.63) | 1711 (10.94) * | 7239 (76.34) | 11,702 (74.84) | 906 (9.55) | 1317 (8.42) * | 425 (4.48) | 905 (5.79) ** | |
| 5th–6th | Boys | 580 (7.95) | 1691 (11.45) ** | 5391 (73.87) | 11,110 (75.22) | 874 (11.98) | 1102 (7.46) ** | 453 (6.21) | 867 (5.87) |
| Girls | 397 (6.39) | 1078 (7.54) * | 4989 (80.30) | 11,253 (78.71) | 557 (8.97) | 1117 (7.81) * | 270 (4.35) | 849 (5.94) ** | |
| 7th–9th | Boys | 1398 (6.90) | 1674 (10.06) ** | 13,521 (66.75) | 12,326 (74.04) | 2929 (14.46) | 1586 (9.53) ** | 2408 (11.89) | 1062 (6.38) ** |
| Girls | 914 (5.17) | 1017 (6.33) ** | 13,715 (77.64) | 12,717 (79.20) | 1845 (10.44) | 1374 (8.56) ** | 1190 (6.74) | 948 (5.90) * | |
| Indicators | Grade | Sex | Excellent | Good | Pass | Fail | ||||
|---|---|---|---|---|---|---|---|---|---|---|
| Urban (N, %) | Rural (N, %) | Urban (N, %) | Rural (N, %) | Urban (N, %) | Rural (N, %) | Urban (N, %) | Rural (N, %) | |||
| Sprint | 1st–2nd | Boys | 2241 (18.17) | 2249 (15.65) ** | 812 (6.58) | 931 (6.48) | 8146 (66.05) | 8931 (62.16) | 1134 (9.19) | 2257 (15.71) ** |
| Girls | 2985 (27.56) | 3870 (28.42) | 2379 (21.96) | 2545 (18.69) | 5103 (47.11) | 6254 (45.93) | 365 (3.37) | 946 (6.95) ** | ||
| 3rd–4th | Boys | 1882 (17.29) | 2329 (14.23) ** | 884 (8.12) | 1085 (6.63) | 7326 (67.31) | 10,716 (65.48) | 792 (7.28) | 2236 (13.66) ** | |
| Girls | 977 (10.30) | 1907 (12.20) ** | 2028 (21.39) | 2917 (18.66) | 6072 (64.03) | 9460 (60.51) | 406 (4.28) | 1351 (8.64) ** | ||
| 5th–6th | Boys | 1338 (18.33) | 2410 (16.32) ** | 534 (7.32) | 990 (6.70) | 4827 (66.14) | 9852 (66.70) | 599 (8.21) | 1518 (10.28) ** | |
| Girls | 504 (8.11) | 1713 (11.98) ** | 1250 (20.12) | 2920 (20.42) | 4075 (65.59) | 8668 (60.63) | 384 (6.18) | 996 (6.97) * | ||
| 7th–9th | Boys | 5202 (25.68) | 3928 (23.59) ** | 1758 (8.68) | 1384 (8.31) | 11,777 (58.14) | 10,242 (61.52) | 1519 (7.50) | 1094 (6.57) ** | |
| Girls | 2149 (12.17) | 3152 (19.63) ** | 3881 (21.97) | 3939 (24.53) | 10,666 (60.38) | 8315 (51.79) | 968 (5.48) | 650 (4.05) ** | ||
| Indicators | Grade | Sex | Excellent | Good | Pass | Fail | ||||
|---|---|---|---|---|---|---|---|---|---|---|
| Urban (N, %) | Rural (N, %) | Urban (N, %) | Rural (N, %) | Urban (N, %) | Rural (N, %) | Urban (N, %) | Rural (N, %) | |||
| Vital capacity | 1st–2nd | Boys | 1825 (14.80) | 1126 (7.84) ** | 2632 (21.34) | 1631 (11.35) | 7567 (61.36) | 10,073 (70.11) | 309 (2.51) | 1538 (10.70) ** |
| Girls | 3856 (35.60) | 3172 (23.30) ** | 2931 (27.06) | 3111 (22.85) | 3906 (36.06) | 6413 (47.10) | 139 (1.28) | 919 (6.75) ** | ||
| 3rd–4th | Boys | 1246 (11.45) | 897 (5.48) ** | 2952 (27.12) | 2710 (16.56) | 6289 (57.78) | 11,016 (67.31) | 398 (3.66) | 1740 (10.63) ** | |
| Girls | 3323 (35.04) | 3801 (24.31) ** | 1904 (20.08) | 2731 (17.47) | 4135 (43.60) | 8197 (52.43) | 121 (1.28) | 906 (5.79) ** | ||
| 5th–6th | Boys | 807 (11.06) | 1046 (7.08) ** | 2090 (28.64) | 1981 (13.41) | 4111 (56.33) | 9572 (64.81) | 290 (3.97) | 2171 (14.70) ** | |
| Girls | 2607 (41.96) | 3354 (23.46) ** | 1130 (18.19) | 2246 (15.71) | 2403 (38.68) | 7765 (54.31) | 73 (1.17) | 932 (6.52) ** | ||
| 7th–9th | Boys | 4701 (23.21) | 1209 (7.26) ** | 3798 (18.75) | 2101 (12.62) | 10,123 (49.98) | 9943 (59.72) | 1634 (8.07) | 3395 (20.39) ** | |
| Girls | 6916 (39.15) | 3948 (24.59) ** | 2795 (15.82) | 2017 (12.56) | 7320 (41.44) | 8134 (50.66) | 633 (3.58) | 1957 (12.19) ** | ||
| 1 min rope skip | 1st–2nd | Boys | 4615 (37.42) | 1115 (7.76) ** | 1453 (11.78) | 1251 (8.71) | 6105 (49.50) | 10,421 (72.53) | 160 (1.30) | 1581 (11.00) ** |
| Girls | 3741 (34.54) | 774 (5.68) ** | 1927 (17.79) | 1553 (11.41) | 5075 (46.85) | 9953 (73.10) | 89 (0.82) | 1335 (9.81) ** | ||
| 3rd–4th | Boys | 5180 (47.59) | 1710 (10.45) ** | 1338 (12.29) | 1327 (8.11) | 4260 (39.14) | 11,694 (71.45) | 106 (0.97) | 1635 (9.99) ** | |
| Girls | 4085 (43.08) | 1206 (7.71) ** | 1784 (18.81) | 1587 (10.15) | 3563 (37.57) | 11,311 (72.34) | 51 (0.54) | 1531 (9.79) ** | ||
| 5th–6th | Boys | 2804 (38.42) | 1169 (7.91) ** | 1082 (14.83) | 1082 (7.33) | 3237 (44.35) | 10,758 (72.84) | 175 (2.40) | 1761 (11.92) ** | |
| Girls | 2199 (35.39) | 962 (6.73) ** | 1313 (21.13) | 1303 (9.11) | 2627 (42.28) | 10,600 (74.14) | 74 (1.19) | 1432 (10.02) ** | ||
| Shuttle run | 5th–6th | Boys | 1089 (14.92) | 2105 (14.25) * | 1061 (14.54) | 1835 (12.42) | 4603 (63.07) | 9096 (61.58) | 545 (7.47) | 1734 (11.74) ** |
| Girls | 1180 (18.99) | 3239 (22.66) ** | 1055 (16.98) | 2344 (16.40) | 3752 (60.39) | 7568 (52.93) | 226 (3.64) | 1146 (8.02) ** | ||
| Middle distance race | 7th–9th | Boys | 2161 (10.67) | 2827 (16.98) ** | 2708 (13.37) | 2550 (15.32) | 10,058 (49.65) | 8394 (50.42) | 5329 (26.31) | 2877 (17.28) ** |
| Girls | 2335 (13.22) | 2421 (15.08) ** | 3217 (18.21) | 2974 (18.52) | 9686 (54.83) | 8435 (52.53) | 2426 (13.73) | 2226 (13.86) | ||
| Cardiorespiratory fitness | 1st–2nd | Boys | 2612 (21.18) | 380 (2.64) ** | 3086 (25.04) | 1354 (9.42) | 6354 (51.52) | 10,337 (71.94) | 281 (2.28) | 2297 (15.99) ** |
| Girls | 2837 (26.19) | 504 (3.70) ** | 3324 (30.69) | 2001 (14.70) | 4531 (41.83) | 9378 (68.88) | 140 (1.29) | 1732 (12.72) ** | ||
| 3rd–4th | Boys | 2814 (25.85) | 720 (4.40) ** | 3314 (30.45) | 1736 (10.61) | 4543 (41.74) | 11,373 (69.49) | 213 (1.96) | 2537 (15.50) ** | |
| Girls | 2914 (30.73) | 841 (5.38) ** | 3169 (33.42) | 2510 (16.05) | 3278 (34.57) | 10,216 (65.34) | 122 (1.29) | 2068 (13.23) ** | ||
| 5th–6th | Boys | 389 (5.33) | 557 (3.77) ** | 1576 (21.59) | 2219 (15.02) | 4779 (65.48) | 9170 (62.09) | 554 (7.59) | 2824 (19.12) ** | |
| Girls | 852 (13.71) | 1723 (12.05) ** | 2244 (36.12) | 3608 (25.24) | 2904 (46.74) | 7398 (51.75) | 213 (3.43) | 1568 (10.97) ** | ||
| 7th–9th | Boys | 1240 (6.12) | 805 (4.84) ** | 3436 (16.96) | 2583 (15.52) | 10,688 (52.76) | 9189 (55.20) | 4892 (24.15) | 4071 (24.45) | |
| Girls | 1805 (10.22) | 1358 (8.46) ** | 4755 (26.92) | 3439 (21.42) | 8931 (50.56) | 8223 (51.21) | 2173 (12.30) | 3036 (18.91) ** | ||
| Indicators | Grade | Sex | Excellent | Good | Pass | Fail | ||||
|---|---|---|---|---|---|---|---|---|---|---|
| Urban (N, %) | Rural (N, %) | Urban (N, %) | Rural (N, %) | Urban (N, %) | Rural (N, %) | Urban (N, %) | Rural (N, %) | |||
| 1 min rope-skip | 1st–2nd | Boys | 4615 (37.42) | 1115 (7.76) ** | 1453 (11.78) | 1251 (8.71) | 6105 (49.50) | 10,421 (72.53) | 160 (1.30) | 1581 (11.00) ** |
| Girls | 3741 (34.54) | 774 (5.68) ** | 1927 (17.79) | 1553 (11.41) | 5075 (46.85) | 9953 (73.10) | 89 (0.82) | 1335 (9.81) ** | ||
| 3rd–4th | Boys | 5180 (47.59) | 1710 (10.45) ** | 1338 (12.29) | 1327 (8.11) | 4260 (39.14) | 11,694 (71.45) | 106 (0.97) | 1635 (9.99) ** | |
| Girls | 4085 (43.08) | 1206 (7.71) ** | 1784 (18.81) | 1587 (10.15) | 3563 (37.57) | 11,311 (72.34) | 51 (0.54) | 1531 (9.79) ** | ||
| 5th–6th | Boys | 2804 (38.42) | 1169 (7.91) ** | 1082 (14.83) | 1082 (7.33) | 3237 (44.35) | 10,758 (72.84) | 175 (2.40) | 1761 (11.92) ** | |
| Girls | 2199 (35.39) | 962 (6.73) ** | 1313 (21.13) | 1303 (9.11) | 2627 (42.28) | 10,600 (74.14) | 74 (1.19) | 1432 (10.02) ** | ||
| Pull-up/1 min Sit-up | 3rd–4th | Boys | 1304 (11.98) | 1313 (8.02) ** | 1836 (16.87) | 2103 (12.85) | 7357 (67.59) | 11,736 (71.71) | 387 (3.56) | 1214 (7.42) ** |
| Girls | 1109 (11.69) | 1133 (7.25) ** | 1662 (17.53) | 1996 (12.77) | 6380 (67.28) | 11,223 (71.78) | 332 (3.50) | 1283 (8.21) ** | ||
| 5th–6th | Boys | 1436 (19.68) | 1752 (11.86) ** | 1457 (19.96) | 2370 (16.05) | 4168 (57.11) | 9734 (65.90) | 237 (3.25) | 914 (6.19) ** | |
| Girls | 1081 (17.40) | 1558 (10.90) ** | 1301 (20.94) | 2045 (14.30) | 3740 (60.20) | 9835 (68.79) | 91 (1.46) | 859 (6.01) ** | ||
| 7th–9th | Boys | 387 (1.91) | 766 (4.60) ** | 317 (1.56) | 720 (4.32) | 3580 (17.67) | 5806 (34.88) | 15,972 (78.85) | 9356 (56.20) ** | |
| Girls | 1775 (10.05) | 776 (4.83) ** | 3382 (19.15) | 2086 (12.99) | 12,053 (68.23) | 11,805 (73.52) | 454 (2.57) | 1389 (8.65) ** | ||
| Long-jump | 7th–9th | Boys | 1375 (6.79) | 1072 (6.44) | 2568(12.68) | 2283 (13.71) | 12,190(60.18) | 9652 (57.98) | 4123 (20.35) | 3641 (21.87) ** |
| Girls | 2160 (12.23) | 3063 (19.08) ** | 3456 (19.57) | 3843 (23.93) | 9794 (55.45) | 7782 (48.47) | 2254 (12.76) | 1368 (8.52) ** | ||
| Muscular fitness | 1st–2nd | Boys | / | / | / | / | / | / | / | / |
| Girls | / | / | / | / | / | / | / | / | ||
| 3rd–4th | Boys | 3459 (31.78) | 895 (5.47) ** | 2570 (23.61) | 1764 (10.78) | 4621 (42.46) | 11,560 (70.63) | 234 (2.15) | 2147 (13.12) ** | |
| Girls | 2445 (25.78) | 513 (3.28) ** | 2697 (28.44) | 1743 (11.15) | 4176 (44.04) | 11,282 (72.16) | 165 (1.74) | 2097 (13.41) ** | ||
| 5th–6th | Boys | 1262 (17.29) | 605 (4.10) ** | 2241 (30.71) | 2250 (15.23) | 3535 (48.44) | 9999 (67.70) | 260 (3.56) | 1916 (12.97) ** | |
| Girls | 961 (15.47) | 516 (3.61) ** | 1877 (30.21) | 1872 (13.09) | 3266 (52.57) | 10,211 (71.42) | 109 (1.75) | 1698 (11.88) ** | ||
| 7th–9th | Boys | 133 (0.66) | 239 (1.44) ** | 2340 (11.55) | 3583 (21.52) | 2736 (13.51) | 3649 (21.92) | 15,047 (74.28) | 9177 (55.12) ** | |
| Girls | 932 (5.28) | 670 (4.17) ** | 11,291 (63.92) | 10,379 (64.64) | 3587 (20.31) | 3059 (19.05) | 1854 (10.50) | 1948 (12.13) ** | ||
| Indicators | Grade | Sex | Excellent | Good | Pass | Fail | ||||
|---|---|---|---|---|---|---|---|---|---|---|
| Urban (N, %) | Rural (N, %) | Urban (N, %) | Rural (N, %) | Urban (N, %) | Rural (N, %) | Urban (N, %) | Rural (N, %) | |||
| Sit-reach | 1st–2nd | Boys | 2044 (16.57) | 2421 (16.85) | 1610 (13.05) | 2228 (15.51) | 8228 (66.72) | 9440 (65.70) | 451 (3.66) | 279 (1.94) ** |
| Girls | 2570 (23.73) | 1199 (8.81) ** | 2043 (18.86) | 1694 (12.44) | 5782 (53.38) | 9805 (72.02) | 437 (4.03) | 917 (6.74) ** | ||
| 3rd–4th | Boys | 1402 (12.88) | 2925(17.87) ** | 1931 (17.74) | 3848 (23.51) | 7232 (66.45) | 9258 (56.57) | 319(2.93) | 334 (2.04) ** | |
| Girls | 2013 (21.23) | 1612 (10.31) ** | 1859 (19.60) | 2444 (15.63) | 5126 (54.05) | 10,581 (67.68) | 485 (5.11) | 998 (6.38) ** | ||
| 5th–6th | Boys | 908 (12.44) | 2799 (18.95) ** | 1576 (21.59) | 3999 (27.08) | 4523 (61.98) | 7766 (52.58) | 291 (3.99) | 206 (1.39) ** | |
| Girls | 1299 (20.91) | 1716 (12.00) ** | 1524 (24.53) | 3059 (21.40) | 3043 (48.98) | 8718 (60.98) | 347 (5.59) | 804 (5.62) | ||
| 7th–9th | Boys | 2051 (10.13) | 1896 (11.39) ** | 2641 (13.04) | 2687 (16.14) | 13,319 (65.75) | 11,252 (67.59) | 2245 (11.08) | 813 (4.88) ** | |
| Girls | 3238 (18.33) | 1460 (9.09) ** | 2827 (16.00) | 2040 (12.71) | 10,032 (56.79) | 11,013 (68.59) | 1567 (8.87) | 1543 (9.61) * | ||
| Grade | Residence | Boys | Girls | ||||
|---|---|---|---|---|---|---|---|
| Height (cm) | Weight (kg) | BMI (kg/m2) | Height (cm) | Weight (kg) | BMI (kg/m2) | ||
| 1st–2nd | Urban | 126.97 ± 0.16 | 33.88 ± 0.14 | 20.97 ± 0.08 | 124.22 ± 0.19 ## | 30.92 ± 0.20 ## | 19.98 ± 0.13 ## |
| Rural | 122.52 ± 0.19 ** | 32.27 ± 0.16 ** | 21.41 ± 0.09 ** | 120.82 ± 0.18 **## | 30.14 ± 0.16 *## | 20.59 ± 0.1 **## | |
| 3rd–4th | Urban | 138.49 ± 0.16 | 43 ± 0.16 | 22.34 ± 0.07 | 137.14 ± 0.21 ## | 40.52d ± 0.20 ## | 21.48 ± 0.08 ## |
| Rural | 134.82 ± 0.17 ** | 42.2 ± 0.19 * | 23.12 ± 0.08 ** | 134.30 ± 0.17 **# | 40.11 ± 0.18 ## | 22.12 ± 0.08 **## | |
| 5th–6th | Urban | 150.17 ± 0.22 | 54.78 ± 0.26 | 24.19 ± 0.09 | 150.15 ± 0.26 | 52.26 ± 0.28 ## | 23.11 ± 0.09 ## |
| Rural | 146.57 ± 0.20 ** | 53.65 ± 0.23 * | 24.85 ± 0.08 ** | 146.35 ± 0.21 ** | 51.77 ± 0.26 ## | 24.03 ± 0.09 **## | |
| 7th–9th | Urban | 164.98 ± 0.12 | 70.67 ± 0.16 | 25.85 ± 0.43 | 158.91 ± 0.11 ## | 63.29 ± 0.17 ## | 25 ± 0.05 ## |
| Rural | 159.58 ± 0.20 ** | 65.47 ± 0.22 ** | 25.58 ± 0.56 ** | 155.32 ± 0.17 **## | 60.49 ± 0.20 **## | 25 ± 0.06 ## | |
| Grade | Residence | Boys | Girls | ||
|---|---|---|---|---|---|
| Sprint (s) | Speed Agility | Sprint (s) | Speed Agility | ||
| 1st–2nd | Urban | 11.34 ± 0.03 | 67.53 ± 21.13 | 11.53 ± 0.03 ## | 78.11 ± 16.78 ## |
| Rural | 11.50 ± 0.04 ** | 64.53 ± 26.74 ** | 11.71 ± 0.04 **## | 74.33 ± 24.50 **## | |
| 3rd–4th | Urban | 10.37 ± 1.07 | 66.74 ± 19.84 | 10.50 ± 0.93 ## | 70.94 ± 15.00 ## |
| Rural | 10.42 ± 1.31 | 65.84 ± 22.06 | 10.61 ± 1.55 *## | 69.63 ± 20.95 *## | |
| 5th–6th | Urban | 9.79 ± 1.01 | 65.94 ± 19.97 | 9.85 ± 0.95 | 70.05 ± 15.97 ## |
| Rural | 9.77 ± 1.30 | 67.00 ± 21.91 | 9.86 ± 1.33 # | 69.67 ± 19.93 ## | |
| 7th–9th | Urban | 8.78 ± 1.38 | 70.68 ± 21.88 | 9.55 ± 1.39 ## | 71.08 ± 18.91 |
| Rural | 8.58 ± 1.07 ** | 73.72 ± 19.07 ** | 9.11 ± 1.11 **## | 76.53 ± 17.05 **## | |
| Grade | Residence | Boys | Girls | ||||||
|---|---|---|---|---|---|---|---|---|---|
| Vital Capacity (mL) | Shuttle-Run/Middle-Distance-Race (s) | 1 min Rope-Skip (N) | Cardiorespiratory Fitness | Vital Capacity (mL) | Shuttle-Run/Middle-Distance-Race (s) | 1 min Rope-Skip (N) | Cardiorespiratory Fitness | ||
| 1st–2nd | Urban | 1378.19 ± 9.07 | / | 87.92 ± 0.90 | 79.09 ± 10.64 | 1265.61 ± 10.25 ## | / | 91.23 ± 0.94 # | 82.23 ± 10.05 ## |
| Rural | 1294.47 ± 20.36 ** | / | 55.19 ± 0.77 ** | 67.31 ± 13.04 ** | 1250.91 ± 19.72 | / | 57.30 ± 0.74 **# | 70.88 ± 12.92 **## | |
| 3rd–4th | Urban | 1824.14 ± 12.0 | / | 111.46 ± 0.8 | 80.95 ± 10.37 | 1665.62 ± 13.64 ## | / | 117.90 ± 0.92 ## | 83.46 ± 10.14 ## |
| Rural | 1640.82 ± 18.18 ** | / | 77.95 ± 0.71 ** | 68.07 ± 14.64 ** | 1661.30 ± 22.70 | / | 84.68 ± 0.78 **## | 70.79 ± 14.99 **## | |
| 5th–6th | Urban | 2405.21 ± 15.79 | 120.87 ± 0.44 | 128.48 ± 0.87 | 74.42 ± 10.52 | 2287.76 ± 20.53 ## | 120.36 ± 0.53 | 131.03 ± 0.99 | 80.97 ± 10.55 ## |
| Rural | 2074.58 ± 18.25 ** | 120.03 ± 0.49 | 114.06 ± 0.83 ** | 67.78 ± 15.0 ** | 1966.05 ± 18.81 **## | 120.77 ± 0.52 | 117.18 ± 0.77 **# | 74.82 ± 15.09 **## | |
| 7th–9th | Urban | 3404.33 ± 15.43 | 306.53 ± 0.74 | / | 69.32 ± 15.46 | 2766.57 ± 14.33 ## | 269.47 ± 0.65 | / | 75.19 ± 14.02 ## |
| Rural | 2736.84 ± 16.19** | 287.20 ± 0.91 ** | / | 67.93 ± 14.96 ** | 2369.61 ± 14.3 3**## | 266.41 ± 0.83 * | / | 71.31 ± 15.81 **## | |
| Grade | Residence | Boys | Girls | ||||||
|---|---|---|---|---|---|---|---|---|---|
| Long Jump (mL) | 1 min Rope Skip (N) | Pull Up/Sit Up (N) | Muscular Fitness | Long Jump (mL) | 1 min Rope Skip (N) | Pull Up/Sit Up (N) | Muscular Fitness | ||
| 1st–2nd | Urban | / | 87.92 ± 0.90 | / | 80.09 ± 15.09 | / | 91.23 ± 0.94 # | / | 80.83 ± 12.94 |
| Rural | / | 55.19 ± 0.77 ** | / | 66.56 ± 18.33 ** | / | 57.30 ± 0.74 **# | / | 66.64 ± 17.08 ** | |
| 3rd–4th | Urban | / | 111.46 ± 0.8 | 28.87 ± 0.20 | 78.97 ± 12.01 | / | 117.90 ± 0.92 ## | 29.60 ± 0.26 # | 79.21 ± 11.20 |
| Rural | / | 77.95 ± 0.71 ** | 27.07 ± 0.20 ** | 67.51 ± 16.02 ** | / | 84.68 ± 0.78 **## | 27.31 ± 0.21 ** | 67.86 ± 15.70 ** | |
| 5th–6th | Urban | / | 128.48 ± 0.87 | 33.65 ± 0.26 | 76.39 ± 11.31 | / | 131.03 ± 0.99 | 34.10 ± 0.33 | 77.11 ± 10.51 |
| Rural | / | 114.06 ± 0.83 ** | 30.07 ± 0.24 ** | 67.07 ± 15.40 ** | / | 117.18 ± 0.77 **# | 30.05 ± 0.22 ** | 68.00 ± 13.54 **# | |
| 7th–9th | Urban | 181.5 ± 0.36 | / | 1.59 ± 0.04 | 37.89 ± 18.62 | 159.24 ± 0.38 ## | / | 34.29 ± 0.14 ## | 69.32 ± 12.47 ## |
| Rural | 182.9 ± 0.49 * | / | 3.69 ± 0.08 ** | 49.14 ± 18.38 ** | 166.13 ± 0.45 **## | / | 31.13 ± 0.21 **## | 69.36 ± 14.24 ## | |
| Grade | Residence | Boys | Girls | ||
|---|---|---|---|---|---|
| Sit Reach (cm) | Flexibility | Sit Reach (cm) | Flexibility | ||
| 1st–2nd | Urban | 7.85 ± 0.12 | 73.82 ± 14.86 | 11.89 ± 0.13 ## | 77.42 ± 14.44 ## |
| Rural | 8.48 ± 0.14 ** | 75.50 ± 12.83 ** | 9.5 ± 0.13 **## | 71.33 ± 13.74 **## | |
| 3rd–4th | Urban | 6.83 ± 0.2 | 74.32 ± 13.65 | 10.83 ± 0.16 ## | 76.59 ± 15.36 ## |
| Rural | 8.56 ± 0.13 ** | 77.36 ± 12.50 ** | 10.55 ± 0.14 **## | 72.48 ± 14.78 **## | |
| 5th–6th | Urban | 6.02 ± 0.16 | 74.43 ± 14.31 | 11.37 ± 0.22 ## | 75.99 ± 17.53 ## |
| Rural | 8.23 ± 0.15 ** | 78.42 ± 12.0 ** | 10.49 ± 0.16 *## | 73.10 ± 15.58 **## | |
| 7th–9th | Urban | 6.21 ± 0.10 | 68.30 ± 20.32 | 12.26 ± 0.14 ## | 72.31 ± 20.17 ## |
| Rural | 8.07 ± 0.12 ** | 72.82 ± 14.81 ** | 10.61 ± 0.14 **## | 69.07 ± 17.88 **## | |
| Sex | Physical Fitness | BMI | Residence | Sex |
|---|---|---|---|---|
| 1st–2nd | Speed agility | −0.058 ** | −0.084 ** | 0.217 ** |
| Muscular fitness | −0.017 ** | −0.416 ** | 0.008 ** | |
| Cardiorespiratory fitness | −0.054 ** | −0.398 ** | 0.083 ** | |
| Flexibility | −0.008 ** | −0.083 ** | −0.031 * | |
| 3rd–4th | Speed agility | −0.071** | −0.089 ** | 0.07 ** |
| Muscular fitness | −0.012 ** | −0.419 ** | −0.024 ** | |
| Cardiorespiratory fitness | −0.071 ** | −0.395 ** | 0.067 ** | |
| Flexibility | 0.007 | 0.047 ** | −0.045 ** | |
| 5th–6th | Speed agility | −0.078 ** | −0.027 ** | 0.036 ** |
| Muscular fitness | −0.064 ** | −0.335 ** | 0.009 ** | |
| Cardiorespiratory fitness | −0.017 * | −0.169 ** | 0.210 ** | |
| Flexibility | 0.044 ** | 0.039 * | −0.069 ** | |
| 7th–9th | Speed agility | −0.077 ** | 0.047 ** | 0.015 ** |
| Muscular fitness | −0.193 ** | 0.128 ** | 0.567 ** | |
| Cardiorespiratory fitness | −0.108 ** | −0.035 ** | 0.151 ** | |
| Flexibility | −0.075 ** | 0.044 ** | 0.036 ** |
Disclaimer/Publisher’s Note: The statements, opinions and data contained in all publications are solely those of the individual author(s) and contributor(s) and not of MDPI and/or the editor(s). MDPI and/or the editor(s) disclaim responsibility for any injury to people or property resulting from any ideas, methods, instructions or products referred to in the content. |
© 2023 by the authors. Licensee MDPI, Basel, Switzerland. This article is an open access article distributed under the terms and conditions of the Creative Commons Attribution (CC BY) license (https://creativecommons.org/licenses/by/4.0/).
Share and Cite
Jiang, Q.; Huang, X.; Cui, D. Rural–Urban Differences in Physical Fitness and Overweight Prevalence of Children and Adolescents from Central South China. Int. J. Environ. Res. Public Health 2023, 20, 2390. https://doi.org/10.3390/ijerph20032390
Jiang Q, Huang X, Cui D. Rural–Urban Differences in Physical Fitness and Overweight Prevalence of Children and Adolescents from Central South China. International Journal of Environmental Research and Public Health. 2023; 20(3):2390. https://doi.org/10.3390/ijerph20032390
Chicago/Turabian StyleJiang, Qing, Xin Huang, and Di Cui. 2023. "Rural–Urban Differences in Physical Fitness and Overweight Prevalence of Children and Adolescents from Central South China" International Journal of Environmental Research and Public Health 20, no. 3: 2390. https://doi.org/10.3390/ijerph20032390
APA StyleJiang, Q., Huang, X., & Cui, D. (2023). Rural–Urban Differences in Physical Fitness and Overweight Prevalence of Children and Adolescents from Central South China. International Journal of Environmental Research and Public Health, 20(3), 2390. https://doi.org/10.3390/ijerph20032390