1. Introduction
In 2020, China pledged to the international community that it would strive for a peak in carbon emissions by 2030 and work toward achieving carbon neutrality by 2060 (
http://www.xinhuanet.com/ (accessed on 15 December 2022)). To realize this goal, all sectors of society have actively contributed ideas and solutions, relevant enterprises have quickly released their carbon peaking and carbon-neutral plans, and various provinces (municipalities and autonomous regions) have included relevant action plans in their government work reports.
China is a major emitter of carbon dioxide, and the IEA statistical report shows that China’s CO
2 emissions accounted for33% (
https://www.iea.org/reports/global-energy-review-co2-emissions-in-2021-2 (accessed on 15 December 2022)) of the total global CO
2 emissions in 2021 There is no doubt that China is under great pressure to reduce carbon dioxide emissions. Furthermore, to achieve the dual carbon target, it is necessary to decompose and implement the responsibility of carbon emission reduction to each province and region. However, China is a vast country with large differences in geographic distributions, resource patterns, industrial structures, and economic development levels among regions, and these regions have strong spatial correlations. The extensive and close economic and trade ties between provinces and regions may lead to a spatial transfer of carbon emissions, thus affecting the total carbon emissions of each province. Economically developed regions transfer high-carbon-emission products from less developed provincial regions through inter-regional trade. The less developed provincial regions produce such products for a long time based on their resource endowment and industrial base for the sake of economic development. This results in the phenomenon that although the developed regions are effective in reducing emissions, but it aggravates the pressure of carbon emission reduction in less developed regions. Scholars have conducted a series of studies on this situation and found that there is a carbon transfer pattern in inter-regional trade, which is referred to as embodied carbon [
1,
2,
3,
4,
5,
6].
Research shows that the inter-regional transfer of carbon emissions has directly led to an inequity in carbon emission reduction rights and responsibilities among regions, instead of achieving reductions in overall carbon emissions [
7,
8]. Embodied inter-regional carbon transfers have a significant impact on regional carbon emission patterns and carbon emission reductions. The resulting transfer of inter-regional emission reduction pressure is important as it offsets the overall emission reduction effect, thereby increasing the burden of economic growth for net carbon emission transfer areas and the difficulties in upgrading and transforming industrial structures. Meanwhile, practices show that to ensure China’s rapid economic development and achieve the emission reduction targets set by the Chinese government and interprovincial regions, it is necessary to accurately grasp the characteristics of regional carbon emission spatial transfer, clarify its economic spillover effects, and effectively guide the reasonable transfer of carbon emissions among interprovincial regions in China. These tasks represent the starting point of this paper.
With the marketization and regional integration process in China, economic ties between provinces and regions have become increasingly close and trade in goods and services has become more frequent. The carbon embodied in the inter-regional trade of goods and services has led to discrepancies between the carbon footprints of provinces and regions and the actual carbon emissions. Therefore, it is important to consider the spatial transfer of carbon emissions for inter-regional cooperation on energy and emission reduction. This paper mainly discusses two problems: (1) establishing the characteristics of interprovincial flows of carbon in China (regions and sectors) and (2) conducting regional carbon compensation. Therefore, this paper adopts multi-regional input–output analysis (MRIOA), based on the latest multi-regional input–output data, to measure the embodied carbon transfer levels of 29 industries in 30 provinces (municipalities and autonomous regions) in 2017 and analyzes the specific value and spatial distribution pattern of the embodied carbon transfer between provinces and regions in China, as well as the compensation policies between regions. This paper aims to explore the interprovincial carbon transfer structure and clarify the different roles of regions with closely related economies and significantly different carbon emission patterns in the emission reduction process. It is of great theoretical and practical significance to promote the formation of inter-regional synergy and formulate the scientific and rational carbon emission reduction policies in each province and region.
3. Methodology and Data
3.1. MRIOA
As shown in
Figure 1, this study evaluated the characteristics of inter-regional carbon transfer and proposed carbon compensation measures based on multi-regional input–output analysis.
Multi-regional input–output analysis (MRIOA) is based on multi-regional input–output tables with the Leontief inverse matrix as the core, which can accurately quantify the economic linkages between regions and sectors. Then, combined with the carbon emission coefficient of the sector, the carbon emissions and carbon transfer can be accurately calculated. The multi-regional input–output table is shown in
Table 1.
The equilibrium equation of the value-based inter-regional input–output model is:
The superscript denotes the region and the subscript denotes the sector. denotes the intermediate input of sector i in region p to sector j in region q, denotes the final product provided by sector i in region p to region q, denotes the export of sector i in region p, and denotes the total output of sector i in region p (where p, q = 1, 2, …, m and I, j = 1, 2, …, n).
Let , be the direct consumption coefficient.
Let and denote the subregional direct consumption coefficient matrices, i.e., the direct consumption coefficient matrix of intermediate product inputs from region p to region q.
Therefore, Equation (1) can be written in matrix form, as shown below.
In the above matrix,
denotes the column vector of the total output of each sector in region
p,
denotes the column vector of products produced in region
p as end-use products in region
q, and
is the column vector of products exported from region
p. It is further found that:
In the above equation, is the inter-regional Leontief inverse matrix, denotes the total output of region p to meet the needs of intermediate products in other regions, denotes the total output of region p to meet the needs of final products in other regions, denotes the total output of region p to meet the final product needs of this region, and denotes the total output of region p to meet export needs.
3.2. Carbon Transfer Measurement Method
The introduction of carbon emission coefficient shifts the value-based flow relationship between regions to a carbon emission flow relationship. The carbon emission coefficient () refers to the carbon emissions per unit of output in the sector.
Let
be the diagonal matrix with CO
2 emission coefficient
(
i = 29) for each industrial sector in region
p; then, the column vector of CO
2 emissions for each industrial sector in region
p is shown below:
In the above equation, is the amount of CO2 emitted in region p to meet the demand for intermediate products in other regions; denote the amount of CO2 emitted in region p to meet the demand for final products in other regions and in its own; and is the amount of CO2 emitted in the p region to meet exports.
For two regions, the net carbon transfer between each other is
, which represents the difference between the total amount of embodied carbon transferred from region
p to region
q (transfer-out amount) and the total amount of embodied carbon transferred from
q to region
p (transfer-in amount).
If > 0, it means that region p transferred carbon to region q. If < 0, it means that region q transferred carbon emissions to region p.
The net carbon transfer (NCT) represents the difference between the total amount of embodied carbon transferred from region
p to other regions (transfer out) and the total amount of embodied carbon transferred from other regions to region
p (transfer in). The equation for the net carbon transfer from region
p is shown below:
If > 0, it means that region p transferred carbon to other provinces. If < 0, it means that all other provinces transferred carbon emissions to region p.
3.3. Carbon Offset Measurement Approach
For carbon compensation accounting, the horizontal compensation method is adopted. First, the recipient and the compensator have a clear agreement on their respective responsibilities and rights. This paper divides the responsibilities and rights of both the recipient and the compensator based on the amount of net carbon transfer. The net carbon transfer-in region is the recipient and the net carbon transfer-out region is the compensator. Second, compensation funds should be accounted for with certain criteria. In carbon compensation accounting, the recipient party provides intermediate use and final consumption products for the compensator but increases its ecological protection and environmental management costs. Therefore, the compensator needs to provide compensation funds to the recipient.
Accounting of compensation funds is based on the carbon emission transaction price. On 16 July 2021, the national carbon emission trading market was officially launched; the trading center is located in Shanghai. The average transaction price of RMB 51.23 per ton on the first day of the national carbon market represents a continuation in the improvement of China’s carbon pricing mechanism, as the carbon market is expected to grow with an annual trading volume of over RMB 100 billion, providing price signals as well as financial support for the carbon reduction actions of the whole society. Accounting for carbon compensation on this basis can more accurately reflect the current value of carbon. Therefore, this paper selects an average price of 51.23 RMB/ton (
http://www.xinhuanet.com/ (accessed on 15 December 2022)) of equivalent CO
2 on the first day of trading and converts carbon transfer into an amount to determine the interprovincial compensation amount.
In the above equation, denotes the amount of carbon compensation that region p needs to give to region q. denotes the net carbon transfer from region p to region q. = 51.23. If > 0, it means that region p needs to compensate for region q. If < 0, it means that region q needs to compensate for region p.
3.4. Data Sources
In this paper, China’s multiregional input–output tables and CO
2 emission factors for each region and sector were required to calculate the CO
2 transfers among 30 provinces and between sectors. The Chinese multiregional input–output data were selected from the 2017 Chinese multiregional input–output table compiled by Zheng et al., (2020) [
34], which is updated every 5 years for each province in China; these data are the latest Chinese multiregional input–output data for the value of trade flows among the 30 provinces and 42 sectors.
There is no official published platform in China for CO
2 emission factors by region and sector, so this study uses the carbon emission inventory of each province compiled by the China Carbon Accounting Database (CEAD) (
https://www.ceads.net/data/ (accessed on 15 December 2022)) based on the IPCC sectoral carbon accounting methodology and the 2017 China Coal Industry Yearbook. This emission inventory includes energy carbon emissions from the combustion of 17 fossil fuels and process carbon emissions from the production of cement in order to measure carbon emissions from 45 sectors using carbon emission factors consistent with Chinese data. To maintain data consistency, we organized the carbon emission inventory into 29 sectors and accordingly consolidated the multiregional input–output tables into 29 sectors for 30 regions.
4. Empirical Results
4.1. Interprovincial Carbon Transfer Accounting Analysis
4.1.1. Analysis of Carbon Transfer Characteristics and Spatial Distribution
The net carbon transfer of each province (municipalities and autonomous regions) was calculated. Transfers in carbon emissions are those generated by one region to meet the needs of other regions, or generated by other regions as consumer goods for their own production activities or final consumption; the converse are called the transfer-out regions. The results of the 30 provinces (municipalities and autonomous regions) are shown in
Figure 2.
From a provincial perspective, as shown in
Figure 2, the province with the most carbon transfer-out regions is Guangdong Province, followed by Henan, Zhejiang, and Jiangsu; the province with the most carbon transfer-in regions is the Inner Mongolia Autonomous Region, followed by Hebei, Henan, and Shanxi. From a sectoral perspective, 80–90% of carbon transfer out from the top four provinces comes from electricity and hot water production, metallurgy, nonmetal products, coal mining, petroleum, and transportation industry. Among them, electricity and hot water production belongs to the energy industry and the transportation industry belongs to the service industry. Accordingly, in terms of carbon transfer in sectors, 80–90% of carbon transfer-in levels from the top four provinces also come from these types of sectors. In other provinces, the sectors with the highest carbon transfer-out and transfer-in levels are also concentrated in the energy sector, petrochemical and mineral sectors, and the transportation sector. There is no doubt that these sectors belong to high-carbon-emission sectors. By improving the energy structure, energy efficiency, and carbon emission efficiency, the goal of carbon emission reduction can be gradually achieved.
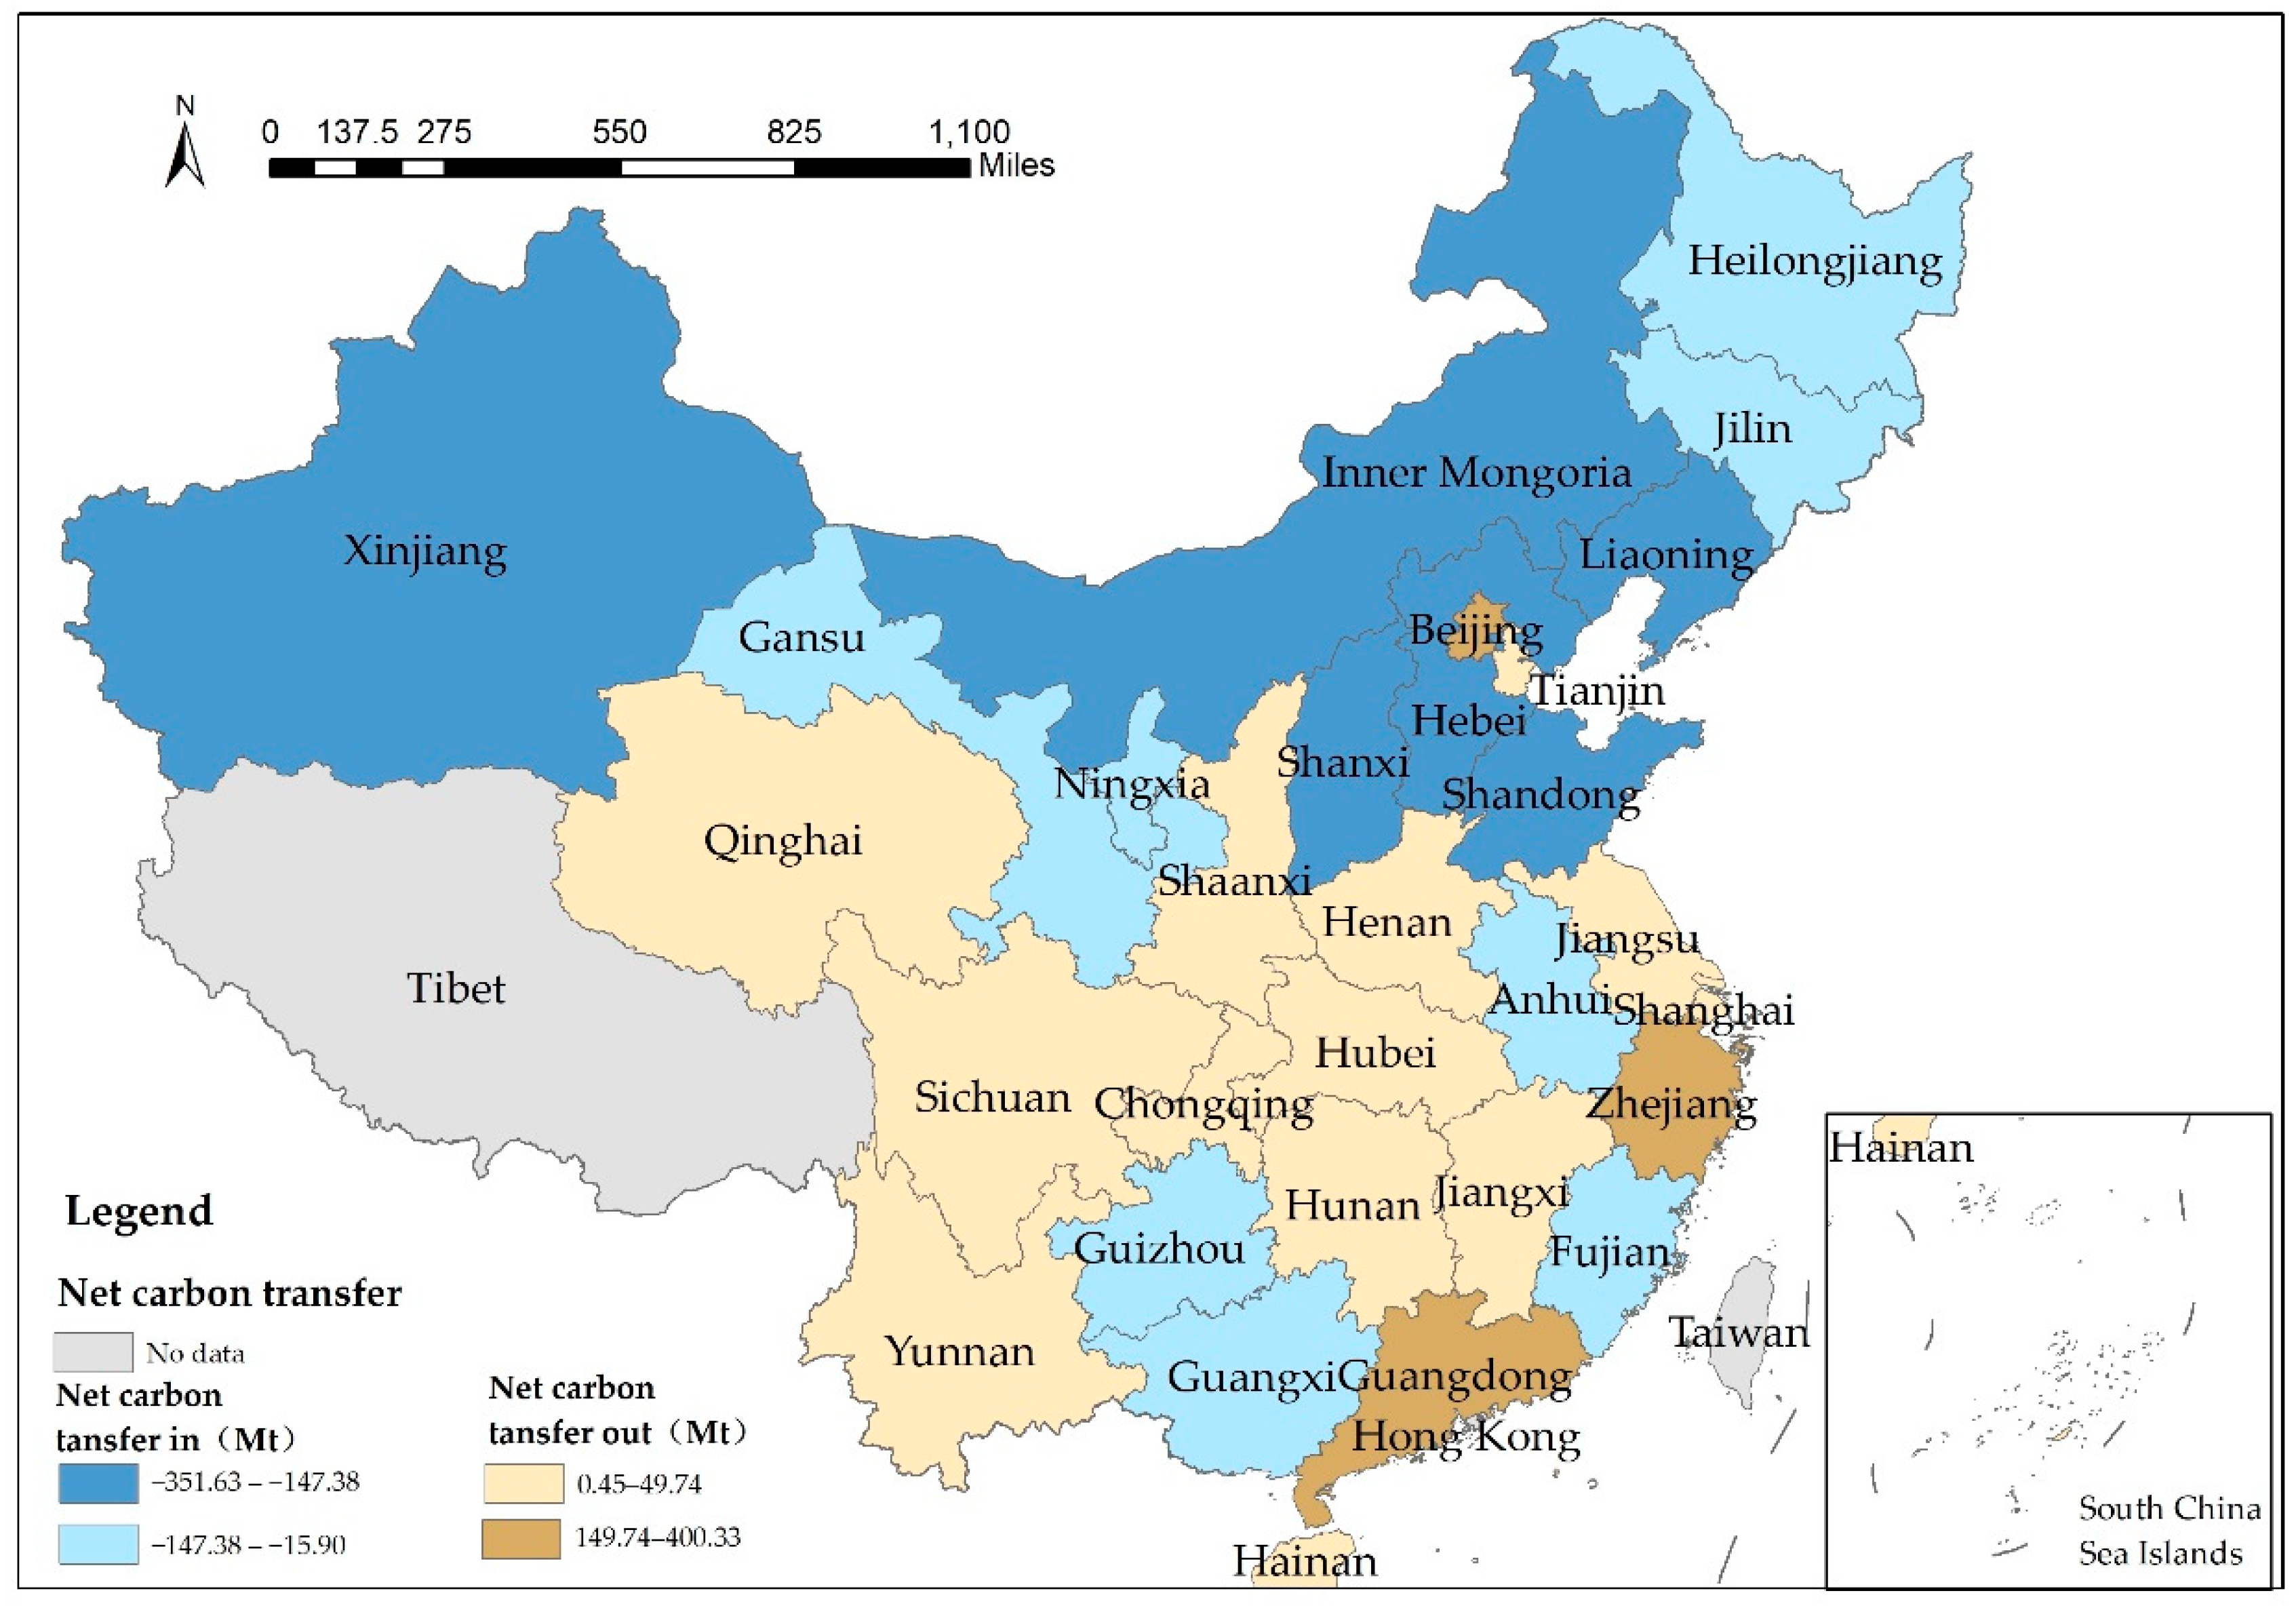
The spatial distribution of net carbon transfer-in levels and net carbon transfer-out levels of each province (municipalities and autonomous regions) is shown in the map of China using ArcGIS10.3.1 (
Figure 3).
It can be seen that most of the net carbon transfer levels in areas are distributed in the north with a few areas in the south, while most of the net carbon transfer out areas are distributed in Beijing and Tianjin, as well as central and eastern coastal areas. The overall distribution shows a spatial shifting pattern from south to north and from east to west. This spatial distribution pattern illustrates the overall presentation of carbon transfer from economically developed provinces to less developed provinces. It can be seen from the 2017 China Coal Industry Yearbook that Beijing, Shanghai, Jiangsu, Henan, Guangdong, and other regions are the net transfer-in regions of coal from other provinces in 2017, while Inner Mongolia, Shanxi, Shaanxi, Xinjiang, and other places are the net transfer-out regions of coal. Based on natural resource endowment, the economic development of these provinces relies on local natural resources; energy demand has rigid characteristics, and most of the energy-consuming products of high-energy-consuming industries are designed to meet the consumption of other regions. Meanwhile, in the more economically developed regions, such as North China, Shanghai, and Guangzhou, tertiary industries account for more than half of the total industries; when coupled with the environmental regulation requirements, these regions are motivated to obtain energy-intensive products from other regions to meet production and consumer needs, leading to low local carbon emissions.
Thus, the provinces with more carbon transfer-out levels import much more energy from less developed but energy-rich provinces to meet their production and consumption demands, and while the carbon emissions produced by them are very small, their consumers are responsible for high levels of carbon emissions. Most resource-based provinces, such as Inner Mongolia, provide many energy products to economically developed provinces, such as Beijing and Guangdong. The development of interprovincial trade has led to an increase in the volume of products moving between provinces; the locations of production and consumption are different, which leads to inter-regional carbon transfer.
4.1.2. Analysis of Inter-Provincial Net Carbon Transfer Characteristics
The net carbon transfer is obtained by subtracting the carbon transfer-out levels from the carbon transfer-in levels (
Figure 4). The 16 provinces of Beijing, Tianjin, Shanghai, Jiangsu, Zhejiang, Jiangxi, Henan, Hunan, Hubei, Guangdong, Hainan, Chongqing, Sichuan, Yunnan, Shaanxi, and Qinghai have a positive net carbon transfer, while the remaining 14 provinces have a negative net carbon transfer. The research results indicate that there is a “carbon leakage” between economically developed provinces and less developed provinces within China. The 16 provinces with positive net carbon transfer are all more economically developed regions. Among them, Guangdong, Beijing, Zhejiang, Zhejiang, Henan, and Chongqing have large net carbon transfer-out levels, of which the largest is Guangdong with 400 million tons. These regions either have a single industrial structure or an imperfect industrial structure, and have to rely on imported materials to meet final demands. Among the 14 provinces with negative net carbon transfer levels, Inner Mongolia, Shanxi, Xinjiang, Shandong, Hebei, and Jilin have large net carbon transfer-in amounts, with the largest net carbon transfer occurring in Inner Mongolia at 350 million tons. Taking Inner Mongolia region as an example, the largest sector of net carbon transfer is the electricity and hot water production (energy sector). Inner Mongolia is an important energy base. In its primary energy production structure, raw coal accounts for more than 90%. Its energy production not only serves its own economic development, but also indirectly supports the economic growth of other provinces through inter-provincial trade. From a sectoral perspective, the net carbon transfer in Inner Mongolia, Shanxi, Shandong, and Ningxia mainly comes from the energy sector, which should focus on improving the efficiency of energy use and changing the energy structure. While the net carbon transfer in Hebei and Liaoning mainly comes from the nonmetal and metal sectors, which should reduce carbon from three aspects: energy structure, low-carbon technology (mining technology, mineral processing technology, etc.), and management (production process, transportation, etc.).
4.2. Analysis of the Net Carbon Spatial Transfer Characteristics of Eight Regions
The National Information Center divided China’s mainland into eight regions defined by precise regional policies and spatial segment subdivisions. Based on the input–output tables of the regions, the similarity of industrial structures and economic development levels of provinces (regions) and cities, as well as their geographical relationships. Many scholars have discussed the spatial association of regional economies and their dynamic evolution characteristics on this basis [
5,
58,
59,
60]. The classification and net carbon transfer of the eight regions are shown in
Table 2.
From the values of regional net carbon transfer, we can see that four regions have a positive net carbon transfer, which means that other regions bear the corresponding carbon emission pressure values for the regions. These regions are the Northern Metropolis, the Central Coast Region, the Southern Coast Region, and the Southwest Region, which have less energy-intensive industries and more developed low-energy industries and services in their economic structure or have imperfect economic structures, and are more dependent on imports from other resource-based regions for energy and other products. The remaining four regions have a negative net transfer, indicating that they bear part of the carbon emission pressure for other regions. These regions are the northern coastal Region, the northeast region, the central region, and the northwest region. The four regions are natural-resource-rich regions, and especially bare lots of energy, including raw coal, crude oil, primary electricity, etc. These provide means of production for production activities in other regions through the exportation of energy products, the flow of products in the intermediate sector, and the trans-regional transmission of electricity (likewise bearing corresponding carbon emissions). The net transfer of regional carbon emissions reflects their status and role in the national regional pattern of carbon emission reduction.
The spatial distribution of net carbon transfer in the eight regions is shown in the map of China using ArcGIS10.3.1. As shown in
Figure 5 below, the dark to light blue area represents the net carbon transfer-in amount from highest to lowest, and the dark to light yellow area represents the net carbon transfer-out amount from highest to lowest. The direction of the arrow represents the transfer direction of the embodied carbon between regions and the thickness represents the amount of embodied carbon.
The map shows that the north mainly inputs embodied carbon to the northwest and the south mainly inputs embodied carbon to the central and north. The eight regions are divided into three categories. The first category is the one-way transfer out region known as northern metropolis, in which the net transfer out of northern metropolis is positive, and its input of embodied carbon to the other seven regions, among which the input to the northern coast region and northwest region is the highest, and inputs to the northeast region and central coast region are lower. The northern metropolis mainly includes the cities of Beijing and Tianjin, which ranked first and third in the country in terms of GDP per capita in 2017 and are economically developed regions. From a sectoral perspective, the main transfer-out sectors are electricity and hot water production, which have the highest carbon emission coefficients. The northern metropolis imports a large number of low value-added and high-carbon-emission products from other regions to meet its economic development needs, and it is highly dependent on interprovincial trade. The second category is a combination of two-way transfer-out and transfer-in amounts, which includes the northern coastal region, the northern coastal region, the northeastern region, the central region, the central coast, the southern coast, and the southwestern region. The net transfer in the central coast, the south coast, and the southwest region is positive. These regions transfer a large amount of embodied carbon to the northwest and northeast regions, but also transfer carbon from the northern metropolis; the amount of carbon transferred out is greater than the amount of carbon transferred in. The net carbon transfer in the northern coastal region, the northeastern region, and the central region is negative. On the one hand, these regions receive the carbon input of Beijing–Tianjin and the southern regions; on the other hand, they also import embodied carbon to the northwest region. However, on the whole, they receive more carbon transfers than other regions, a result of containing more resource-based provinces. Such regions supply most of the goods and services produced to and imported from other regions through interprovincial trade, and interprovincial trade has a large impact on the carbon emissions of such regions. The third category is the one-way transfer region, the northwest region, which has a net carbon transfer from the other seven regions. The northwest region is energy-rich, an important energy base, and exports a large number of carbon-intensive products to other regions. All in all, the regions with positive net carbon transfer, such as the northern metropolitan and central and southern coastal regions, which are in the eastern part of China, import large amounts of energy products from energy-rich regions in order to meet the needs of economic development. These regions can reduce emissions in two ways. One is to transfer the excessive demand for energy-intensive products in the region and the other is to cooperate with other regions through capital or technology to improve energy conservation and emission reduction technologies in other regions. Regions with negative net carbon transfer, such as the north coast and central regions, are geographically linked to the east and west regions. Their industries are often the upstream industries of the eastern region, and they have a strong ability to bear the industrial transfer from the eastern region, both in terms of talent pool and the accumulation of related industrial resources. In the west, a large number of underdeveloped areas in the northwest region are widely distributed and have a strong regional environmental carrying capacity. It can reduce emissions by eliminating outdated production capacity, improving energy efficiency, and adjusting the energy mix.
4.3. Carbon Compensation Accounting Results
One approach to regional horizontal carbon compensation is to establish a regional horizontal carbon compensation system with direct economic compensation led by the government. Based on regional carbon transfer accounting, the net carbon transfer-out region (e.g., the urbanized region and the industrially developed region) gives certain economic compensation to the net carbon transfer in the region (e.g., resource-based region) to achieve regional equitable development. In this paper, the compensation amount is calculated based on the net carbon transfer amount, as shown in
Table 3.
As seen in
Table 2, Guangdong, Zhejiang, Beijing, Henan, Chongqing, Jiangsu, Shaanxi, and Jiangxi have more carbon compensation in 30 provinces (cities and autonomous regions), which are priority areas to pay carbon compensation costs. Beijing, Zhejiang, Henan, Chongqing, and Guangdong are required to compensate eight regional provinces (cities and autonomous regions). Spatially, the provinces that should pay carbon compensation costs are mainly in the central and eastern regions, while the provinces that should receive carbon compensation costs are mainly in the northwestern regions. In addition, economically developed regions generally compensate economically less developed regions.
Specifically, Beijing in the northern metropolis compensates the greatest amount to the northwest, especially to Inner Mongolia, which needs to be compensated for RMB 2.269 billion. Guangdong, one of the most economically developed regions in China, needs to compensate Liaoning (RMB 2.579 billion) in the northeast, Guangxi (RMB 2.393 billion) in the southwest, Inner Mongolia (RMB 2.165 billion) in the northwest, Hebei (RMB 1.768 billion) in the north, and Henan (RMB 1.483 billion) in the central region; its compensation amounts are larger that Beijing’s. Zhejiang and Jiangsu, which are located on the central coast with better economic development, mainly compensate the central region, northwest region, and north coast region, among which Zhejiang mainly compensates Hebei (RMB 1.971 billion) and Shandong (RMB 1.132 billion) in the central coast region, Inner Mongolia (RMB 1.811 billion) in the northwest region, and Jiangsu (1.640 billion) in the central coast region; Jiangsu mainly compensates central Anhui (RMB 1.802 billion), Hebei (RMB 1.072 billion), and Inner Mongolia (RMB 977 million) in the northwestern region; and Jiangsu mainly compensates Anhui (RMB 1.802 billion), Hebei (RMB 1.072 billion), and Inner Mongolia (RMB 977 million) in the central region. Henan, which is the largest overall economy in the central region, also mainly compensates Inner Mongolia in the northwest region (RMB 2.076 billion), Shandong in the central coast region (RMB 1.428 billion), and Shanxi in the central region (RMB 1.205 billion). Jiangxi, another central region, also mainly compensates some provinces in the northwest region, central region, and northern coast. The most compensation to the northwest region is RMB 828 million to Inner Mongolia, RMB 553 million to Shandong on the north coast, and RMB 598 million to Hubei and RMB 520 million to Shanxi in the central region. Heilongjiang, the province in the northeast region with the highest level of required compensation to other regions, compensates RMB 1.287 billion and RMB 586 million to Shanxi in the central region and Inner Mongolia in the northwest region, respectively. Chongqing, the only municipality directly under the central government and the national central city in southwest China, mainly compensates Inner Mongolia in the northwest region and Hebei on the north coast with RMB 1.113 billion and RMB 890 million, respectively. Shaanxi, as the gateway to the northwest, needs to compensate provinces in seven regions, of which the most compensation is needed in the northwest, especially Inner Mongolia, at RMB 1.025 billion, and Sichuan in the southwest, at RMB 812 million. The hot spots of carbon compensation in China are mainly located in Beijing in the north and Shanghai and Guangdong in the eastern coastal region; the cold spots are mainly located in Inner Mongolia and Xinjiang in the northwest region, Shanxi and Hebei in the central region, and Heilongjiang and Jilin in the northeast region.
For specific compensation measures, the transfer of carbon compensation from local to central to local can be achieved by establishing a horizontal transfer system for carbon compensation in different provinces. Both the central government and local governments should set up carbon fund accounts to manage carbon compensation funds. Following the fair compensation principle of “who benefits, who compensates”, the regions with positive net carbon transfer should be the main carbon compensation payers, while the regions with negative net carbon transfer should be the carbon compensation payees. Based on the transaction price of the national carbon market, the amount of carbon compensation will be calculated, and the carbon compensation payer will transfer the carbon compensation funds to the carbon compensation payee. This part of the fund can redistribute inter-provincial abatement costs, provide financial support for carbon abatement in high-carbon-emission regions, and ensure the efficiency of abatement while promoting inter-provincial carbon equity.
5. Conclusions and Discussions
In this paper, by accounting for the amount of interprovincial carbon transfer in 2017, we obtained the amount of carbon transfer-out levels, carbon transfer-in levels, and net carbon transfer levels in 30 provinces (municipalities and autonomous regions) in 2017, as well as the specific direction of carbon transfer. At the same time, we divided 30 provinces (municipalities and autonomous regions) into eight regions and analyzed the state of carbon transfer between different regions. Finally, based on the amount of carbon transfer from each province (municipalities and autonomous regions), combined with the carbon price in the national carbon market, the interprovincial carbon compensation amount is accounted for. The main conclusions are as follows. (1) From a provincial perspective, the province with the highest carbon transfer-out amount is Guangdong Province, and the province with the highest carbon transfer-in amount is Inner Mongolia; the provinces with higher carbon transfer-out amounts are mostly economically developed regions, and the provinces with more carbon transfer-in amounts are mostly resource-based. From a sectoral perspective, energy, metallurgy, nonmetal products, coal mining, petroleum, and transportation sectors are the main sectors of carbon transfer. (2) In terms of the spatial distribution of net carbon transfer, most of the net-carbon-importing regions are located in the north, with a small number in the south, while most of the net-carbon-transferring regions are located in Beijing, Tianjin, as well as central and eastern coastal areas. (3) From analyzing the net carbon transfer of the eight regions, it can be seen that the regions with positive net carbon transfer, such as the Beijing–Tianjin and central and south coast regions, ensure their realization of carbon emission reduction tasks by transferring some high-pollution and high-energy-consuming industries to other regions with rapid economic growth; the regions with negative net carbon transfer, such as the northern coastal and central regions, which are geographically linked to the east and west regions, have a strong ability to bear the related industrial transfer in the east, and they also bear the carbon emission pressure from the northwest region. (4) By determining the amount of regional horizontal carbon compensation through the market price method, we can see that the overall spatial pattern of the carbon compensation amount decreases from the center to the periphery in the eastern coastal region, Beijing and Tianjin, and the northern coastal region, showing that the more economically developed regions compensate for the less economically developed regions.
In general, some results of this study are fundamentally consistent with those of previous studies. The previous research based on the data of 2010 [
27,
29,
30] and 2012 [
25,
26,
28] shows that the inter-provincial embodied carbon in China has shifted from economically developed provinces to less developed provinces. This study uses data from 2017 for calculation purposes and shows that the overall distribution of embodied carbon transfer between regions still presents a spatial pattern of transfer from south to north and from east to west. The results confirm that after a period of development, the phenomenon of “carbon leakage” still exists among regions in China [
5,
36,
59]. In contrast to other papers, in addition to using the latest data to track the amount and direction of embodied carbon transfer (transfer in and out) between provinces in China, this study also conducted in-depth research from three aspects. First, based on the characteristics of carbon transfer, the key sectors of carbon reduction in different provinces were identified and targeted suggestions were proposed. Second, by increasing the perspective of spatial transfer in eight regions, we can reflect the embodied carbon transfer between different regions in China more accurately and reveal the differences in economic development, energy consumption, and industrial structure between regions. Furthermore, we put forward a specific accounting scheme for regional horizontal carbon compensation to promote carbon equity among regions.
This study has several limitations. First, because it is difficult to obtain continuous inter-provincial input–output data, this study only uses data from 2017 for static analysis, and fails to analyze the time series of each province. Second, this study lacks an exploration of the dynamic driving mechanism of carbon transfer and cannot deeply analyze the complex reasons for the long-term existence of “carbon leakage” between provinces. Therefore, in future research, the inter-provincial input–output time series database can be constructed to analyze the spatiotemporal evolution process of implied carbon transfer. Furthermore, we will further analyze the driving factors behind this process, as well as the impact of dynamic changes among driving factors on the spatial and temporal pattern of carbon transfer. This is of great significance to scientifically and accurately reveal the dynamic mechanism of the formation and evolution of inter-regional carbon transfer.
Based on the analysis and discussion of the results of inter-provincial carbon transfer and carbon compensation, this paper proposes three policies to promote regional carbon reduction. (1) Carbon emissions are a subsidiary product of economic and social development and show great variability among regions with the level of economic development. Each region should formulate appropriate emission reduction policies according to the characteristics of trade carbon transfer. Regions with net carbon transfer-in levels are resource-intensive regions. Based on the resource endowment, energy structure, and industrial structure, they can focus on the key carbon emission sectors and make their own products more low-carbon and environmentally competitive. Regions with net carbon transfer-out levels are economically developed regions with developed service industries which need to rely on imported energy products to meet their own production and consumption needs; these provinces can focus on the source of imported products, changing from high-emission-intensity regions to low-emission-intensity regions without affecting social and economic development and industrial structure. (2) Carbon is a by-product of economic activities on the ecological environment, and is highly correlated with industrial structure. From the distribution of regional trade represented by carbon emission sectors, including the energy sector, metal and nonmetal account for a large share of trade embodied carbon emissions and show the characteristics of transferring from the coast to the middle west. Therefore, adjusting the industrial structure and upgrading technology is the key to emission reduction, especially for the adjustment of the energy industry, which can focus on improving the energy structure and optimizing industrial energy utilization efficiency. On the one hand, they should eliminate backward production capacity or carry out transformation, and promote innovation in green and low-carbon technologies. On the other hand, based on their own energy resource, they should promote clean energy development, such as hydropower and geothermal power, and adjust the energy production structure. (3) According to the principle of “who benefits, who compensates”, an interprovincial compensation mechanism should be established. Based on the net carbon transfer, the economically developed regions should give financial or technical compensation and support to the less developed regions. This will help reduce the pressure of net carbon transfer in regions and promote interprovincial carbon equity.


