
Nature-Based Restoration Simulation for Disaster-Prone Coastal Area Using Green Infrastructure Effect

Abstract
:1. Introduction
2. Materials and Methods
2.1. The Study Site
2.2. Data Collection and Model Construction

| Characteristics | Parameters | Values | Units | Source |
|---|---|---|---|---|
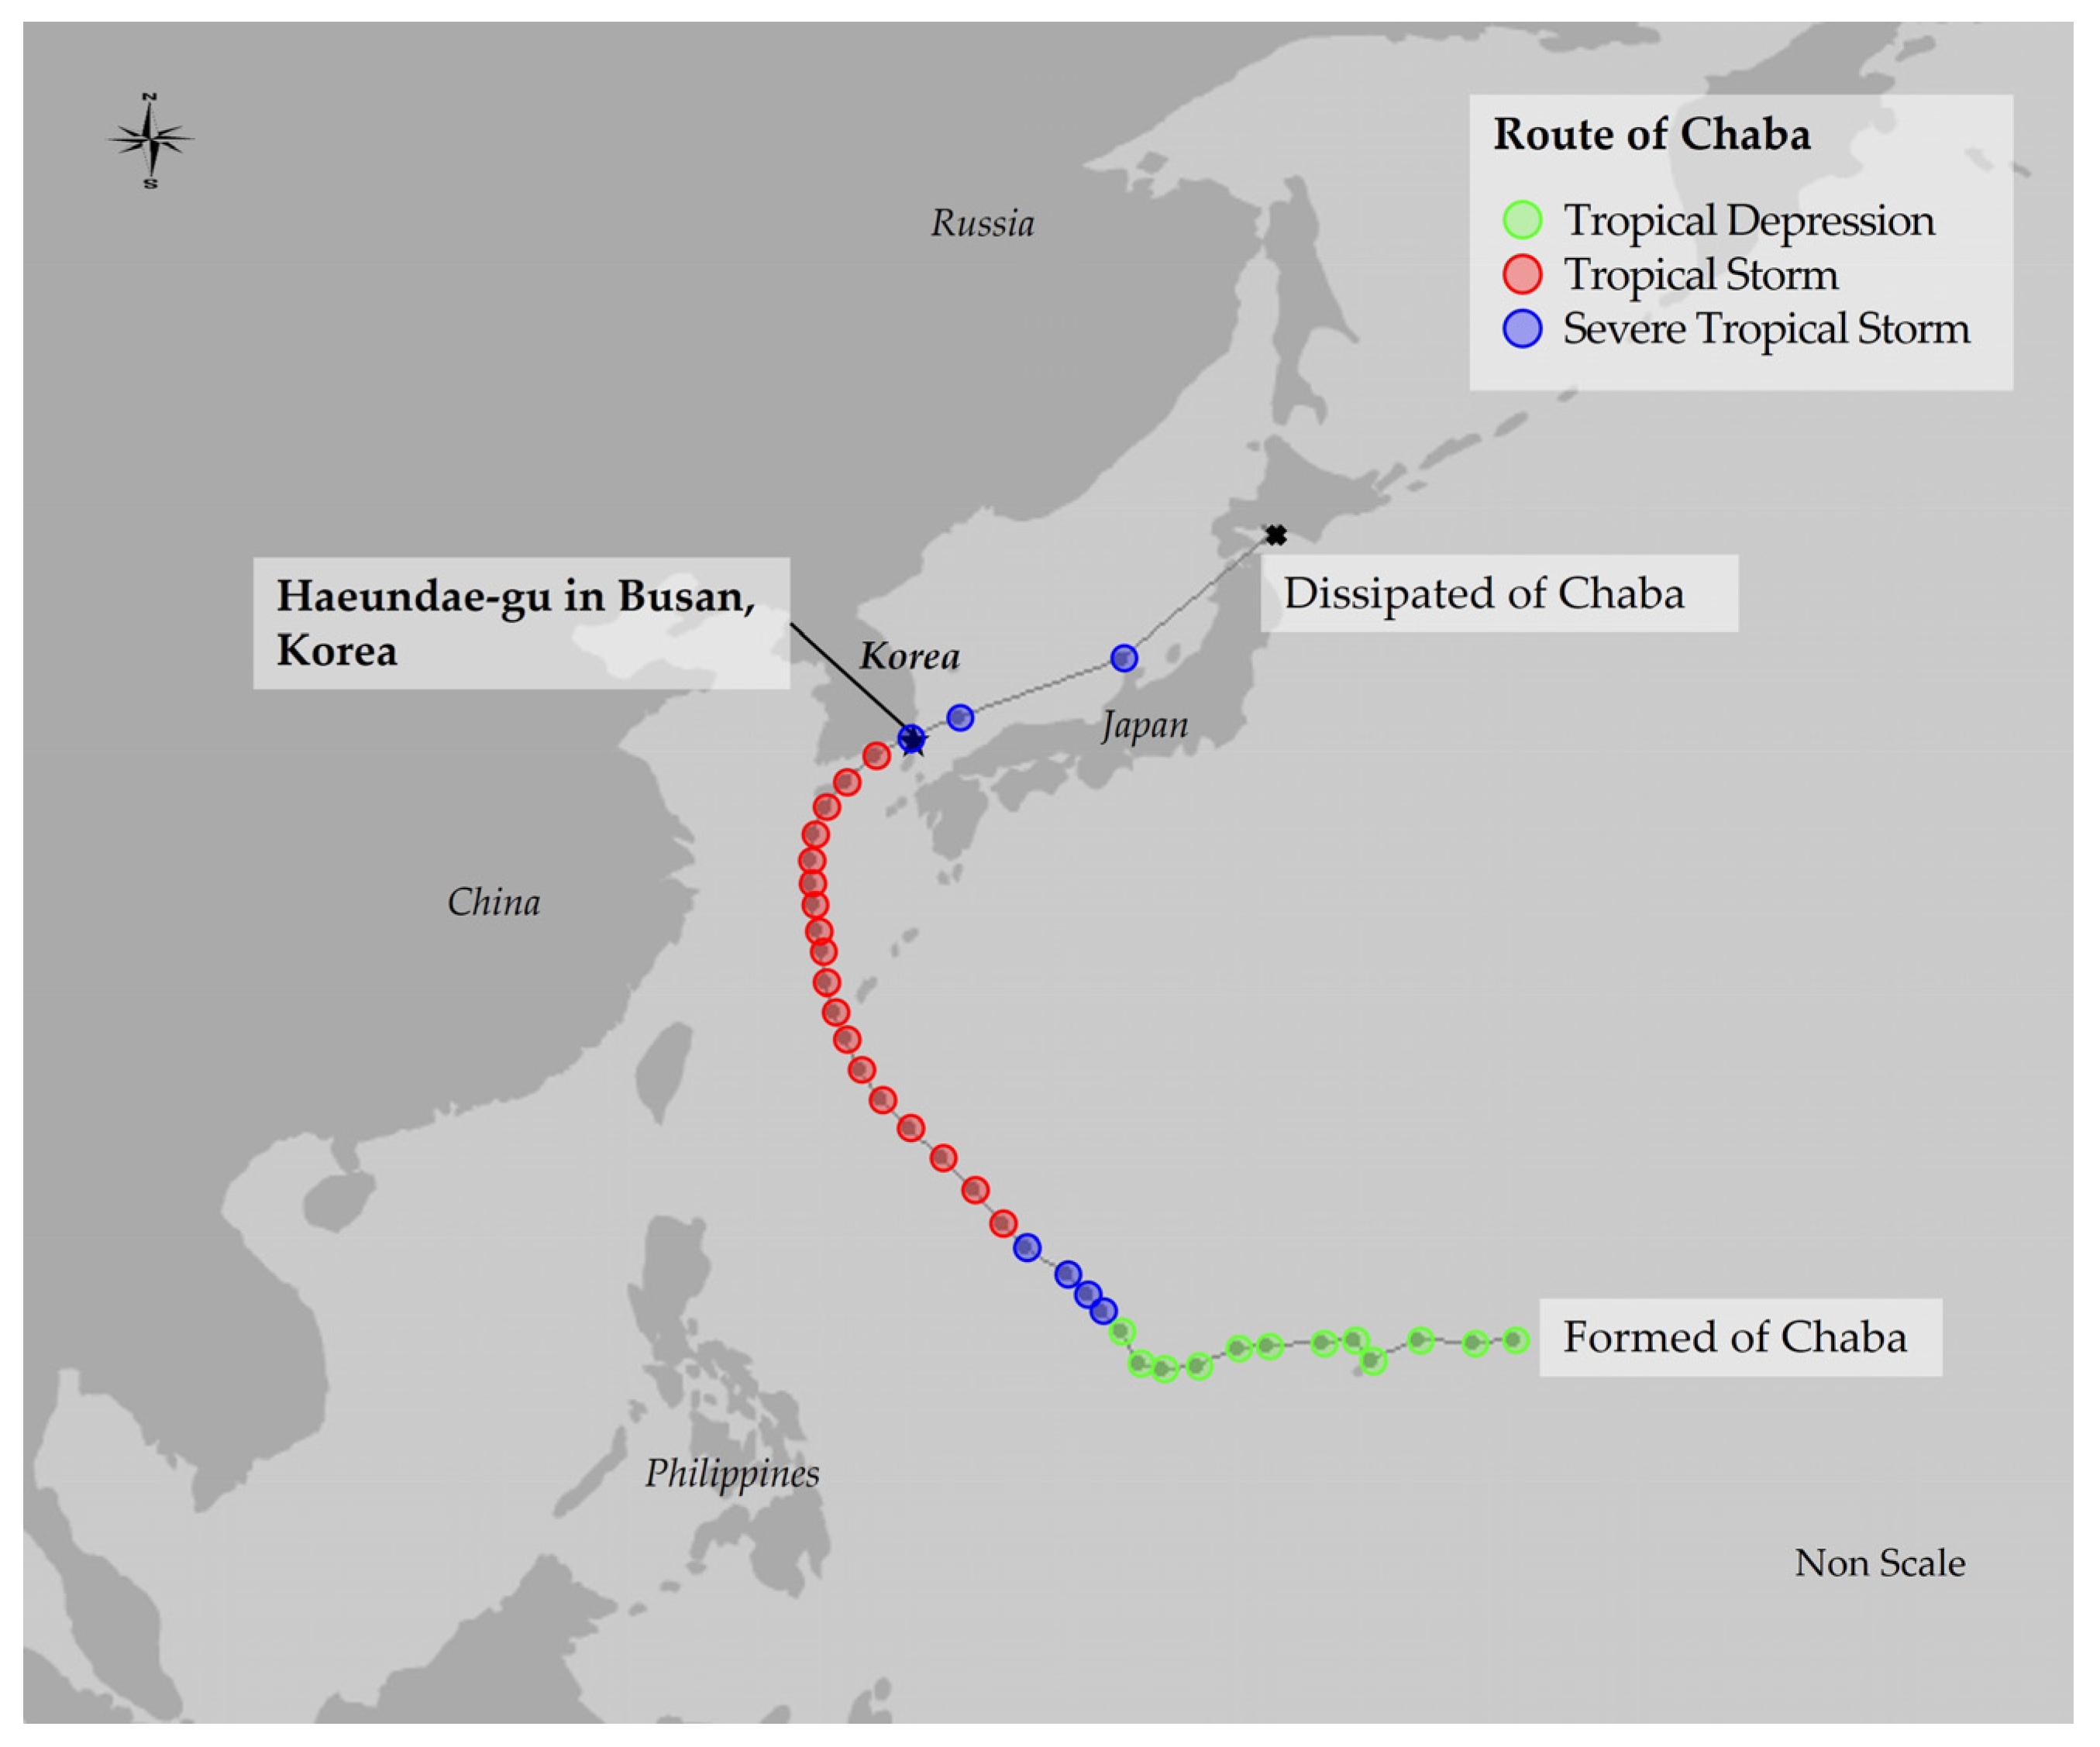
| Site | Precipitation for Typhoon “Chaba” | 38.3 | mm/hour | [30] |
| Duration of precipitation | 12 | hours | [30] | |
| Total (Impervious+ Pervious) area | 283,367 | m2 | [29] | |
| Impervious area | 236,895 | m2 | [29] | |
| Pervious area | 46,472 | m2 | [29] | |
| Runoff amount | 30,441.01 | m3 | [29,30] | |
| Land cover | Public area (public facility and culture, sports, and recreation areas) | 33,531 | m2 | [29] |
| Private area (commercial and residential areas) | 83,684 | m2 | [29] | |
| Transportation area | 94,735 | m2 | [29] | |
| Industrial area | 24,945 | m2 | [29] | |
| Green area | 46,472 | m2 | [29] | |
| Green infrastructure | Green roof rate | 97 (≤32 mm), 70 (≥32 mm) | % | [33] |
| Infiltration storage facility rate | 0.0921 × accumulated rainfall + 89.606 | % | [35] | |
| Porous pavement rate | 15.4~37.1 | % | [34] |
2.3. Green Infrastructure Effect and Resilience Simulation
3. Results and Discussion
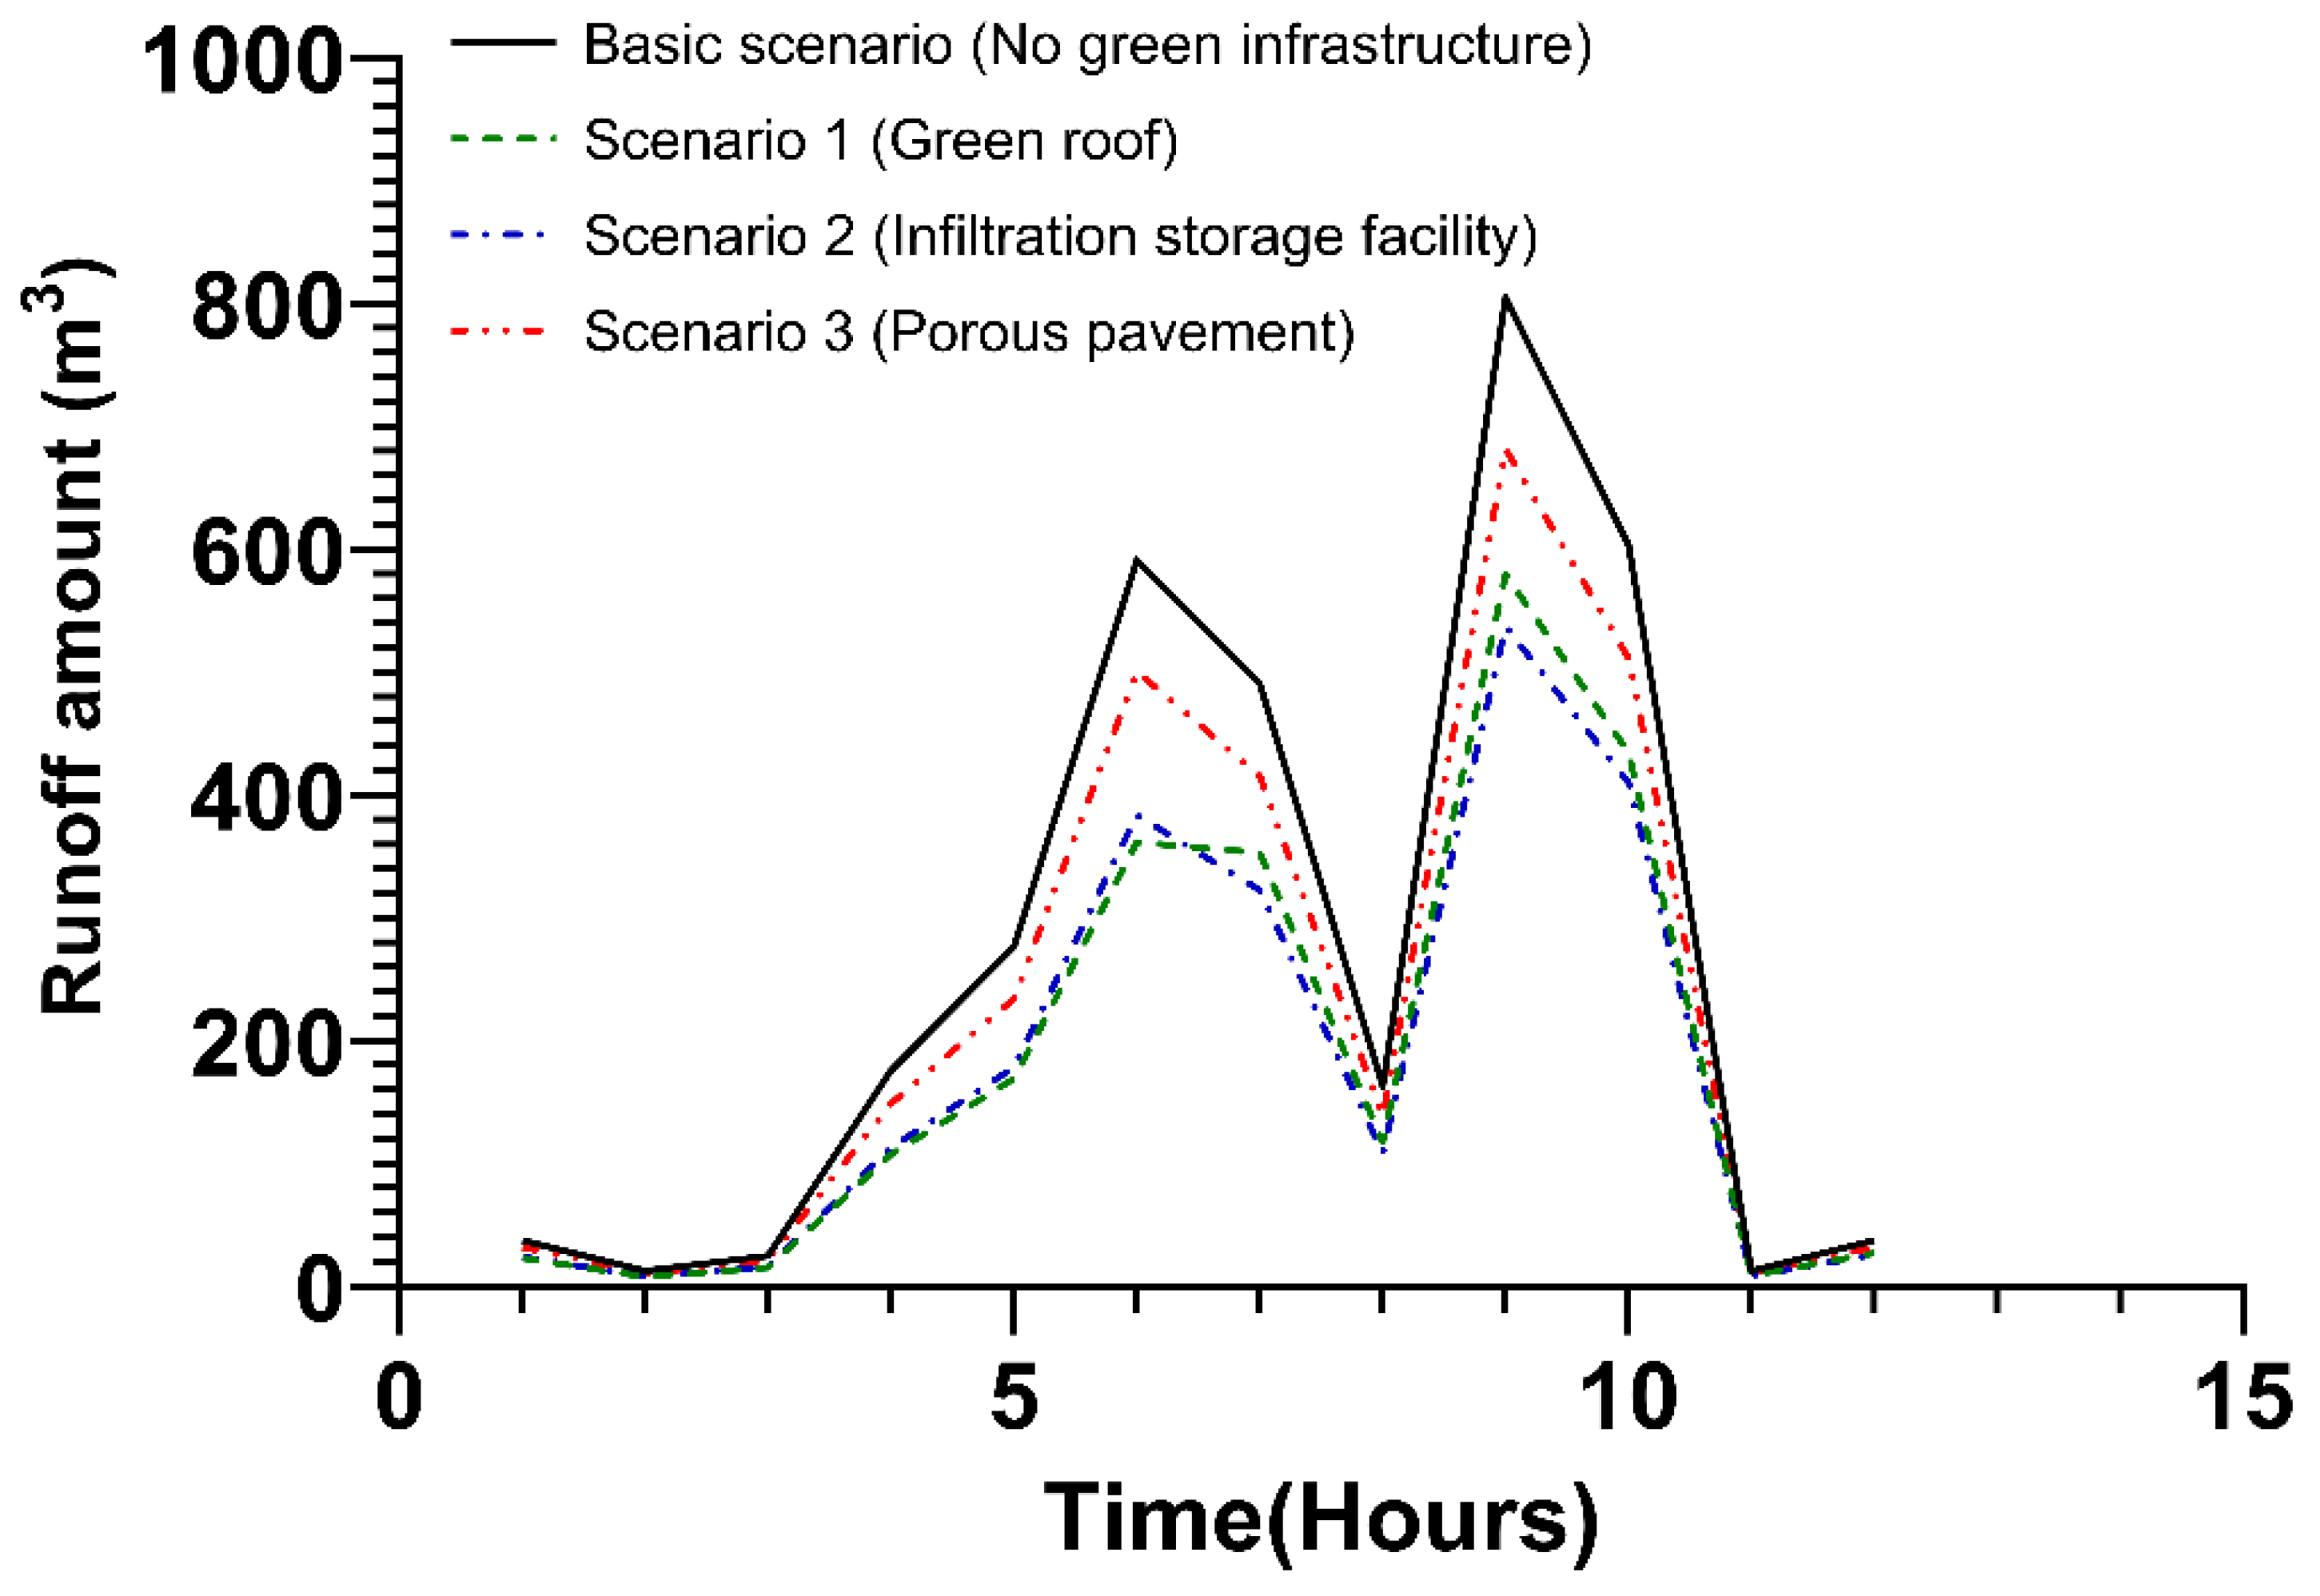
3.1. Green Infrastructure Effect Simulation
3.1.1. Green Infrastructure Application Area Scenario
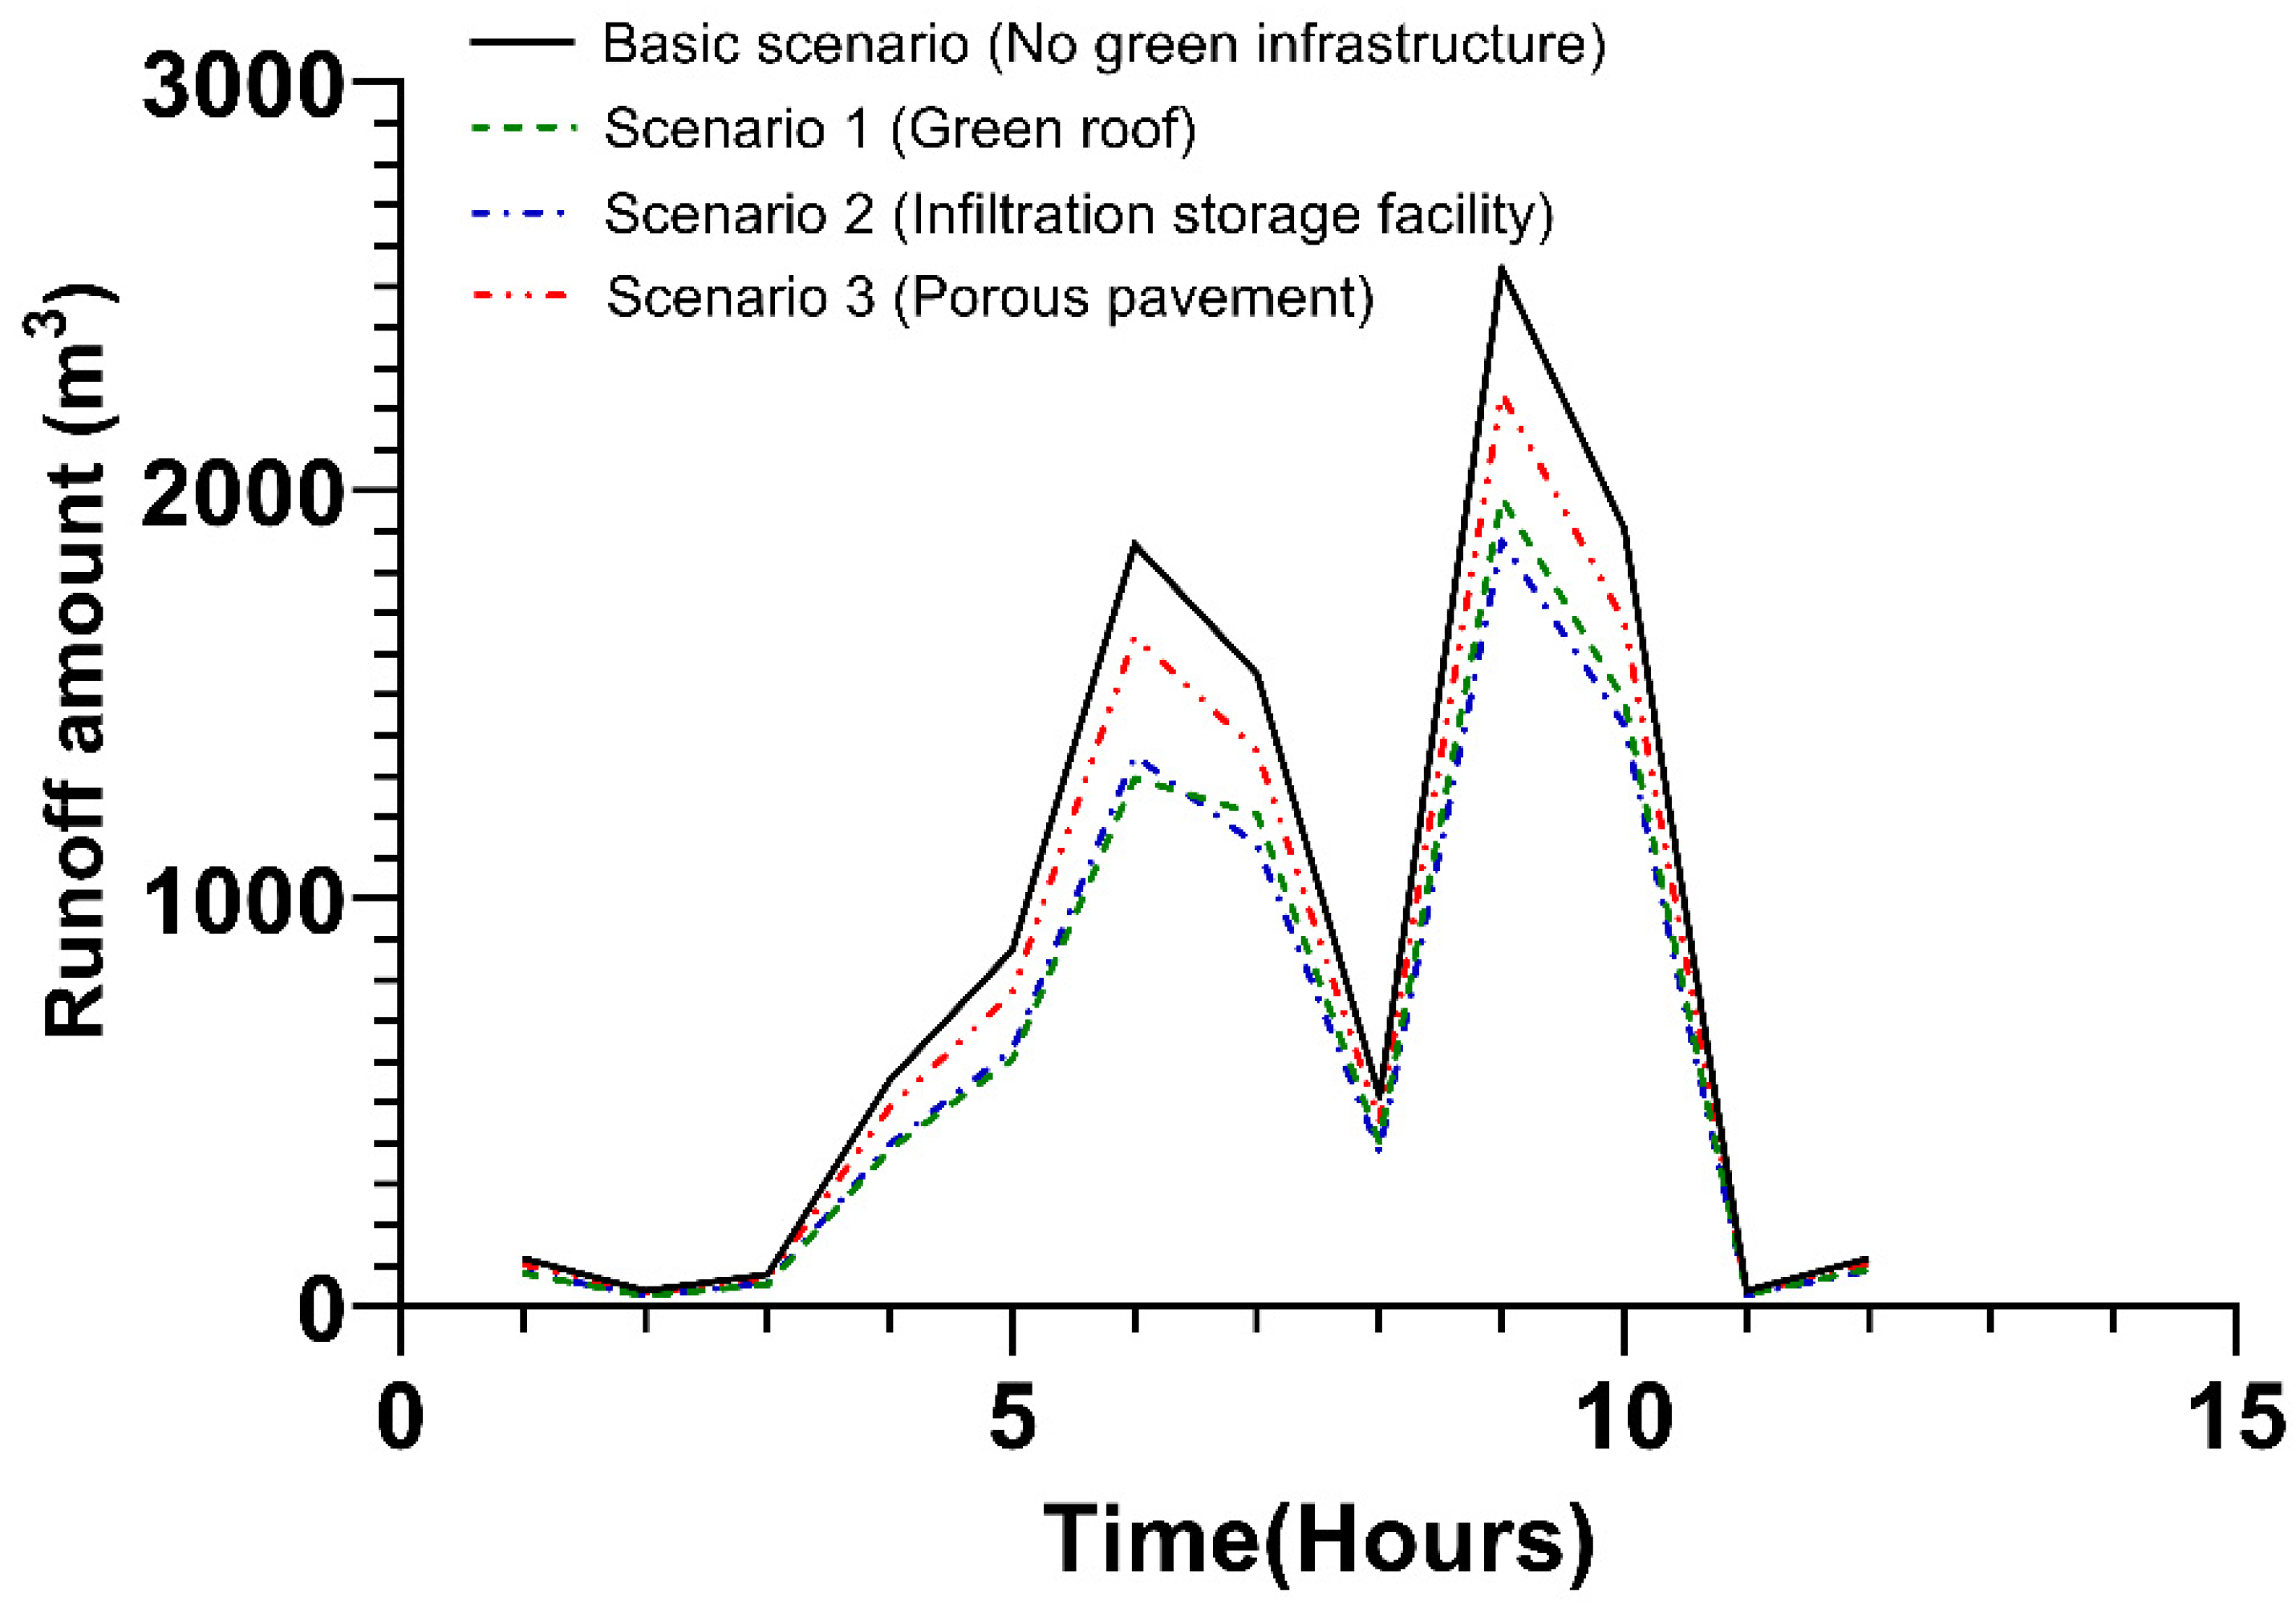
3.1.2. Green Infrastructure Application Scenarios by Land Cover Type
3.2. Resilience Quantification Simulation
3.2.1. Change in Resilience by Green Infrastructure Application Area
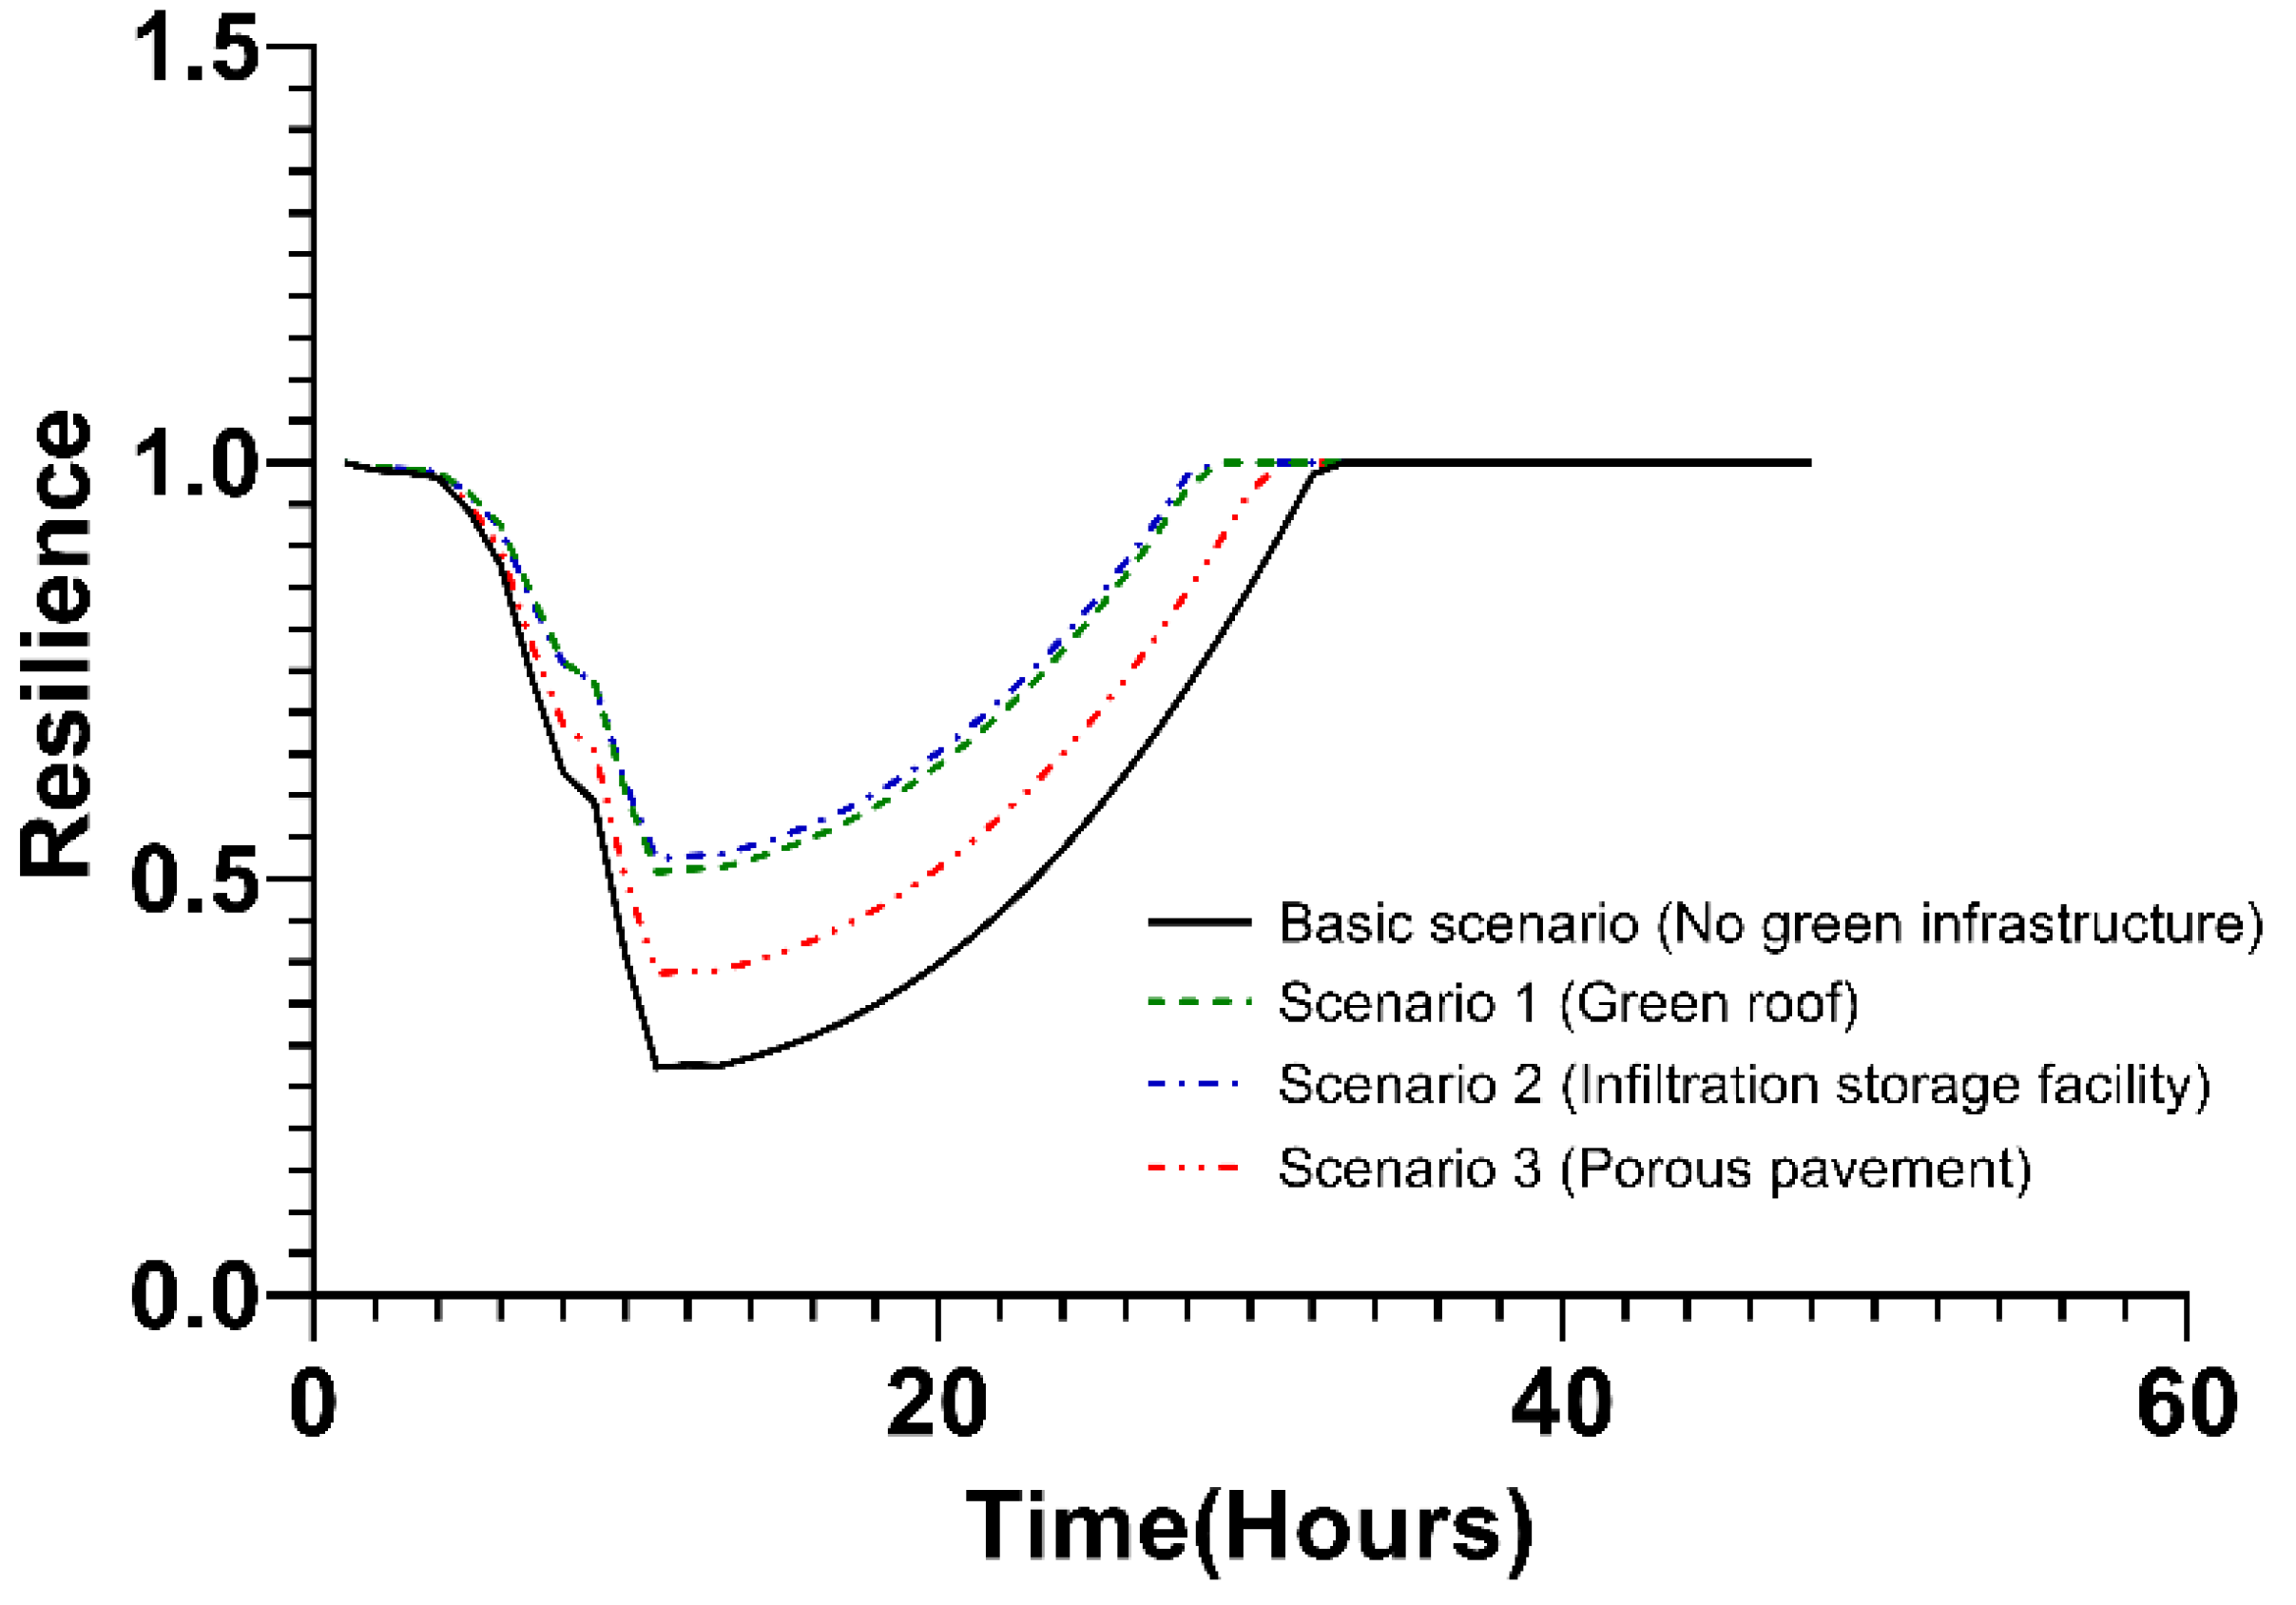
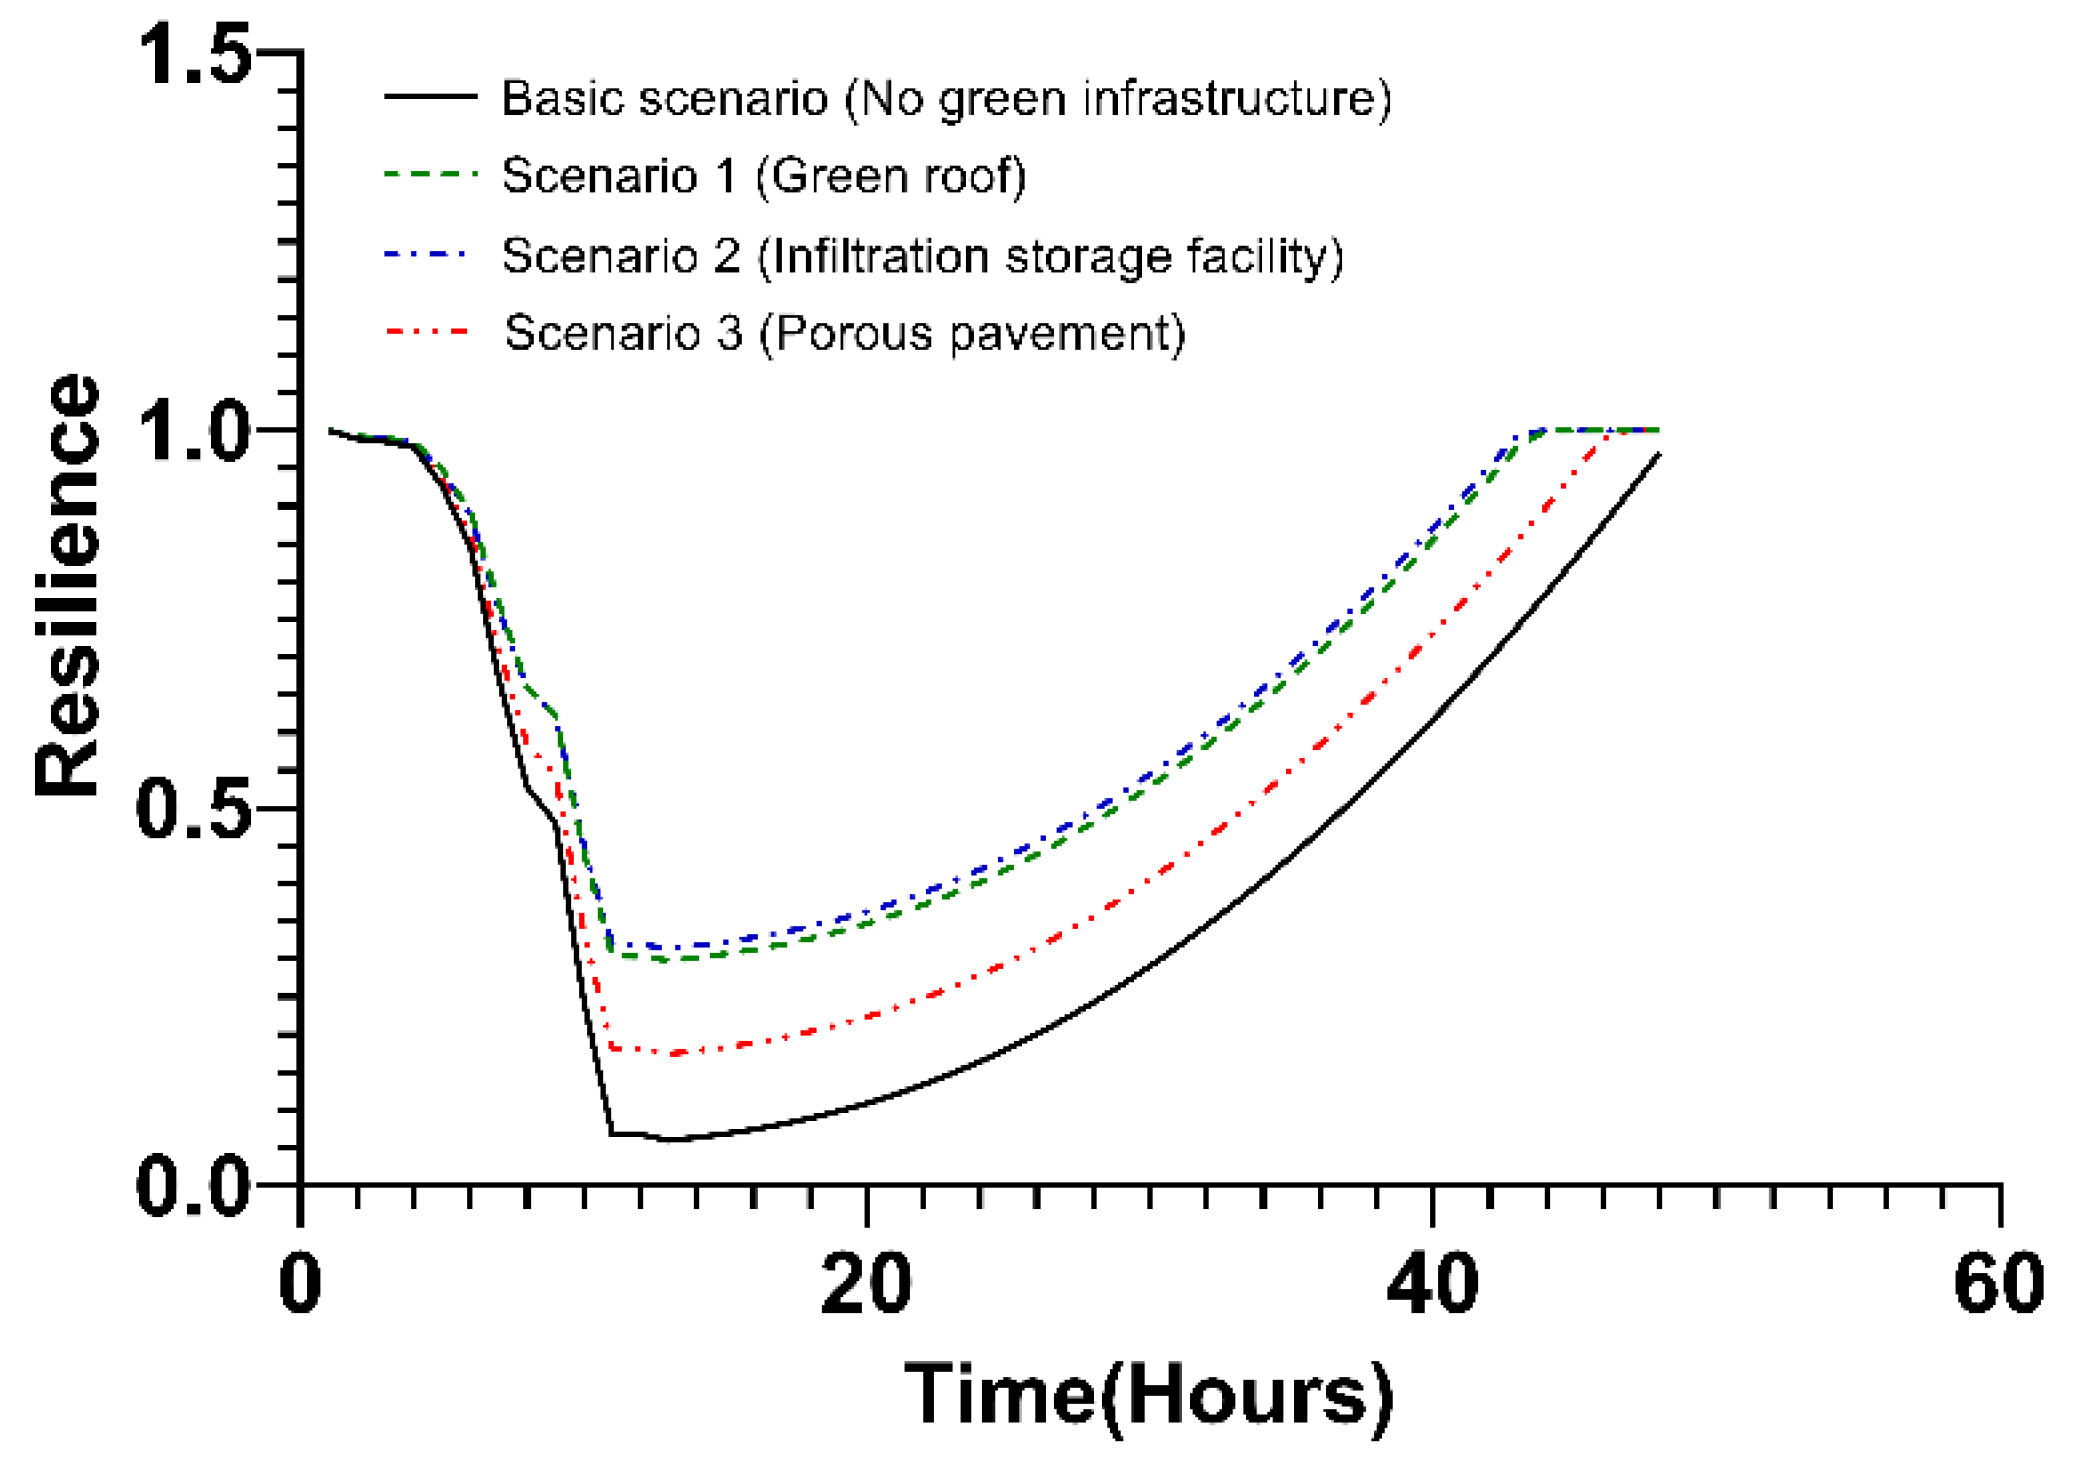
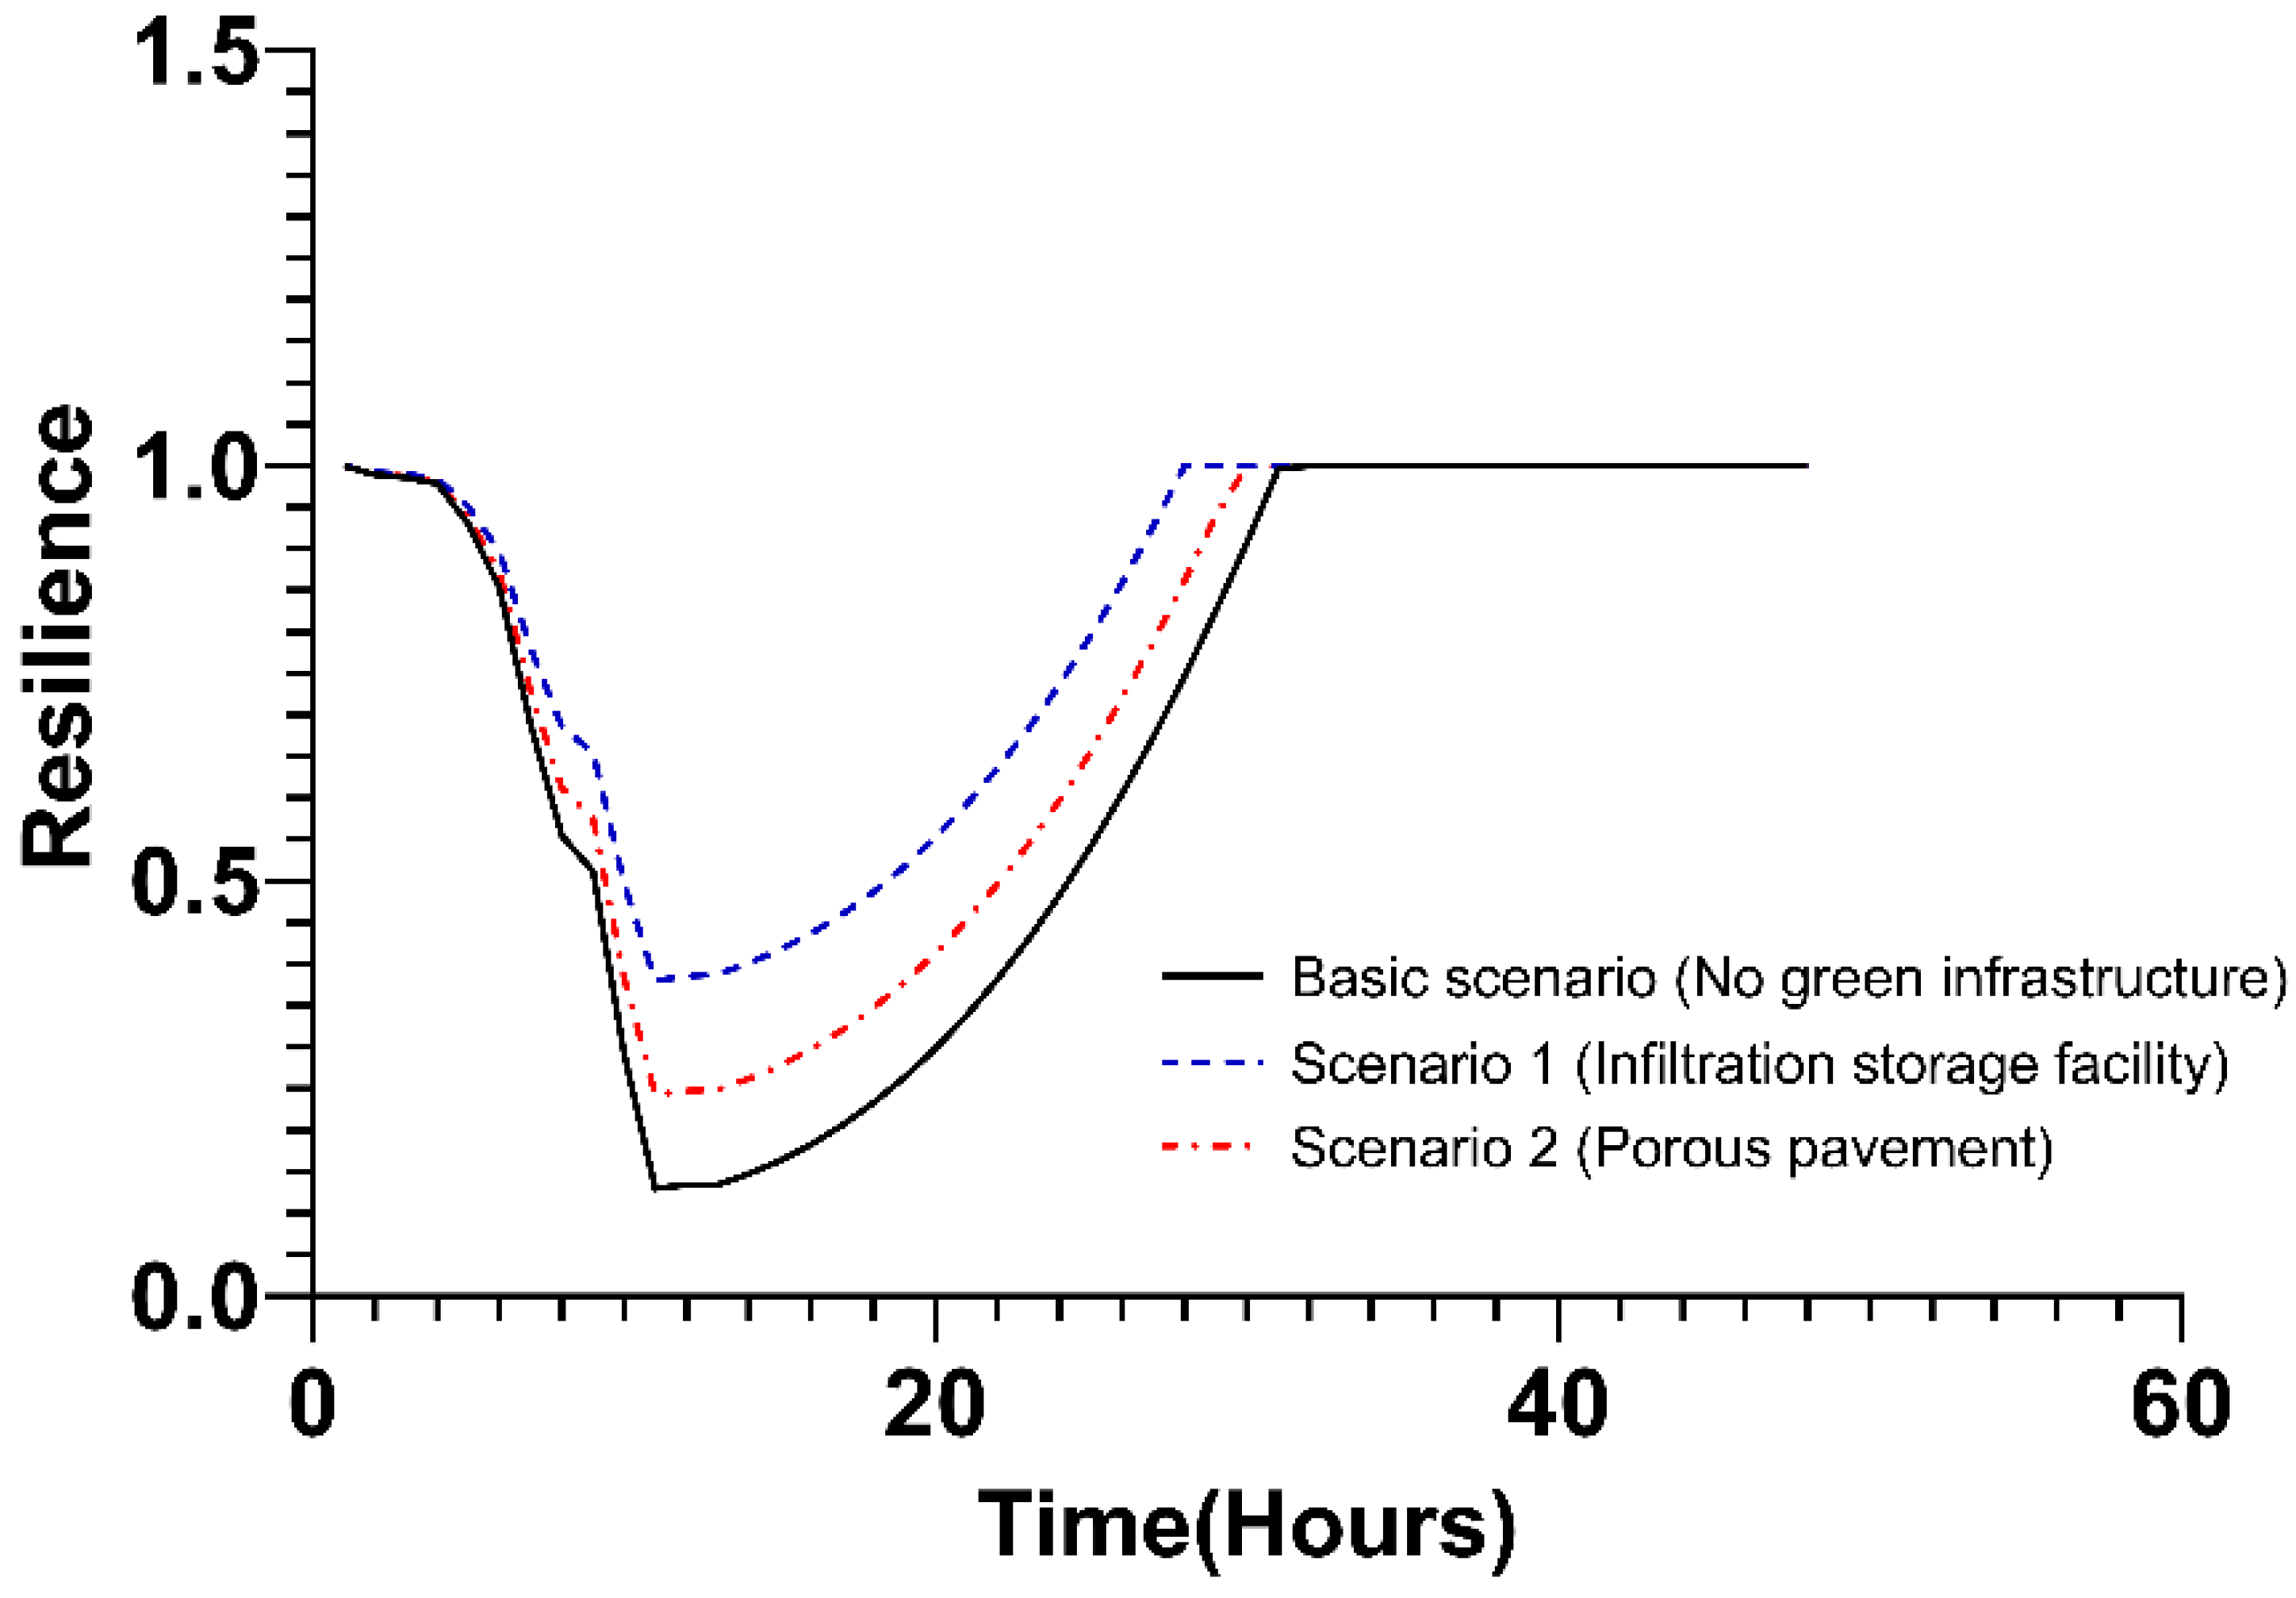
3.2.2. Change in Resilience by Land Cover Type
3.3. Discussion: Nature-Based Restoration Planning
4. Conclusions
Supplementary Materials
Author Contributions
Funding
Institutional Review Board Statement
Informed Consent Statement
Data Availability Statement
Conflicts of Interest
References
- Hewitt, K. Regions of Risk: A Geographical Introduction to Disasters, 1st ed.; Routledge: London, UK, 1997; pp. 1–410. [Google Scholar]
- Mo, Y.; Kearney, M.S.; Turner, R.E. The resilience of coastal marshes to hurricanes: The potential impact of excess nutrients. Environ. Int. 2020, 138, 105409. [Google Scholar] [CrossRef] [PubMed]
- Ministry of Public Safety and Security. Disaster Annual Report; Korea Forest Service: Daejeon, Republic of Korea, 2020; pp. 1–181.
- Korea Institute of Construction Technology. Development of On-Site In-line Storage and Drainage Sewer System against Heavy Rains; Korea Institute of Construction Technology: Goyang, Republic of Korea, 2016; pp. 1–143. [Google Scholar]
- Jeong, D.; Kim, M.; Song, K.; Lee, J. Planning a green infrastructure network to integrate potential evacuation routes and the urban green space in a coastal city: The case study of Haeundae District, Busan, South Korea. Sci. Total Environ. 2021, 761, 143179. [Google Scholar] [CrossRef] [PubMed]
- Kim, C. Analysis of Community Flood Resilience in Relation to Characteristics of Flood Damage. Ph.D. Dissertation, Seoul National University, Seoul, Republic of Korea, February 2021. [Google Scholar]
- Troy, T.J.; Konar, M.; Srinivasan, V.; Thompson, S. Moving sociohydrology forward: A synthesis across studies. Hydrol. Earth Syst. Sci. 2015, 19, 3667–3679. [Google Scholar] [CrossRef]
- Blair, P.; Buytaert, W. Socio-hydrological modelling: A review asking “why, what and how?”. Hydrol. Earth Syst. Sci. 2016, 20, 443–478. [Google Scholar] [CrossRef]
- Levy, M.C.; Garcia, M.; Blair, P.; Chen, X.; Gomes, S.L.; Gower, D.B.; Grames, J.; Kuil, L.; Liu, Y.; Zeng, R.; et al. Wicked but worth it: Student perspectives on socio-hydrology. Hydrol. Process. 2016, 30, 1467–1472. [Google Scholar] [CrossRef]
- Yu, D.J.; Sangwan, N.; Sung, K.; Chen, X.; Merwade, V. Incorporating institutions and collective action into a sociohydrological model of flood resilience. Water Resour. Res. 2017, 53, 1336–1353. [Google Scholar] [CrossRef]
- Lee, J. Development and Application of Artificial Intelligence Based Model for Real Time Flood Forecasting. Ph.D. Dissertation, Inha University, Incheon, Republic of Korea, February 2021. [Google Scholar]
- Chávez, V.; Lithgow, D.; Losada, M.; Silva-Casarin, R. Coastal green infrastructure to mitigate coastal squeeze. J. Infrastruct. Preserv. Resil. 2021, 2, 7. [Google Scholar] [CrossRef]
- Masselink, G.; Lazarus, E.D. Defining coastal resilience. Water 2019, 11, 2587. [Google Scholar] [CrossRef]
- Sohn, W.; Bae, J.; Newman, G. Green infrastructure for coastal flood protection: The longitudinal impacts of green infrastructure patterns on flood damage. Appl. Geogr. 2021, 135, 102565. [Google Scholar] [CrossRef]
- Sohn, W.; Kim, J.H.; Li, M.H. Low-impact development for impervious surface connectivity mitigation: Assessment of directly connected impervious areas (DCIAs). JEPM 2017, 60, 1871–1889. [Google Scholar] [CrossRef]
- Woo, H. Nature-based solutions and similar concepts on water management. In Proceedings of the IOP Conference Series: Earth and Environmental Science; IOP Publishing: Bristol, UK, 2020; p. 012094. [Google Scholar] [CrossRef]
- Schilling, J.; Logan, J. Greening the rust belt: A green infrastructure model for right sizing America’s shrinking cities. J. Am. Plann. Assoc. 2008, 74, 451–466. [Google Scholar] [CrossRef]
- Driscoll, C.T.; Eger, C.G.; Chandler, D.G.; Davidson, C.I.; Roodsari, B.K.; Flynn, C.D.; Groffman, P.M. Green Infrastructure: Lessons from Science and Practice; A publication of the Science Policy Exchange: Montreal, QC, Canada, 2015; pp. 1–32. [Google Scholar]
- Li, H.; Sharkey, L.J.; Hunt, W.F.; Davis, A.P. Mitigation of impervious surface hydrology using bioretention in North Carolina and Maryland. J. Hydrol. Eng. 2009, 14, 407–415. [Google Scholar] [CrossRef]
- Lim, T.C.; Welty, C. Effects of spatial configuration of imperviousness and green infrastructure networks on hydrologic response in a residential sewershed. Water Resour. Res. 2017, 53, 8084–8104. [Google Scholar] [CrossRef]
- Shuster, W.; Rhea, L. Catchment-scale hydrologic implications of parcel-level stormwater management (Ohio USA). J. Hydrol. 2013, 485, 177–187. [Google Scholar] [CrossRef]
- Loperfido, J.V.; Noe, G.B.; Jarnagin, S.T.; Hogan, D.M. Effects of distributed and centralized stormwater best management practices and land cover on urban stream hydrology at the catchment scale. J. Hydrol. 2014, 519, 2584–2595. [Google Scholar] [CrossRef]
- Holling, C.S. Surprise for science, resilience for ecosystems, and incentives for people. Ecol. Appl. 1996, 6, 733–735. [Google Scholar] [CrossRef]
- Wang, C.; Blackmore, J. Resilience Concepts for Water Resource Systems. J. Water Resour. Plan. Manag. 2009, 135, 528–536. [Google Scholar] [CrossRef]
- O’Neill, R.V.; Deangelis, D.L.; Waide, J.B.; Allen, T.F.H.; Allen, G.E. A Hierarchical Concept of Ecosystems; Princeton University Press: Princeton, NJ, USA, 1986; pp. 1–253. [Google Scholar]
- Pimm, S.L. The complexity and stability of ecosystems. Nature 1984, 307, 321–326. [Google Scholar] [CrossRef]
- Yoon, H.; Park, J.; Jeon, Y. A study on wave overtopping of the seawall at Haeundae Marine City during the passing of typhoon Chaba. J. Korean Soc. Mar. Environ. Energy 2017, 20, 152–159. [Google Scholar] [CrossRef]
- Jung, H.C.; Lee, W.K.; Cho, J.G. A Study on Climate Change Vulnerability for Supporting Pilot Project of Local Government Adaptation Implementation Planning; Korea Environment Institute: Seoul, Republic of Korea, 2012. [Google Scholar]
- Song, K.; Kim, M.; Kang, H.M.; Ham, E.K.; Noh, J.; Khim, J.S.; Chon, J. Stormwater runoff reduction simulation model for urban flood restoration in coastal area. Nat. Hazards 2022, 114, 2509–2526. [Google Scholar] [CrossRef]
- Korea Meteorological Administration. Maximum Precipitation per Hour. Available online: https://www.weather.go.kr/w/index.do (accessed on 12 December 2017).
- Ministry of Environment. National Impervious Area Survey and Improvement Plan Research; Ministry of Environment: Seoul, Republic of Korea, 2013.
- Son, C.H.; Hyun, K.H.; Kim, D.; Baek, J.I.; Ban, Y.U. Development and application of a Low Impact Development (LID)-based district unit planning model. Sustainability 2017, 9, 145. [Google Scholar] [CrossRef]
- Baek, S.Y.; Kim, H.W.; Kim, M.K.; Han, M.Y. Runoff reduction effect of rainwater retentive green roof. KIEAE J. 2016, 16, 67–71. [Google Scholar] [CrossRef]
- Yi, J.E.; Yeo, W.G.; Shim, J.H.; Kang, T.H. Analysis of stormwater runoff reduction effects by using porous pavement. KSCE J. 2001, 21, 645–654. [Google Scholar]
- Im, J.H.; Yeoun, J.W.; Shim, J.H.; Song, J.W. A study on runoff reducing efficiency of infiltration collector well installation for heavy rainfall event. In Proceedings of the Korea Water Resources Association Conference; KWRA: Seoul, Republic of Korea; Available online: https://koreascience.kr/article/CFKO200610912725271.pdf (accessed on 18 May 2006).
- Ministry of Environment. Biotope Area Rate Application Guideline. Available online: http://www.me.go.kr/home/web/policy_data/read.do?pagerOffset=0&maxPageItems=10&maxIndexPages=10&searchKey=title&searchValue=%EC%83%9D%ED%83%9C%EB%A9%B4%EC%A0%81%EB%A5%A0&menuId=10261&orgCd=&condition.toInpYmd=null&condition.fromInpYmd=null&condition.deleteYn=N&condition.deptNm=null&seq=6885 (accessed on 25 January 2017).
- Simonovic, S.P.; Peck, A. Dynamic Resilience to Climate Change Caused Natural Disasters in Coastal Megacities Quantification Framework. Br. J. Environ. Clim. Chang. 2013, 3, 378–401. [Google Scholar] [CrossRef]
- Kammouh, O.; Gardoni, P.; Cimellaro, G.P. Resilience assessment of dynamic engineering systems. In Proceedings of MATEC Web of Conferences; EDP Sciences: Les Ulis, France, 2019; p. 01008. [Google Scholar] [CrossRef]
- Simonovic, S.P.; Arunkumar, R. Comparison of static and dynamic resilience for a multipurpose reservoir operation. Water Resour. Res. 2016, 52, 8630–8649. [Google Scholar] [CrossRef]
- Nyström, M. Redundancy and response diversity of functional groups: Implications for the resilience of coral reefs. AMBIO 2006, 35, 30–35. [Google Scholar] [CrossRef]
- Vavouri, T.; Semple, J.I.; Lehner, B. Widespread conservation of genetic redundancy during a billion years of eukaryotic evolution. Trends Genet. 2008, 24, 485–488. [Google Scholar] [CrossRef]
- Sim, K.B.; Jo, D.J.; Kim, E.S. Study on Evaluation of Flood Disaster Reduction Ability Based on Operation Scenarios at the Pump Station. J. Korean Soc. Hazard Mitig. 2017, 17, 393–400. [Google Scholar] [CrossRef]
- Lee, E.H.; Lee, Y.S.; Jung, D.; Joo, J.G.; Kim, J.H. Determination of operating offline detention reservoir considering system resilience. JKAIS 2016, 17, 403–411. [Google Scholar] [CrossRef] [Green Version]
- Huang, Z. Development and Application of Evaluation System for Disaster Prevention Ability of Urban Parks—A Case Study on Yulbong Park, Cheongju. Master’s Thesis, Cheongju University, Cheongju, Republic of Korea, 2020. [Google Scholar]
- Chang, C.W.; Mori, N. Green infrastructure for the reduction of coastal disasters: A review of the protective role of coastal forests against tsunami, storm surge, and wind waves. Coast. Eng. 2021, 63, 370–385. [Google Scholar] [CrossRef]
- Beatley, T. Planning for Coastal Resilience: Best Practices for Calamitous Times; Island Press: London, UK, 2012; pp. 1–181. [Google Scholar]

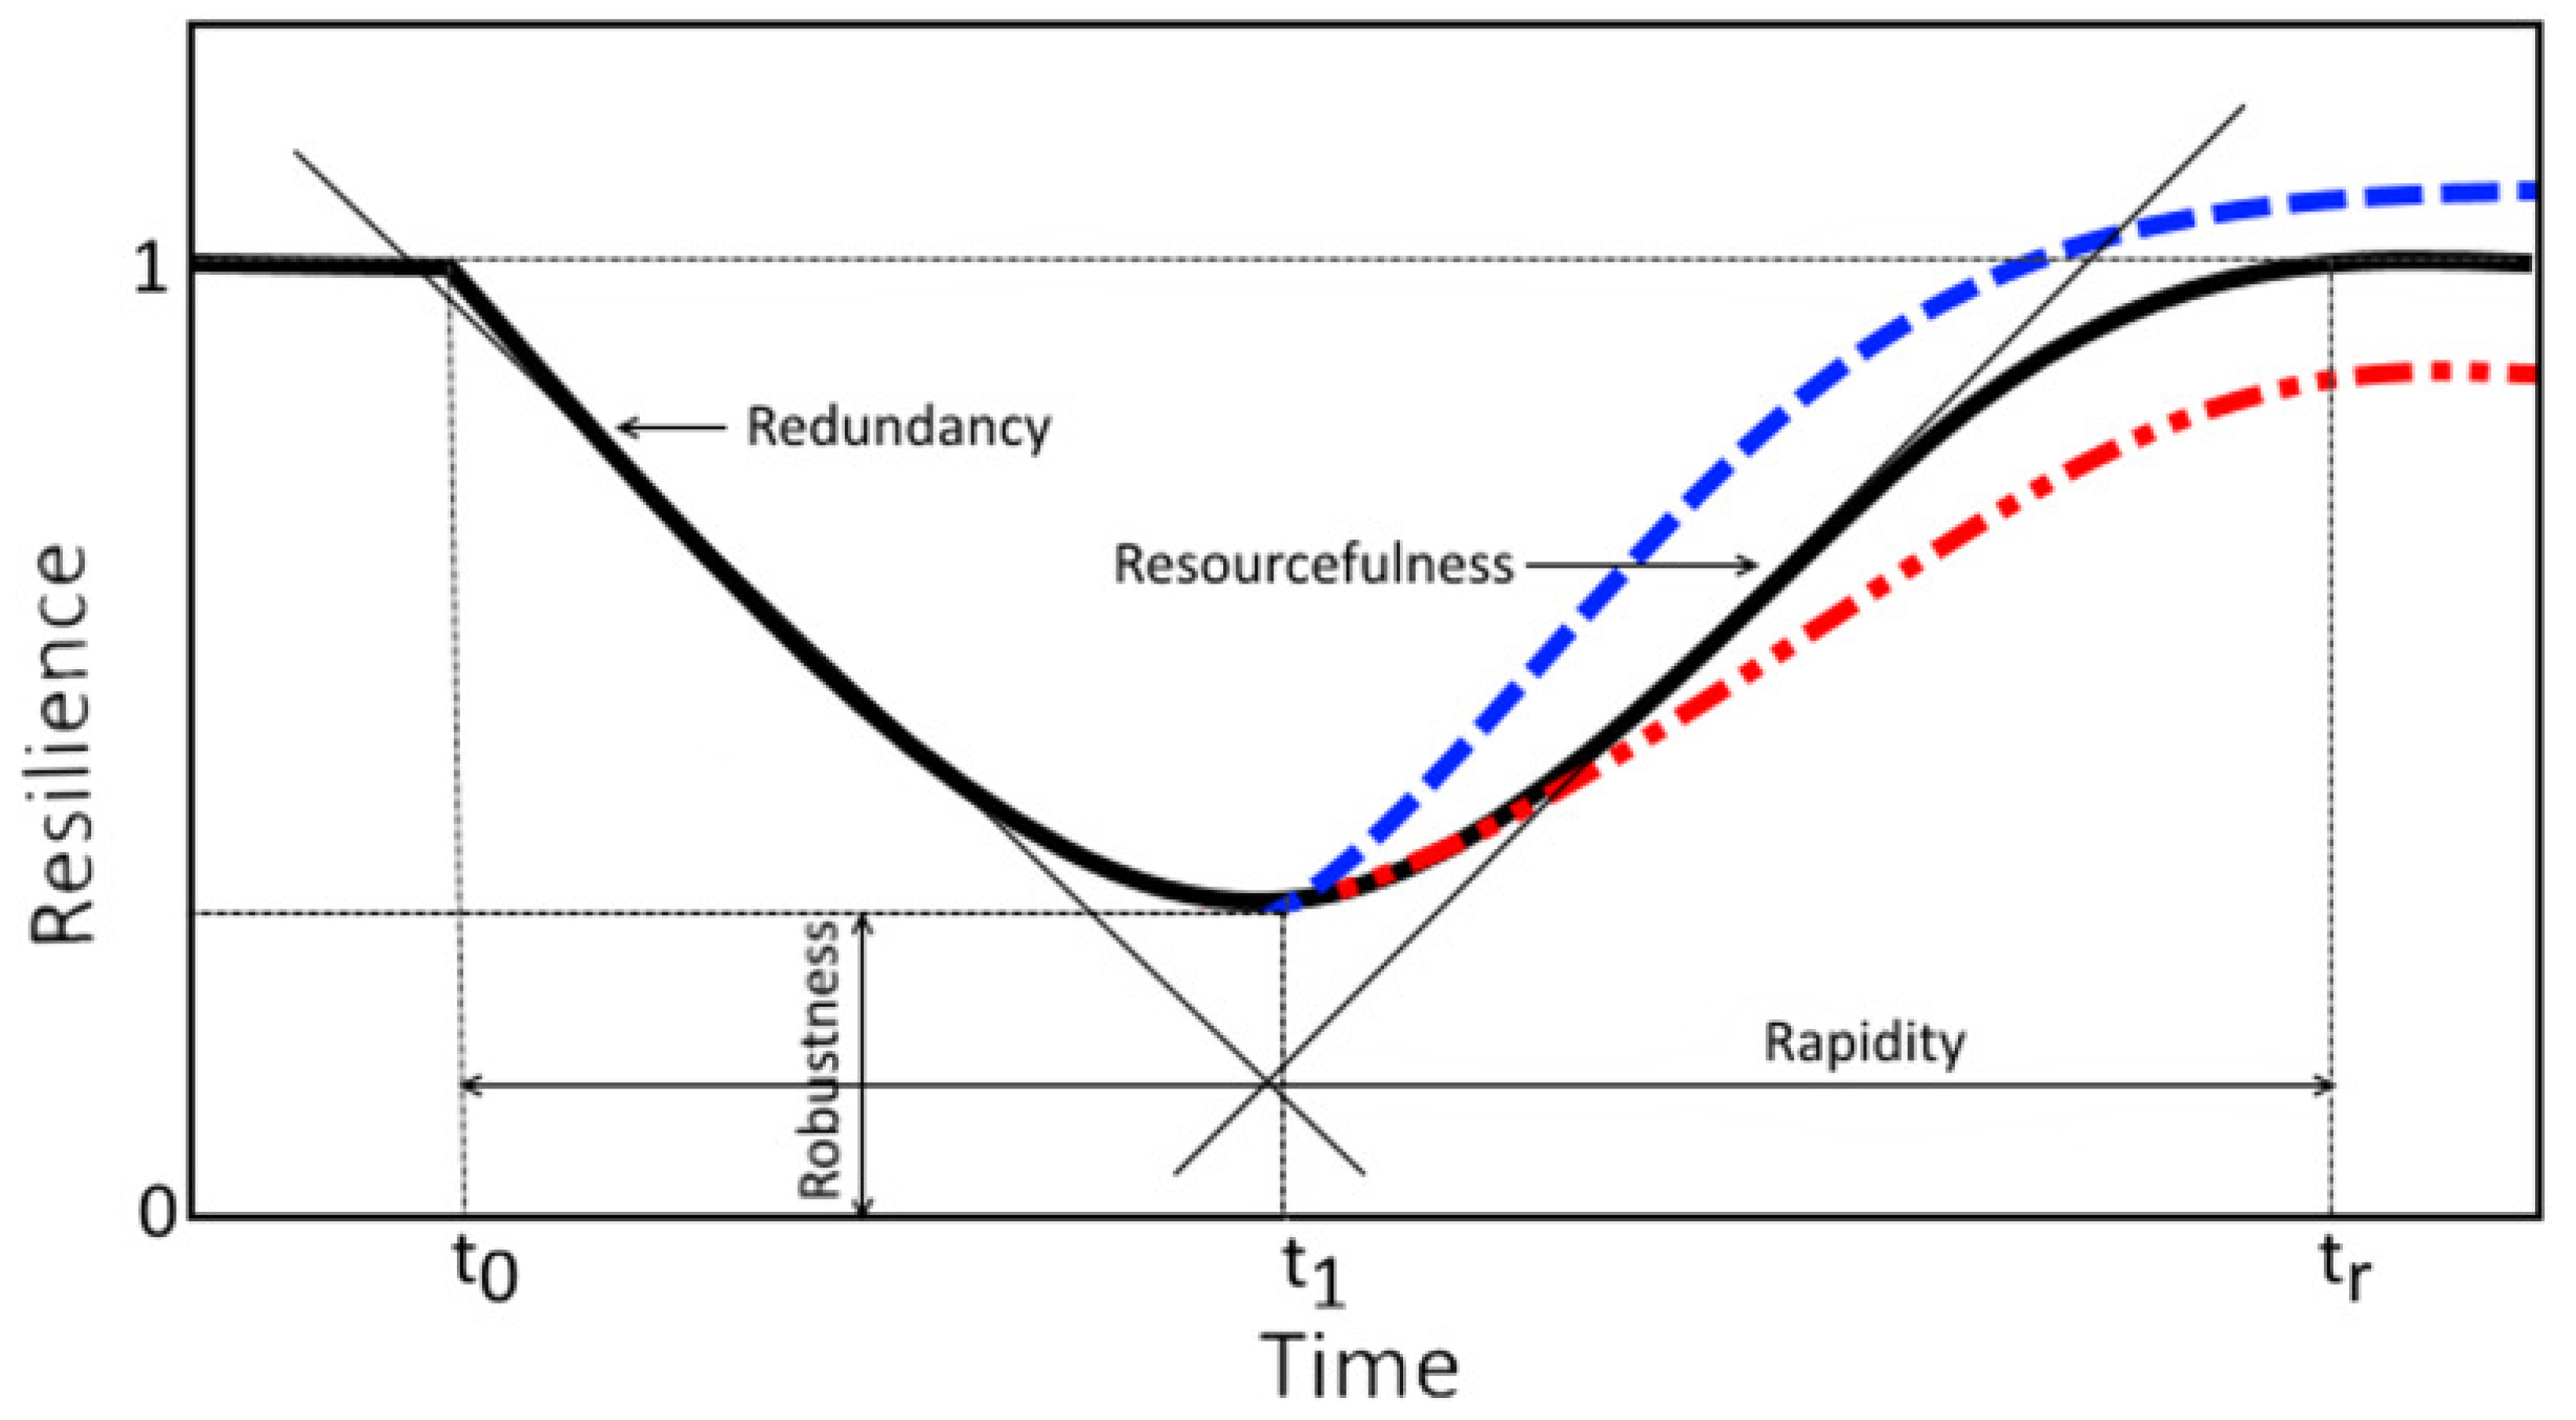


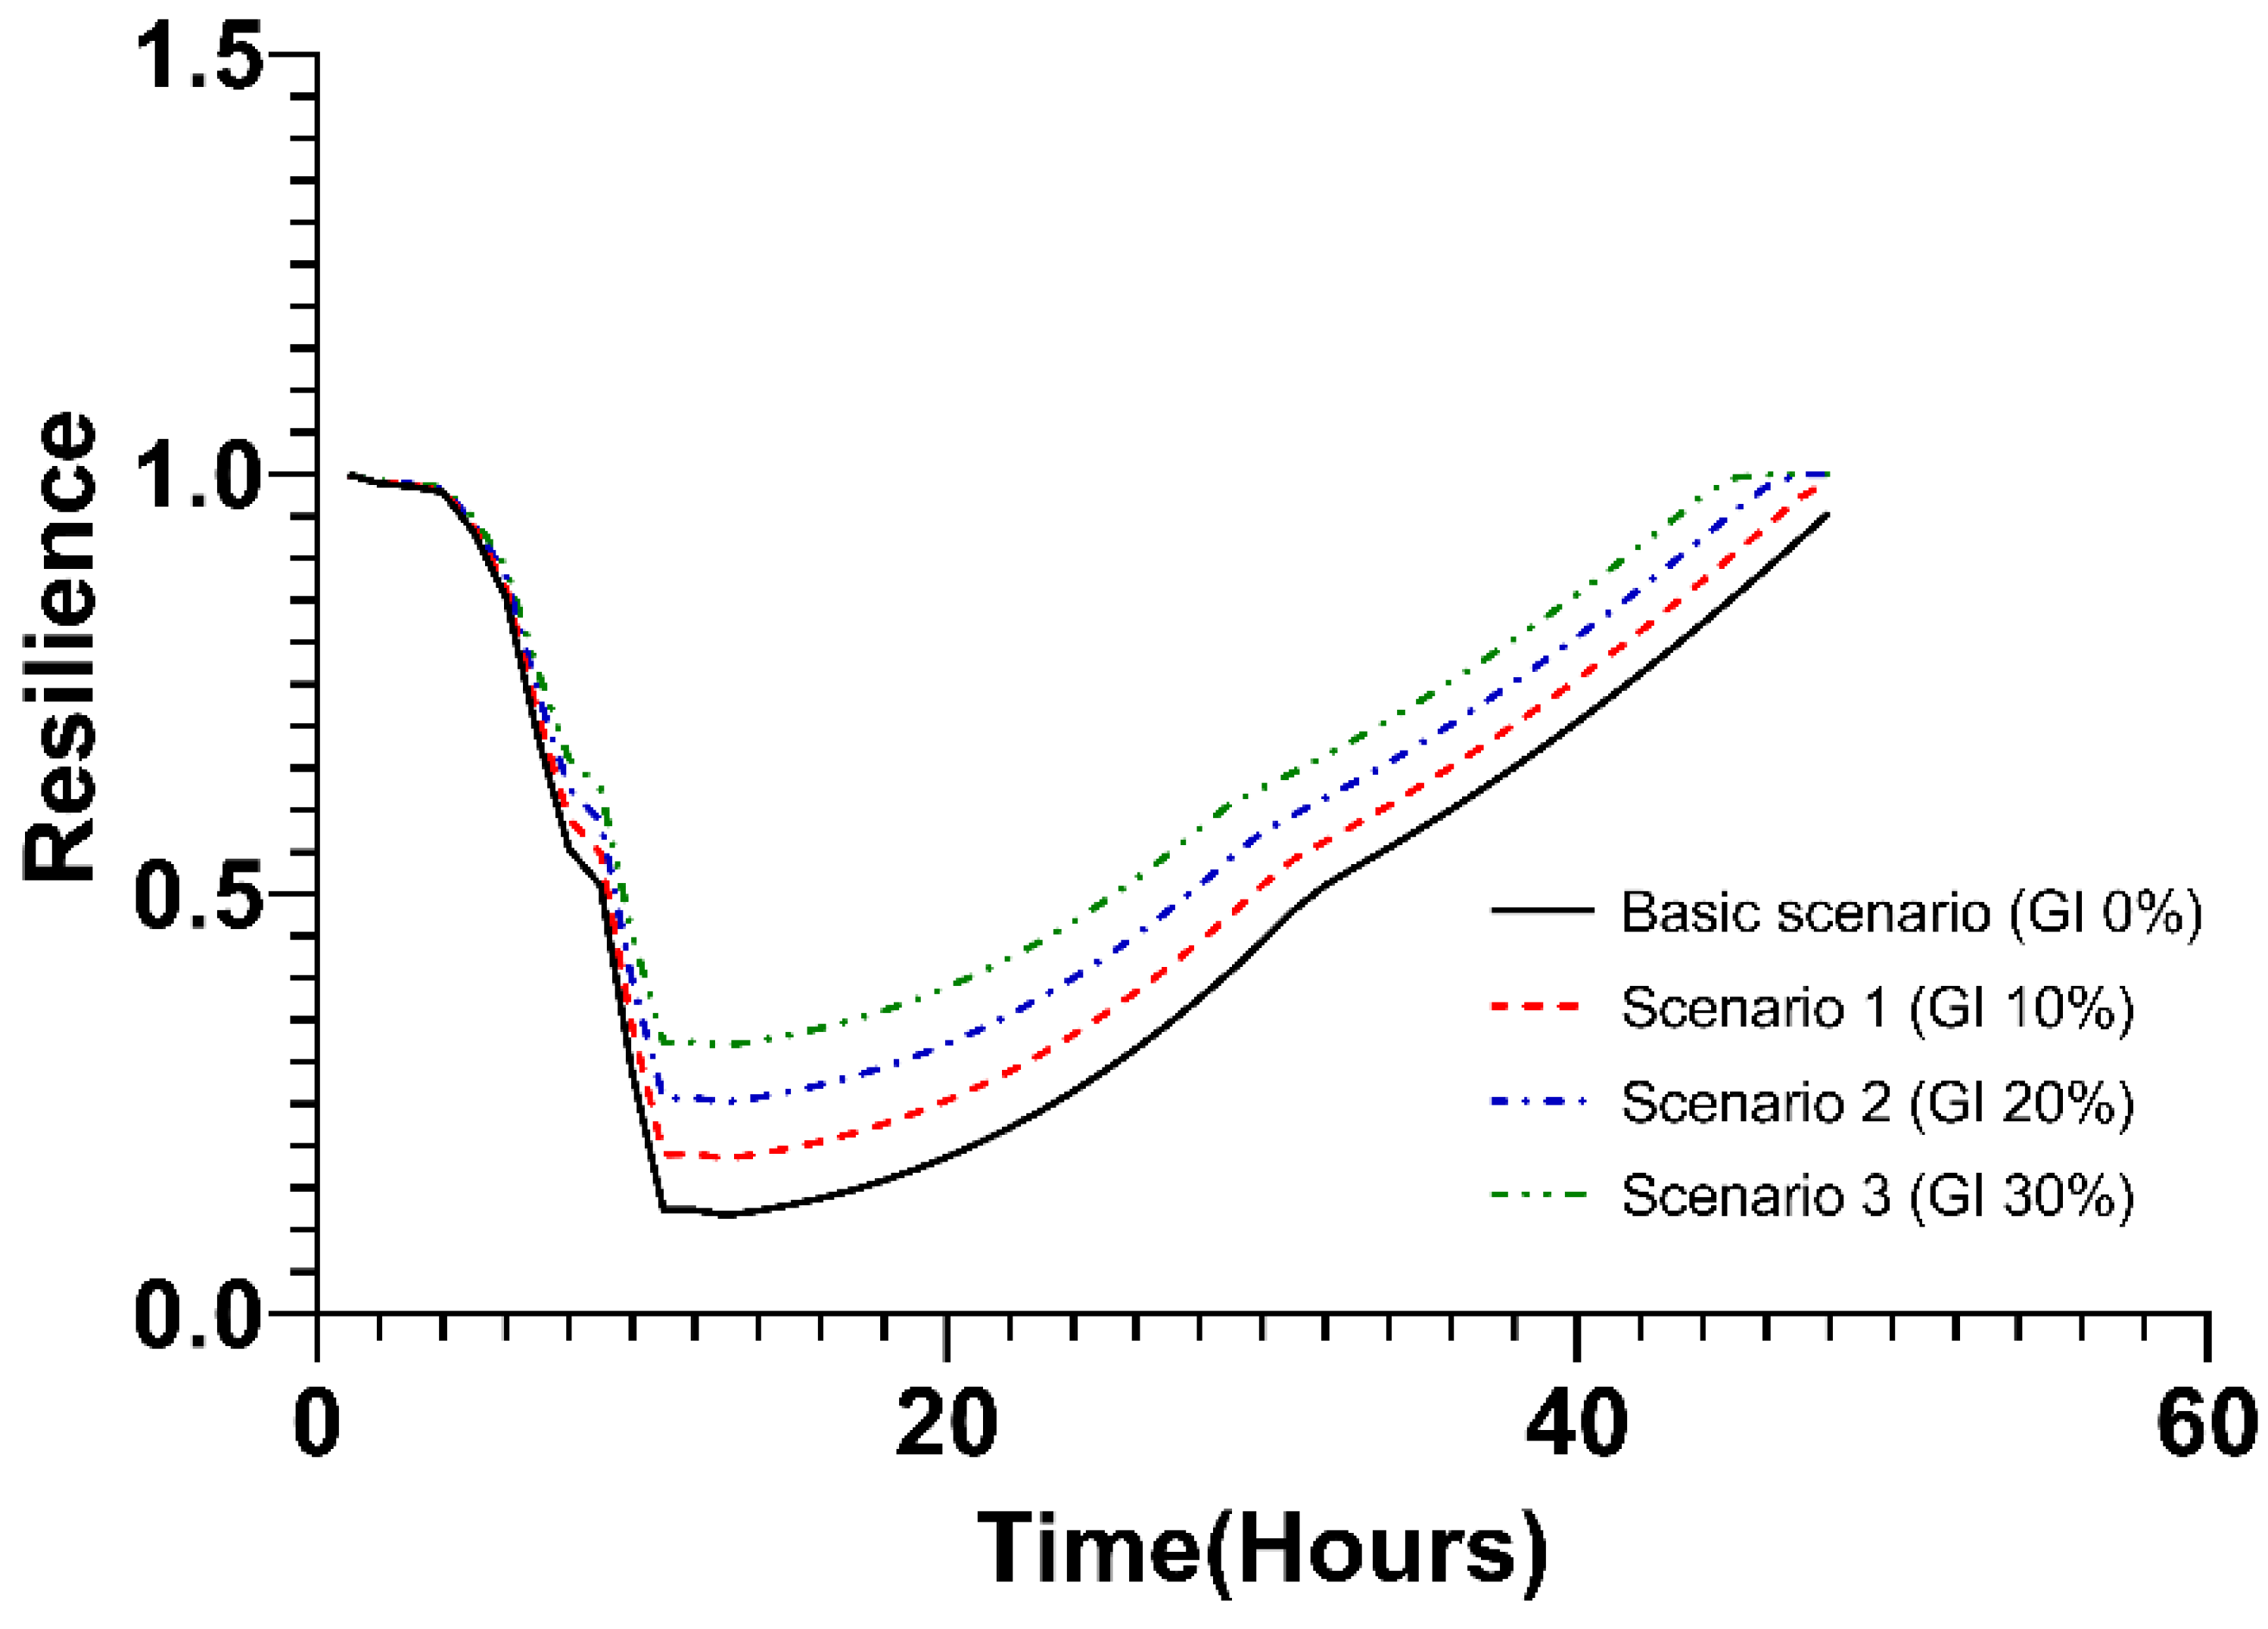

| Scenario | Resilience | |||
|---|---|---|---|---|
| Robustness | Redundancy | Resourcefulness | Rapidity (h) | |
| Basic Scenario (GI: 0%) | 0.1181 | −0.0894t + 1.2528 | - | - |
| Scenario 1 (GI: 10%) | 0.1855 | −0.0826t + 1.234 | - | - |
| Scenario 2 (GI: 20%) | 0.2529 | −0.0758t + 1.2153 | 0.0234t − 0.1265 | 47 |
| Scenario 3 (GI: 30%) | 0.3203 | −0.0689t + 1.1965 | 0.0223t − 0.0367 | 46 |
| Scenario | Resilience | |||
|---|---|---|---|---|
| Robustness | Redundancy | Resourcefulness | Rapidity (h) | |
| Basic scenario (No green infrastructure) | 0.2735 | −0.0178t + 0.034 | 0.0032t − 0.0344 | 33 |
| Scenario 1 (green roofs) | 0.5083 | −0.0128t + 0.0285 | 0.003t − 0.0328 | 29 |
| Scenario 2 (infiltration storage facilities) | 0.5239 | −0.0118t + 0.0233 | 0.003t − 0.0305 | 29 |
| Scenario 3 (porous pavement) | 0.3864 | −0.015t + 0.0286 | 0.0032t − 0.0347 | 31 |
| Scenario | Resilience | |||
|---|---|---|---|---|
| Robustness | Redundancy | Resourcefulness | Rapidity (h) | |
| Basic scenario (No green infrastructure) | 0.0603 | −0.0104t − 0.0227 | – | – |
| Scenario 1 (green roofs) | 0.2983 | −0.0084t − 0.0119 | 0.0014t − 0.0158 | 44 |
| Scenario 2 (infiltration storage facilities) | 0.3143 | −0.0078t − 0.0154 | 0.0014t − 0.0152 | 44 |
| Scenario 3 (porous pavement) | 0.1749 | −0.009t − 0.0201 | 0.0014t − 0.0152 | 47 |
| Scenario | Resilience | |||
|---|---|---|---|---|
| Robustness | Redundancy | Resourcefulness | Rapidity (h) | |
| Basic scenario (No green infrastructure) | 0.1300 | −0.0214t + 0.0435 | 0.004t − 0.0435 | 32 |
| Scenario 1 (infiltration storage facilities) | 0.3804 | −0.0154t + 0.0298 | 0.0044t − 0.0477 | 28 |
| Scenario 2 (porous pavement) | 0.2428 | −0.0186t + 0.0351 | 0.0042t − 0.0474 | 30 |
| Scenario | Resilience | |||
|---|---|---|---|---|
| Robustness | Redundancy | Resourcefulness | Rapidity (h) | |
| Basic scenario (No green infrastructure) | 0.1091 | −0.0098t − 0.0214 | - | - |
| Scenario 1 (infiltration storage facilities) | 0.3621 | −0.0072t − 0.0142 | 0.0012t − 0.0147 | 44 |
| Scenario 2 (porous pavement) | 0.2237 | −0.0086t − 0.0188 | 0.0012t − 0.0136 | 48 |
Disclaimer/Publisher’s Note: The statements, opinions and data contained in all publications are solely those of the individual author(s) and contributor(s) and not of MDPI and/or the editor(s). MDPI and/or the editor(s) disclaim responsibility for any injury to people or property resulting from any ideas, methods, instructions or products referred to in the content. |
© 2023 by the authors. Licensee MDPI, Basel, Switzerland. This article is an open access article distributed under the terms and conditions of the Creative Commons Attribution (CC BY) license (https://creativecommons.org/licenses/by/4.0/).
Share and Cite
Song, K.; Seok, Y.; Chon, J. Nature-Based Restoration Simulation for Disaster-Prone Coastal Area Using Green Infrastructure Effect. Int. J. Environ. Res. Public Health 2023, 20, 3096. https://doi.org/10.3390/ijerph20043096
Song K, Seok Y, Chon J. Nature-Based Restoration Simulation for Disaster-Prone Coastal Area Using Green Infrastructure Effect. International Journal of Environmental Research and Public Health. 2023; 20(4):3096. https://doi.org/10.3390/ijerph20043096
Chicago/Turabian StyleSong, Kihwan, Youngsun Seok, and Jinhyung Chon. 2023. "Nature-Based Restoration Simulation for Disaster-Prone Coastal Area Using Green Infrastructure Effect" International Journal of Environmental Research and Public Health 20, no. 4: 3096. https://doi.org/10.3390/ijerph20043096