
Discover the Desirable Landscape Structure of Urban Parks for Mitigating Urban Heat: A High Spatial Resolution Study Using a Forest City, Luoyang, China as a Lens


Abstract
:1. Introduction
2. Materials and Methods
2.1. Study Area
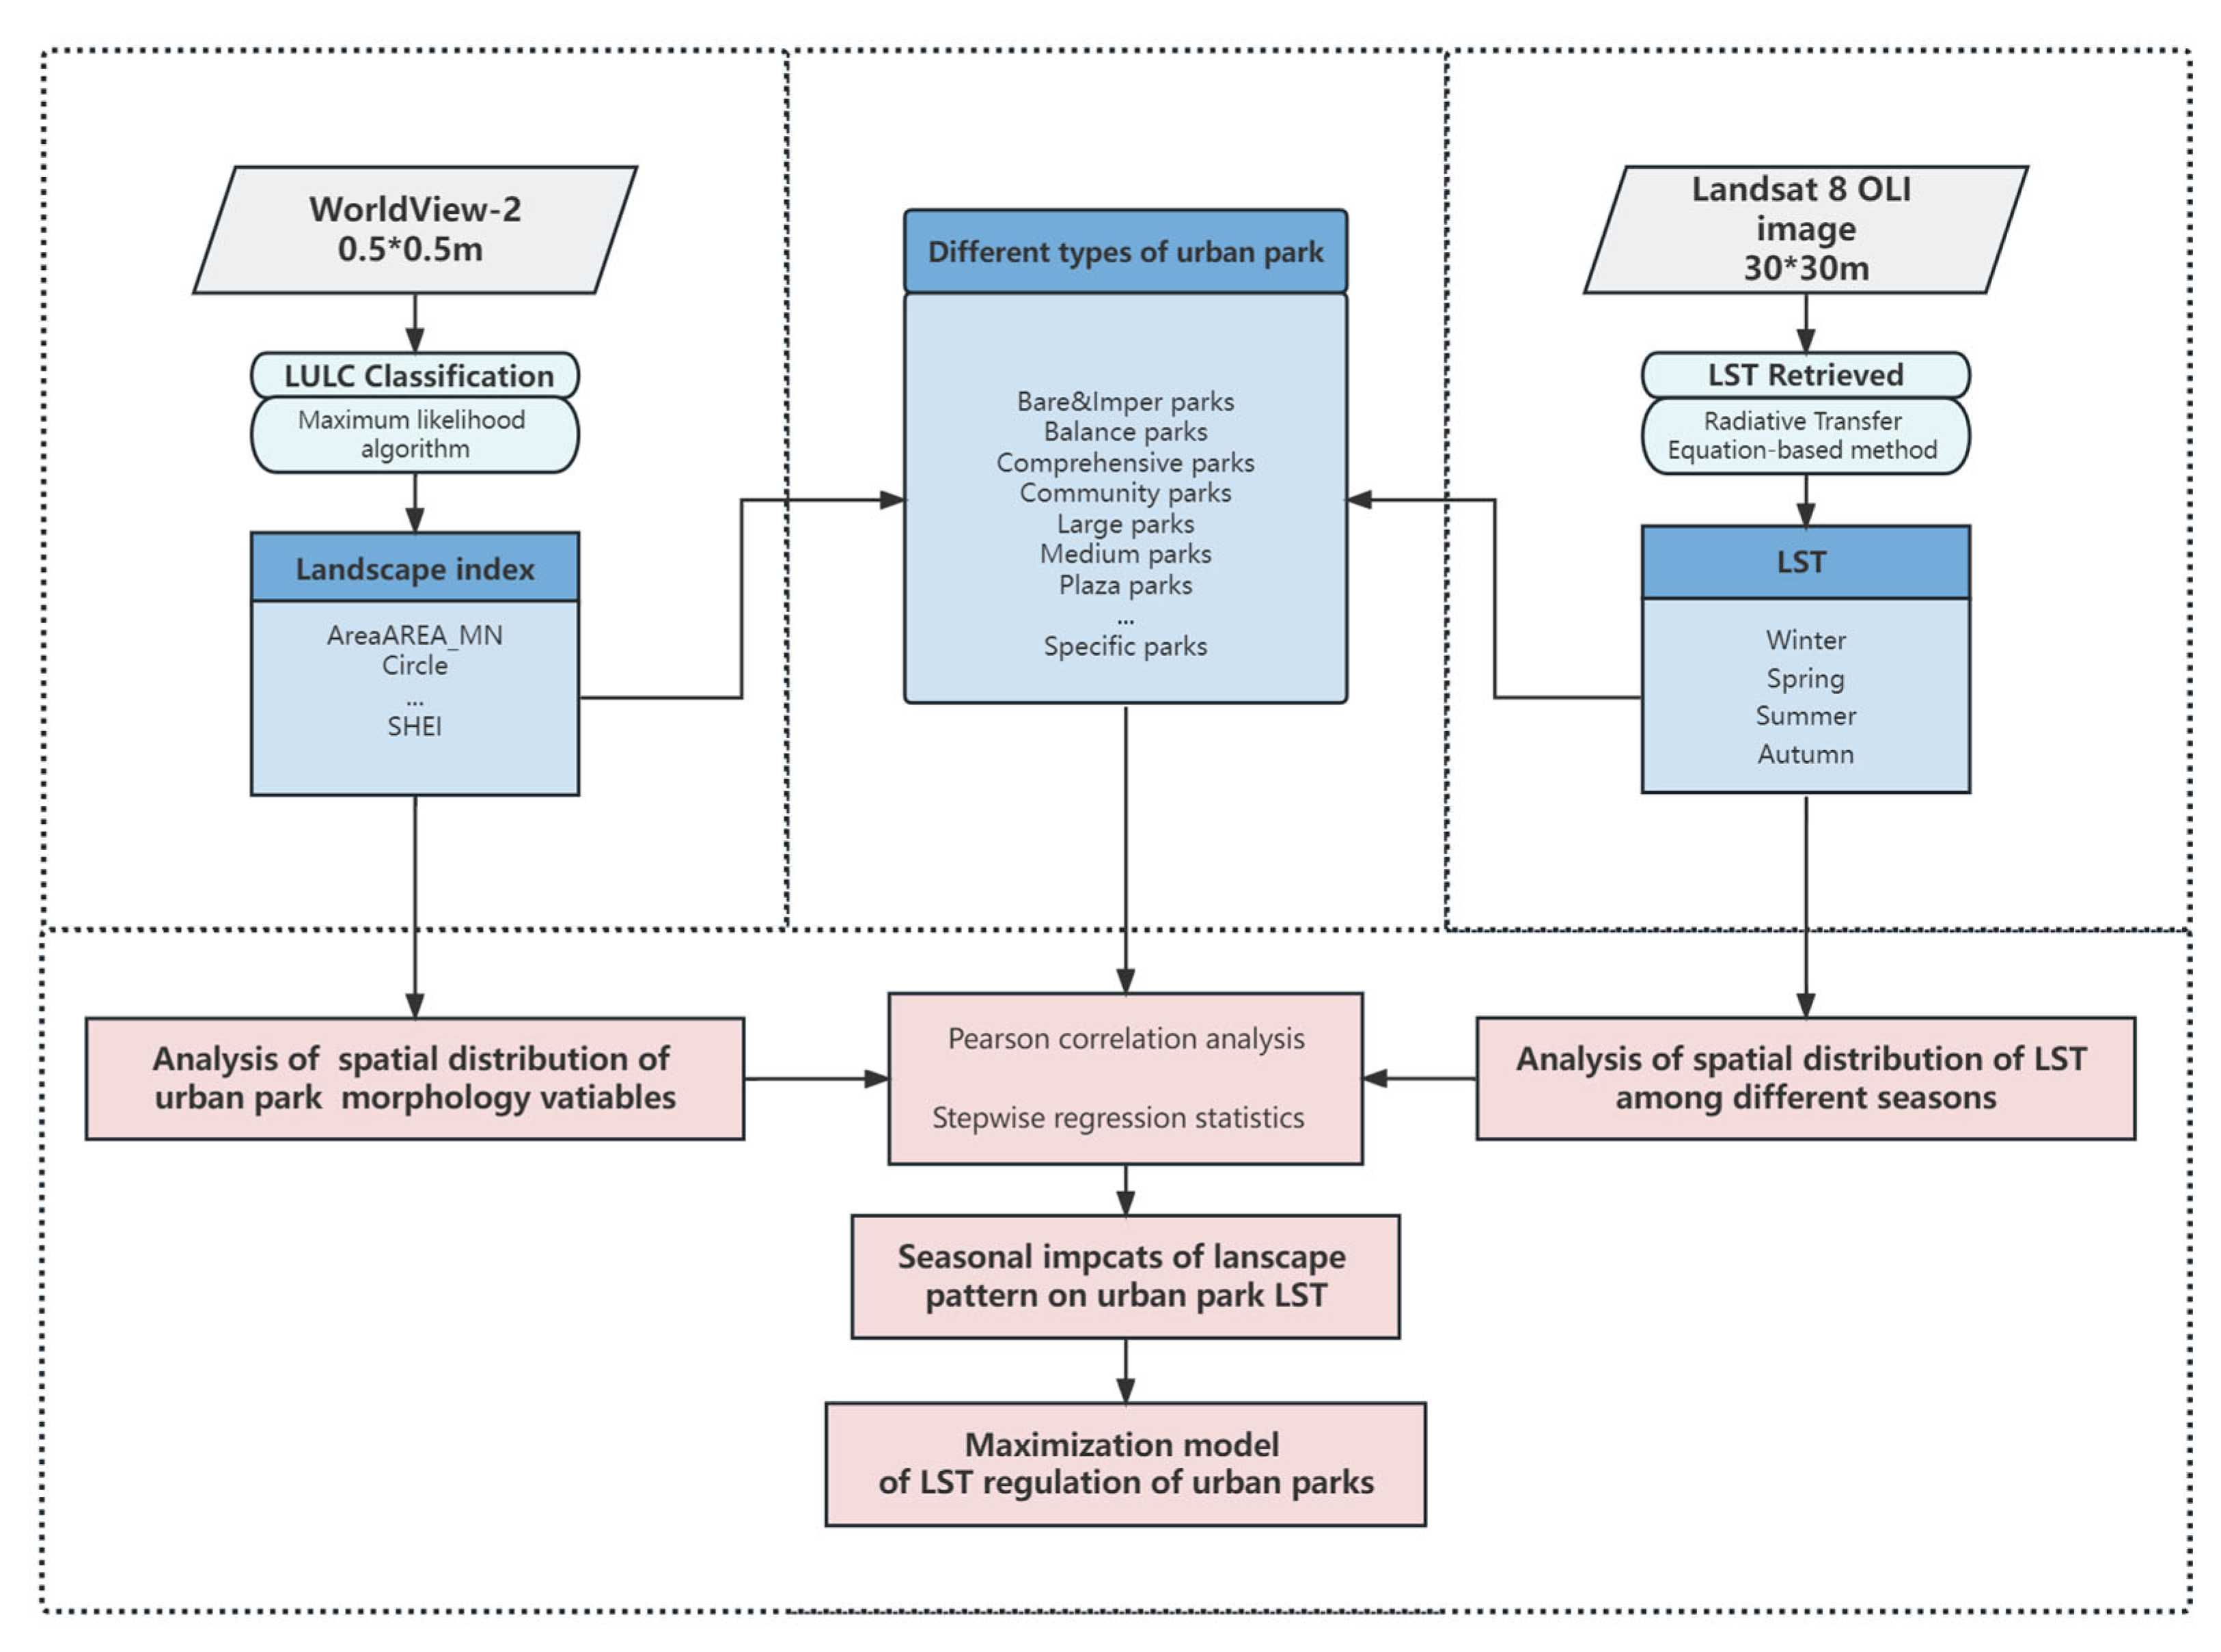
2.2. Methods
2.2.1. Inversion of LST
2.2.2. Remote Sensed Urban Park
2.2.3. Landscape Metrics
2.2.4. Correlation between LST and Landscape Pattern
3. Results
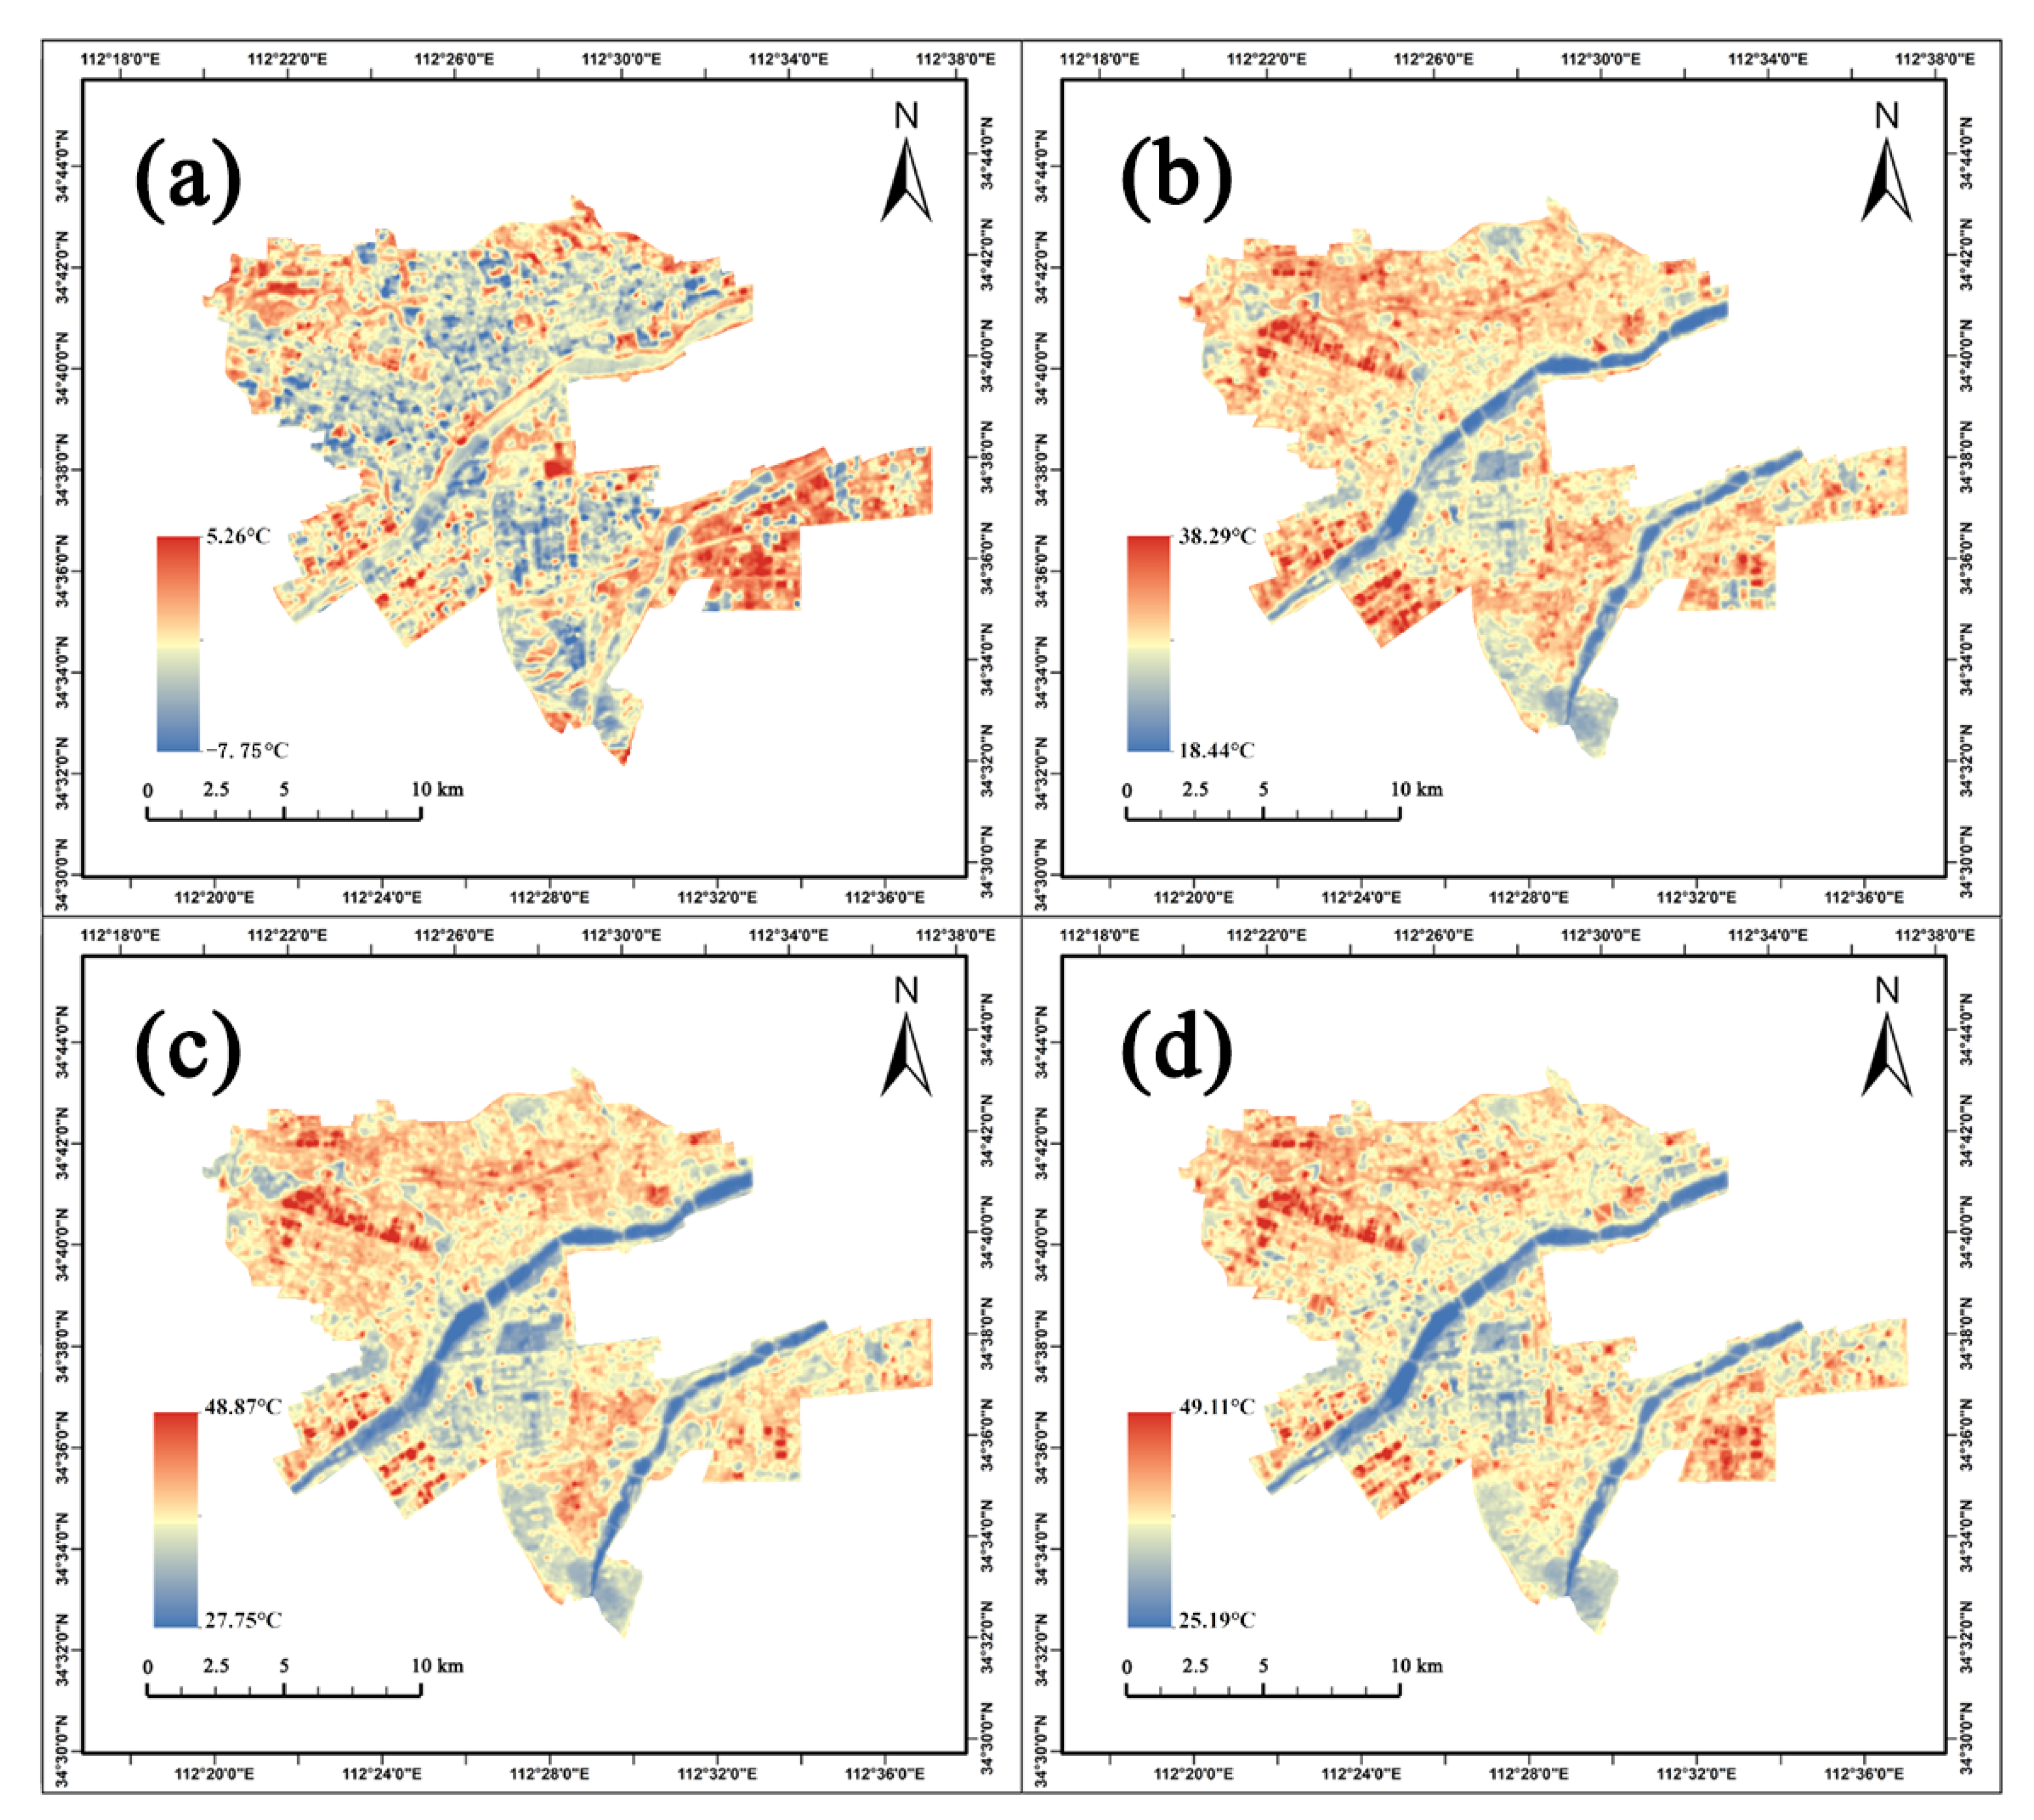
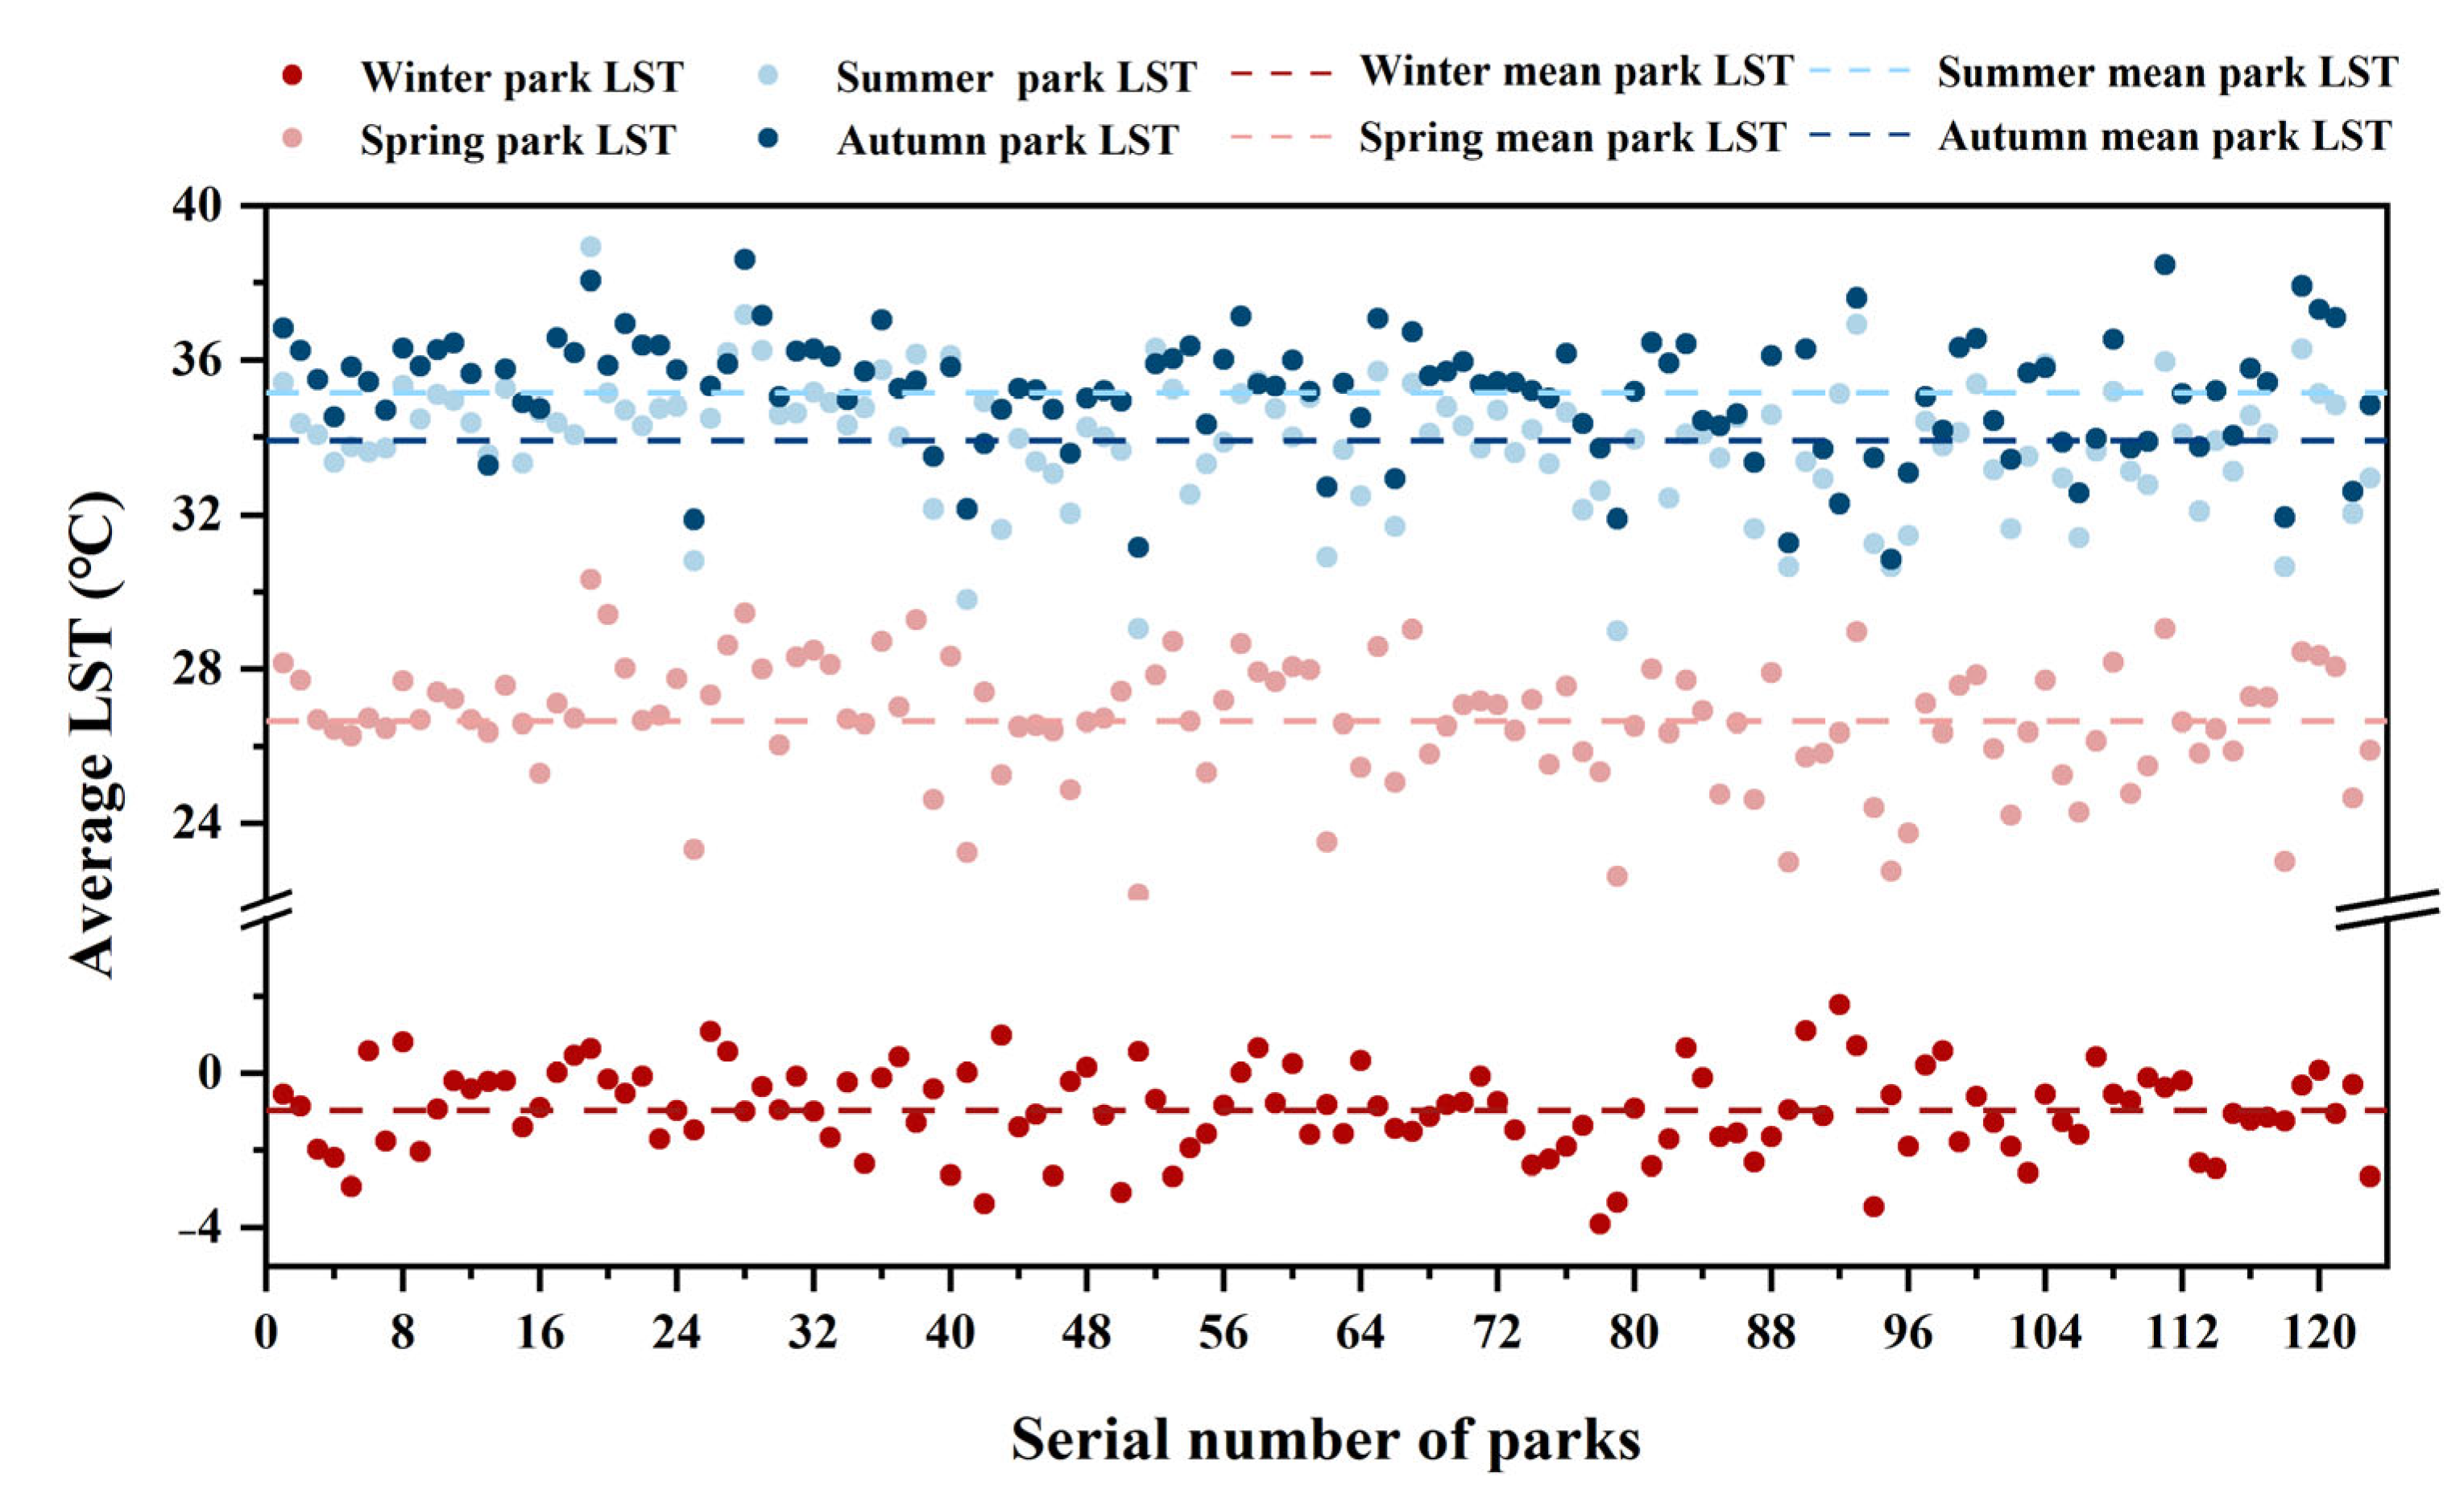
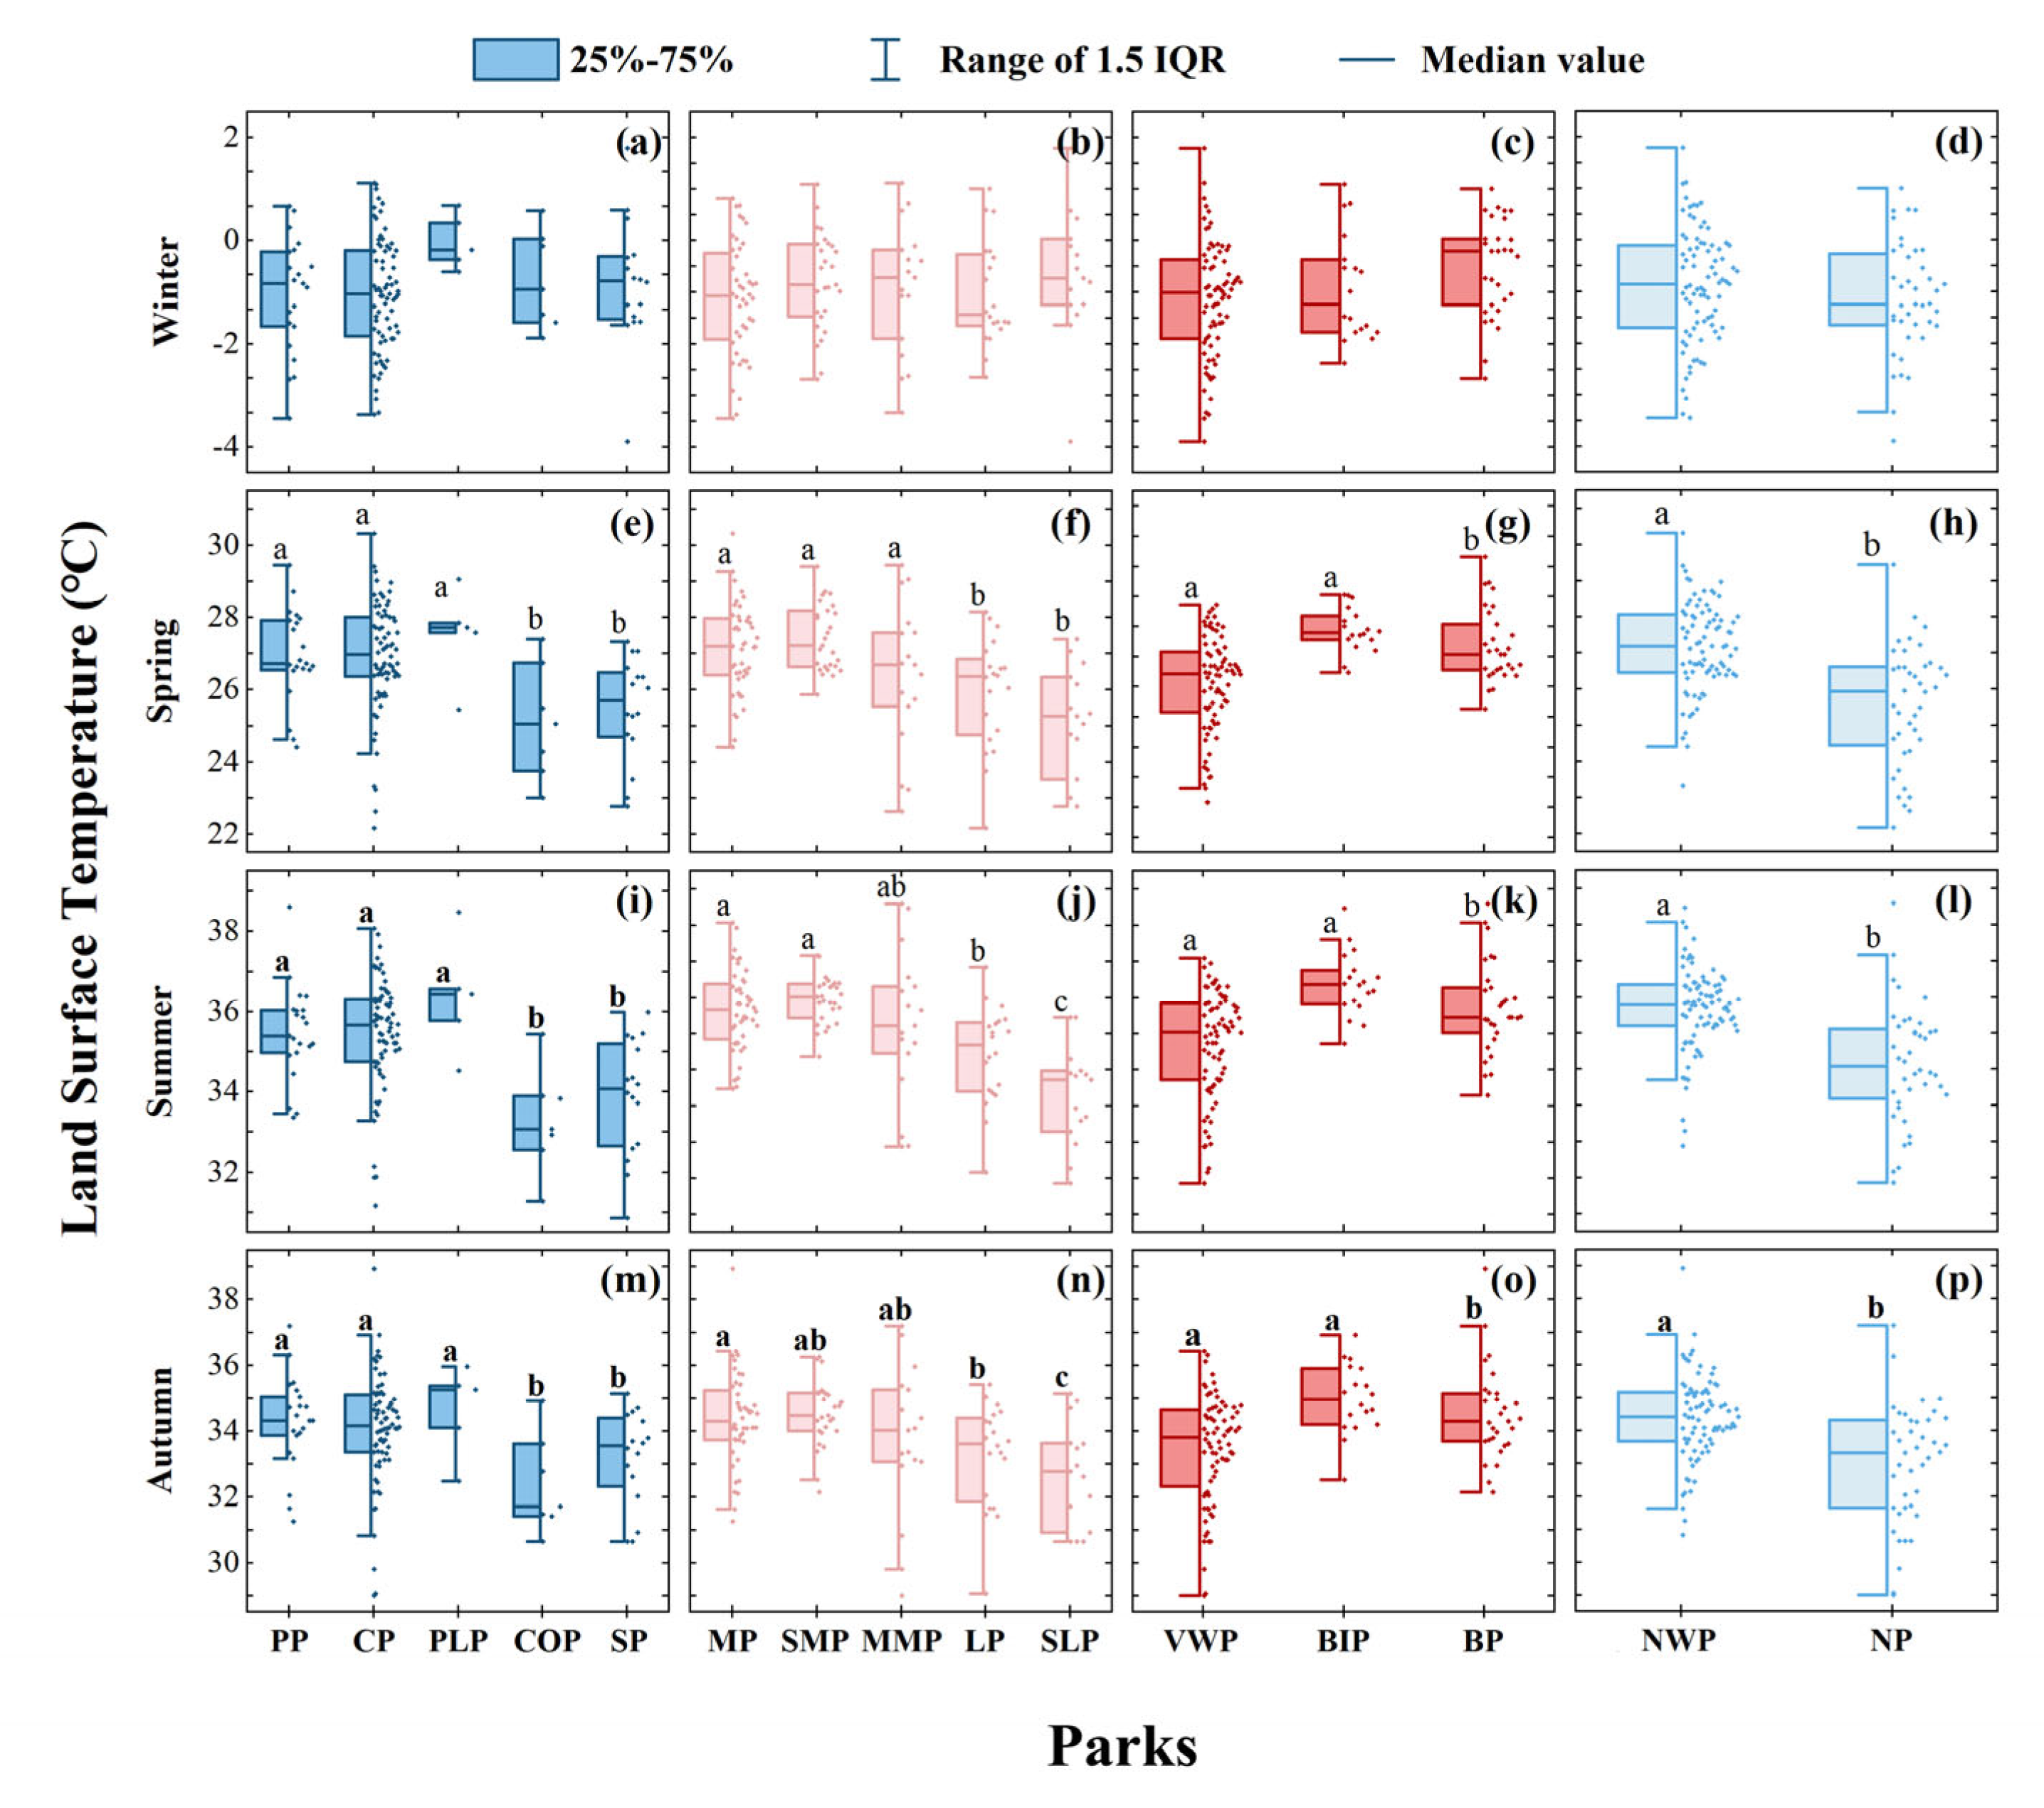
3.1. Spatial Heterogeneity of LST in Different Urban Parks and Different Seasons
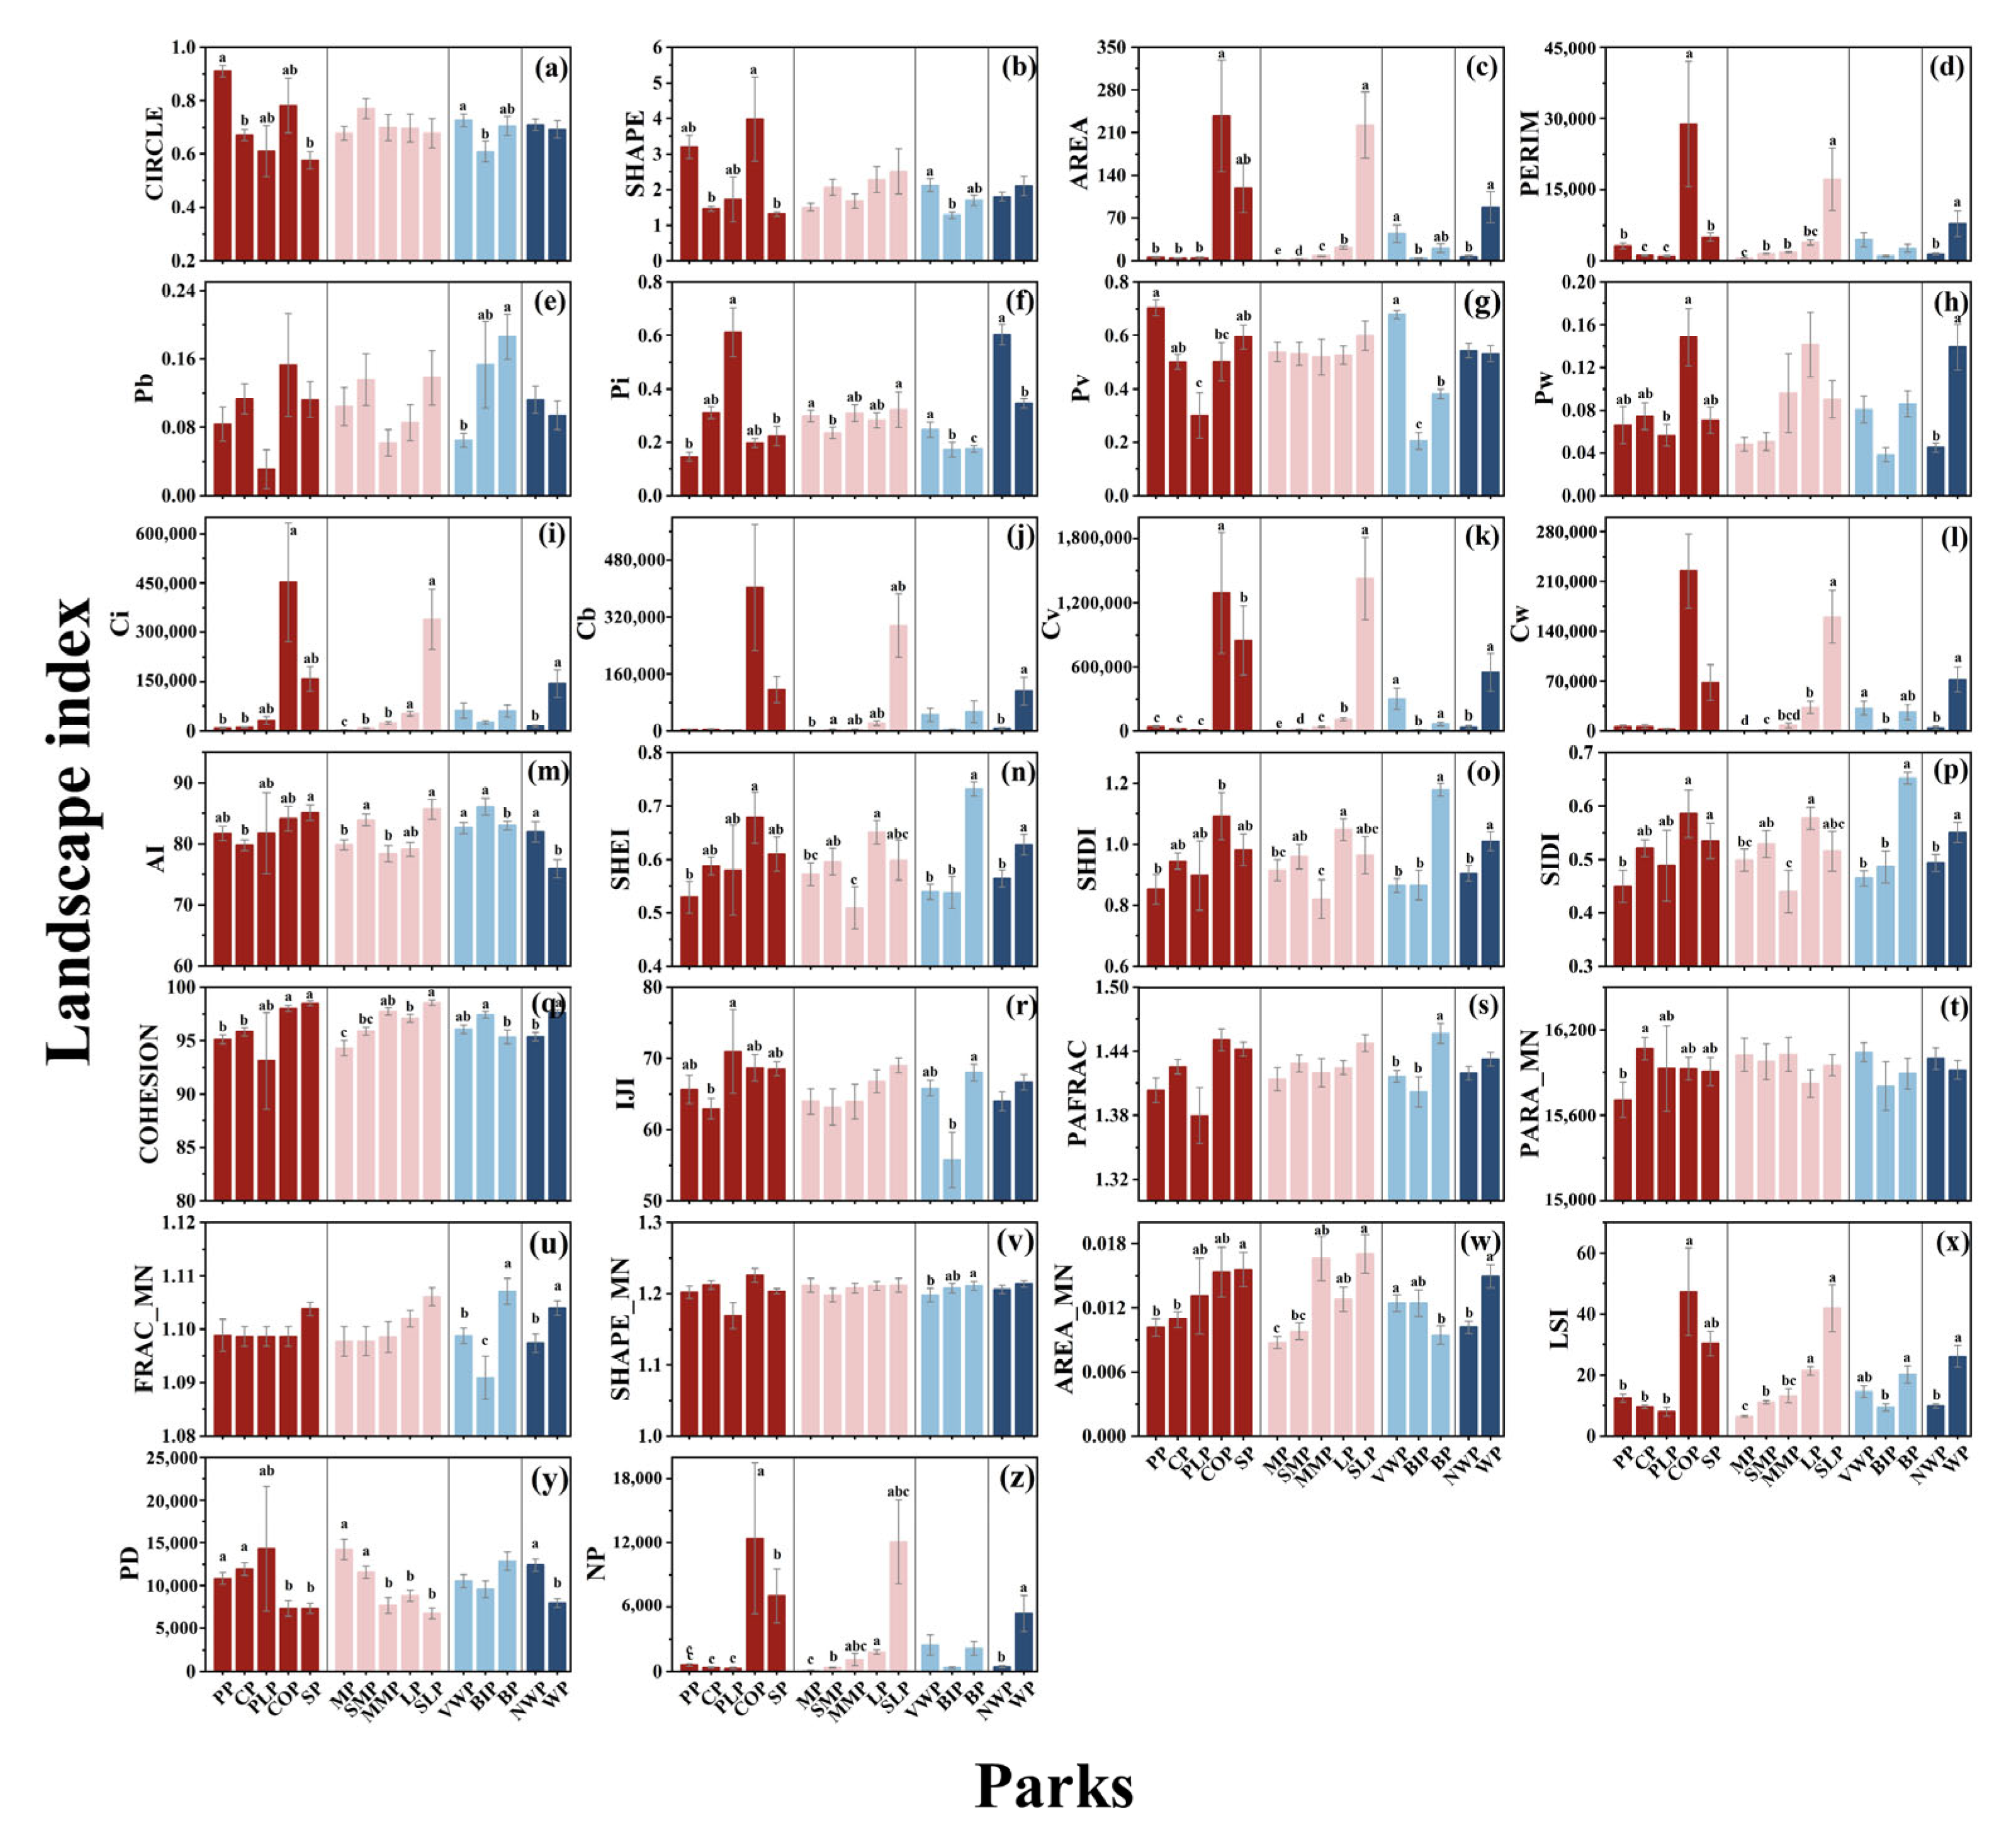
3.2. Spatial Changes in Landscape Metrics
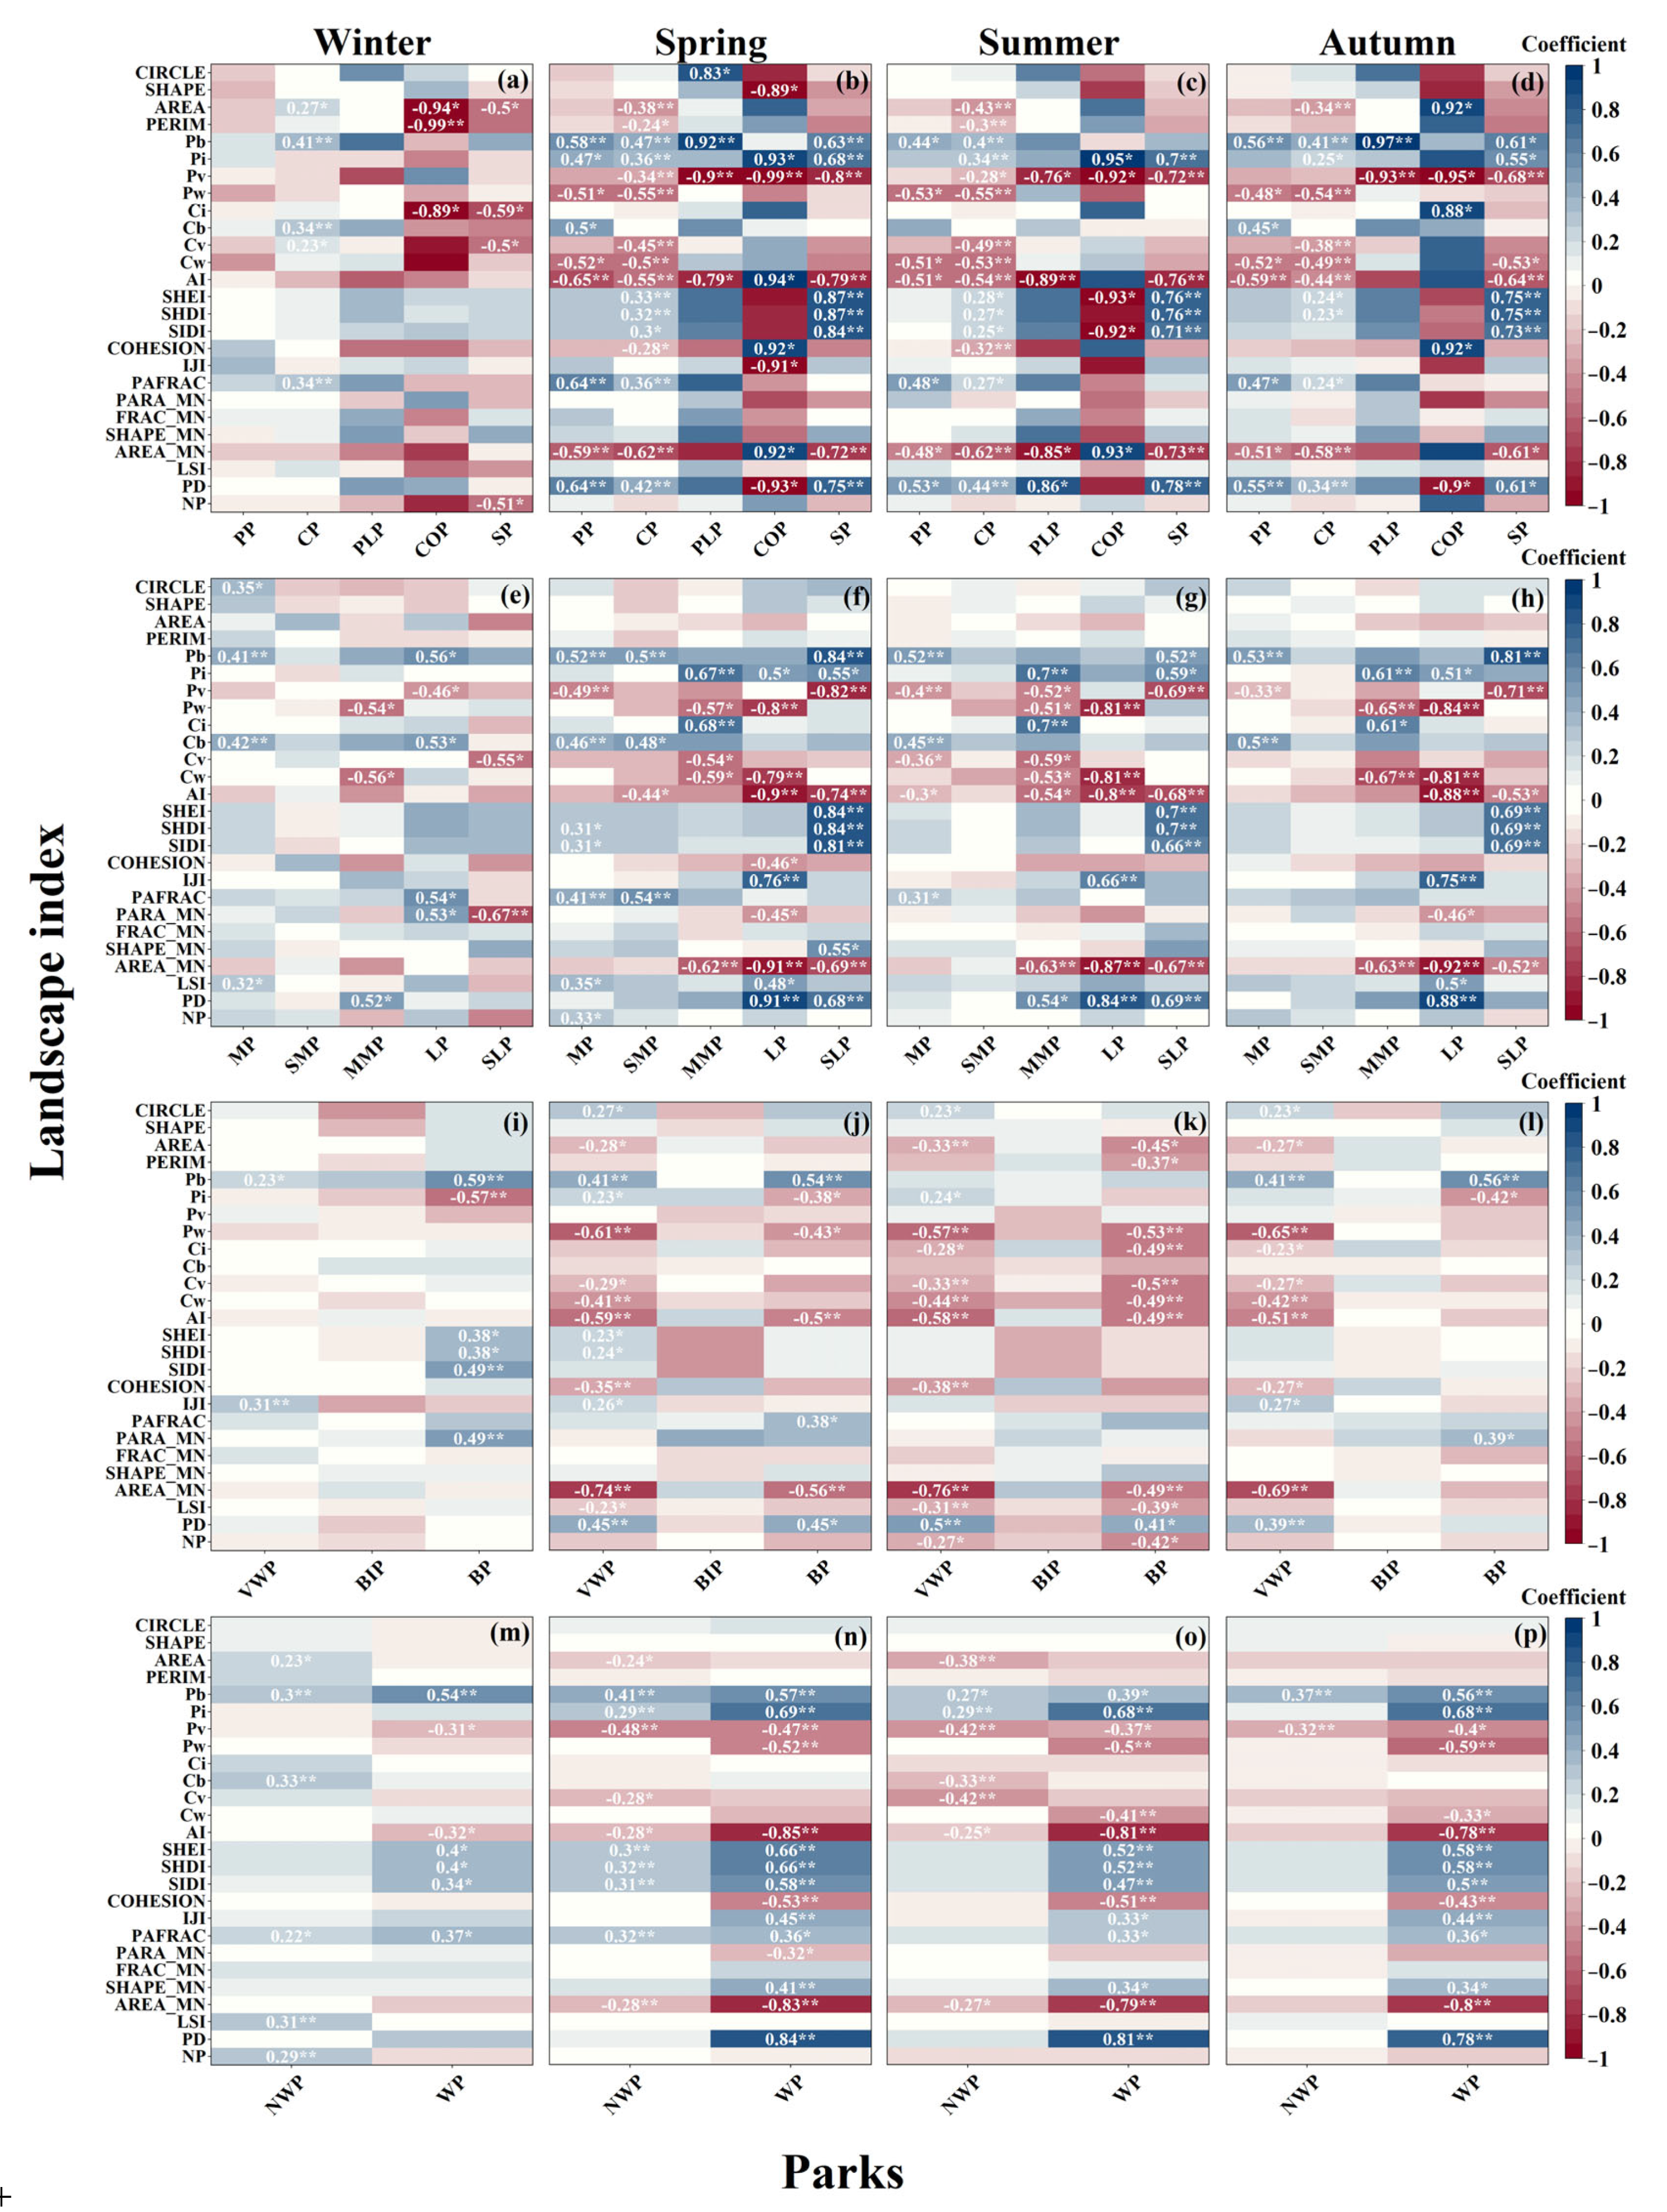
3.3. Correlations between LST and Landscape Pattern
3.4. Relative Importance of Landscape Driving Forces
4. Discussion
4.1. Seasonal Differences of LST in Park Green Space
4.2. Interactive Effects of Seasonal Differences and Landscape Patterns on LST
4.3. Implications for Urban Landscape Management
4.4. Limitations and Suggestions
5. Conclusions
Author Contributions
Funding
Informed Consent Statement
Data Availability Statement
Acknowledgments
Conflicts of Interest
Abbreviations
| BIP | Bare&Imper parks | PLP | Plaza parks |
| BP | Balance parks | PP | Pocket parks |
| COP | Comprehensive parks | R2 | Regression statistics |
| CP | Community parks | SLP | Super large parks |
| LP | Large parks | SMP | Small parks |
| LST | Land surface temperature | SP | Specific parks |
| LULC | Land use/land cover | UHI | Urban heat island |
| MMP | Medium parks | UP | Urban parks |
| MP | Mini parks | VWP | Vegetation&Water parks |
| NWP | Parks without water | WP | Parks with water |
Appendix A
| Factor Type | Metric Name | Acronym | Description |
| Park shape index | Index of nearly circular shape | CIRCLE | The smaller the value is, the closer the patch is to the circle; the more significant the matter is, the closer the patch is to the strip. |
| Park Shape index | SHAPE | equals 1 when all patches are circular; increases with the complexity of patch shapes; independent of patch size | |
| Park Area | AREA | Area of parks | |
| Park Perimeter | PERIM | Circumference of the park | |
| Landscape Composition | Percentage of bare land in the park area | Pb | Percentage of the bare land in the park |
| Percentage of impervious surface area in the park area | Pi | Percentage of impervious surface area in the park | |
| Percentage of vegetation in the park area | Pv | Percentage of all kinds of vegetation area in the park | |
| Percentage of water bodies in the park area | Pw | Percentage of the water body area in the park | |
| Area of impervious surface in the park | Ci | Size of impervious surface area in parks | |
| Area of bare land in the park | Cb | Area of bare land in parks | |
| Area of vegetation in the park | Cv | The total area of all vegetation in parks | |
| Area of water body in the park | Cw | Area of water bodies in parks | |
| Landscape Configuration | Aggregation index | AI | Account for the maximum possible number of like adjacencies given any landscape composition |
| Shannon’s evenness index | SHEI | Diversity measure, which considers the only evenness of patch sizes, not the number of patches | |
| Simpson’s patch diversity | SHDI | Diversity measure, which equals minus the sum of the proportional abundance of each patch type multiplied by the ln of that proportion | |
| Shannon’s Diversity Index | SIDI | Diversity measure, which equals 1 minus the sum of the squared proportional abundance of each patch type | |
| Patch Cohesion Index | COHESION | The measure of the physical connectedness of the focal land cover class | |
| Interspersion & Juxtaposition Index | IJI | The measure of evenness of patch adjacencies equals 100 for even and approaches 0 for uneven adjacencies. | |
| Perimeter–area fractal dimension | PAFRAC | Patch shape complexity measure, which approaches 1 for shapes with simple perimeters and 2 for complex shapes | |
| Mean Perimeter-Area Ratio | PARA_MN | Patch shape complexity measures the mean value of the patch perimeter area ratio. | |
| Mean Fractal Dimension Index | FRAC_MN | Average patch shape complexity measures approach 1 for simple shapes and 2 for complex shapes; it reflects shape complexity across various spatial scales (patch sizes). | |
| Mean shape index | SHAPE_MN | A patch-level shape index averaged over all patches in the landscape. | |
| Mean fractal dimension | AREA_MN | Size of the patches | |
| Landscape shape index | LSI | Landscape shape index, landscape shape index of the landscape in the spatial unit | |
| Patch density | PD | The number of patches per park, the larger the patch density value is, the smaller the patch size is, and the higher the fragmentation degree is. | |
| Number of patches | NP | Total number of patches of landscape type |
References
- Yu, B. Ecological effects of new-type urbanization in China. Renew. Sustain. Energy Rev. 2021, 135, 110239. [Google Scholar] [CrossRef]
- Gu, C.; Hu, L.; Cook, I.G. China’s urbanization in 1949–2015: Processes and driving forces. Chin. Geogr. Sci. 2017, 27, 847–859. [Google Scholar] [CrossRef]
- Zhou, D.; Xiao, J.; Bonafoni, S.; Berger, C.; Deilami, K.; Zhou, Y.; Frolking, S.; Yao, R.; Qiao, Z.; Sobrino, J.A. Satellite Remote Sensing of Surface Urban Heat Islands: Progress, Challenges, and Perspectives. Remote Sens. 2018, 11, 48. [Google Scholar] [CrossRef]
- Oke, T.R. The energetic basis of the urban heat island. Q. J. R. Meteorol. Soc. 1982, 108, 1–24. [Google Scholar] [CrossRef]
- Rizwan, A.M.; Dennis, L.Y.; Chunho, L. A review on the generation, determination and mitigation of Urban Heat Island. J. Environ. Sci. 2008, 20, 120–128. [Google Scholar] [CrossRef]
- Voogt, J.A.; Oke, T.R. Thermal remote sensing of urban climates. Remote Sens. Environ. 2003, 86, 370–384. [Google Scholar] [CrossRef]
- Cui, F.; Hamdi, R.; Yuan, X.; He, H.; Yang, T.; Kuang, W.; Termonia, P.; De Maeyer, P. Quantifying the response of surface urban heat island to urban greening in global north megacities. Sci. Total. Environ. 2021, 801, 149553. [Google Scholar] [CrossRef]
- Zhou, B.; Rybski, D.; Kropp, J.P. The role of city size and urban form in the surface urban heat island. Sci. Rep. 2017, 7, 4791. [Google Scholar] [CrossRef]
- Manley, G. On the frequency of snowfall in metropolitan England. Q. J. R. Meteorol. Soc. 1958, 84, 70–72. [Google Scholar] [CrossRef]
- Patz, J.A.; Campbell-Lendrum, D.; Holloway, T.; Foley, J.A. Impact of regional climate change on human health. Nature 2005, 438, 310–317. [Google Scholar] [CrossRef]
- Luber, G.; McGeehin, M. Climate Change and Extreme Heat Events. Am. J. Prev. Med. 2008, 35, 429–435. [Google Scholar] [CrossRef]
- Liu, Q.; Xie, M.; Wu, R.; Xue, Q.; Chen, B.; Li, Z.; Li, X. From expanding areas to stable areas: Identification, classification and determinants of multiple frequency urban heat islands. Ecol. Indic. 2021, 130, 108046. [Google Scholar] [CrossRef]
- Katayama, T.; Ishii, A.; Hayashi, T.; Tsutsumi, J.-I. Field surveys on cooling effects of vegetation in an urban area. J. Therm. Biol. 1993, 18, 571–576. [Google Scholar] [CrossRef]
- Hamada, S.; Ohta, T. Seasonal variations in the cooling effect of urban green areas on surrounding urban areas. Urban For. Urban Green. 2010, 9, 15–24. [Google Scholar] [CrossRef]
- Chen, A.; Yao, X.A.; Sun, R.; Chen, L. Effect of urban green patterns on surface urban cool islands and its seasonal variations. Urban For. Urban Green. 2014, 13, 646–654. [Google Scholar] [CrossRef]
- Yao, X.; Yu, K.; Zeng, X.; Lin, Y.; Ye, B.; Shen, X.; Liu, J. How can urban parks be planned to mitigate urban heat island effect in “Furnace cities” ? An accumulation perspective. J. Clean. Prod. 2022, 330, 129852. [Google Scholar] [CrossRef]
- Yang, G.; Yu, Z.; Jørgensen, G.; Vejre, H. How can urban blue-green space be planned for climate adaption in high-latitude cities? A seasonal perspective. Sustain. Cities Soc. 2020, 53, 101932. [Google Scholar] [CrossRef]
- Zhou, W.; Wang, J.; Cadenasso, M.L. Effects of the spatial configuration of trees on urban heat mitigation: A comparative study. Remote. Sens. Environ. 2017, 195, 1–12. [Google Scholar] [CrossRef]
- Voogt, J.A.; Oke, T.R. Effects of urban surface geometry on remotely-sensed surface temperature. Int. J. Remote Sens. 1998, 19, 895–920. [Google Scholar] [CrossRef]
- Ayanlade, A. Seasonality in the daytime and night-time intensity of land surface temperature in a tropical city area. Sci. Total. Environ. 2016, 557–558, 415–424. [Google Scholar] [CrossRef]
- Logan, T.M.; Zaitchik, B.; Guikema, S.; Nisbet, A. Night and day: The influence and relative importance of urban characteristics on remotely sensed land surface temperature. Remote Sens. Environ. 2020, 247, 111861. [Google Scholar] [CrossRef]
- Lazzarini, M.; Marpu, P.R.; Ghedira, H. Temperature-land cover interactions: The inversion of urban heat island phenomenon in desert city areas. Remote Sens. Environ. 2013, 130, 136–152. [Google Scholar] [CrossRef]
- Xu, C.; Chen, G.; Huang, Q.; Su, M.; Rong, Q.; Yue, W.; Haase, D. Can improving the spatial equity of urban green space mitigate the effect of urban heat islands? An empirical study. Sci. Total. Environ. 2022, 841, 156687. [Google Scholar] [CrossRef] [PubMed]
- Kuang, W.; Zhang, S.; Li, X.; Lu, D. A 30 m resolution dataset of China’s urban impervious surface area and green space, 2000–2018. Earth Syst. Sci. Data 2021, 13, 63–82. [Google Scholar] [CrossRef]
- Haase, D.; Jänicke, C.; Wellmann, T. Front and back yard green analysis with subpixel vegetation fractions from earth observation data in a city. Landsc. Urban Plan. 2019, 182, 44–54. [Google Scholar] [CrossRef]
- Park, J.; Kim, J.-H.; Lee, D.K.; Park, C.Y.; Jeong, S.G. The influence of small green space type and structure at the street level on urban heat island mitigation. Urban For. Urban Green. 2017, 21, 203–212. [Google Scholar] [CrossRef]
- Wu, C.; Li, J.; Wang, C.; Song, C.; Haase, D.; Breuste, J.; Finka, M. Estimating the Cooling Effect of Pocket Green Space in High Density Urban Areas in Shanghai, China. Front. Environ. Sci. 2021, 9, 657969. [Google Scholar] [CrossRef]
- Sun, R.; Chen, L. Effects of green space dynamics on urban heat islands: Mitigation and diversification. Ecosyst. Serv. 2017, 23, 38–46. [Google Scholar] [CrossRef]
- Kong, F.; Yin, H.; Wang, C.; Cavan, G.; James, P. A satellite image-based analysis of factors contributing to the green-space cool island intensity on a city scale. Urban For. Urban Green. 2014, 13, 846–853. [Google Scholar] [CrossRef]
- Li, X.; Li, W.; Middel, A.; Harlan, S.; Brazel, A.; Turner, B. Remote sensing of the surface urban heat island and land architecture in Phoenix, Arizona: Combined effects of land composition and configuration and cadastral–demographic–economic factors. Remote Sens. Environ. 2016, 174, 233–243. [Google Scholar] [CrossRef] [Green Version]
- Cao, X.; Onishi, A.; Chen, J.; Imura, H. Quantifying the cool island intensity of urban parks using ASTER and IKONOS data. Landsc. Urban Plan. 2010, 96, 224–231. [Google Scholar] [CrossRef]
- Chen, L.; Wang, X.; Cai, X.; Yang, C.; Lu, X. Seasonal Variations of Daytime Land Surface Temperature and Their Underlying Drivers over Wuhan, China. Remote Sens. 2021, 13, 323. [Google Scholar] [CrossRef]
- Spronken-Smith, R.; Oke, T.R. The thermal regime of urban parks in two cities with different summer climates. Int. J. Remote Sens. 1998, 19, 2085–2104. [Google Scholar] [CrossRef]
- Jusuf, S.K.; Wong, N.H.; Hagen, E.; Anggoro, R.; Hong, Y. The influence of land use on the urban heat island in Singapore. Habitat Int. 2007, 31, 232–242. [Google Scholar] [CrossRef]
- Das, M.; Das, A.; Momin, S. Quantifying the cooling effect of urban green space: A case from urban parks in a tropical mega metropolitan area (India). Sustain. Cities Soc. 2022, 87, 104062. [Google Scholar] [CrossRef]
- Xiao, X.D.; Dong, L.; Yan, H.; Yang, N.; Xiong, Y. The influence of the spatial characteristics of urban green space on the urban heat island effect in Suzhou Industrial Park. Sustain. Cities Soc. 2018, 40, 428–439. [Google Scholar] [CrossRef]
- Gao, Z.; Zaitchik, B.F.; Hou, Y.; Chen, W. Toward park design optimization to mitigate the urban heat Island: Assessment of the cooling effect in five U.S. cities. Sustain. Cities Soc. 2022, 81, 103870. [Google Scholar] [CrossRef]
- Yang, C.; He, X.; Wang, R.; Yan, F.; Yu, L.; Bu, K.; Yang, J.; Chang, L.; Zhang, S. The Effect of Urban Green Spaces on the Urban Thermal Environment and Its Seasonal Variations. Forests 2017, 8, 153. [Google Scholar] [CrossRef]
- Zhao, R.; Shen, X.; Tian, G.; Guo, Y. The influence of landscape characteristics of a park green space on the park cool island effect in Zhengzhou City. Acta Ecol. Sin. 2020, 40, 2886–2894. [Google Scholar] [CrossRef]
- Maimaitiyiming, M.; Ghulam, A.; Tiyip, T.; Pla, F.; Latorre-Carmona, P.; Halik, Ü.; Sawut, M.; Caetano, M. Effects of green space spatial pattern on land surface temperature: Implications for sustainable urban planning and climate change adaptation. ISPRS J. Photogramm. Remote Sens. 2014, 89, 59–66. [Google Scholar] [CrossRef] [Green Version]
- Chen, J.; Jin, S.; Du, P. Roles of horizontal and vertical tree canopy structure in mitigating daytime and nighttime urban heat island effects. Int. J. Appl. Earth Obs. Geoinf. 2020, 89, 102060. [Google Scholar] [CrossRef]
- Wong, N.; Jusuf, S.K.; La Win, A.A.; Thu, H.K.; Negara, T.S.; Xuchao, W. Environmental study of the impact of greenery in an institutional campus in the tropics. Build. Environ. 2007, 42, 2949–2970. [Google Scholar] [CrossRef]
- Peng, S.; Piao, S.; Ciais, P.; Friedlingstein, P.; Ottle, C.; Bréon, F.-M.; Nan, H.; Zhou, L.; Myneni, R.B. Surface Urban Heat Island Across 419 Global Big Cities. Environ. Sci. Technol. 2012, 46, 696–703. [Google Scholar] [CrossRef] [PubMed]
- Chen, M.; Jia, W.; Yan, L.; Du, C.; Wang, K. Quantification and mapping cooling effect and its accessibility of urban parks in an extreme heat event in a megacity. J. Clean. Prod. 2022, 334, 130252. [Google Scholar] [CrossRef]
- Odindi, J.O.; Bangamwabo, V.; Mutanga, O. Assessing the Value of Urban Green Spaces in Mitigating Multi-Seasonal Urban Heat Using MODIS Land Surface Temperature (LST) and Landsat 8 Data. Int. J. Environ. Res. 2015, 9, 9–18. [Google Scholar]
- Chen, M.; Jia, W.; Du, C.; Shi, M.; Henebry, G.M.; Wang, K. Carbon saving potential of urban parks due to heat mitigation in Yangtze River Economic Belt. J. Clean. Prod. 2023, 385, 135713. [Google Scholar] [CrossRef]
- Wang, Y.; Chang, Q.; Li, X. Promoting sustainable carbon sequestration of plants in urban greenspace by planting design: A case study in parks of Beijing. Urban For. Urban Green. 2021, 64, 127291. [Google Scholar] [CrossRef]
- Han, D.; Yang, X.; Cai, H.; Xu, X. Impacts of Neighboring Buildings on the Cold Island Effect of Central Parks: A Case Study of Beijing, China. Sustainability 2020, 12, 9499. [Google Scholar] [CrossRef]
- Li, X.; Zhou, W.; Ouyang, Z.; Xu, W.; Zheng, H. Spatial pattern of greenspace affects land surface temperature: Evidence from the heavily urbanized Beijing metropolitan area, China. Landsc. Ecol. 2012, 27, 887–898. [Google Scholar] [CrossRef]
- Liu, Y.; Peng, J.; Wang, Y. Diversification of Land Surface Temperature Change under Urban Landscape Renewal: A Case Study in the Main City of Shenzhen, China. Remote Sens. 2017, 9, 919. [Google Scholar] [CrossRef]
- Xue, D.; Wang, Z.; Li, Y.; Liu, M.; Wei, H. Assessment of Ecosystem Services Supply and Demand (Mis)matches for Urban Ecological Management: A Case Study in the Zhengzhou–Kaifeng–Luoyang Cities. Remote Sens. 2022, 14, 1703. [Google Scholar] [CrossRef]
- Jiménez-Muñoz, J.C.; Sobrino, J.A.; Skoković, D.; Mattar, C.; Cristóbal, J. Land Surface Temperature Retrieval Methods from Landsat-8 Thermal Infrared Sensor Data. IEEE Geosci. Remote Sens. Lett. 2014, 11, 1840–1843. [Google Scholar] [CrossRef]
- Jiang, Y.; Lin, W. A Comparative Analysis of Retrieval Algorithms of Land Surface Temperature from Landsat-8 Data: A Case Study of Shanghai, China. Int. J. Environ. Res. Public Health 2021, 18, 5659. [Google Scholar] [CrossRef]
- Sekertekin, A.; Bonafoni, S. Land Surface Temperature Retrieval from Landsat 5, 7, and 8 over Rural Areas: Assessment of Different Retrieval Algorithms and Emissivity Models and Toolbox Implementation. Remote Sens. 2020, 12, 294. [Google Scholar] [CrossRef]
- Sobrino, J.A.; Jiménez-Muñoz, J.C.; Paolini, L. Land surface temperature retrieval from LANDSAT TM 5. Remote Sens. Environ. 2004, 90, 434–440. [Google Scholar] [CrossRef]
- Carlson, T.N.; Ripley, D.A. On the relation between NDVI, fractional vegetation cover, and leaf area index. Remote Sens. Environ. 1997, 62, 241–252. [Google Scholar] [CrossRef]
- Rwanga, S.S.; Ndambuki, J.M. Accuracy Assessment of Land Use/Land Cover Classification Using Remote Sensing and GIS. Int. J. Geosci. 2017, 8, 611–622. [Google Scholar] [CrossRef]
- Peng, J.; Xie, P.; Liu, Y.; Ma, J. Urban thermal environment dynamics and associated landscape pattern factors: A case study in the Beijing metropolitan region. Remote Sens. Environ. 2016, 173, 145–155. [Google Scholar] [CrossRef]
- Gustafson, E.J. Minireview: Quantifying Landscape Spatial Pattern: What Is the State of the Art? Ecosystems 1998, 1, 143–156. [Google Scholar] [CrossRef]
- Zhang, X.; Wang, D.; Hao, H.; Zhang, F.; Hu, Y. Effects of Land Use/Cover Changes and Urban Forest Configuration on Urban Heat Islands in a Loess Hilly Region: Case Study Based on Yan’an City, China. Int. J. Environ. Res. Public Health 2017, 14, 840. [Google Scholar] [CrossRef]
- Li, J.; Song, C.; Cao, L.; Zhu, F.; Meng, X.; Wu, J. Impacts of landscape structure on surface urban heat islands: A case study of Shanghai, China. Remote Sens. Environ. 2011, 115, 3249–3263. [Google Scholar] [CrossRef]
- Jiang, Y.; Fu, P.; Weng, Q. Assessing the Impacts of Urbanization-Associated Land Use/Cover Change on Land Surface Temperature and Surface Moisture: A Case Study in the Midwestern United States. Remote Sens. 2015, 7, 4880–4898. [Google Scholar] [CrossRef]
- Yao, L.; Li, T.; Xu, M.; Xu, Y. How the landscape features of urban green space impact seasonal land surface temperatures at a city-block-scale: An urban heat island study in Beijing, China. Urban For. Urban Green. 2020, 52, 126704. [Google Scholar] [CrossRef]
- Ca, V.T.; Asaeda, T.; Abu, E.M. Reductions in air conditioning energy caused by a nearby park. Energy Build. 1998, 29, 83–92. [Google Scholar] [CrossRef]
- Huang, G.; Cadenasso, M.L. People, landscape, and urban heat island: Dynamics among neighborhood social conditions, land cover and surface temperatures. Landsc. Ecol. 2016, 31, 2507–2515. [Google Scholar] [CrossRef]
- Jenerette, G.D.; Harlan, S.L.; Brazel, A.; Jones, N.; Larsen, L.; Stefanov, W.L. Regional relationships between surface temperature, vegetation, and human settlement in a rapidly urbanizing ecosystem. Landsc. Ecol. 2007, 22, 353–365. [Google Scholar] [CrossRef]
- Huang, M.; Cui, P.; He, X. Study of the Cooling Effects of Urban Green Space in Harbin in Terms of Reducing the Heat Island Effect. Sustainability 2018, 10, 1101. [Google Scholar] [CrossRef]
- Wu, W.; Li, L.; Li, C. Seasonal variation in the effects of urban environmental factors on land surface temperature in a winter city. J. Clean. Prod. 2021, 299, 126897. [Google Scholar] [CrossRef]
- Ren, Z.; He, X.; Pu, R.; Zheng, H. The impact of urban forest structure and its spatial location on urban cool island intensity. Urban Ecosyst. 2018, 21, 863–874. [Google Scholar] [CrossRef]
- Yang, Q.; Huang, X.; Li, J. Assessing the relationship between surface urban heat islands and landscape patterns across climatic zones in China. Sci. Rep. 2017, 7, 9337. [Google Scholar] [CrossRef]
- Lin, B.-S.; Lin, Y.-J. Cooling Effect of Shade Trees with Different Characteristics in a Subtropical Urban Park. Hortscience 2010, 45, 83–86. [Google Scholar] [CrossRef] [Green Version]
- Oliveira, S.; Andrade, H.; Vaz, T. The cooling effect of green spaces as a contribution to the mitigation of urban heat: A case study in Lisbon. Build. Environ. 2011, 46, 2186–2194. [Google Scholar] [CrossRef]
- Zhang, W.; Jiang, J.; Zhu, Y. Change in urban wetlands and their cold island effects in response to rapid urbanization. Chin. Geogr. Sci. 2015, 25, 462–471. [Google Scholar] [CrossRef]
- Cao, S.; Sanchez-Azofeifa, A. Modeling seasonal surface temperature variations in secondary tropical dry forests. Int. J. Appl. Earth Obs. Geoinfor. 2017, 62, 122–134. [Google Scholar] [CrossRef]
- Khan, N.; Shahid, S.; Chung, E.-S.; Kim, S.; Ali, R. Influence of Surface Water Bodies on the Land Surface Temperature of Bangladesh. Sustainability 2019, 11, 6754. [Google Scholar] [CrossRef]
- Carroll, M.L.; Loboda, T.V. Multi-Decadal Surface Water Dynamics in North American Tundra. Remote Sens. 2017, 9, 497. [Google Scholar] [CrossRef]
- Wu, C.; Li, J.; Wang, C.; Song, C.; Chen, Y.; Finka, M.; La Rosa, D. Understanding the relationship between urban blue infrastructure and land surface temperature. Sci. Total. Environ. 2019, 694, 133742. [Google Scholar] [CrossRef]
- Asgarian, A.; Amiri, B.J.; Sakieh, Y. Assessing the effect of green cover spatial patterns on urban land surface temperature using landscape metrics approach. Urban Ecosyst. 2015, 18, 209–222. [Google Scholar] [CrossRef]
- Xue, Y.; Lu, H.; Guan, Y.; Tian, P.; Yao, T. Impact of thermal condition on vegetation feedback under greening trend of China. Sci. Total. Environ. 2021, 785, 147380. [Google Scholar] [CrossRef]
- Klok, L.; Zwart, S.; Verhagen, H.; Mauri, E. The surface heat island of Rotterdam and its relationship with urban surface characteristics. Resour. Conserv. Recycl. 2012, 64, 23–29. [Google Scholar] [CrossRef]
- Zhou, W.; Huang, G.; Cadenasso, M.L. Does spatial configuration matter? Understanding the effects of land cover pattern on land surface temperature in urban landscapes. Landsc. Urban Plan. 2011, 102, 54–63. [Google Scholar] [CrossRef]
- Shi, Y.; Liu, S.; Yan, W.; Zhao, S.; Ning, Y.; Peng, X.; Chen, W.; Chen, L.; Hu, X.; Fu, B.; et al. Influence of landscape features on urban land surface temperature: Scale and neighborhood effects. Sci. Total. Environ. 2021, 771, 145381. [Google Scholar] [CrossRef] [PubMed]
- Shiflett, S.A.; Liang, L.L.; Crum, S.M.; Feyisa, G.L.; Wang, J.; Jenerette, G.D. Variation in the urban vegetation, surface temperature, air temperature nexus. Sci. Total. Environ. 2017, 579, 495–505. [Google Scholar] [CrossRef] [PubMed]
- Yang, C.; Yan, F.; Lei, X.; Ding, X.; Zheng, Y.; Liu, L.; Zhang, S. Investigating Seasonal Effects of Dominant Driving Factors on Urban Land Surface Temperature in a Snow-Climate City in China. Remote Sens. 2020, 12, 3006. [Google Scholar] [CrossRef]
- Yuan, F.; Bauer, M.E. Comparison of impervious surface area and normalized difference vegetation index as indicators of surface urban heat island effects in Landsat imagery. Remote Sens. Environ. 2006, 106, 375–386. [Google Scholar] [CrossRef]
- Wang, X.; Cheng, H.; Xi, J.; Yang, G.; Zhao, Y. Relationship between Park Composition, Vegetation Characteristics and Cool Island Effect. Sustainability 2018, 10, 587. [Google Scholar] [CrossRef]
- Jafari, R.; Hasheminasab, S. Assessing the effects of dam building on land degradation in central Iran with Landsat LST and LULC time series. Environ. Monit. Assess. 2017, 189, 74. [Google Scholar] [CrossRef]
- Abulibdeh, A. Analysis of urban heat island characteristics and mitigation strategies for eight arid and semi-arid gulf region cities. Environ. Earth Sci. 2021, 80, 259. [Google Scholar] [CrossRef]
- Rakoto, P.Y.; Deilami, K.; Hurley, J.; Amati, M.; Sun, Q. Revisiting the cooling effects of urban greening: Planning implications of vegetation types and spatial configuration. Urban For. Urban Green. 2021, 64, 127266. [Google Scholar] [CrossRef]
- Liu, C.-F.; Li, J.-Z.; Li, X.-M.; He, X.-Y.; Chen, W. Selection of landscape metrics for urban forest based on simulated landscapes. Ying Yong Sheng Tai Xue Bao 2009, 20, 1125–1131. [Google Scholar]
- Xie, M.; Wang, Y.; Chang, Q.; Fu, M.; Ye, M. Assessment of landscape patterns affecting land surface temperature in different biophysical gradients in Shenzhen, China. Urban Ecosyst. 2013, 16, 871–886. [Google Scholar] [CrossRef]
- Masoudi, M.; Tan, P.Y. Multi-year comparison of the effects of spatial pattern of urban green spaces on urban land surface temperature. Landsc. Urban Plan. 2019, 184, 44–58. [Google Scholar] [CrossRef]
- Yin, J.; Wu, X.; Shen, M.; Zhang, X.; Zhu, C.; Xiang, H.; Shi, C.; Guo, Z.; Li, C. Impact of urban greenspace spatial pattern on land surface temperature: A case study in Beijing metropolitan area, China. Landsc. Ecol. 2019, 34, 2949–2961. [Google Scholar] [CrossRef]
- Estoque, R.C.; Murayama, Y.; Myint, S.W. Effects of landscape composition and pattern on land surface temperature: An urban heat island study in the megacities of Southeast Asia. Sci. Total. Environ. 2017, 577, 349–359. [Google Scholar] [CrossRef]
- Peng, J.; Jia, J.; Liu, Y.; Li, H.; Wu, J. Seasonal contrast of the dominant factors for spatial distribution of land surface temperature in urban areas. Remote Sens. Environ. 2018, 215, 255–267. [Google Scholar] [CrossRef]
- Zhao, H.; Ren, Z.; Tan, J. The Spatial Patterns of Land Surface Temperature and Its Impact Factors: Spatial Non-Stationarity and Scale Effects Based on a Geographically-Weighted Regression Model. Sustainability 2018, 10, 2242. [Google Scholar] [CrossRef]
- Kuang, W.; Liu, Y.; Dou, Y.; Chi, W.; Chen, G.; Gao, C.; Yang, T.; Liu, J.; Zhang, R. What are hot and what are not in an urban landscape: Quantifying and explaining the land surface temperature pattern in Beijing, China. Landsc. Ecol. 2015, 30, 357–373. [Google Scholar] [CrossRef]
- Sun, R.; Chen, L. How can urban water bodies be designed for climate adaptation? Landsc. Urban Plan. 2012, 105, 27–33. [Google Scholar] [CrossRef]
- Adulkongkaew, T.; Satapanajaru, T.; Charoenhirunyingyos, S.; Singhirunnusorn, W. Effect of land cover composition and building configuration on land surface temperature in an urban-sprawl city, case study in Bangkok Metropolitan Area, Thailand. Heliyon 2020, 6, e04485. [Google Scholar] [CrossRef]
- An, H.; Cai, H.; Xu, X.; Qiao, Z.; Han, D. Impacts of Urban Green Space on Land Surface Temperature from Urban Block Perspectives. Remote Sens. 2022, 14, 4580. [Google Scholar] [CrossRef]


| Season | Park Green Space (°C) | The Temperature Difference between Green Space and Urban Area (°C) | ||||||||
|---|---|---|---|---|---|---|---|---|---|---|
| Maximum | Minimum | Median | Mean | Standard Deviation | Maximum | Minimum | Median | Mean | Standard Deviation | |
| Winter | 1.78 | −3.90 | −0.94 | −0.97 | 1.10 | 2.84 | 0.01 | 0.12 | 0.89 | 0.66 |
| Spring | 30.32 | 22.16 | 26.68 | 26.64 | 1.58 | 4.66 | 0.02 | 0.15 | 1.21 | 1.03 |
| Summer | 38.60 | 30.85 | 35.39 | 35.16 | 1.52 | 4.52 | 0.00 | 0.02 | 1.15 | 1.01 |
| Autumn | 38.93 | 28.99 | 34.09 | 33.92 | 1.64 | 5.13 | 0.01 | 0.04 | 1.22 | 1.12 |
| Winter LST (°C) | Spring LST (°C) | Summer LST (°C) | Autumn LST (°C) | |||||||||||||
|---|---|---|---|---|---|---|---|---|---|---|---|---|---|---|---|---|
| Landscape Types | Minimum | Maximum | Mean | Standard Deviation | Minimum | Maximum | Mean | Standard Deviation | Minimum | Maximum | Mean | Standard Deviation | Minimum | Maximum | Mean | Standard Deviation |
| Water | −4.97 | 2.91 | −0.39 | 28.98 | 19.31 | 31.19 | 25.71 | 2.25 | 28.98 | 39.95 | 33.74 | 1.97 | 26.57 | 39.46 | 33.05 | 2.34 |
| Vegetation | −4.31 | 3.01 | −0.24 | 29.69 | 20.75 | 32.16 | 26.50 | 1.51 | 29.69 | 40.07 | 34.80 | 1.60 | 28.21 | 39.71 | 34.02 | 1.59 |
| Imperative | −4.86 | 3.12 | 0.39 | 30.63 | 22.77 | 32.14 | 27.63 | 1.47 | 30.63 | 40.58 | 34.49 | 1.71 | 30.83 | 39.18 | 34.88 | 1.31 |
| Bare land | −5.04 | 3.04 | −0.21 | 30.21 | 21.47 | 31.68 | 27.07 | 1.39 | 30.21 | 40.58 | 35.15 | 1.61 | 28.28 | 39.62 | 34.50 | 1.50 |
| Park Type | Views on the Transformation of Park Landscape Pattern | Pattern Diagram |
|---|---|---|
| All parks | Increase the amount of vegetation in the park, its area and proportion, and its density, creating low-maintenance rain gardens or sunken green areas. Increase the area of the park’s water features and plant floating and water-holding plants to enhance the purification function of water bodies and the surrounding environment. Reduce the area and proportion of the park’s impervious surfaces and bare land; strengthen vegetation maintenance on bare land and sparsely vegetated areas; and replace impervious surfaces with permeable paving or ecological paving. Increase the diversity of landscape types and species. | 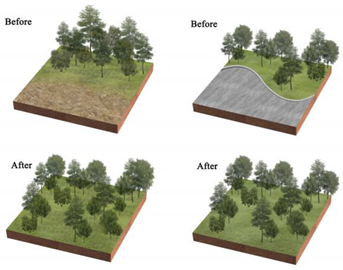 |
| BP | Within the limited planting space, plant community structure and species types are enriched, and trees and shrubs are added to the lawn space to increase the number of species. The arrangement of vegetation patches in the park’s interior will be clustered as much as possible, and the average area of landscape patches will be increased. In contrast, the connectivity of landscape patches will be reduced. To maximize the size and simplify the park’s shape within a fixed block layout. | 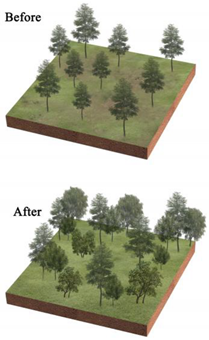 |
| PLP | Focus on spatial coordination and balance, improving the road structure, and using permeable concrete and permeable tiles, other permeable paving in the plaza and road parts to ensure that the site runoff is organized to collect and infiltrate downward. Incorporate small plots around the park into the park, increasing the park perimeter and area and enhancing the complexity of the park’s shape from the morphological features. Various native trees and shrubs are added to the large lawn and bare land areas around the square to enrich the type of plant community structure and landscape richness while increasing the aesthetic value of the vegetation area. | 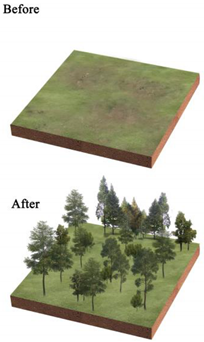 |
| CP | Focus on the collocation of vegetation communities, improve the richness of plant communities, and increase the variety and collocation of plants in the limited greening area. Integrating the scattered landscape patches allows vegetation planting areas and impervious surface areas to be concentrated to enhance the aggregation of park patches and increase the average size of landscape patches. Improve the park road network, install environmental protection trails, use grass tiles and porous concrete to replace traditional trail materials, and use trail outreach to enrich the park shape and increase the park perimeter. | 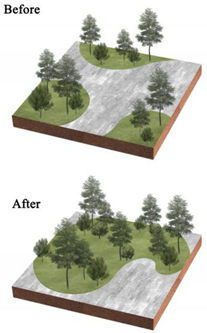 |
| NWP | Pay attention to improving impervious surfaces, such as upgrading pedestrian walkways to permeable materials or materials with greater ecological benefits, or by upgrading traditional parking lots to ecological parking lots by installing percolation ponds and grass swales. Gathering infrastructure management facilities, buildings, and large plazas to reduce the density of patches and increase the average area of patches. Increasing the size of the park. | 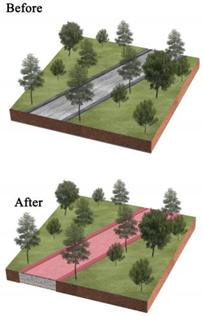 |
Disclaimer/Publisher’s Note: The statements, opinions and data contained in all publications are solely those of the individual author(s) and contributor(s) and not of MDPI and/or the editor(s). MDPI and/or the editor(s) disclaim responsibility for any injury to people or property resulting from any ideas, methods, instructions or products referred to in the content. |
© 2023 by the authors. Licensee MDPI, Basel, Switzerland. This article is an open access article distributed under the terms and conditions of the Creative Commons Attribution (CC BY) license (https://creativecommons.org/licenses/by/4.0/).
Share and Cite
Zhang, K.; Yun, G.; Song, P.; Wang, K.; Li, A.; Du, C.; Jia, X.; Feng, Y.; Wu, M.; Qu, K.; et al. Discover the Desirable Landscape Structure of Urban Parks for Mitigating Urban Heat: A High Spatial Resolution Study Using a Forest City, Luoyang, China as a Lens. Int. J. Environ. Res. Public Health 2023, 20, 3155. https://doi.org/10.3390/ijerph20043155
Zhang K, Yun G, Song P, Wang K, Li A, Du C, Jia X, Feng Y, Wu M, Qu K, et al. Discover the Desirable Landscape Structure of Urban Parks for Mitigating Urban Heat: A High Spatial Resolution Study Using a Forest City, Luoyang, China as a Lens. International Journal of Environmental Research and Public Health. 2023; 20(4):3155. https://doi.org/10.3390/ijerph20043155
Chicago/Turabian StyleZhang, Kaihua, Guoliang Yun, Peihao Song, Kun Wang, Ang Li, Chenyu Du, Xiaoli Jia, Yuan Feng, Meng Wu, Kexin Qu, and et al. 2023. "Discover the Desirable Landscape Structure of Urban Parks for Mitigating Urban Heat: A High Spatial Resolution Study Using a Forest City, Luoyang, China as a Lens" International Journal of Environmental Research and Public Health 20, no. 4: 3155. https://doi.org/10.3390/ijerph20043155