
Spatial and Temporal Analysis of COVID-19 Cases in West Java, Indonesia and Its Influencing Factors

Abstract
:1. Introduction
2. Materials and Methods
2.1. Materials
2.2. Methods
2.2.1. Data Cleaning and Transformation
2.2.2. Variables
2.2.3. Data Analysis
- (1)
- Temporal Analysis
- (2)
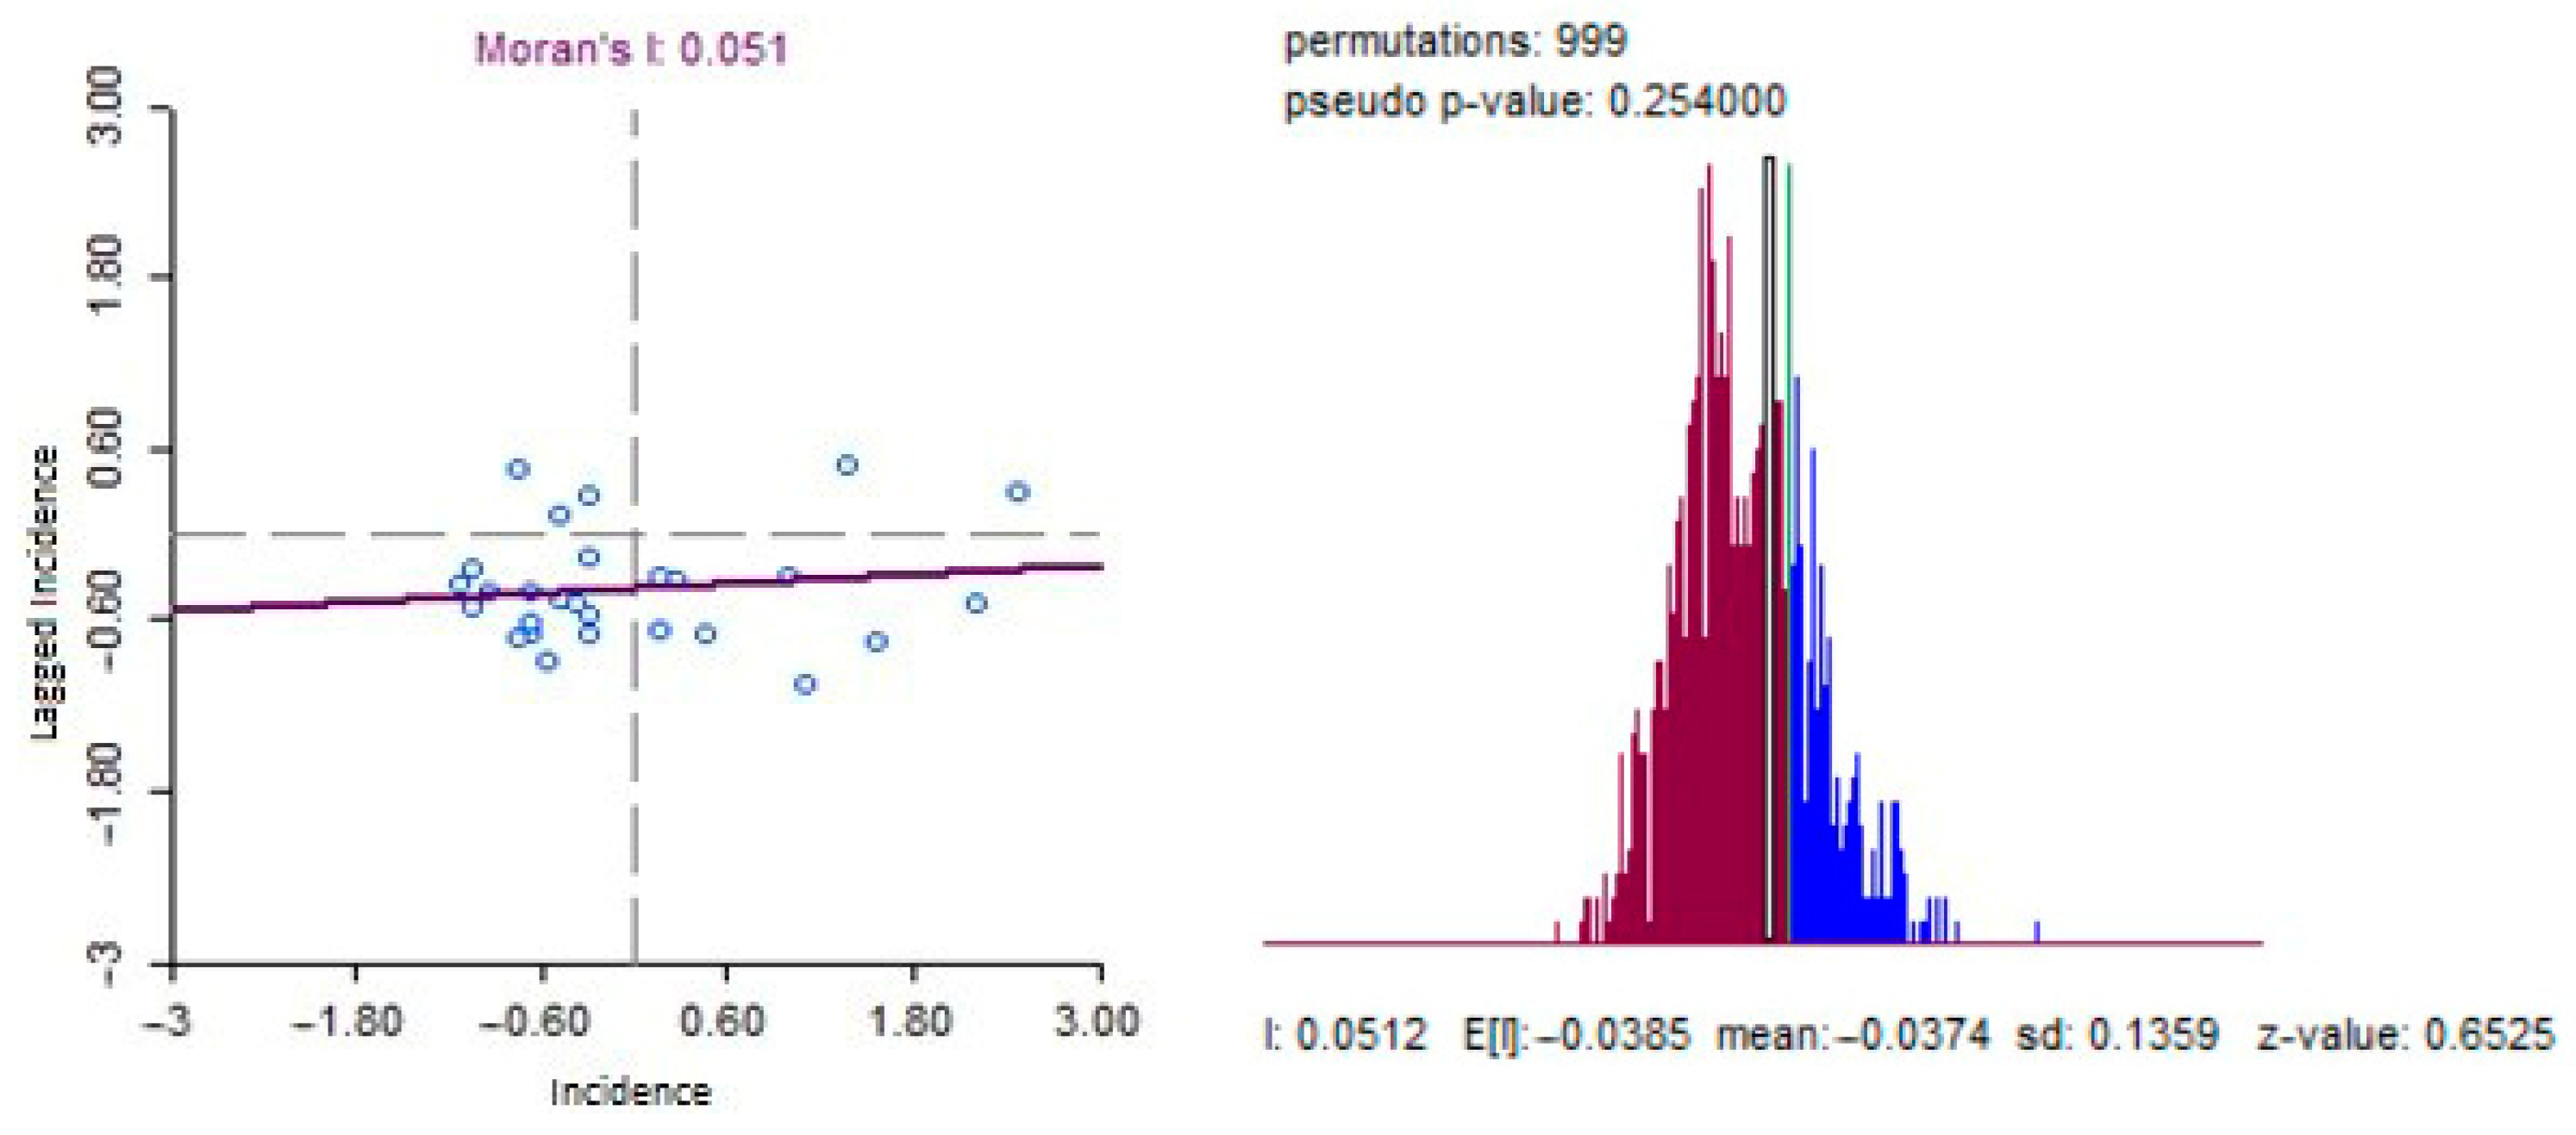
- Spatial Analysis
3. Results
3.1. Temporal Distribution of New COVID-19 Cases
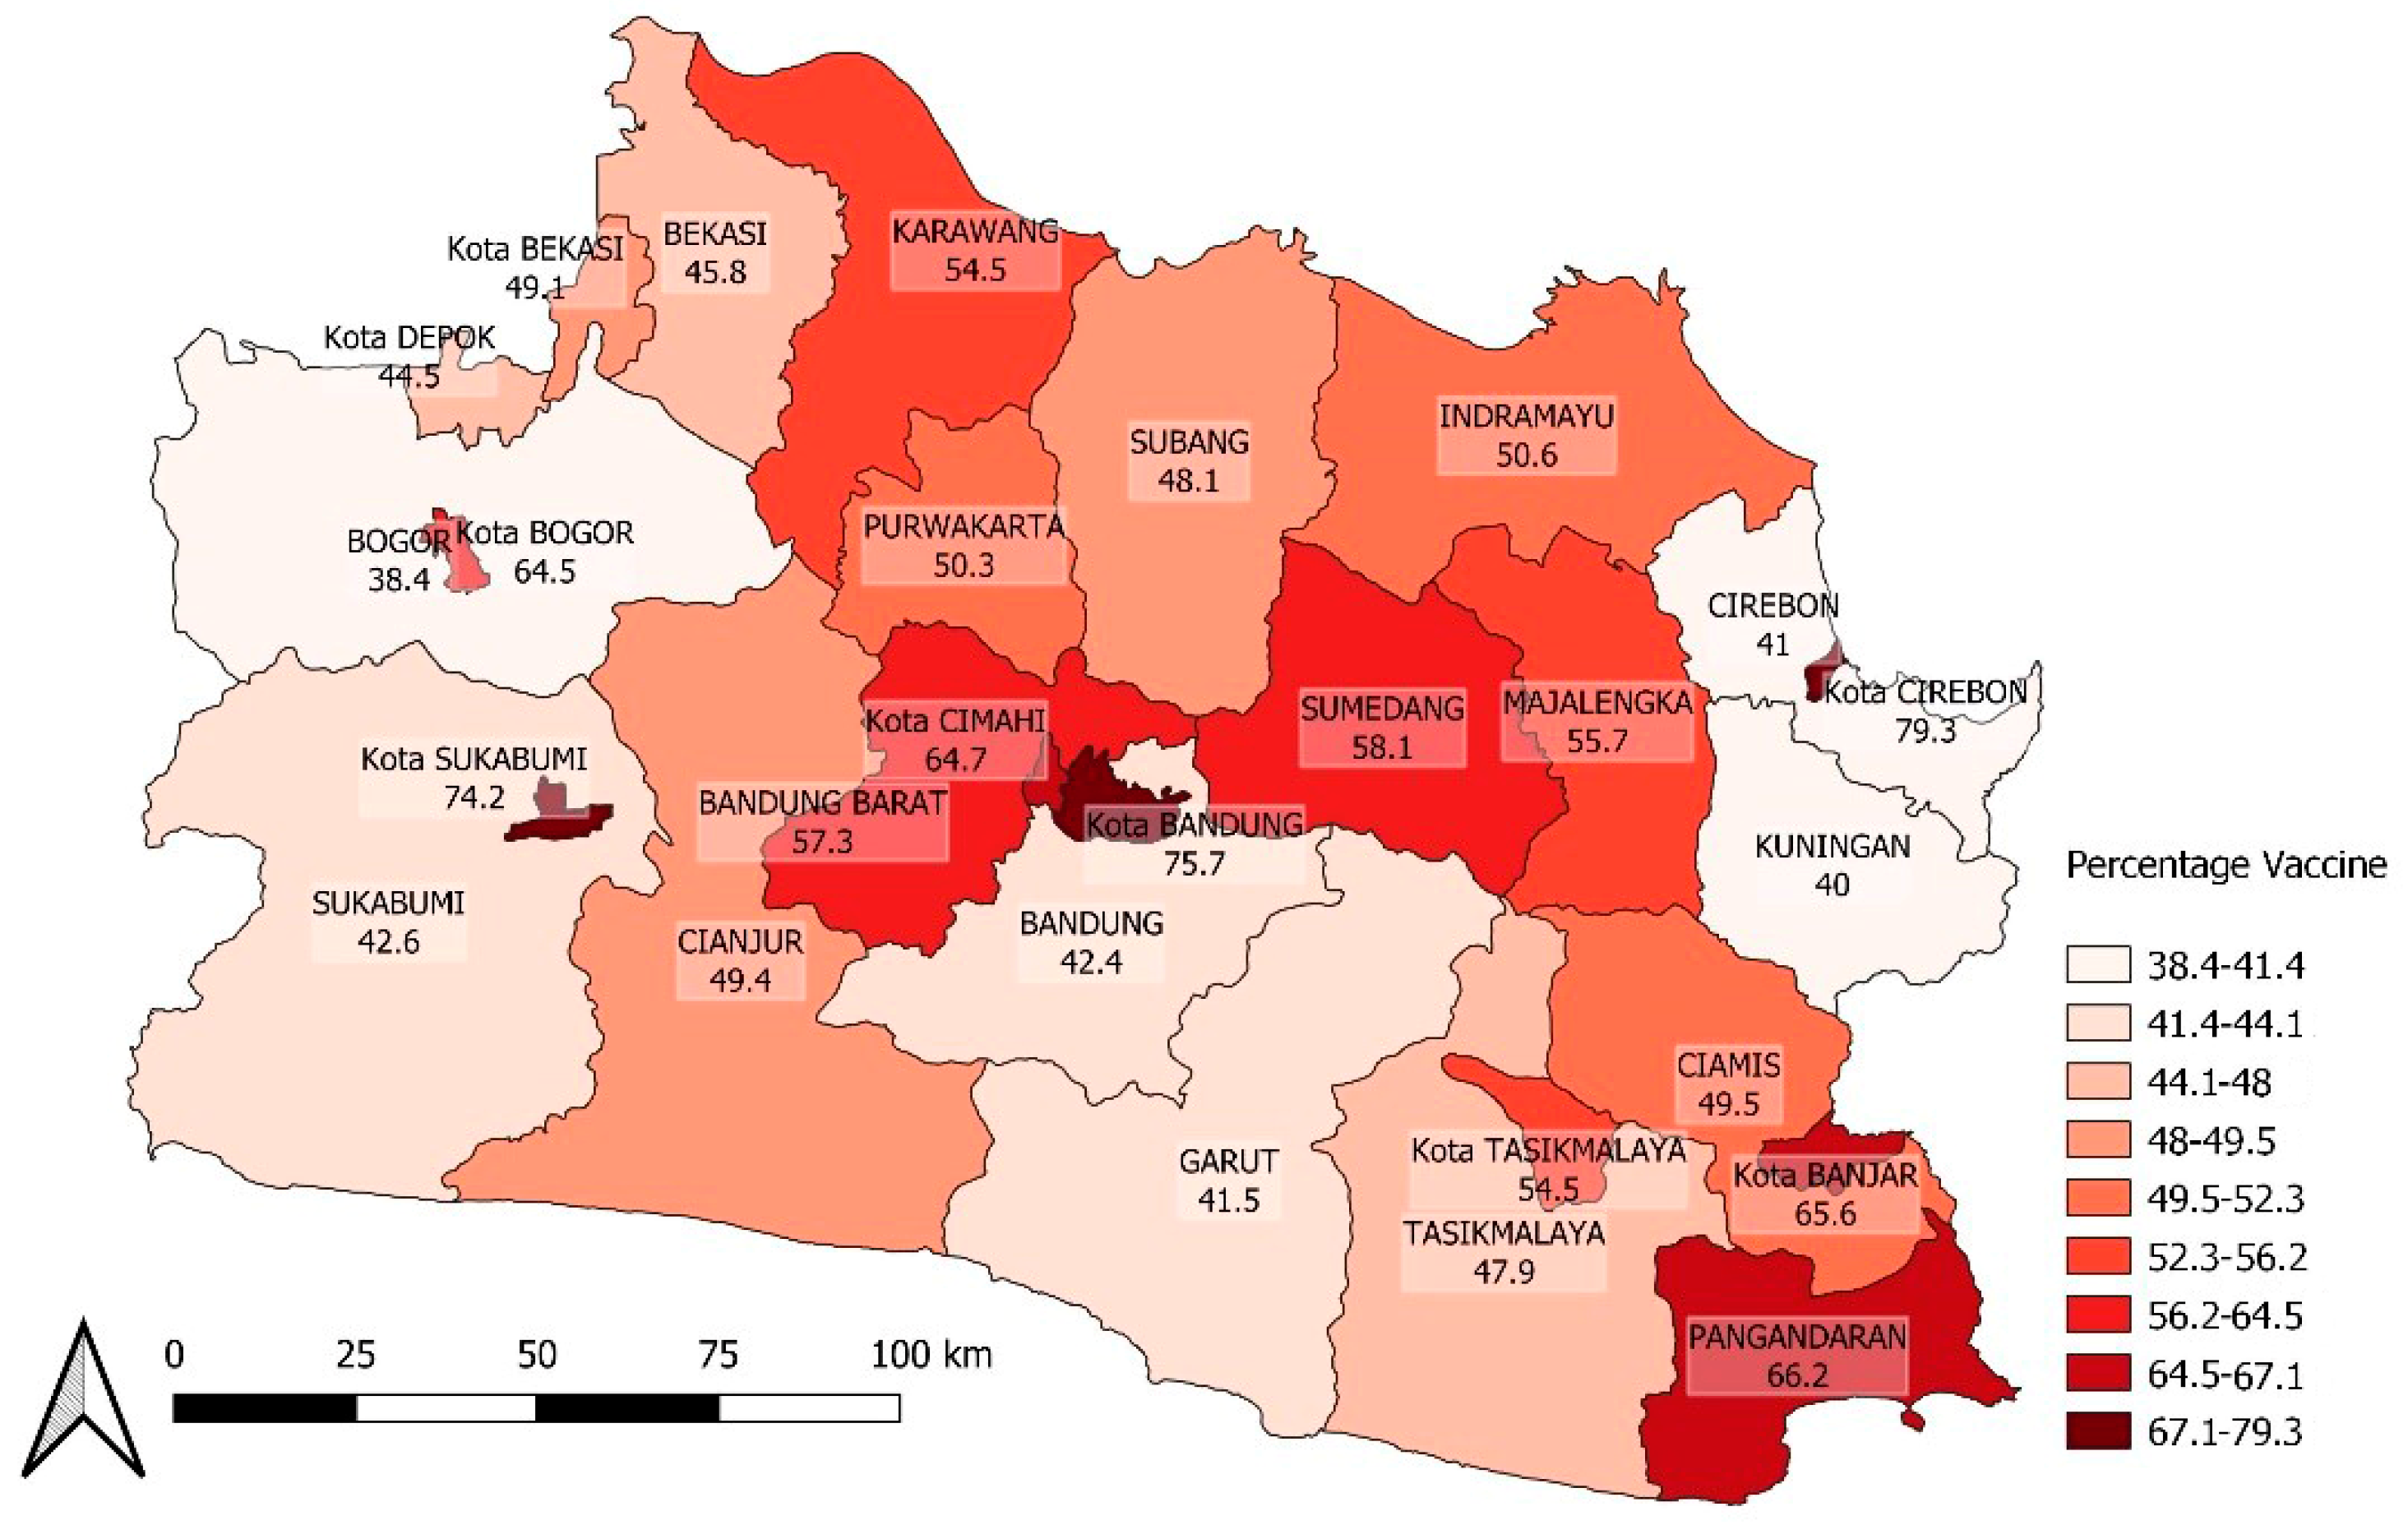
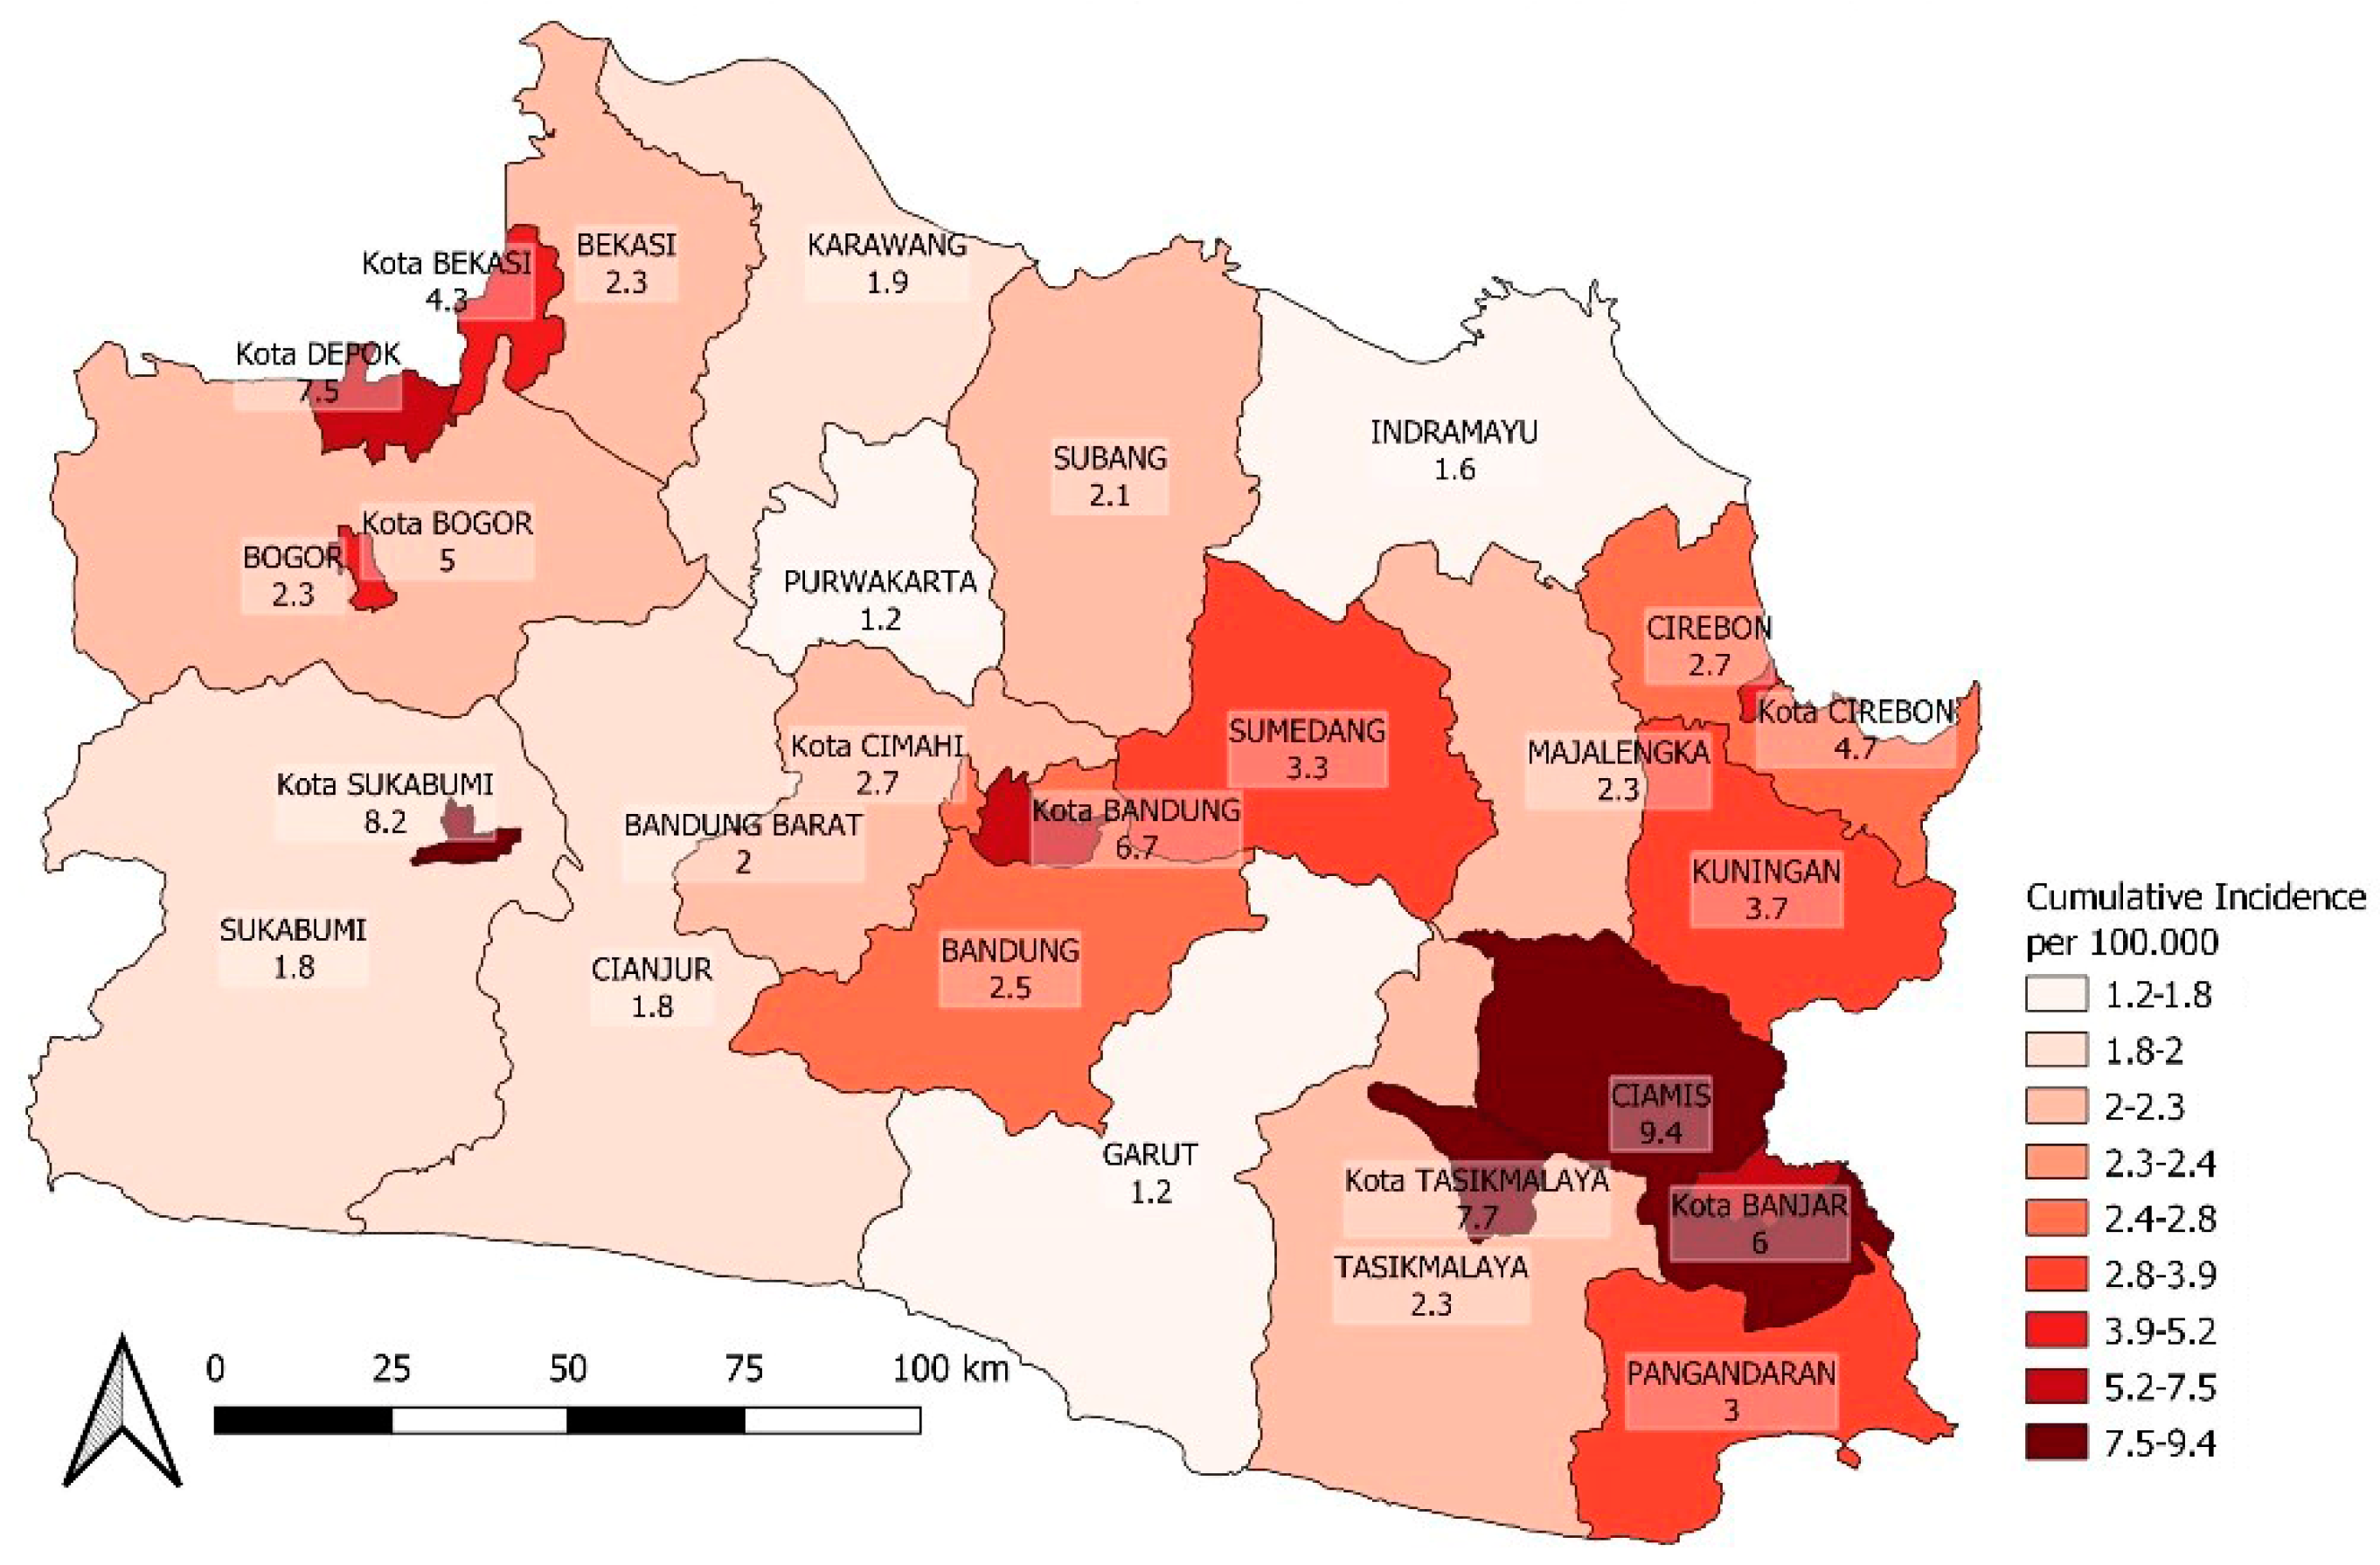
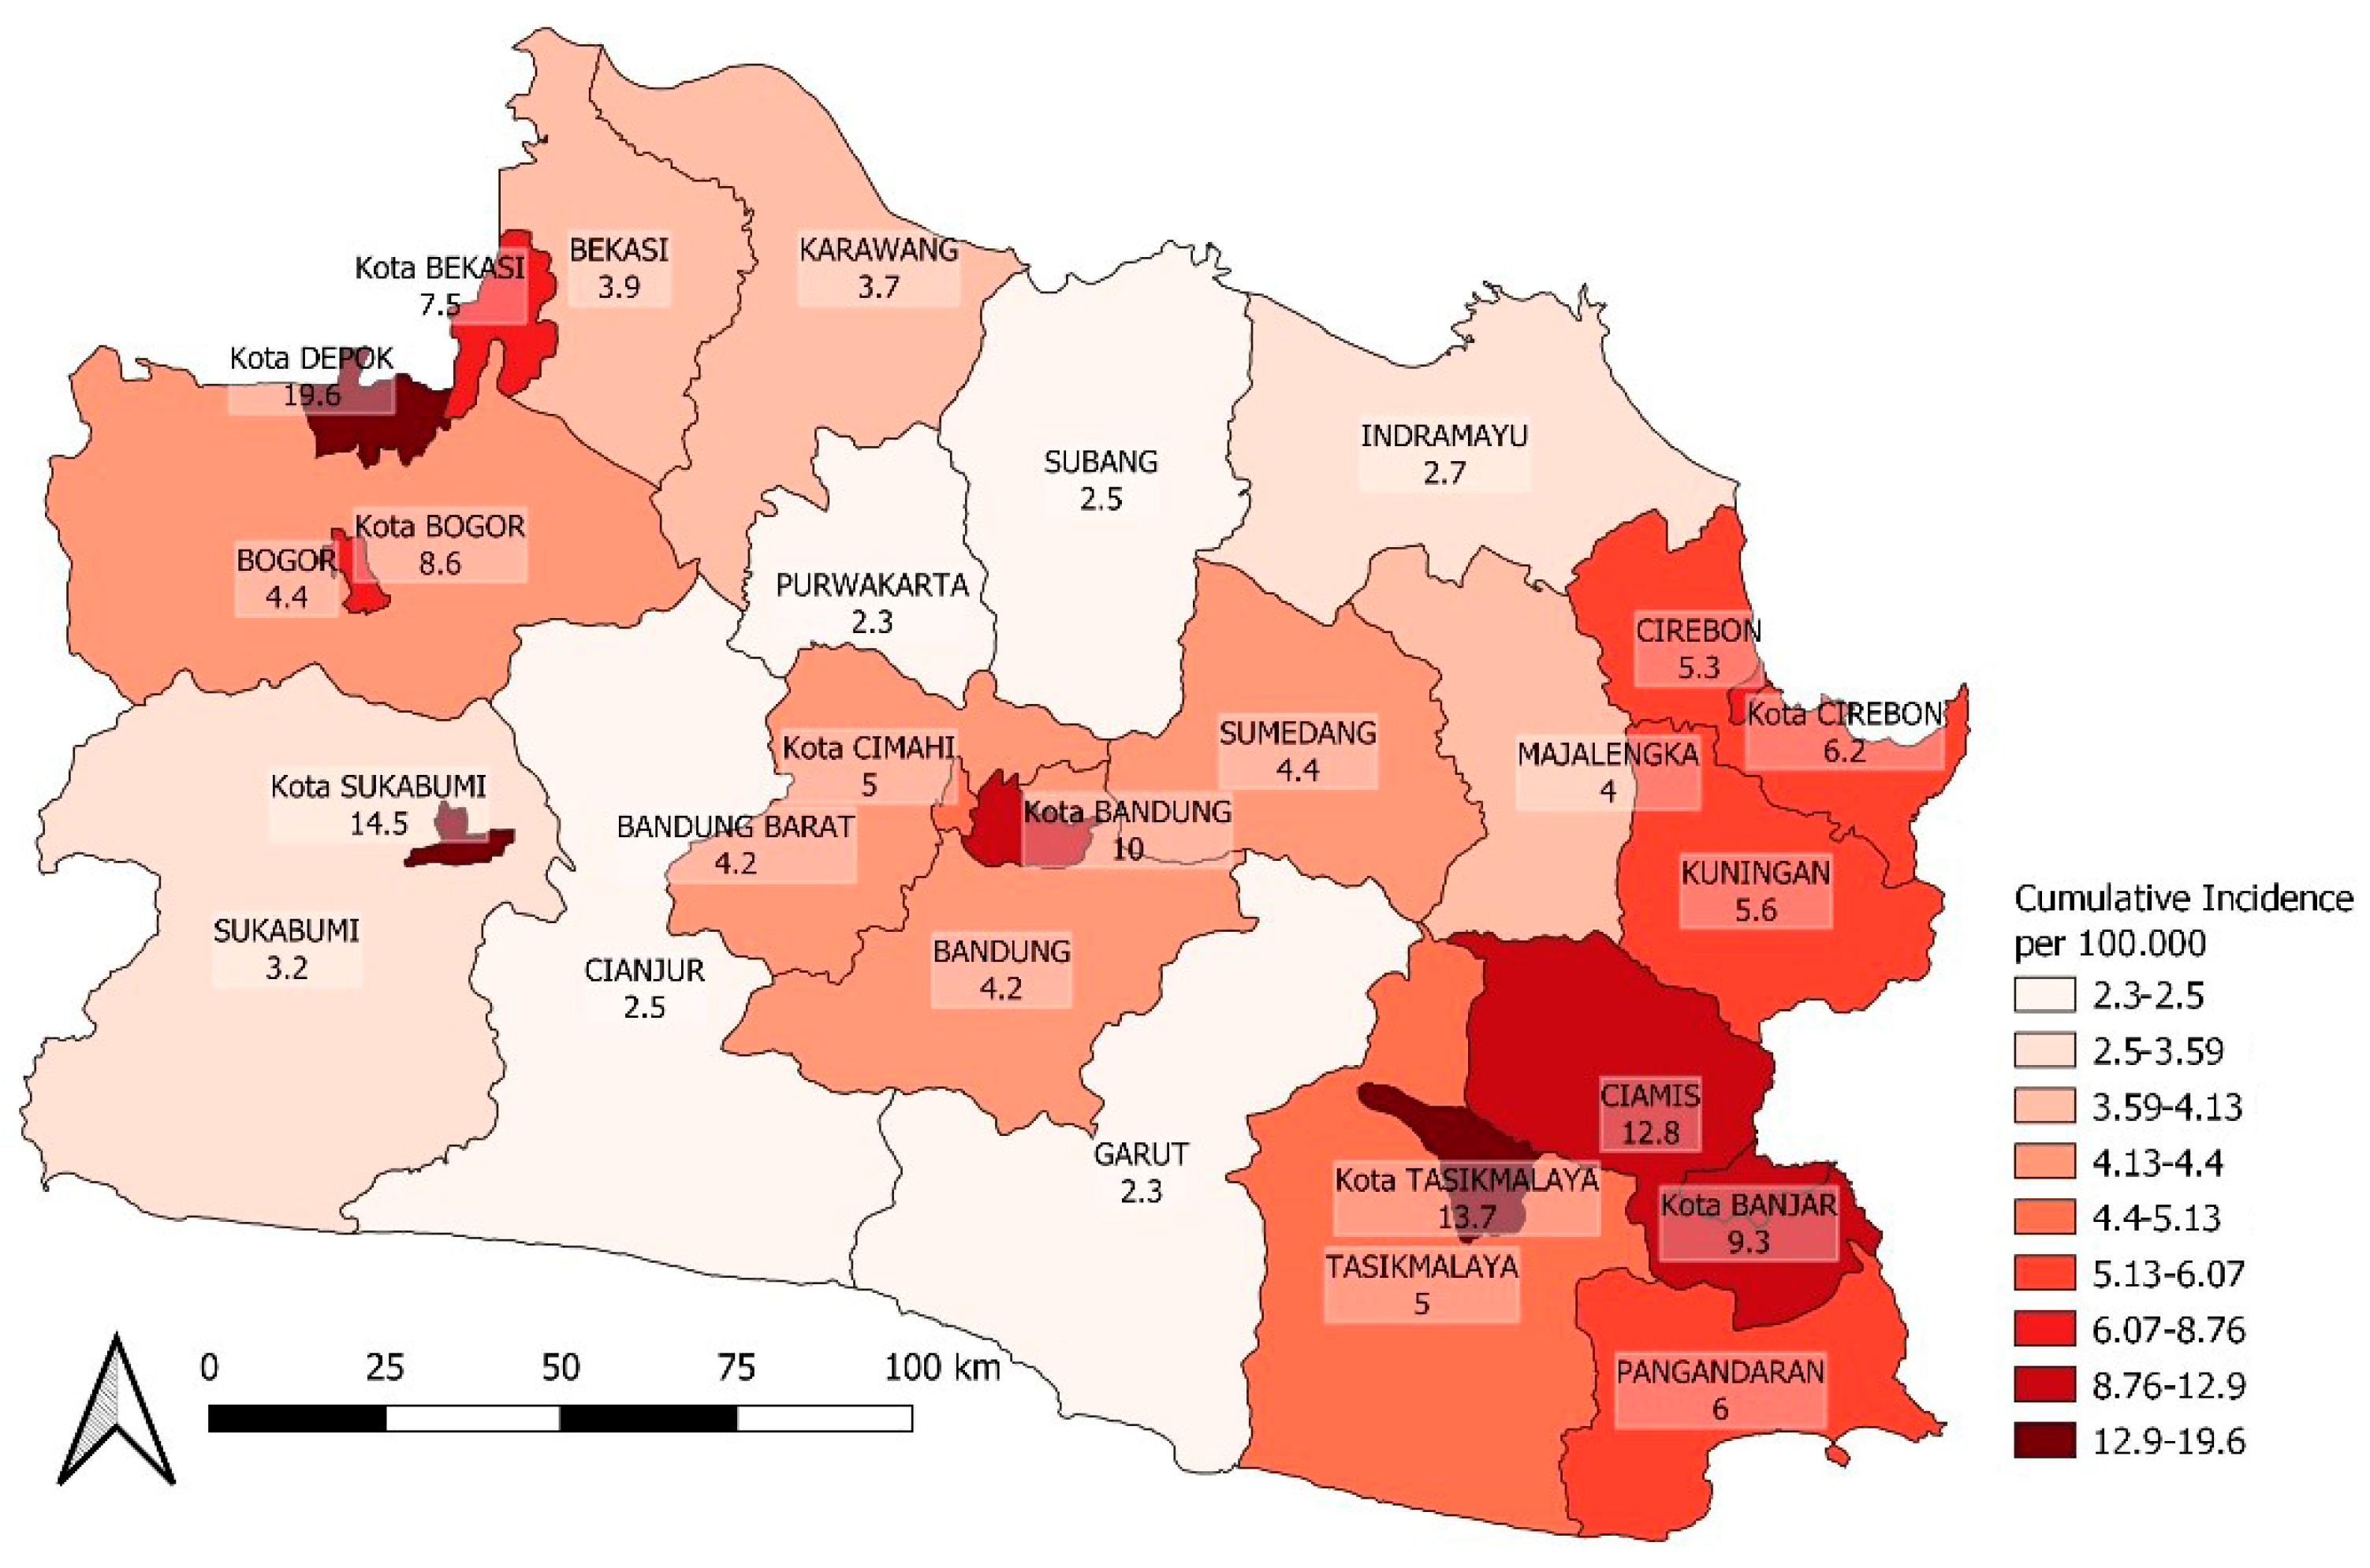
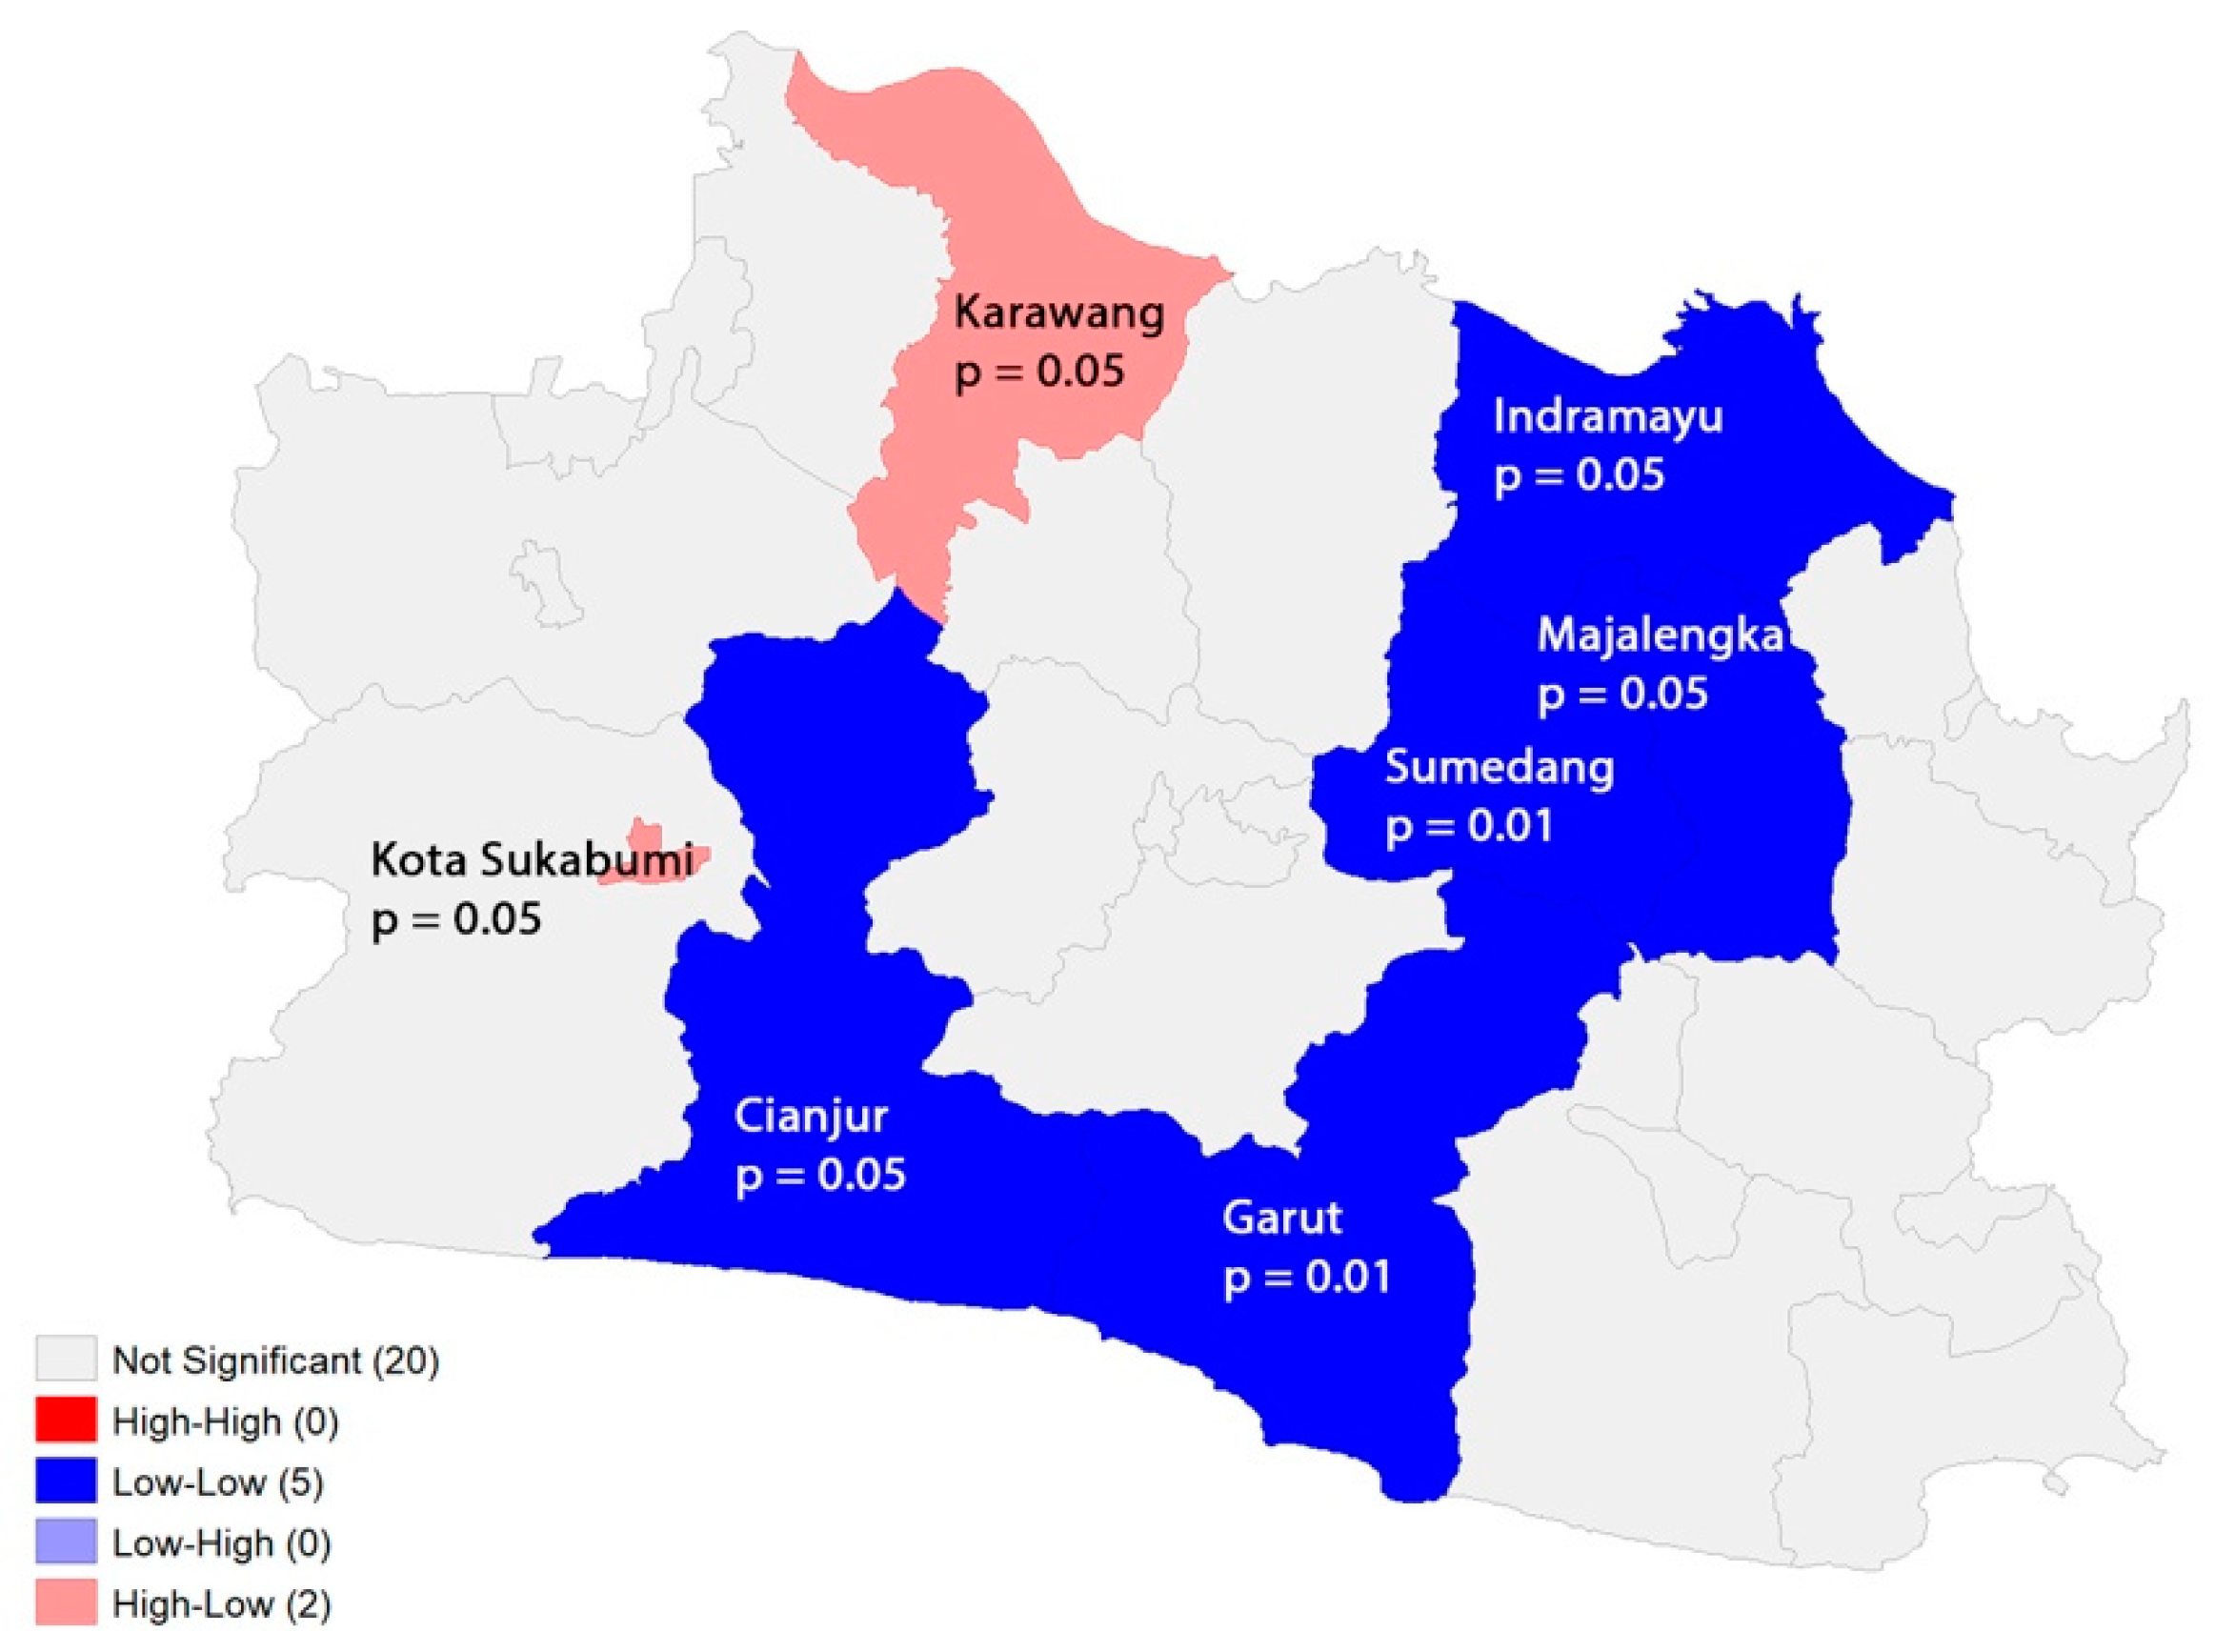
3.2. Spatial Heterogeneity of COVID-19 Incidence
3.3. Ecological Factors Associated with Spatial Distribution of COVID-19
4. Discussion
5. Strengths and Limitations
6. Conclusions
Author Contributions
Funding
Institutional Review Board Statement
Informed Consent Statement
Data Availability Statement
Acknowledgments
Conflicts of Interest
Appendix A

References
- Li, Q.; Guan, X.; Wu, P.; Wang, X.; Zhou, L.; Tong, Y.; Ren, R.; Leung, K.S.M.; Lau, E.H.Y.; Wong, J.Y.; et al. Early Transmission Dynamics in Wuhan, China, of Novel Coronavirus–Infected Pneumonia. N. Engl. J. Med. 2020, 382, 1199–1207. [Google Scholar] [CrossRef]
- WHO. WHO Director-General’s Opening Remarks at the Media Briefing on COVID-19—11 March 2020—World Health Organization; World Health Organization: Geneva, Switzerland, 2020.
- Badan Pusat Statistik Nasional. Kepadatan Penduduk Menurut Provinsi (jiwa/km2), 2015–2019. 2020. Available online: https://www.bps.go.id/indicator/12/141/1/kepadatan-penduduk-menurut-provinsi.html (accessed on 16 July 2022).
- BPS. Data Distribusi Presentase Kependudukan Indonesia. 2016. Available online: https://www.bps.go.id/indicator/12/136/1/distribusi-persentase-penduduk.html (accessed on 15 April 2022).
- Kadi, N.; Khelfaoui, M. Population density, a factor in the spread of COVID-19 in Algeria: Statistic study. Bull. Natl. Res. Cent. 2020, 44, 138. [Google Scholar] [CrossRef] [PubMed]
- Liu, Y.; Gu, Z.; Xia, S.; Shi, B.; Zhou, X.N.; Shi, Y.; Liu, J. What are the underlying transmission patterns of COVID-19 outbreak? An age-specific social contact characterization. EClinicalMedicine 2020, 22, 100354. [Google Scholar] [CrossRef] [PubMed]
- Ganasegeran, K.; Jamil, M.F.A.; Ch’ng, A.S.H.; Looi, I.; Peariasamy, K.M. Influence of population density for COVID-19 spread in malaysia: An ecological study. Int. J. Environ. Res. Public Health 2021, 18, 9866. [Google Scholar] [CrossRef] [PubMed]
- Asrani, P.; Eapen, M.S.; Hassan, M.I.; Sohal, S.S. Implications of the second wave of COVID-19 in India. Lancet Respir. Med. 2021, 9, e93–e94. [Google Scholar] [CrossRef]
- Moradi, F.; Enjezab, B.; Ghadiri-anari, A. Second wave of COVID-19 in India: Dissection of the causes and lessons learnt. Travel Med. Infect. Dis. 2020, 43, 102126. [Google Scholar]
- Robinson, J.; Banerjee, I.; Leclézio, A.; Sathian, B. COVID-19 and mutations a threat level assessment. Nepal J. Epidemiol. 2021, 11, 983–987. [Google Scholar] [CrossRef] [PubMed]
- Aisyah, D.N.; Mayadewi, C.A.; Diva, H.; Kozlakidis, Z.; Siswanto; Adisasmito, W. A spatial-temporal description of the SARSCoV-2 infections in Indonesia during the first six months of outbreak. PLoS ONE 2020, 15, e0243703. [Google Scholar] [CrossRef]
- Chen, Z.L.; Zhang, Q.; Lu, Y.; Guo, Z.M.; Zhang, X.; Zhang, W.J.; Guo, C.; Liao, C.H.; Li, Q.L.; Han, X.H.; et al. Distribution of the COVID-19 epidemic and correlation with population emigration from Wuhan, China. Chin. Med. J. 2020, 133, 1044–1050. [Google Scholar] [CrossRef] [PubMed]
- Su, L.; Hong, N.; Zhou, X.; He, J.; Ma, Y.; Jiang, H.; Han, L.; Chang, F.; Shan, G.; Zhu, W.; et al. Evaluation of the Secondary Transmission Pattern and Epidemic Prediction of COVID-19 in the Four Metropolitan Areas of China. Front. Med. 2020, 7, 171. [Google Scholar] [CrossRef]
- Wang, X.Y.; Zhang, Y.Q.; Cai, L.W. Spatiotemporal characteristics of the COVID-19 resurgence in the metropolitan wholesale market of Beijing, China. J. Travel Med. 2021, 28, taab008. [Google Scholar] [CrossRef] [PubMed]
- Gayawan, E.; Awe, O.O.; Oseni, B.M.; Uzochukwu, I.C.; Adekunle, A.; Samuel, G.; Eisen, D.P.; Adegboye, O.A. The spatio-temporal epidemic dynamics of COVID-19 outbreak in Africa. Epidemiol. Infect. 2020, 148, 1–11. [Google Scholar] [CrossRef] [PubMed]
- Mollalo, A.; Mohammadi, A.; Mavaddati, S.; Kiani, B. Spatial Analysis of COVID-19 Vaccination: A Scoping Review. Int. J. Environ. Res. Public Health 2021, 18, 12024. [Google Scholar] [CrossRef]
- Docherty, A.B.; Harrison, E.M.; Green, C.A.; Hardwick, H.E.; Pius, R.; Norman, L.; Holden, K.A.; Read, J.M.; Dondelinger, F.; Carson, G.; et al. Features of 20 133 UK patients in hospital with covid-19 using the ISARIC WHO Clinical Characterisation Protocol: Prospective observational cohort study. BMJ 2020, 369, m1985. [Google Scholar] [CrossRef]
- Creswell, W.J.; Creswell, J.D. Research Design: Qualitative, Quantitative adn Mixed Methods Approaches. J. Chem. Inf. Model. 2018, 53, 1–388. [Google Scholar]
- Anselin, L. Exploring Spatial Data with GeoDaTM: A Workbook, Revised Version. Spat. Anal. Lab. Dep. Geogr. 2005, 1963, 157–161. Available online: http://sal.agecon.uiuc.edu/ (accessed on 21 May 2021).
- Mathieu, E.; Ritchie, H.; Rodes, L.; Appel, C.; Gavrilov, D.; Giattino, C.; Hasell, J.; Macdonald, B.; Dattani, S.; Beltekian, D.; et al. Coronavirus (COVID-19) Cases. Available online: https://ourworldindata.org/covid-cases (accessed on 8 June 2022).
- Dirjen Pelayanan Kesehatan Kemenkes RI. Tarif Tertinggi Pemeriksaan RT-PCR. Kementrian Kesehatan Republik Indonesia. 2020. Available online: https://infeksiemerging.kemkes.go.id/download/SE_tentang_Batasan_Tarif_Tertinggi_Pemeriksaan_RT-PCR.pdf (accessed on 21 May 2021).
- KMK. No 46 Tahun Keputusan menteri kesehatan republik indonesia penggunaan rapid diagnostic test antigen dalam pemeriksaan corona virus disease 2019 (COVID-19). J. Chem. Inf. Model. 2021, 2019, 1689–1699. [Google Scholar]
- Kementrian, R.I. Batas Tarif Tertinggi Pemeriksaan Reserve Transcription Polymerase Chain Reaction (RT-PCR). 2021, pp. 3–6. Available online: https://lampungprov.go.id/detail-post/surat-edaran-batas-tarif-tertinggi-pemeriksaan-reserve-transcription-polymerase-chain-reaction-rt-pcr (accessed on 16 July 2022).
- Andreas, I.; Wang, Y.; Wong, T. Wuhan Lockdown: A Year of China’s Fight against the COVID Pandemic. 2021. Available online: https://www.bbc.com/news/world-asia-china-55628488 (accessed on 12 June 2022).
- Molefi, M.; Tlhakanelo, J.T.; Phologolo, T.; Hamda, S.G.; Masupe, T.; Tsima, B.; Setlhare, V.; Mashalla, Y.; Wiebe, D.J. The Impact of China’s Lockdown Policy on the Incidence of COVID-19: An Interrupted Time Series Analysis. BioMed Res. Int. 2021, 2021, 9498029. [Google Scholar] [CrossRef]
- Robert, A. Lessons from New Zealand’s COVID-19 outbreak response. Lancet Public Health 2020, 5, e569–e570. [Google Scholar] [CrossRef]
- Baker, M.G.; Kvalsvig, A.; Verrall, A.J. New Zealand’s COVID-19 elimination strategy. Med. J. Aust. 2020, 213, 198–200.e1. [Google Scholar] [CrossRef]
- President of the Republic of Indonesia Regulation of the President of the Republic of Indonesia Number 99 of 2020 Concerning Vaccine Procurement and Vaccination Implementation in the Context of Combating the Corona Virus Disease 2019 (COVID-19) Pandemic. Pres. Regul. 2020, 2019, 1–13. Available online: https://peraturan.bpk.go.id/Home/Details/147944/perpres-no-99-tahun-2020 (accessed on 21 May 2021).
- Elvia, D. Jokowi Gets First COVID-19 Vaccine Shot: I Don’t Feel It At All. 2021. Available online: https://en.tempo.co/read/1422750/jokowi-gets-first-covid-19-vaccine-shot-i-dont-feel-it-at-all (accessed on 12 June 2022).
- Raiyda, N. Jokowi to Be the First to Receive COVID-19 Vaccine in Indonesia, Vaccines Will Be Free for All. 2020. Available online: https://www.channelnewsasia.com/asia/indonesia-jokowi-covid-19-first-vaccinated-free-vaccines-for-all-482201 (accessed on 12 June 2022).
- Rahayu, U. COVID-19 Varian Delta Masuk ke Indonesia, Apa Saja Yang Mesti Diwaspadai? 2021. Available online: https://hellosehat.com/infeksi/covid19/covid-19-varian-delta/ (accessed on 12 June 2022).
- Detik.com. Kemenkes: Penyebaran Varian Delta Hampir Merata di Indonesia. Available online: https://news.detik.com/berita/d-5660779/kemenkes-penyebaran-varian-delta-hampir-merata-di-indonesia (accessed on 12 June 2022).
- Kim, B.N.; Kim, E.; Lee, S.; Oh, C. Mathematical model of COVID-19 transmission dynamics in South Korea: The impacts of travel restrictions, social distancing, and early detection. Processes 2020, 8, 1304. [Google Scholar] [CrossRef]
- Li, Z.; Liu, X.; Liu, M.; Wu, Z.; Liu, Y.; Li, W.; Liu, M.; Wang, X.; Gao, B.; Luo, Y.; et al. The effect of the COVID-19 vaccine on daily cases and deaths based on global vaccine data. Vaccines 2021, 9, 328. [Google Scholar] [CrossRef]
- Hodgson, S.H.; Mansatta, K.; Mallett, G.; Harris, V.; Emary, K.R.W.; Pollard, A.J. What defines an efficacious COVID-19 vaccine? A review of the challenges assessing the clinical efficacy of vaccines against SARS-CoV-2. Lancet Infect. Dis. 2021, 21, e26–e35. [Google Scholar] [CrossRef]
- Li, Y.D.; Chi, W.Y.; Su, J.H.; Ferrall, L.; Hung, C.F.; Wu, T.C. Coronavirus vaccine development: From SARS and MERS to COVID-19. J. Biomed. Sci. 2020, 27, 104. [Google Scholar] [CrossRef]
- Penerliev, M.; Petkov, V. Geodemographic Aspects of COVID-19. Espaço Econ. 2020, 18. [Google Scholar] [CrossRef]
- Hart, W.S.; Miller, E.; Andrews, N.J.; Waight, P.; Maini, P.K.; Funk, S.; Thompson, R.N. Generation time of the alpha and delta SARS-CoV-2 variants: An epidemiological analysis. Lancet Infect. Dis. 2022, 22, 603–610. [Google Scholar] [CrossRef] [PubMed]
- Sigal, A.; Milo, R.; Jassat, W. Estimating disease severity of Omicron and Delta SARS-CoV-2 infections. Nat. Rev. Immunol. 2022, 22, 267–269. [Google Scholar] [CrossRef]
- Chang, S.L.; Cliff, O.M.; Zachreson, C.; Prokopenko, M. Simulating Transmission Scenarios of the Delta Variant of SARS-CoV-2 in Australia. Front. Public Health 2022, 10, 1–10. [Google Scholar] [CrossRef] [PubMed]


| n = 27 | ||||||
|---|---|---|---|---|---|---|
| Variable | Min | Max | Median | IQR | Mean | SD |
| Population density | 398 | 15,798 | 1435 | 4510 | 4100.85 | 4949.11 |
| Cumulative vaccine coverage—dose 1 (%) | 38.40 | 79.30 | 50.30 | 16.15 | 53.76 | 11.23 |
| Total COVID-19 CI | 0.40 | 4.30 | 1.30 | 1.10 | 1.62 | 1.06 |
| One-week cumulative incidence (30 days lagged after vaccination) | 1.21 | 9.40 | 2.67 | 2.77 | 3.70 | 2.31 |
| Two-week cumulative incidence ((30 days lagged after vaccination) | 2.26 | 19.56 | 4.96 | 4.25 | 6.41 | 4.27 |
| District Area | ||
|---|---|---|
| Variable | Garut | Sumedang |
| Population density | 858 (1st Quartile) | 760 (1st Quartile) |
| Cumulative vaccine coverage—dose 1 (%) | 41.5 (2nd Quartile) | 58.1 (2nd Quartile) |
| Total COVID-19CI | 1 | 0.8 |
| One-week cumulative incidence (30 days lagged after vaccination) | 1.2 | 2.3 |
| Two-week cumulative incidence (30 days lagged after vaccination) | 3.3 | 4.4 |
| Variable | Model 1 Outcome Variable: Total Cumulative Incidence | Model 2 Outcome Variable: One-Week Cumulative Incidence (30 days Lagged after Vaccination) | Model 3 Outcome Variable: Two-Week Cumulative Incidence (30 days Lagged after Vaccination) | |||
|---|---|---|---|---|---|---|
| Beta | p-Value | Beta | p-Value | Beta | p-Value | |
| Population density | 0.0001 | <0.01 | 0.008 | <0.01 | 0.02 | <0.01 |
| Cumulative vaccine coverage—dose 1 (%) | 0.02 | 0.13 | −2.5 | <0.01 | −5.6 | <0.01 |
| R-squared | 0.53 | 0.45 | 0.48 | |||
| Model fit (AIC) | 65 | 275 | 313 | |||
Disclaimer/Publisher’s Note: The statements, opinions and data contained in all publications are solely those of the individual author(s) and contributor(s) and not of MDPI and/or the editor(s). MDPI and/or the editor(s) disclaim responsibility for any injury to people or property resulting from any ideas, methods, instructions or products referred to in the content. |
© 2023 by the authors. Licensee MDPI, Basel, Switzerland. This article is an open access article distributed under the terms and conditions of the Creative Commons Attribution (CC BY) license (https://creativecommons.org/licenses/by/4.0/).
Share and Cite
Putri, D.I.P.; Agustian, D.; Apriani, L.; Ilyas, R. Spatial and Temporal Analysis of COVID-19 Cases in West Java, Indonesia and Its Influencing Factors. Int. J. Environ. Res. Public Health 2023, 20, 3198. https://doi.org/10.3390/ijerph20043198
Putri DIP, Agustian D, Apriani L, Ilyas R. Spatial and Temporal Analysis of COVID-19 Cases in West Java, Indonesia and Its Influencing Factors. International Journal of Environmental Research and Public Health. 2023; 20(4):3198. https://doi.org/10.3390/ijerph20043198
Chicago/Turabian StylePutri, Delima Istio Prawiradhani, Dwi Agustian, Lika Apriani, and Ridwan Ilyas. 2023. "Spatial and Temporal Analysis of COVID-19 Cases in West Java, Indonesia and Its Influencing Factors" International Journal of Environmental Research and Public Health 20, no. 4: 3198. https://doi.org/10.3390/ijerph20043198