1. Introduction
In recent years, major outbreaks of human-to-human transmission, such as COVID-19, SARS and influenza A (H1N1), have had significant impacts on urban development and human life in various countries. Dealing with pandemic disasters is one of the major health risk challenges of the 21st century. Interpersonal infectious diseases are divided into respiratory tract transmission, digestive tract transmission, contact transmission, blood transmission, insect-borne transmission, mother-to-child transmission and sexual transmission. These diseases have strong characteristics of transmission from person to person. As dynamic and complex systems, modern cities have increasingly become risk centers of various disasters due to their population concentration, complex functions, developed transportation and dense buildings. These factors also aggravate the generation and spread of different types of infectious diseases.
Canadian ecologist Hollin proposed a resilient city theory characterized by dynamic balance and adaptability. It mainly emphasizes that urban society should comprehensively evaluate the causes, scale and impact of disaster risks when facing various kinds of risk disasters and take corresponding measures to effectively deal with the impacts of risks and curb the further spread and deterioration of risks in a timely manner [
1]. Qingdao, which is studied in this paper, is a typical case of a resilient city. Urban disaster risk assessment is an important part of resilient city construction. However, to date, most previous research has focused on natural disasters such as mountain torrents, earthquakes, hurricanes, and so on [
2]. However, the risk assessment of infectious diseases is not perfect. In the context of the continuous occurrence of various human-to-human epidemic disasters, it is crucial to assess the risk intensity of epidemic disasters. We must predict the risk areas that might become the sources of outbreak and spread of new outbreaks in the future and counter the weaknesses of resilient city construction. In this way, we could promote the high-quality development of the city.
The spread of major epidemics depends on human contact. Therefore, in the absence of drug intervention and policy prevention and control, the epidemic’s spatial spread is closely related to the population distribution, built environment, scope of activities and the spatial layout of various spatial impact factors. Spatial research is of great significance for the identification of infectious disease hotspots, the analysis of spatial differentiation characteristics, the analysis of high-risk spatial agglomeration and the analysis of spatial transmission networks [
3]. As early as the middle of the 20th century, some scholars proposed using geographical thinking to study epidemic prevention and control. When the cholera epidemic broke out in London in 1854, John Snow proposed marking the location of the dead on a map, which led him to discover that the source of cholera transmission was water pollution. This played an important role in containing the epidemic at that time [
4]. In recent years, scholars in the field of geography have carried out a series of research works on the spatial transmission of various infectious diseases and achieved remarkable results. Zheng Linlin et al. conducted a statistical analysis of the case data and incidence rate data of respiratory infectious diseases in various provinces of China. They used the method of data statistics to locate the high-risk areas for infectious disease outbreak [
5]. Chai Yanwei et al. used the methods of individual space–time path analysis, activity scenario analysis and risk perception mapping to build a geographical framework for the accurate prevention and control of COVID-19 [
6]. Guo Liang et al. improved the infectivity dynamics model (SEIR) in combination with the spatial distribution characteristics of population activities, and this method could identify high-risk areas for COVID-19 epidemic on the street scale [
7]. Geography academic circles attach great importance to the study of epidemic transmission, which provides a scientific basis for the prevention and control of epidemics [
8]. However, the traditional method for the detection of epidemic risk areas is based on the spatial distribution of epidemic case data to build a visual map, and the analysis process is limited to the spatial distribution of the activities of certain groups. There are few studies on the identification of areas at high risk of epidemic due to the absence of case data, drug intervention and policy prevention and control.
Objective and accurate data and analytical methods are very important for establishing a comprehensive and multi-dimensional quantitative indicator system to evaluate the risk intensity of epidemic disasters [
9]. The development of new data environments and the emergence of new technologies and methods provide important opportunities for the measurement and analysis of traditional, unmeasurable data [
10]. The current research has found that the risk factors affecting the generation and spread of infectious diseases mainly include socio-economic aspects, physical space aspects and aspects related to the natural meteorological environment [
11]. Socio-economic aspects mainly include the external input population, economic income level (GDP), density of the population distribution, proportion of the non-agricultural population, proportion of three industries, medical and health levels, average years in education, unemployment rate, policy control of epidemics, poverty rate and proportions of the population representing different ages [
12,
13]. The physical space aspects mainly include the current situation of land use (the proportion of cultivated land, forest land, water area and construction land), the density and accessibility of the road network, distribution of various infrastructures and the mixture of land use functions [
14,
15]. The aspects related to the natural meteorological environment mainly include the average surface temperature, precipitation, relative humidity, atmospheric pollutant concentration, atmospheric pressure, annual haze days, DEM elevation, average wind speed and spatial distance [
16]. The current research has mainly used geographic weighted regression models, spatial dynamics models, cluster analysis, spatial panel data models and other methods to explore the impacts of different risk factors on the spread of infectious diseases. Few studies have identified areas with hidden dangers of infectious diseases through these factors. Additionally, most of the studies on the risk factors for infectious diseases only involved a single factor or a certain infectious disease. There is a lack of research on the spatial distribution of incidence rates using multiple factors.
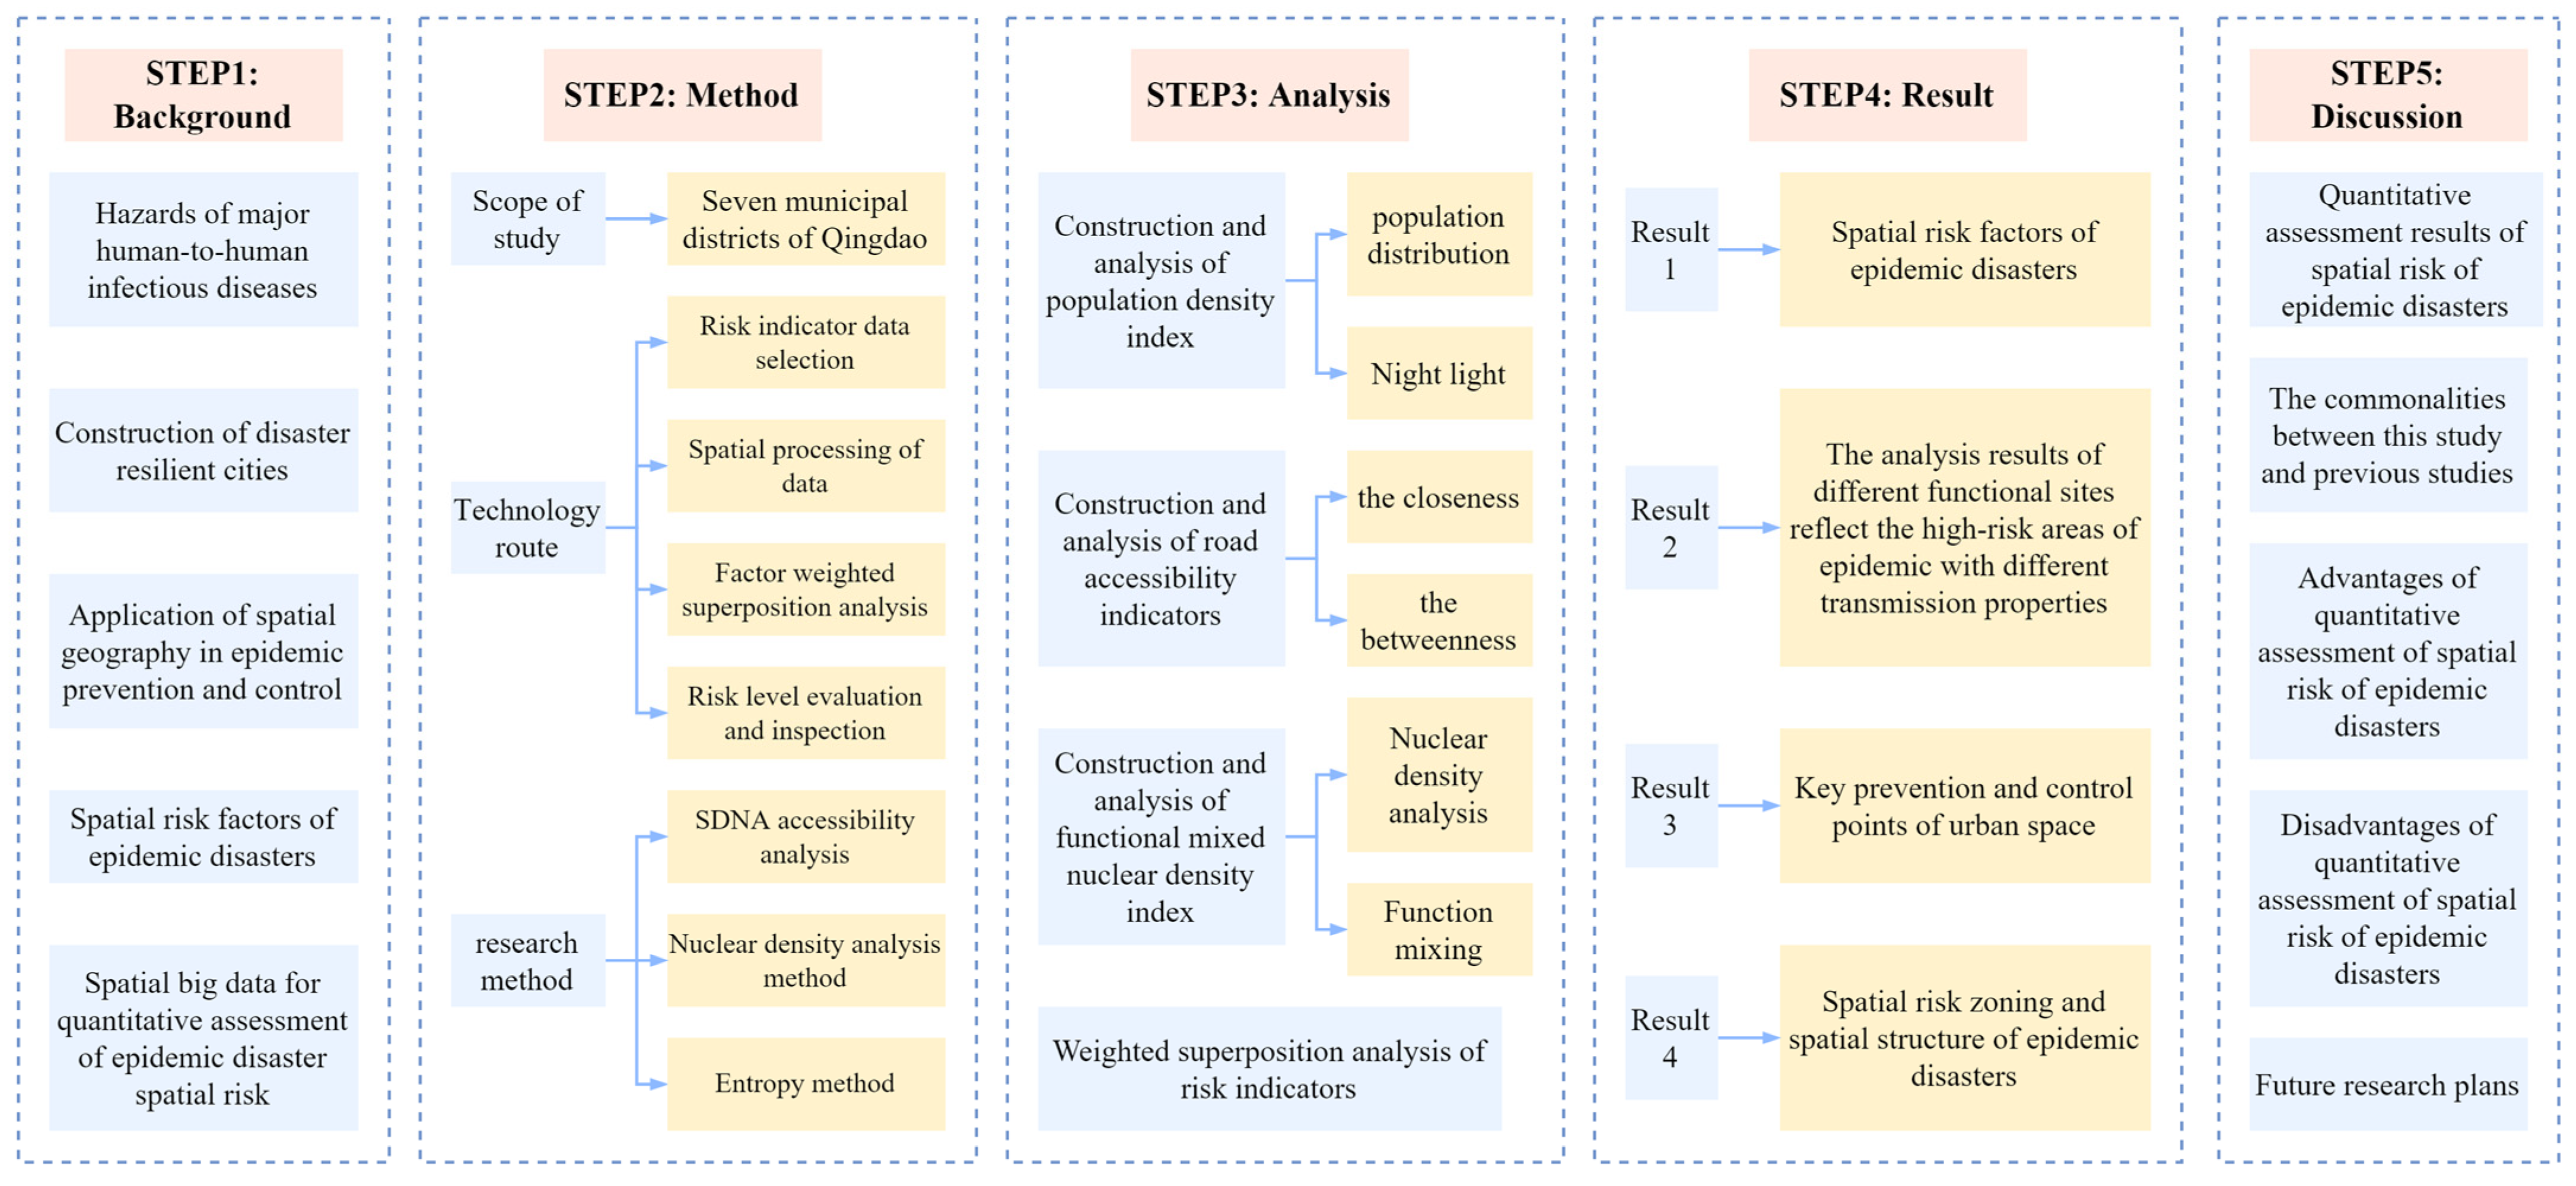
For human-to-human epidemic disasters, the high-risk areas in large cities are mostly densely populated areas and areas that are prone to crowd concentration. It is possible to identify risk areas using spatial risk factors that might increase the intensity of crowd activities. Therefore, this study mainly started from the perspective of the spatial layout and only selected risk factors related to the population and spatial geographical distribution of urban built-up areas in order to build an indicator system for analysis. This paper combined the multi-dimensional quantitative assessment of epidemic disasters with the spatial analysis method of using spatial big data to predict the spatial risk of urban agglomeration [
17]. The framework of this article is shown in
Figure 1.
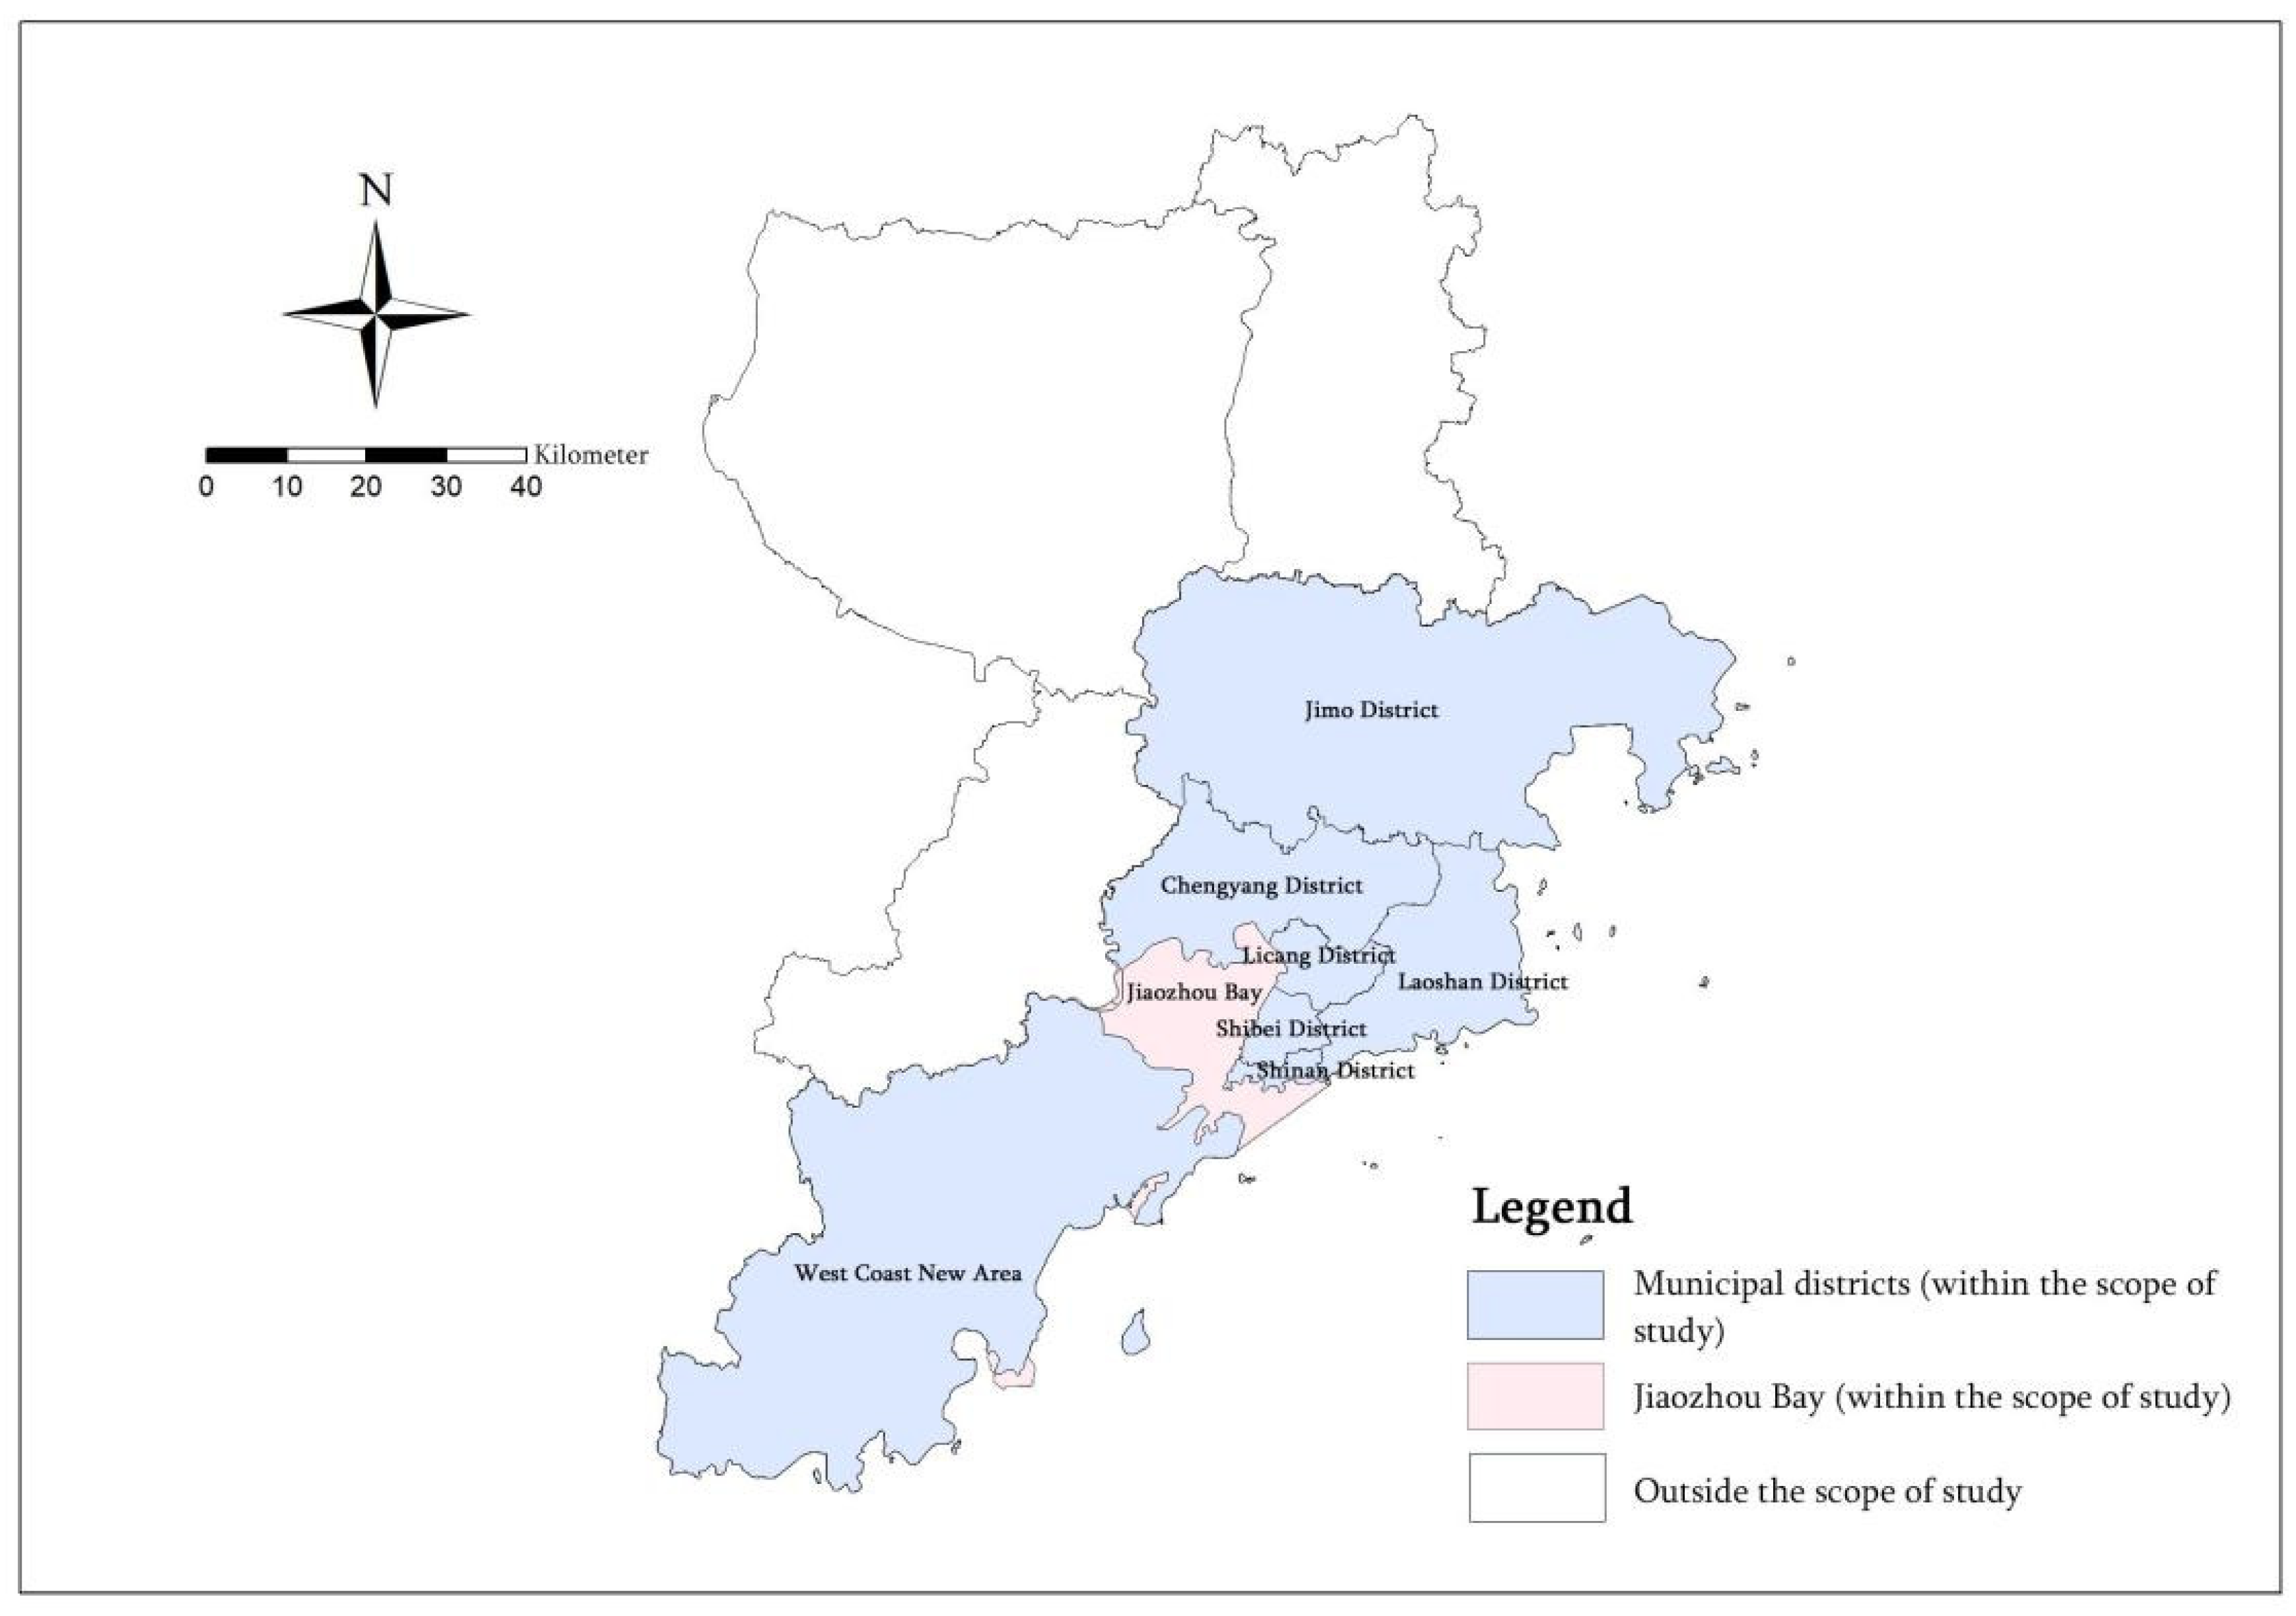
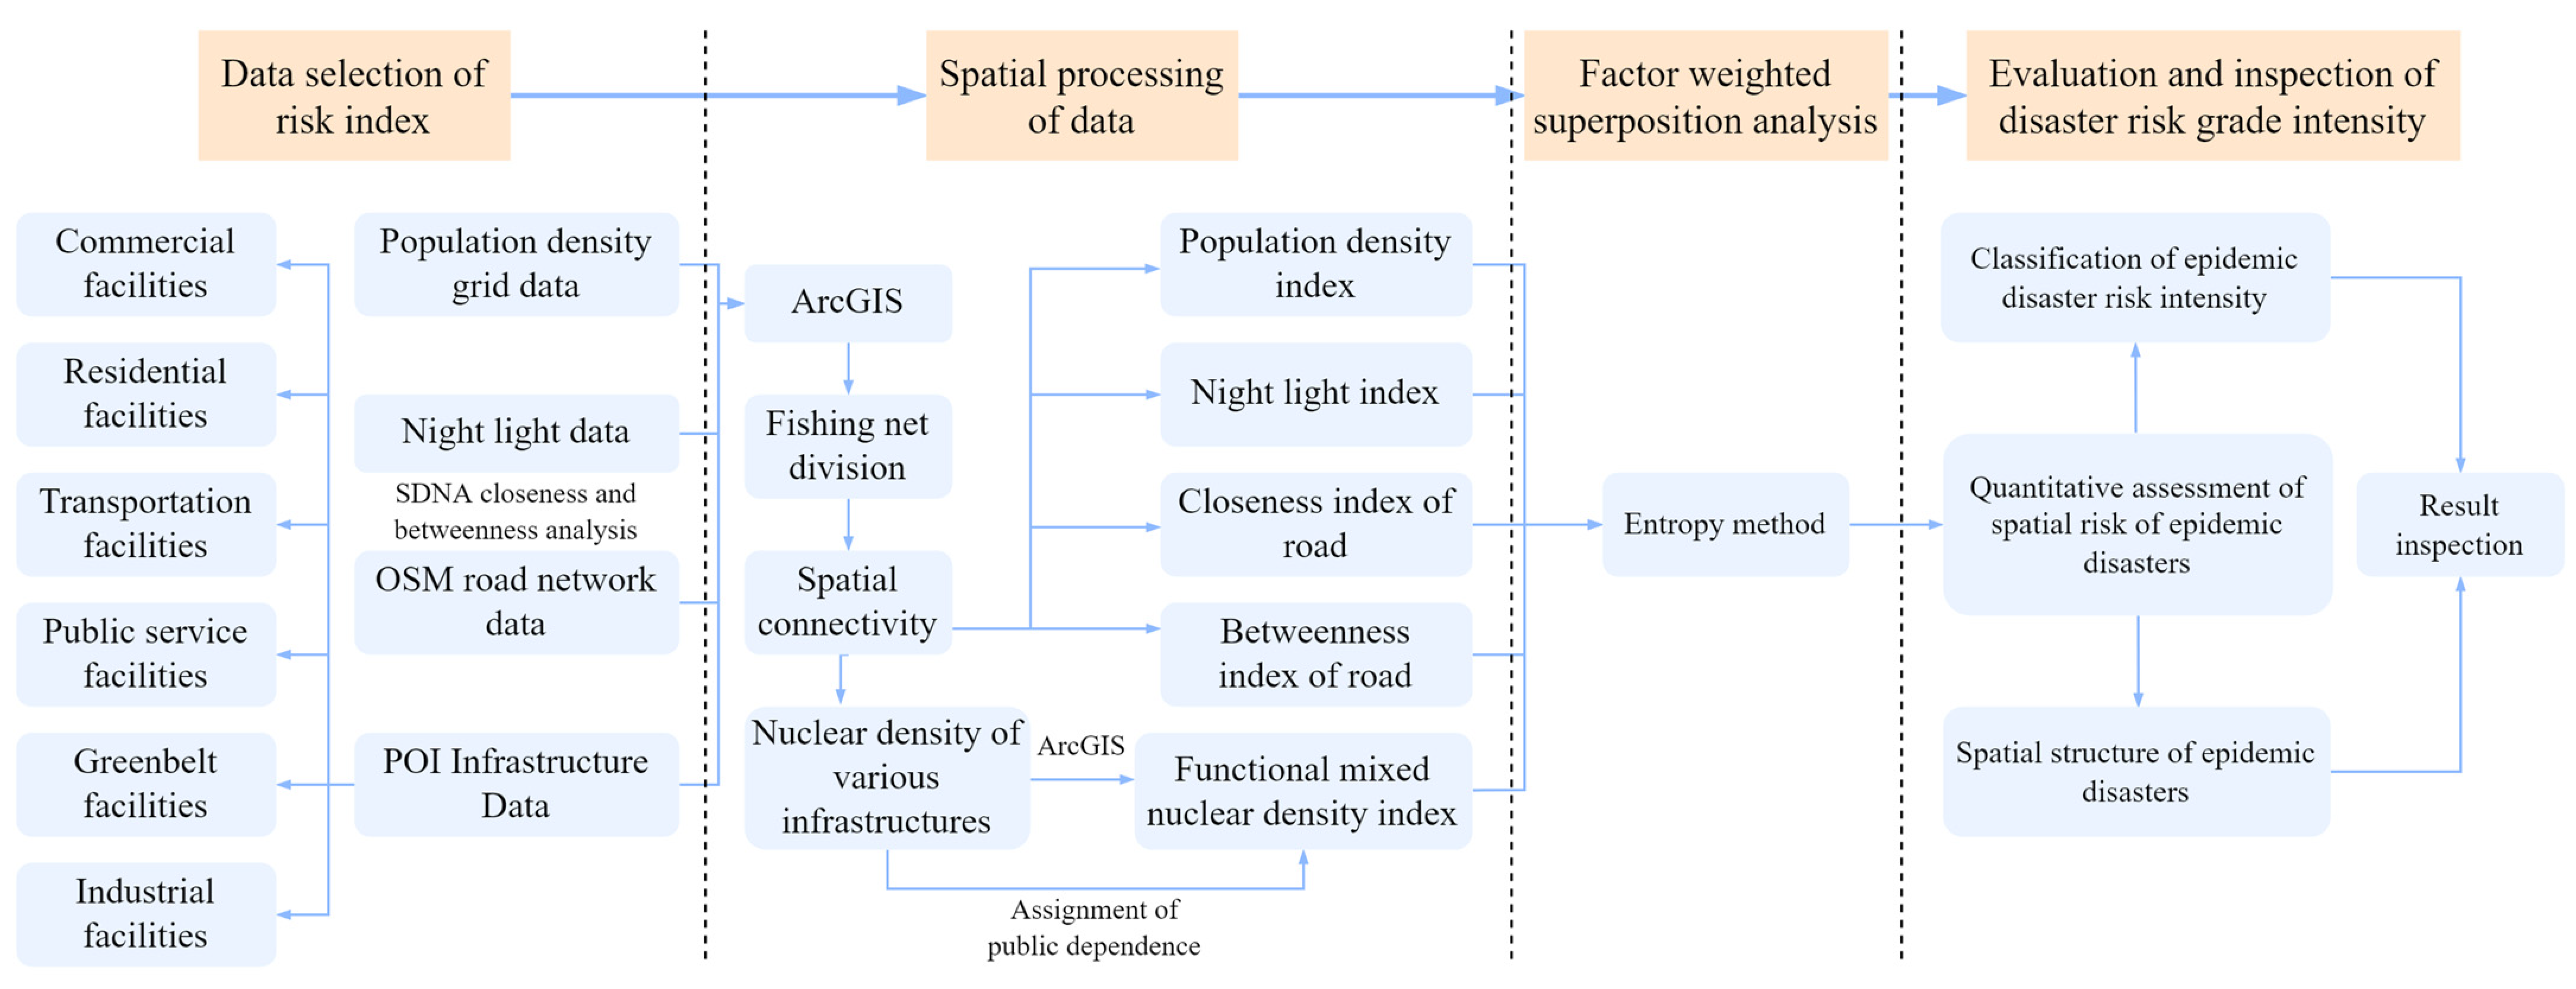
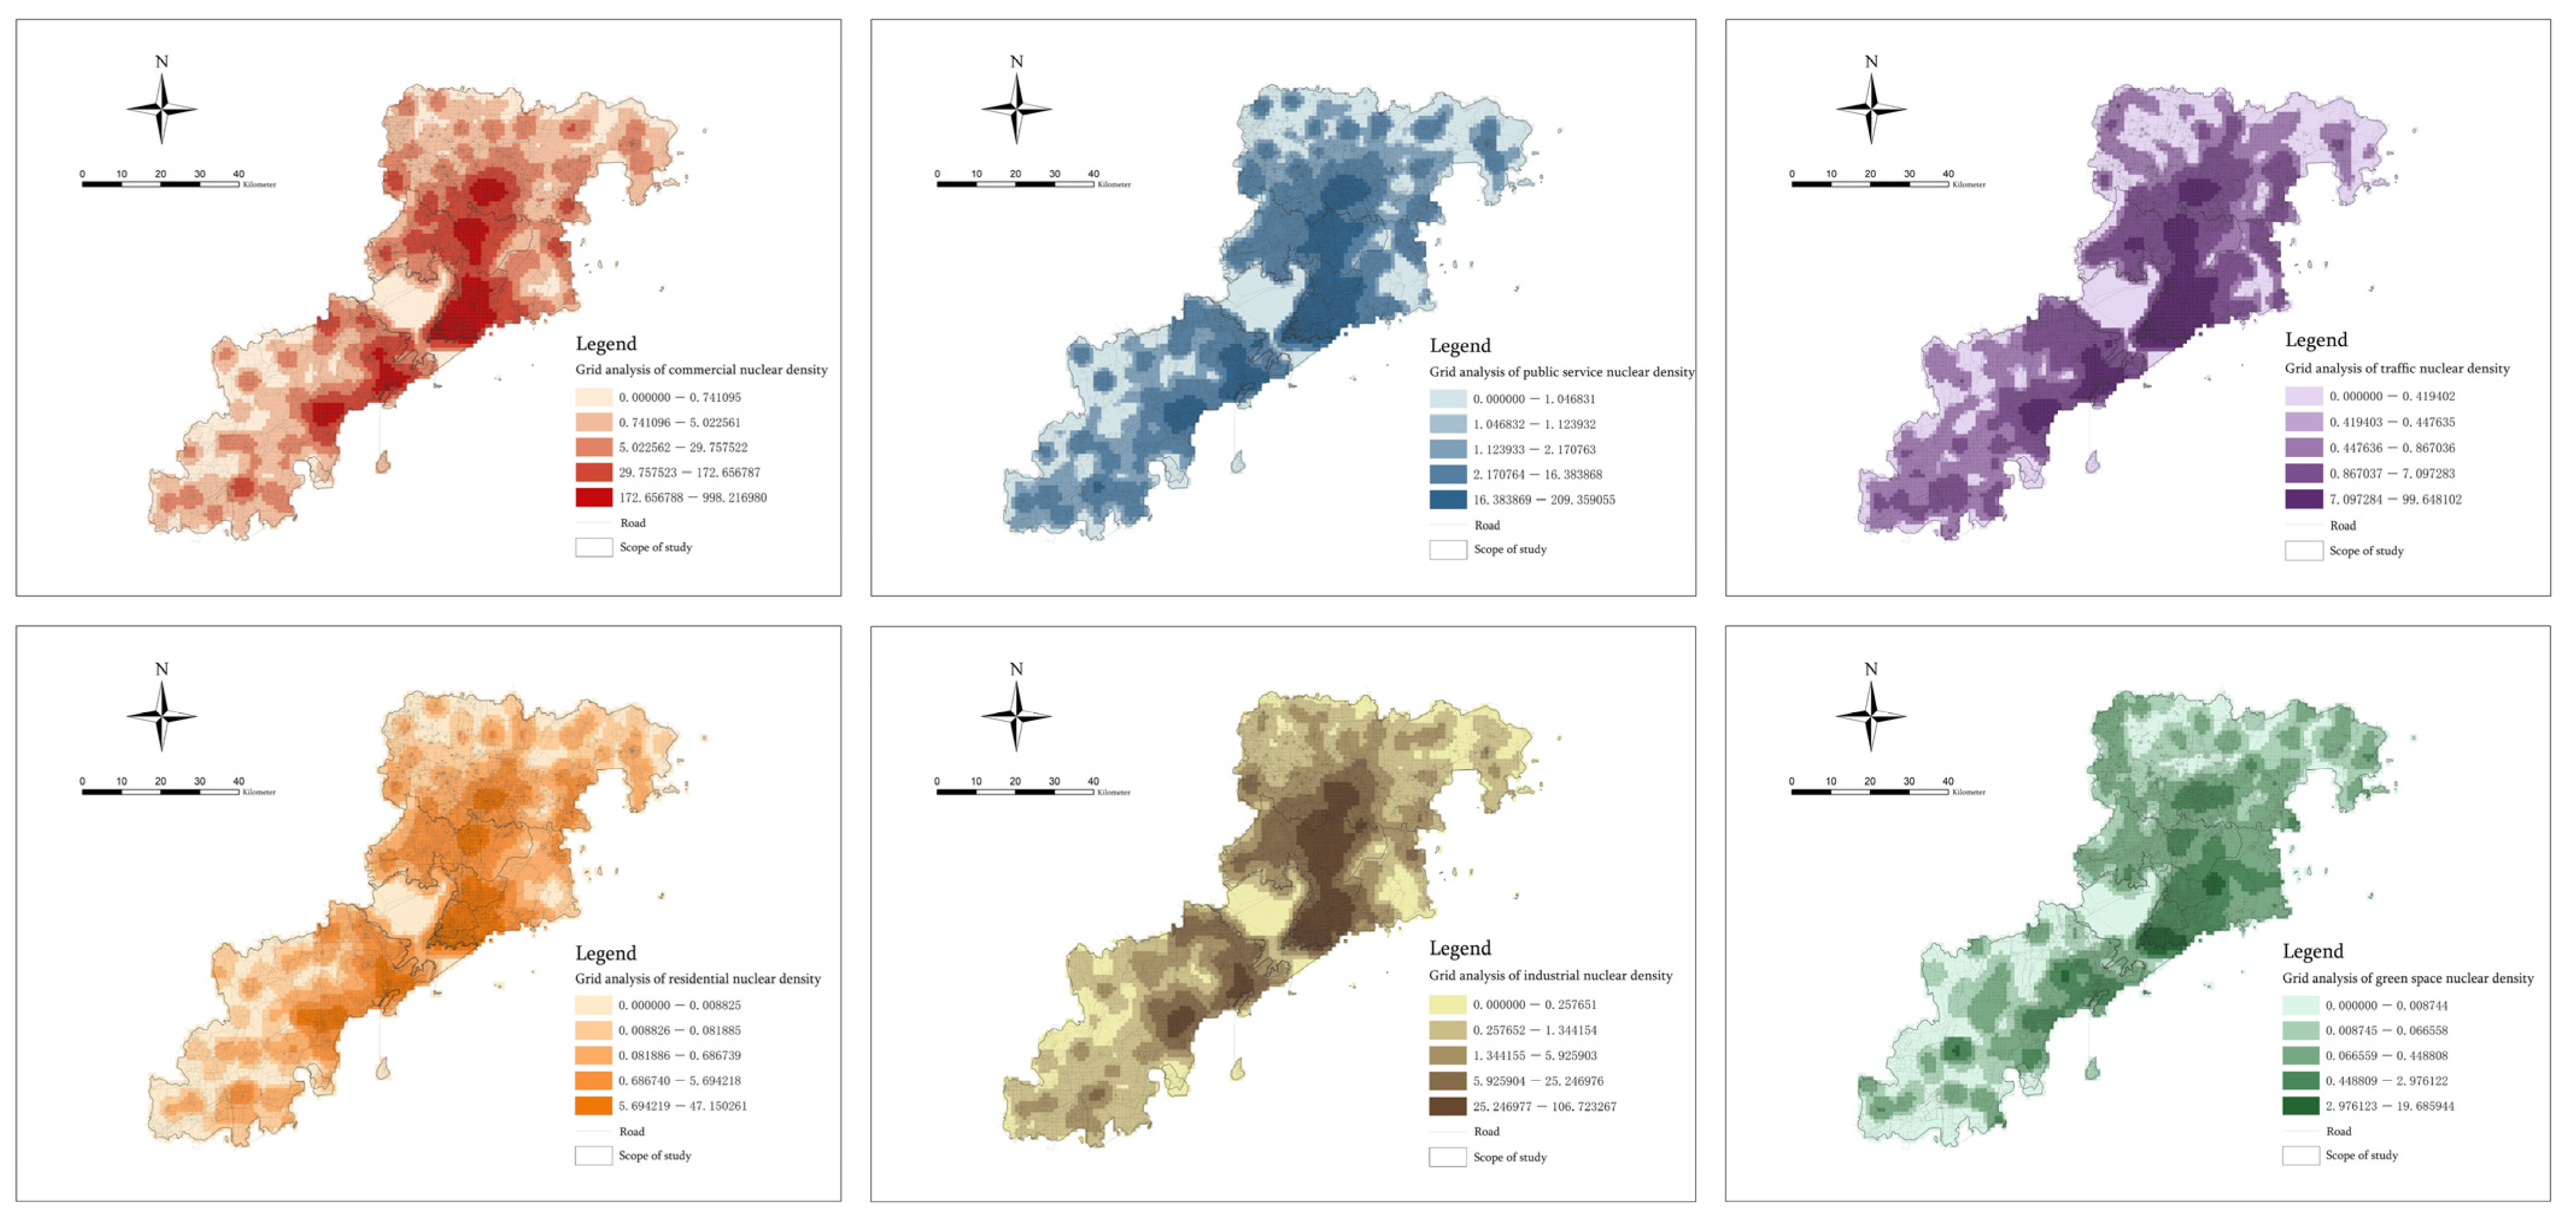
This paper takes Qingdao, a typical city with a population of 5 million, as an example, and takes its seven municipal districts as the research scope to build an indicator system of social activities and material space. We selected the population density grid data, night lighting data, OSM traffic road network data and six types of POI infrastructure data, including the commercial function, residential function, public service function, traffic function, green space function and industrial function, to conduct spatial analysis in ArcGIS (ArcGIS is developed by ESRI, RedLands, CA, USA) and then obtained five indicators including the Population density index, Night light index, Closeness index of roads, Betweenness index of roads and Functional mixed nuclear density index. Finally, we carried out a quantitative assessment of the spatial risk of epidemic disasters through weighted superposition and identified the risk intensity zoning and the spatial structure of different types of epidemic disasters. We used spatial big data to carry out urban spatial exploration and analysis, built a potential disaster risk indicator system for epidemics, conducted quantitative assessment of the spatial risk of epidemic disasters, predicted the regional risk intensity level of the epidemic area, and identified the spatial structure of epidemic disasters. This study can provide an effective reference for the emergency prevention and control policies of relevant government departments.
4. Discussion
Starting with the social activity dimension and the physical space dimension, we selected five indicators, including the population density, night lights, road network centrality, road network traversal and functional mixed nuclear density, to carry out the quantitative assessment of the spatial risk of epidemic disasters. Taking the seven municipal districts of Qingdao as the research scope, we predicted the regional risk level and spatial structure of various epidemic disasters in city areas that are prone to the outbreak and spread of epidemic diseases [
61]. Through the quantitative assessment of the spatial risk of epidemic disaster and the comprehensive analysis of the disaster risk indicators and risk impact degree, we can draw the following conclusions:
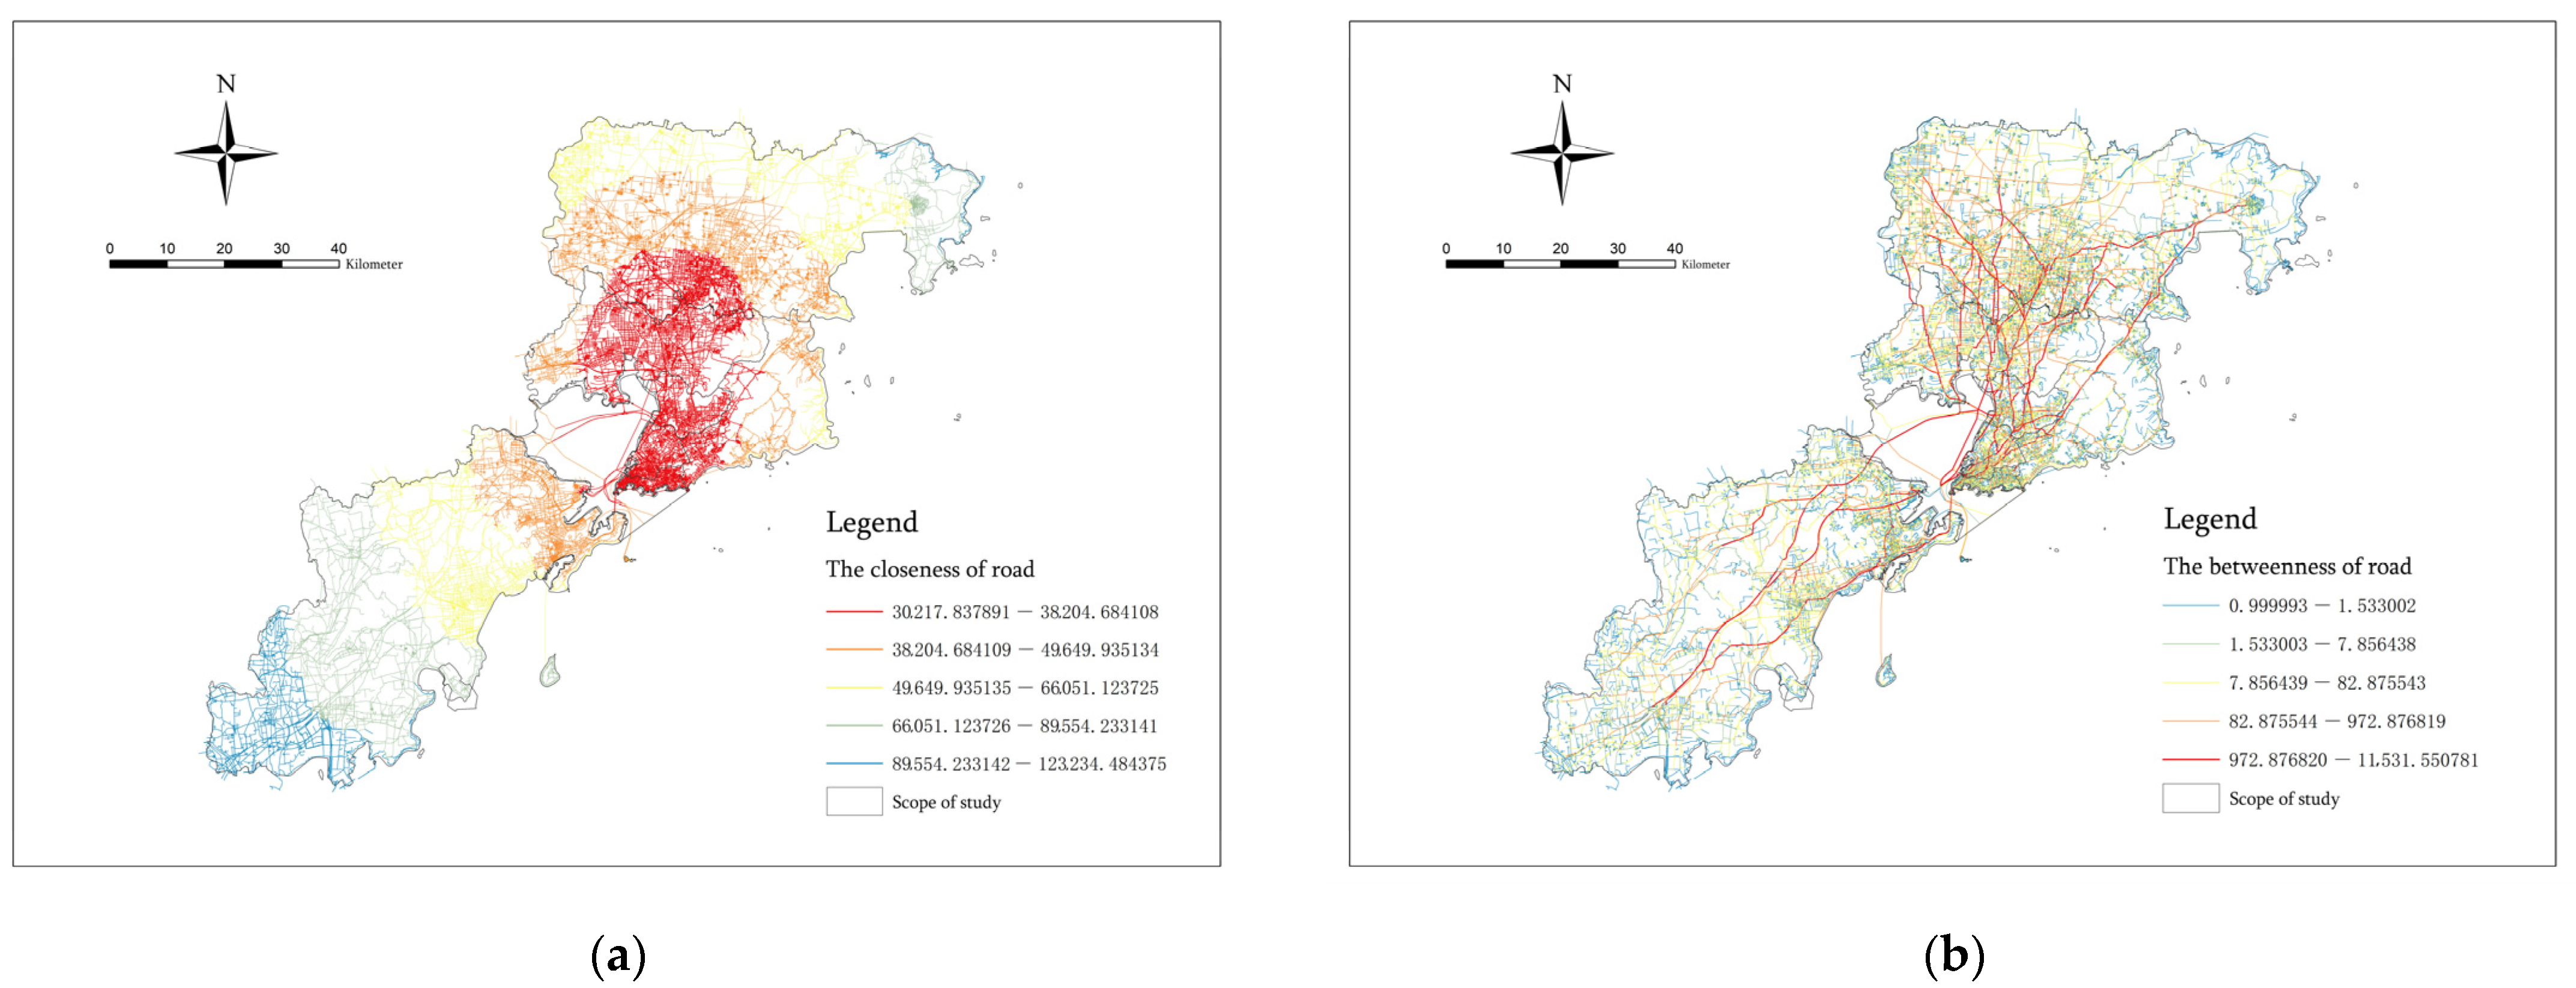
① The influence of the spatial risk factors of epidemic disasters. Roads with a large traffic flow are the main factor leading to the risk of epidemic concentration and play a role in providing regional flow. The populated areas and the areas with a large mixture of infrastructure functions are the secondary factor leading to the risk of epidemic gathering and play a role in determining the gathering place of pedestrian traffic. The areas populated at night play a part in the spread of the epidemic. Their regional liquidity is low, and their vitality is not high. The accessible central area of the road network has little effect on the identification of epidemic risk areas and can only reflect the approximate concentration area in the city.
② The analysis results of different functional sites reflect the high-risk areas for epidemic diseases with different transmission properties. The population density distribution can reflect the high-risk areas for respiratory tract and contact-transmitted infectious diseases. The night light distribution can reflect the high-risk areas for respiratory tract, contact-transmitted and sexually transmitted infectious diseases. The coastal port terminal area can reflect the high-risk area for external imported epidemics and digestive tract infectious diseases. The accessible area in the center of the road network can reflect the high-risk area for respiratory tract and contact-transmitted infectious diseases. Roads with a large traffic flow can reflect the high-risk areas for respiratory tract infectious diseases. The distribution of commercial facilities can reflect the high-risk areas for respiratory-tract-transmitted, contact-transmitted, sexually transmitted and digestive-tract-transmitted infectious diseases. The distribution of public service facilities can reflect the high-risk areas for respiratory tract, contact-transmitted, blood-transmitted and mother-to-child-transmitted infectious diseases. The distribution of transportation and industrial facilities can reflect the high-risk areas for respiratory tract and contact-transmitted infectious diseases. The distribution of residential facilities can reflect the high-risk areas for respiratory tract, contact-transmitted and digestive tract infectious diseases. The distribution of green space facilities can reflect the high-risk areas for respiratory tract, contact-transmitted and insect-borne infectious diseases.
③ Key prevention and control points of the urban space. Catering, shopping, life services, hospitals, schools and transportation facilities are more likely to cause people to gather. The government should conduct centralized prevention and control measures at the distribution points of such functional facilities. At the same time, medical facilities should be established at fixed points in all high-risk areas to ensure the full coverage of services.
④ Risk intensity zoning and spatial structure of epidemic disasters. The risk intensity of epidemic disasters was divided into five levels. Among them, the spatial structure of epidemic disasters, composed of the first-level risk areas, is characterized by “one main area, four secondary areas, one belt and multiple points” and has the characteristics of spatial diffusion. “One main area” is the main risk concentration center of the city; the “four secondary areas” are the four secondary risk concentration centers in the city; “one belt” refers to the coastal risk transmission density zone from the northeast to the southwest; and “multiple points” refer to other local spatial concentration risk points.
In recent years, the academic community has made significant progress in exploring the prevention and control of various pandemics from the perspective of time and space behavioral geography. Cao Zhidong et al. selected nine spatial risk factors, such as the population, roads, hospitals, schools and shopping malls, to conduct spatial correlation analysis for the incidence rate of SARS and determined that these factors are likely to cause an epidemic [
62]. By exploring the distribution and influence of factors affecting the SARS epidemic in Beijing in 2003, Wang Jinfeng et al. determined that the epidemic was mainly concentrated along the traffic line, with spatial diffusion. At the same time, they found that the geographical location, population and hospital distribution were important factors influencing the spatial spread of the epidemic [
63]. This proves that the spatial risk factors selected in this paper are accurate and consistent with the research results of this paper. However, the existing research has basically focused on the analysis of the spatial trajectories of individual cases, studied the impact of virus diffusion caused by population flow through the construction of dynamic models, or predicted the characteristics of epidemic spread through the interactions of social networks [
64,
65]. The current research has only focused on the prediction of individual cases or interpersonal transmission relationships. The precise prediction of the epidemic situation, urban spatial layout structure and regional risks has not been completely solved [
66]. In addition, the urban disaster risk assessment system for epidemic disasters used in resilience construction is not perfect [
67].
Therefore, on the basis of previous studies, we did not study the spatial distribution of epidemic cases. Instead, starting with the spatial distribution of these influencing factors, the authors used the research method of combining the spatial and geographical distributions of different influencing factors to build the risk level zoning and the spatial structure of the epidemic disaster. This paper identified high-risk areas for different types of epidemics and, finally, tested the spatial distribution of the epidemic case data to ensure the accuracy of the model analysis results. This method can be used in the absence of case data, drug intervention and policy prevention and control at the beginning of an epidemic. It is practical, operable and accurate. It is of great research value for the prevention and control of all human-to-human infectious diseases and the identification of risk areas. However, the epidemic risk indicators selected in this study are only related to the population and spatial/geographical distribution of urban built-up areas, and the impact factors affecting an epidemic are not limited to those used in this article. Therefore, there are certain limitations. In the future, the authors will study ways to combine epidemic impact factors studied in all fields with spatial geographic analysis and improve the quantitative assessment system of the epidemic disaster spatial risk. In this way, we could continue to promote significant progress in the application of spatial geographic analysis in the field of urban public security prevention and control using spatial big data.
5. Conclusions
With the prevalence of various kinds of interpersonal epidemics worldwide, the prevention and control of sudden public health events have become an important problem that needs to be solved. Therefore, the quantitative risk assessment of epidemic disasters in regard to “disaster resilience” needs to be improved. In this context, this paper proposed a new idea: to combine the spatial prediction method of the urban agglomeration risk with the quantitative assessment of the epidemic disaster risk using spatial big data. This study comprehensively assessed and considered the risk factors for epidemic disasters and the scale of the risk impact, assisted the relevant urban planning departments in taking measures for emergency prevention and control, and curbed the further spread of the epidemic from the source in a timely manner. Taking the seven municipal districts of Qingdao as the research scope, we selected population density grid data, night light data, OSM traffic network data and POI infrastructure data for spatial analysis in ArcGIS and constructed the Population density index, Night light index, Closeness index of roads, Betweenness index of roads and Functional mixed nuclear density index, respectively. Finally, we calculated the weights of the five indicators using the entropy method, carried out factor-weighted superposition analysis, and, finally, obtained five epidemic disaster risk grade divisions and a disaster spatial structure. The results are as follows: ① The roads with a large traffic flow are most likely to lead to the risk of urban spatial agglomeration, and the populated areas and areas with a large mixture of infrastructure functions are also important factors causing the risk of epidemic agglomeration. ② The distribution of the population during the day and night, the road network that reaches the central area and the roads with a high passing potential, as well as different functional places, such as those for commerce, public services, transportation, residence, industry and green spaces, can reflect high-risk areas for epidemic diseases with different transmission properties. ③ Catering, shopping, life services, hospitals, schools and transportation functional places are more likely to cause crowd gathering. The government should conduct centralized prevention and control at the distribution points of such functional facilities. At the same time, medical facilities should be established at fixed points in all high-risk areas to ensure the full coverage of services. ④ The risk intensity of epidemic disasters is divided into five risk grade areas. Among them, the spatial structure of epidemic disasters, composed of the first-level risk areas, is characterized by “one main area, four secondary areas, one belt and multiple points” and has the characteristics of spatial diffusion.
In general, the quantitative assessment of the spatial risk of epidemic disasters based on spatial big data can be used to test the risk factors that lead to the spread of epidemic disasters, predict the scope of their aggregation risk levels, and build the spatial structure of epidemic disasters. It is helpful for accurately locating the risk areas and epidemic transmission routes in megacities that are prone to outbreaks or cause epidemic transmission. This could help the relevant personnel to contain the epidemic in a timely manner from the early stage of the spread of the epidemic and take appropriate prevention and control optimization measures for the risk factors of the city. The paper improves the disaster risk assessment system used in the construction of resilient cities, taking the risk assessment of public health events as its focus. However, although the five indicators assessed in this paper can accurately reflect the location and spatial structure of the key risk areas for the epidemic outbreak, they still need to be further deepened and improved. In the future, the authors will continue to study ways to combine more indicators of the socio-economic dimension, physical space dimension and natural meteorological environment dimension with spatial geographical analysis to build a comprehensive and more refined indicator evaluation system, thus rendering the regional prediction and analysis results of the risk grade more accurate. The authors will also continue to study issues such as urban resilience after the outbreak of human-to-human infectious diseases so as to strengthen the construction of resilient cities.


