
Impact of COVID-19 Preventative Measures on Otolaryngology in Taiwan: A Nationwide Study
 , ,
, ,  and
and
Abstract
:1. Introduction
2. Materials and Methods
2.1. Data Source and Ethical Consideration
2.2. Study Population and Disease Grouping
2.3. Statistics
3. Results
4. Discussion
5. Conclusions
Author Contributions
Funding
Institutional Review Board Statement
Informed Consent Statement
Data Availability Statement
Conflicts of Interest
Appendix A

| Diagnosis | ICD Code |
|---|---|
| 1. Acute Gastroenteritis | ICD-10-CM: A04, A05, A08, A09 |
| 2. Malignant neoplasm of head and neck | ICD-10-CM: C00-14, C30-32, C43, C49.0, C72.2, C72.4, C76.0, C81-86 |
| 3. Carcinoma in situ | ICD-10-CM: D00, D02, D03 |
| 4. Benign neoplasm | ICD-10-CM: D10-11, D14, D17-18, D21, D23, D37-38 |
| 5. Thyroid disease | ICD-10-CM: C73, D34, D44.0, E04-06 |
| 6. Headache | ICD-10-CM: G43-44, R51 |
| 7. Sleep disorder | ICD-10-CM: F51, G47 |
| 8. Cranial nerve disease | ICD-10-CM: G50-52 |
| 9. Lacrimal system disorder | ICD-10-CM: H04 |
| 10. Otitis externa | ICD-10-CM: H60.0-60.3, H60.5-60.6, H60.8-60.9 |
| 11. Other disease of external ear | ICD-10-CM: H60.4, H61.0-61.3, H61.8-61.9 |
| 12. Otitis media | ICD-10-CM: H65.0-65.4, H66, H92, H70 |
| 13. Eustachian tube disorder | ICD-10-CM: H68-69 |
| 14. Other disease of middle ear | ICD-10-CM: H71-74, H80 |
| 15. Vertigo | ICD-10-CM: H81-83, R42 |
| 16. Hearing loss and tinnitus | ICD-10-CM: H90-91, H93 |
| 17. Upper airway infection | ICD-10-CM: B27, B30.2, J00-06, J09-11, J36, J39, R05-07, R50 |
| 18. Lower airway infection | ICD-10-CM: J12-16, J18, J20-22 |
| 19. Chronic rhino sinusitis | ICD-10-CM: J30-34, R09.81-09.82 |
| 20. Chronic laryngopharyngeal disorder | ICD-10-CM: J35, J37, R13 |
| 21. Voice and speech disorder | ICD-10-CM: F80, J38, R47, R49 |
| 22. Chronic lower airway disorder | ICD-10-CM: J40, J42-45, J47 |
| 23. Oral cavity and salivary gland disorder | ICD-10-CM: B37.0, B37.83, K05, K09, K11-14 |
| 24. Gastroesophageal inflammation and ulcer | ICD-10-CM: K20-21, K25-29 |
| 25. Skin/subcutaneous tissue/lymphatic disorder | ICD-10-CM: B00, B02, B07, L02-04, L20, L72, R22, R59 |
| 26. Congenital deformity | ICD-10-CM: Q16-18, Q30-32, Q35-38 |
| 27. Trauma and fracture of head, face and neck | ICD-10-CM: S00.3-00.5, S00.8-00.9, S01.2-01.5, S01.8-01.9, S02-03, S04.5-04.6, S08.1, S08.8, S09.2-09.3, S09.9, S10, S11.01, S11.03, S11.1-11.2, S11.8-11.9, S17, S19 |
| 28. Foreign body of head and neck | ICD-10-CM: T16, T17.0-17.3, T18.0 |
| 29. Burn/corrosion/frostbite of head, face and neck | ICD-10-CM: T20, T27, T28.0, T28.41, T28.5, T28.91, T33.0-33.1, T34.0-34.1, T49.6 |
| 30. Other unspecified disease | ICD-10-CM: M26.6, M35.0, R04, R43, Z01.1, Z96.2 |
| Type Code | Diseases |
|---|---|
| TYPE01 | Acute gastroenteritis |
| TYPE02 | Malignant neoplasm of head and neck |
| TYPE03 | Carcinoma in situ |
| TYPE04 | Benign neoplasm |
| TYPE05 | Thyroid disease |
| TYPE06 | Headache |
| TYPE07 | Sleep disorder |
| TYPE08 | Cranial nerve disease |
| TYPE09 | Lacrimal system disorder |
| TYPE10 | Otitis externa |
| TYPE11 | Other disease of external ear |
| TYPE12 | Otitis media |
| TYPE13 | Eustachian tube disorder |
| TYPE14 | Other disease of middle ear |
| TYPE15 | Vertigo |
| TYPE16 | Hearing loss and tinnitus |
| TYPE17 | Upper airway infection |
| TYPE18 | Lower airway infection |
| TYPE19 | Chronic rhinosinusitis |
| TYPE20 | Headache |
| TYPE21 | Voice and speech disorder |
| TYPE22 | Chronic lower airway disorder |
| TYPE23 | Oral cavity and salivary gland disorder |
| TYPE24 | Gastroesophageal inflammation and ulcer |
| TYPE25 | Skin/subcutaneous tissue/lymphatic disorder |
| TYPE26 | Congenital deformity |
| TYPE27 | Trauma and fracture of head, face and neck |
| TYPE28 | Foreign body of head and neck |
| TYPE29 | Burn/corrosion/frostbite of head, face and neck |
| TYPE30 | Other unspecified disease |
|
Outpatient Diagnoses Grouping/ Monthly Comparison |
2018 Growth Rate (%) |
2019 Growth Rate (%) |
2020 Growth Rate (%) | 2018 vs. 2019 | 2019 vs. 2020 |
|---|---|---|---|---|---|
| Acute gastroenteritis | |||||
| January to February | −4.5 | −5.6 | −19.0 | <0.001 | <0.001 |
| February to March | 14.6 | 12.4 | −14.2 | <0.001 | |
| March to April | −26.2 | −15.3 | −21.6 | <0.001 | <0.001 |
| April to May | −7.5 | 1.0 | −16.9 | ||
| May to June | −5.2 | −8.5 | 10.3 | <0.001 | |
| June to July | 14.6 | 2.2 | −2.2 | <0.001 | |
| July to August | 7.6 | 0.1 | 18.3 | <0.001 | <0.001 |
| August to September | 11.5 | 15.4 | 14.5 | <0.001 | 0.01 |
| September to October | 2.6 | 0.3 | 16.6 | <0.001 | <0.001 |
| October to November | −13.1 | −5.8 | −0.7 | <0.001 | <0.001 |
| November to December | 0.3 | 10.4 | 2.8 | <0.001 | <0.001 |
| Otitis media | |||||
| January to February | −16.3 | −16.7 | −18.0 | 0.163 | <0.001 |
| February to March | 26.4 | 21.6 | −4.8 | <0.001 | |
| March to April | −5.3 | 3.4 | −5.8 | ||
| April to May | 1.3 | 2.0 | 9.8 | <0.001 | <0.001 |
| May to June | −7.7 | −9.6 | 9.3 | <0.001 | |
| June to July | 4.7 | 5.9 | 3.8 | <0.001 | <0.001 |
| July to August | 4.3 | −1.2 | 1.2 | ||
| August to September | −0.3 | −0.5 | 1.7 | <0.001 | |
| September to October | 0.4 | 1.9 | 2.2 | <0.001 | <0.001 |
| October to November | −5.1 | −8.2 | 4.0 | <0.001 | |
| November to December | 0.8 | 1.0 | −1.3 | <0.001 | |
| Upper airway infection | |||||
| January to February | −12.4 | −18.0 | −32.0 | <0.001 | <0.001 |
| February to March | 12.5 | 9.3 | −22.9 | <0.001 | |
| March to April | −17.4 | −8.7 | −11.6 | <0.001 | <0.001 |
| April to May | −13.9 | −2.3 | −26.1 | <0.001 | <0.001 |
| May to June | −11.8 | −12.3 | 23.7 | <0.001 | |
| June to July | 3.3 | −1.8 | 4.6 | ||
| July to August | 4.7 | −2.4 | 17.9 | ||
| August to September | 7.6 | 10.8 | 5.7 | <0.001 | <0.001 |
| September to October | 11.0 | 8.7 | 6.4 | <0.001 | <0.001 |
| October to November | −3.0 | 5.2 | 1.3 | <0.001 | |
| November to December | 18.2 | 13.1 | 4.9 | <0.001 | <0.001 |
| Lower airway infection | |||||
| January to February | −11.0 | −15.9 | −34.5 | <0.001 | <0.001 |
| February to March | 12.2 | 8.8 | −28.9 | <0.001 | |
| March to April | −16.9 | −8.6 | −14.6 | <0.001 | <0.001 |
| April to May | −17.2 | −3.4 | −30.2 | <0.001 | <0.001 |
| May to June | −13.7 | −13.7 | 27.2 | 0.728 | |
| June to July | 1.9 | −3.4 | 4.9 | ||
| July to August | 5.0 | −2.4 | 23.8 | ||
| August to September | 9.4 | 11.4 | 6.7 | <0.001 | <0.001 |
| September to October | 10.1 | 8.8 | 7.4 | <0.001 | <0.001 |
| October to November | −1.3 | 6.3 | 4.8 | <0.001 | |
| November to December | 19.3 | 14.7 | 6.1 | <0.001 | <0.001 |
| Chronic rhinosinusitis | |||||
| January to February | −14.3 | −22.1 | −22.0 | <0.001 | 0.474 |
| February to March | 19.0 | 14.9 | −12.1 | <0.001 | |
| March to April | −13.5 | −7.3 | −2.5 | <0.001 | <0.001 |
| April to May | −10.9 | −3.1 | −18.2 | <0.001 | <0.001 |
| May to June | −12.1 | −11.8 | 13.4 | <0.001 | |
| June to July | 5.5 | 2.3 | 3.3 | <0.001 | <0.001 |
| July to August | 1.8 | −2.7 | 6.5 | ||
| August to September | 2.7 | 6.0 | 3.5 | <0.001 | <0.001 |
| September to October | 16.9 | 11.7 | 6.7 | <0.001 | <0.001 |
| October to November | −3.2 | 5.5 | 2.8 | <0.001 | |
| November to December | 18.4 | 7.5 | 6.3 | <0.001 | <0.001 |
| Voice and speech disorder | |||||
| January to February | −16.5 | −20.2 | −31.2 | <0.001 | <0.001 |
| February to March | 24.5 | 15.1 | −19.0 | <0.001 | |
| March to April | −9.9 | −0.8 | −8.5 | <0.001 | <0.001 |
| April to May | −3.4 | −1.3 | 1.3 | <0.001 | |
| May to June | −14.9 | −11.0 | 19.6 | <0.001 | |
| June to July | 0.8 | 0.9 | 9.7 | 0.012 | <0.001 |
| July to August | 0.9 | −3.0 | 9.8 | ||
| August to September | −1.2 | 3.2 | 4.0 | <0.001 | |
| September to October | 9.9 | 8.5 | −1.9 | <0.001 | |
| October to November | 1.2 | 1.4 | 1.1 | 0.023 | <0.001 |
| November to December | 18.1 | 7.9 | 2.7 | <0.001 | <0.001 |
| Chronic lower airway disorder | |||||
| January to February | −11.9 | −18.7 | −23.2 | <0.001 | <0.001 |
| February to March | 16.8 | 17.7 | −6.4 | 0.008 | |
| March to April | −14.3 | −6.3 | −11.6 | <0.001 | <0.001 |
| April to May | −15.2 | −5.7 | −25.6 | <0.001 | <0.001 |
| May to June | −13.1 | −13.6 | 4.4 | 0.072 | |
| June to July | 0.1 | −3.2 | 1.2 | ||
| July to August | 1.4 | −2.6 | 10.8 | ||
| August to September | 5.0 | 11.1 | 7.1 | <0.001 | <0.001 |
| September to October | 18.7 | 10.3 | 8.7 | <0.001 | <0.001 |
| October to November | 0.6 | 4.9 | 5.3 | <0.001 | 0.028 |
| November to December | 15.7 | 12.2 | 9.9 | <0.001 | <0.001 |
|
Unexpected Inpatient Diagnoses/ Monthly Comparison |
2018 Growth Rate (%) |
2019 Growth Rate (%) |
2020 Growth Rate (%) | 2018 vs. 2019 | 2019 vs. 2020 |
|---|---|---|---|---|---|
| Pneumonitis due to inhalation of food and vomit | |||||
| January to February | −47.8 | 0.0 | 71.4 | ||
| February to March | 50.0 | 11.8 | 8.3 | 0.054 | 0.777 |
| March to April | 5.6 | −52.6 | −23.1 | 0.198 | |
| April to May | −21.1 | −11.1 | −20.0 | 0.561 | 0.626 |
| May to June | 66.7 | 137.5 | 25.0 | 0.09 | 0.013 |
| June to July | −28.0 | 5.3 | 0.0 | ||
| July to August | 33.3 | 0.0 | 70.0 | ||
| August to September | −12.5 | −25.0 | −17.6 | 0.333 | 0.632 |
| September to October | −28.6 | 20.0 | −14.3 | ||
| October to November | 13.3 | −33.3 | 41.7 | ||
| November to December | −41.2 | 25.0 | −41.2 | ||
| Acute pharyngitis, unspecified | |||||
| January to February | −23.5 | −11.1 | 25.0 | 0.492 | |
| February to March | 0.0 | 50.0 | 0.0 | ||
| March to April | −15.4 | 25.0 | −20.0 | ||
| April to May | 9.1 | 6.7 | 50.0 | 0.826 | 0.034 |
| May to June | 8.3 | −37.5 | −41.7 | 0.862 | |
| June to July | −38.5 | 80.0 | 28.6 | 0.174 | |
| July to August | 112.5 | −50.0 | 0.0 | ||
| August to September | −58.8 | 11.1 | 77.8 | 0.034 | |
| September to October | 42.9 | 80.0 | −37.5 | 0.349 | |
| October to November | 30.0 | −5.6 | 10.0 | ||
| November to December | 0.0 | 0.0 | −9.1 | ||
| Acute sinusitis, unspecified | |||||
| January to February | −43.5 | −52.6 | 0.0 | 0.669 | |
| February to March | 69.2 | 111.1 | −62.5 | 0.299 | |
| March to April | 45.5 | 10.5 | −50.0 | 0.039 | |
| April to May | −34.4 | −28.6 | 233.3 | 0.715 | |
| May to June | −4.8 | 46.7 | −60.0 | ||
| June to July | 5.0 | −4.5 | 150.0 | ||
| July to August | −23.8 | −9.5 | 70.0 | 0.257 | |
| August to September | 6.3 | −5.3 | −70.6 | 0.001 | |
| September to October | 0.0 | 11.1 | 180.0 | <0.001 | |
| October to November | 11.8 | −40.0 | −14.3 | 0.174 | |
| November to December | −10.5 | 33.3 | 33.3 | 1 | |
| Supraglottitis, unspecified, without obstruction | |||||
| January to February | −16.7 | 20.0 | −7.7 | ||
| February to March | −20.0 | −25.0 | −50.0 | 0.806 | 0.317 |
| March to April | 75.0 | 0.0 | −33.3 | 0.009 | 0.083 |
| April to May | −7.1 | 122.2 | 175.0 | 0.455 | |
| May to June | 38.5 | −5.0 | −9.1 | 0.668 | |
| June to July | −27.8 | −15.8 | 10.0 | 0.433 | |
| July to August | 23.1 | −18.8 | 18.2 | ||
| August to September | −43.8 | 53.8 | 15.4 | 0.096 | |
| September to October | −11.1 | −30.0 | −26.7 | 0.338 | 0.855 |
| October to November | 62.5 | −21.4 | 18.2 | ||
| November to December | 15.4 | 36.4 | −7.7 | 0.306 | |
| Acute epiglottitis without obstruction | |||||
| January to February | 53.8 | −7.3 | −11.8 | 0.53 | |
| February to March | −5.0 | 34.2 | −10.0 | ||
| March to April | −5.3 | −2.0 | −40.7 | 0.401 | <0.001 |
| April to May | 13.9 | 26.0 | 175.0 | 0.226 | <0.001 |
| May to June | 12.2 | −42.9 | −6.8 | <0.001 | |
| June to July | −4.3 | −2.8 | −29.3 | 0.712 | 0.005 |
| July to August | 9.1 | 34.3 | 58.6 | 0.013 | 0.15 |
| August to September | −37.5 | 0.0 | −32.6 | ||
| September to October | 23.3 | −8.5 | 22.6 | ||
| October to November | 16.2 | −30.2 | −34.2 | 0.752 | |
| November to December | 4.7 | 13.3 | 36.0 | 0.203 | 0.085 |
References
- Zhao, C.; Viana, A., Jr.; Wang, Y.; Wei, H.Q.; Yan, A.H.; Capasso, R. Otolaryngology during COVID-19: Preventive care and precautionary measures. Am. J. Otolaryngol.-Head Neck Med. Surg. 2020, 41, 102508. [Google Scholar] [CrossRef]
- Yeh, M.J.; Cheng, Y. Policies Tackling the COVID-19 Pandemic: A Sociopolitical Perspective from Taiwan. Health Secur. 2020, 18, 427–434. [Google Scholar] [CrossRef] [PubMed]
- Chen, Y.Y.; Wu, K.C.C.; Gau, S.S.F. Mental health impact of the COVID-19 pandemic in Taiwan. J. Formos. Med. Assoc. 2021, 120, 1421–1423. [Google Scholar] [CrossRef] [PubMed]
- Anagiotos, A.; Petrikkos, G. Otolaryngology in the COVID-19 pandemic era: The impact on our clinical practice. Eur. Arch. Oto-Rhino-Laryngol. 2021, 278, 629–636. [Google Scholar] [CrossRef] [PubMed]
- Taiwan Centers for Disease Control CECC Confirms 2 More Imported COVID-19 Cases; Cases Arrive in Taiwan from the UK and India. 2020. Available online: https://www.cdc.gov.tw/En/Bulletin/Detail/-ShMvyrZbj9DKWNTBPCyxQ?typeid=158 (accessed on 30 December 2022).
- Chen, C.C.; Tseng, C.Y.; Choi, W.M.; Lee, Y.C.; Su, T.H.; Hsieh, C.Y.; Chang, C.M.; Weng, S.L.; Liu, P.H.; Tai, Y.L.; et al. Taiwan Government-Guided Strategies Contributed to Combating and Controlling COVID-19 Pandemic. Front. Public Health 2020, 8, 1–7. [Google Scholar] [CrossRef] [PubMed]
- Yen, M.Y.; Yen, Y.F.; Chen, S.Y.; Lee, T.I.; Huang, K.H.; Chan, T.C.; Tung, T.H.; Hsu, L.Y.; Chiu, T.Y.; Hsueh, P.R.; et al. Learning from the past: Taiwan’s responses to COVID-19 versus SARS. Int. J. Infect. Dis. 2021, 110, 469–478. [Google Scholar] [CrossRef]
- Chen, S.C. Taiwan’s experience in fighting COVID-19. Nat. Immunol. 2021, 22, 393–394. [Google Scholar] [CrossRef]
- Jian, S.W.; Kao, C.T.; Chang, Y.C.; Chen, P.F.; Liu, D.P. Risk assessment for COVID-19 pandemic in Taiwan. Int. J. Infect. Dis. 2021, 104, 746–751. [Google Scholar] [CrossRef]
- Lin, S.F.; Lai, C.C.; Chao, C.M.; Tang, H.J. Impact of COVID-19 preventative measures on dengue infections in Taiwan. J. Med. Virol. 2021, 93, 4063–4064. [Google Scholar] [CrossRef]
- Lai, C.C.; Yu, W.L. The COVID-19 pandemic and tuberculosis in Taiwan. J. Infect. 2020, 81, e159–e161. [Google Scholar] [CrossRef]
- MacDonald, I.; Hsu, J.L. Epidemiological observations on breaking COVID-19 transmission: From the experience of Taiwan. J Epidemiol. Community Health 2021, 75, 809–812. [Google Scholar] [CrossRef] [PubMed]
- Chatterji, P.; Li, Y. Effects of the COVID-19 Pandemic on Outpatient Providers in the United States. Med Care 2021, 59, 58–61. [Google Scholar] [CrossRef] [PubMed]
- Patt, D.; Gordan, L.; Diaz, M.; Okon, T.; Grady, L.; Harmison, M.; Markward, N.; Sullivan, M.; Peng, J.; Zhou, A. Impact of COVID-19 on Cancer Care: How the Pandemic Is Delaying Cancer Diagnosis and Treatment for American Seniors. JCO Clin. Cancer Inform. 2020, 4, 1059–1071. [Google Scholar] [CrossRef]
- Muschol, J.; Gissel, C. COVID-19 pandemic and waiting times in outpatient specialist care in Germany: An empirical analysis. BMC Health Serv. Res. 2021, 21, 1076. [Google Scholar] [CrossRef]
- Hsiao, F.-Y.; Huang, Y.-T.; Huang, W.-F. Using Taiwan’s National Health Insurance Research Databases for pharmacoepidemiology research. J. Food Drug Anal. 2007, 15, 99–108. [Google Scholar] [CrossRef]
- Xia, S.; Zhu, Z.; Guan, W.J.; Xie, Y.Q.; An, J.Y.; Peng, T.; Chen, R.C.; Zheng, J.P. Correlation between upper and lower airway inflammations in patients with combined allergic rhinitis and asthma syndrome: A comparison of patients initially presenting with allergic rhinitis and those initially presenting with asthma. Exp. Med. 2018, 15, 1761–1767. [Google Scholar] [CrossRef]
- Majumder, J.; Minko, T. Recent Developments on Therapeutic and Diagnostic Approaches for COVID-19. AAPS J. 2021, 23, 14. [Google Scholar] [CrossRef]
- Yamamoto, K. Adverse effects of COVID-19 vaccines and measures to prevent them. Virol. J. 2022, 19, 1–3. [Google Scholar] [CrossRef]
- Elibol, E. Otolaryngological symptoms in COVID-19. Eur. Arch. Oto-Rhino-Laryngol. 2021, 278, 1233–1236. [Google Scholar] [CrossRef]
- Medeiros, K.S.; Costa, A.P.F.; Sarmento, A.C.A.; Freitas, C.L.; Gonçalves, A.K. Side effects of COVID-19 vaccines: A systematic review and meta-analysis protocol of randomised trials. BMJ Open 2022, 12, 1–6. [Google Scholar] [CrossRef]
- Wichova, H.; Miller, M.E.; Derebery, M.J. Otologic Manifestations After COVID-19 Vaccination: The House Ear Clinic Experience. Otol. Neurotol. 2021, 42, e1213–e1218. [Google Scholar] [CrossRef] [PubMed]
- Skarzynska, M.B.; Matusiak, M.; Skarzynski, P.H. Adverse Audio-Vestibular Effects of Drugs and Vaccines Used in the Treatment and Prevention of COVID-19: A Review. Audiol. Res. 2022, 12, 224–248. [Google Scholar] [CrossRef] [PubMed]


| Variable | Categories | 2018 (n) | 2019 (n) | 2020 (n) | p | Missing |
|---|---|---|---|---|---|---|
| Total Cases | 73,597 | 76,634 | 70,633 | |||
| Gender | Female | 26,654 (37.0%) | 27,903 (37.2%) | 25,609 (37.1%) | 0.862 | 2.1 |
| Male | 45,333 (63.0%) | 47,192 (62.8%) | 43,499 (62.9%) | |||
| Age Group | 0–18 | 4657 (6.3%) | 4992 (6.5%) | 3646 (5.2%) | <0.001 | 0.0 |
| 19–64 | 56,891 (77.3%) | 58,660 (76.5%) | 54,523 (77.2%) | |||
| 65+ | 12,049 (16.4%) | 12,982 (16.9%) | 12,464 (17.6%) | |||
| Area | North | 33,099 (47.6%) | 33,938 (47.1%) | 30,882 (46.2%) | <0.001 | 5.7 |
| Central | 18,716 (26.9%) | 20,206 (28.0%) | 18,668 (28.0%) | |||
| South | 15,806 (22.8%) | 16,042 (22.3%) | 15,412 (23.1%) | |||
| East | 1670 (2.4%) | 1674 (2.3%) | 1584 (2.4%) | |||
| Other | 185 (0.3%) | 209 (0.3%) | 237 (0.4%) | |||
| Salary (NTD) | 0 | 323 (0.4%) | 472 (0.6%) | 284 (0.4%) | <0.001 | 0.0 |
| 1–15,840 | 15,302 (20.8%) | 15,598 (20.4%) | 14,502 (20.5%) | |||
| 15,840–25,000 | 28,127 (38.2%) | 28,187 (36.8%) | 25,610 (36.3%) | |||
| >25,000 | 29,845 (40.6%) | 32,377 (42.2%) | 30,237 (42.8%) |
| Categories | 2018 (n) | 2019 (n) | 2020 (n) | p | Missing | |
|---|---|---|---|---|---|---|
| Total Cases | 9,367,036 | 9,513,204 | 7,886,413 | |||
| Gender | Female | 4,906,173 (53.2%) | 4,972,284 (53.1%) | 4,118,768 (53.1%) | <0.001 | 1.6 |
| Male | 4,317,163 (46.8%) | 4,390,035 (46.9%) | 3,636,311 (46.9%) | |||
| Age Group | 0–18 | 1,816,322 (19.4%) | 1,790,043 (18.8%) | 1,485,620 (18.8%) | <0.001 | 0.0 |
| 19–64 | 6,380,756 (68.1%) | 6,484,905 (68.2%) | 5,282,535 (67.0%) | |||
| 65+ | 1,169,958 (12.5%) | 1,238,256 (13.0%) | 1,118,258 (14.2%) | |||
| Area | North | 4,594,882 (52.5%) | 4,683,105 (52.8%) | 3,882,939 (52.6%) | <0.001 | 6.6 |
| Central | 1,947,923 (22.3%) | 1,968,899 (22.2%) | 1,641,972 (22.2%) | |||
| South | 160,205 (1.8%) | 160,975 (1.8%) | 137,763 (1.9%) | |||
| East | 2,022,765 (23.1%) | 2,037,347 (23.0%) | 1,706,731 (23.1%) | |||
| Other | 19,694 (0.2%) | 20,306 (0.2%) | 16,837 (0.2%) | |||
| Salary (NTD) | 0 | 55,295 (0.6%) | 75,864 (0.8%) | 43,404 (0.6%) | <0.001 | 0.0 |
| 1–15,840 | 1,613,030 (17.2%) | 1,636,515 (17.2%) | 1,367,257 (17.3%) | |||
| 15,840–25,000 | 3,487,570 (37.2%) | 3,371,047 (35.4%) | 2,716,655 (34.4%) | |||
| >25,000 | 4,211,141 (45.0%) | 4,429,778 (46.6%) | 3,759,097 (47.7%) |
| Diagnoses Group |
2018 (n) |
2019 (n) |
2020 (n) |
Odds Ratio in 2018 (95% CI) |
Odds Ratio in 2020 (95% CI) |
|---|---|---|---|---|---|
| Increase persistently from 2019 to 2020 | |||||
| Thyroid disease | 31,473 | 35,059 | 38,295 | 0.900 (0.887, 0.914) * | 1.094 (1.078, 1.110) * |
| Lacrimal system disorder | 1078 | 1140 | 1239 | 0.949 (0.873, 1.031) | 1.088 (1.004, 1.180) * |
| No difference from 2019 to 2020 | |||||
| Malignant neoplasm of head and neck | 56,359 | 57,279 | 56,869 | 0.987 (0.975, 0.998) * | 0.994 (0.983, 1.006) |
| Trauma and fracture of head, face and neck | 17,585 | 16,782 | 16,841 | 1.051 (1.029, 1.074) * | 1.005 (0.984, 1.027) |
| Cranial nerve disease | 6797 | 6192 | 6272 | 1.101 (1.064, 1.140) * | 1.014 (0.979, 1.051) |
| Carcinoma in situ | 184 | 229 | 240 | 0.806 (0.663, 0.978) * | 1.049 (0.876, 1.258) |
| Burn/corrosion/frostbite of head, face and neck | 123 | 116 | 123 | 1.063 (0.825, 1.372) | 1.062 (0.824, 1.370) |
| Decreasing from 2019 to 2020 | |||||
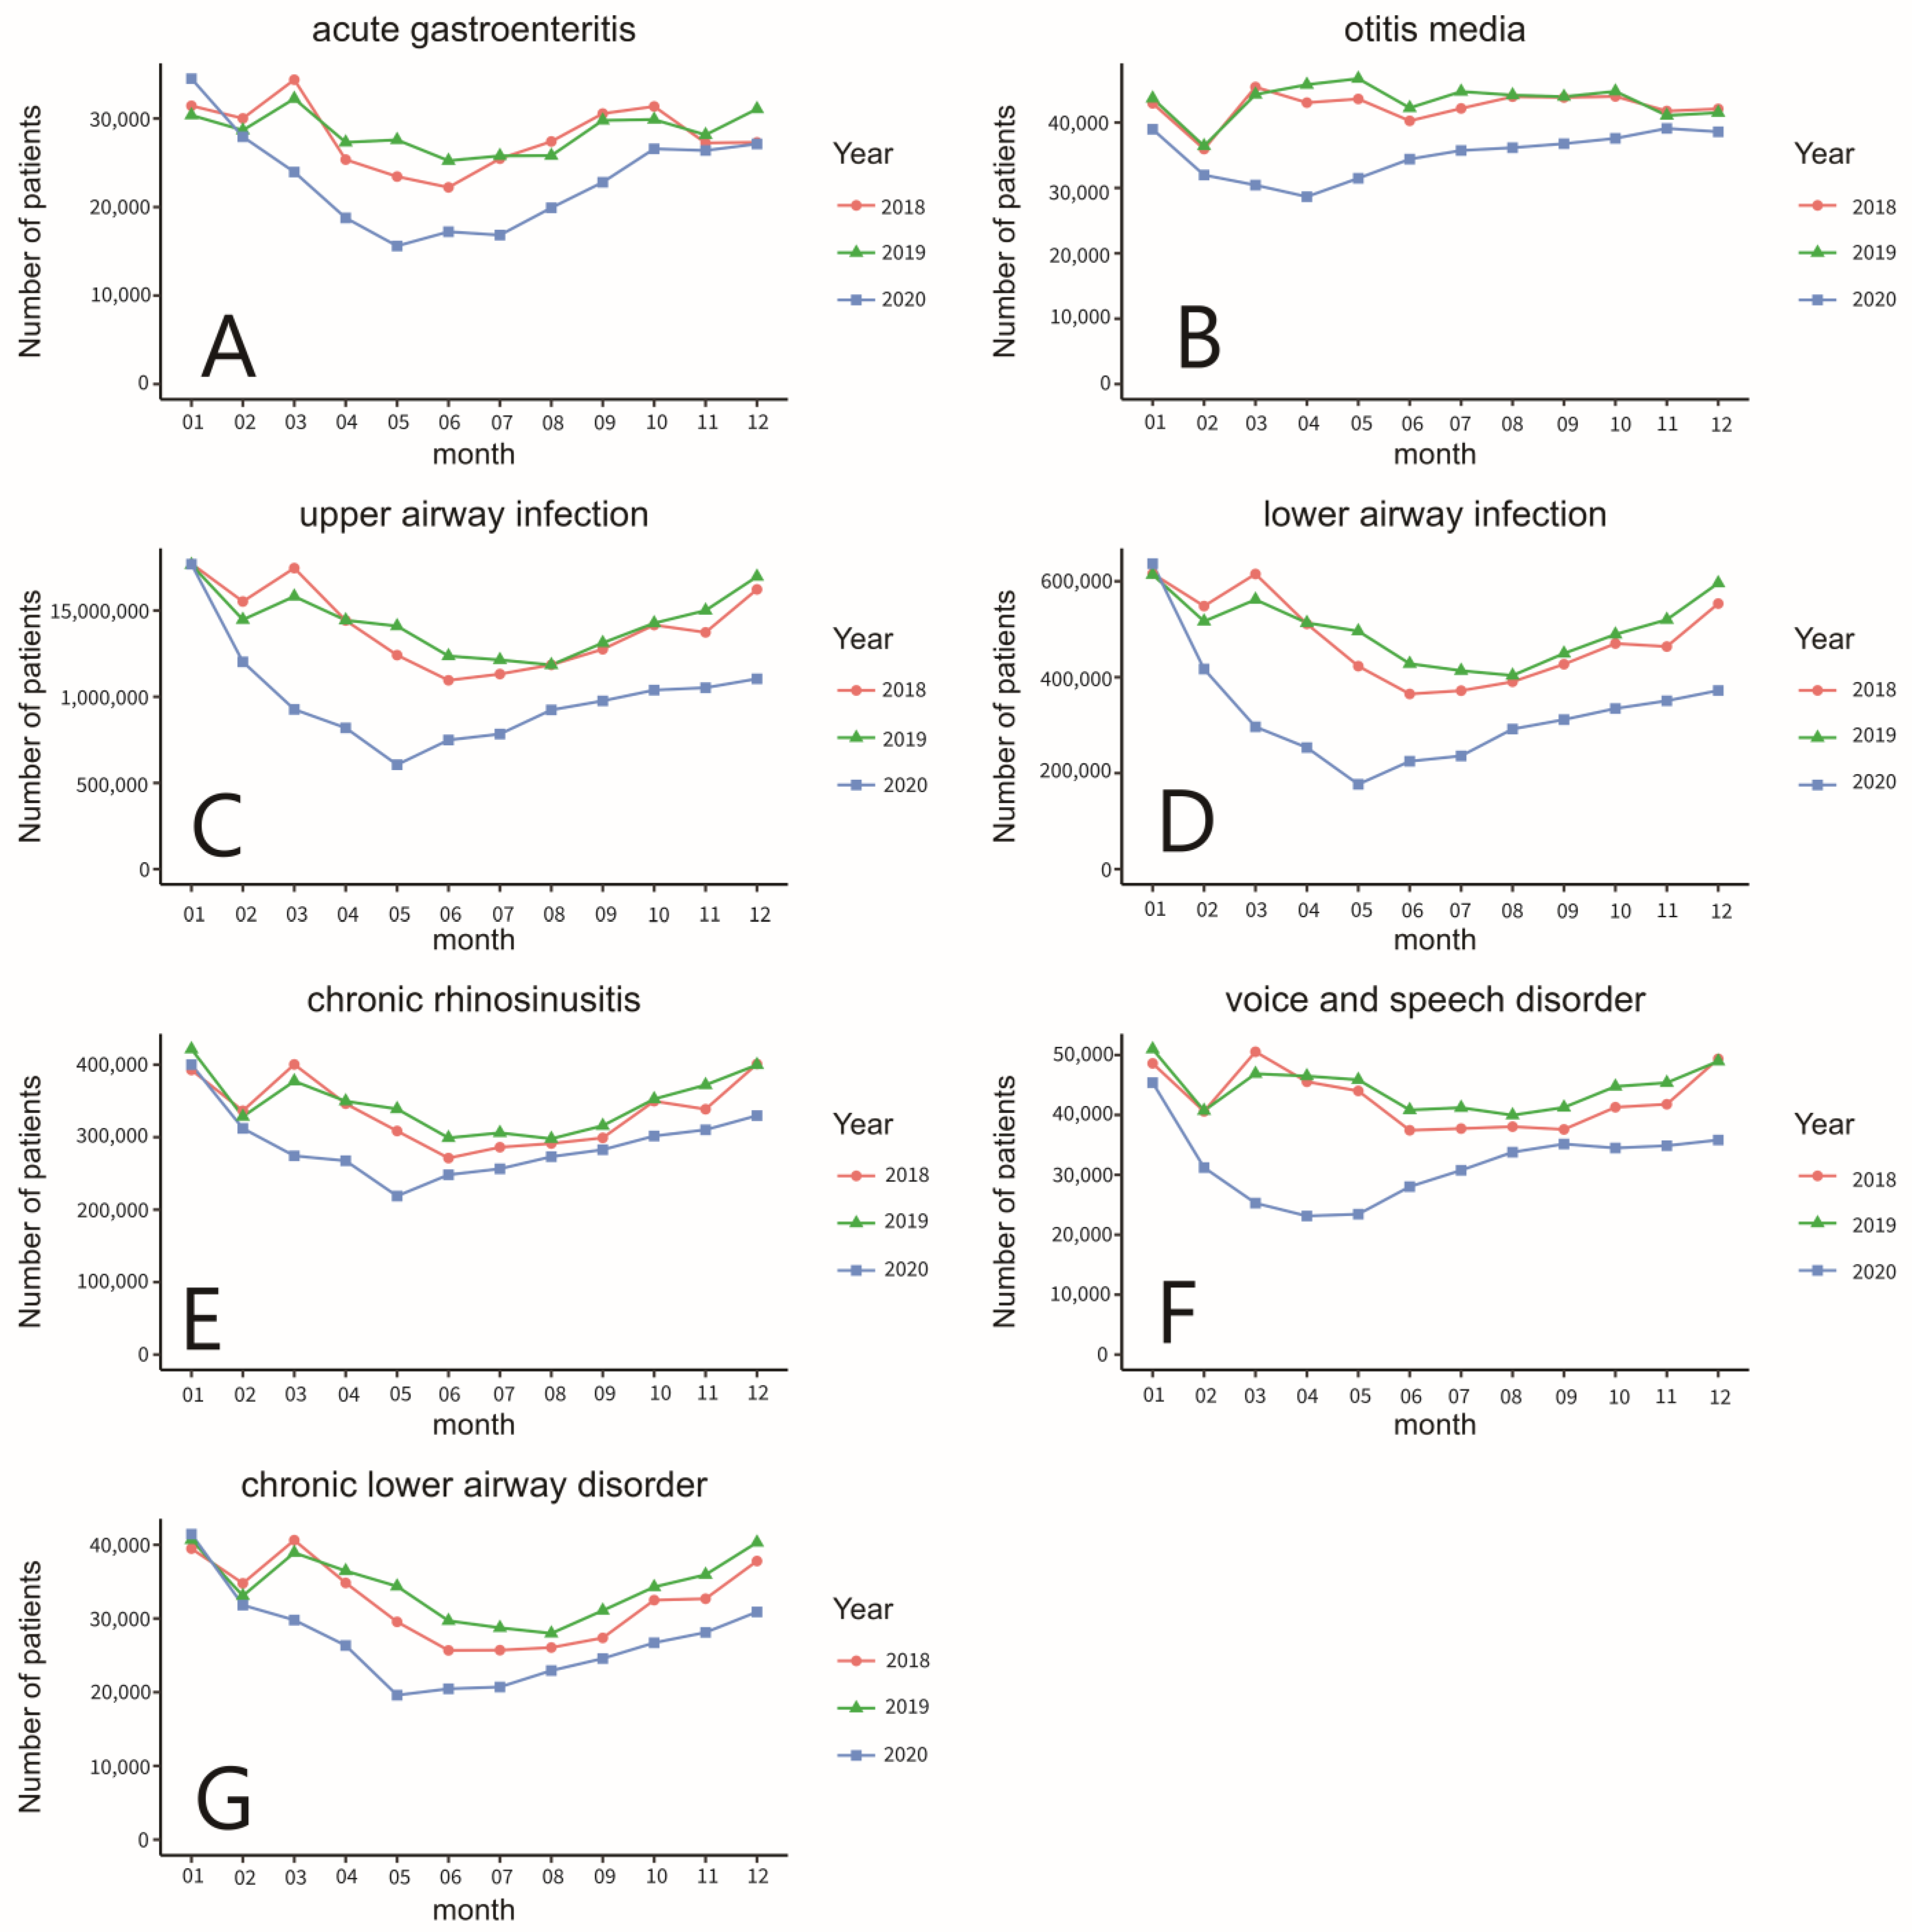
| Lower airway infection | 3,196,002 | 3,316,407 | 2,253,312 | 0.961 (0.960, 0.963) * | 0.647 (0.646, 0.648) * |
| Upper airway infection | 7,607,692 | 7,739,052 | 5,856,342 | 0.979 (0.978, 0.981) * | 0.680 (0.679, 0.680) * |
| Voice and speech disorder | 369,189 | 381,885 | 263,493 | 0.969 (0.965, 0.974) * | 0.688 (0.684, 0.691) * |
| Chronic lower airway disorder | 227,607 | 242,497 | 183,088 | 0.941 (0.935, 0.946) * | 0.754 (0.750, 0.759) * |
| Otitis media | 322,413 | 329,513 | 261,347 | 0.981 (0.976, 0.986) * | 0.792 (0.788, 0.796) * |
| Acute gastroenteritis | 263,525 | 269,775 | 220,240 | 0.980 (0.974, 0.985) * | 0.816 (0.811, 0.820) * |
| Chronic rhino sinusitis | 2,247,645 | 2,320,289 | 1,931,434 | 0.969 (0.967, 0.971) * | 0.819 (0.817, 0.821) * |
| Eustachian tube disorder | 215,779 | 222,360 | 186,289 | 0.973 (0.967, 0.979) * | 0.838 (0.833, 0.843) * |
| Gastroesophageal inflammation and ulcer | 798,147 | 883,271 | 754,008 | 0.903 (0.900, 0.906) * | 0.850 (0.847, 0.853) * |
| Sleep disorder | 191,897 | 195,815 | 171,260 | 0.983 (0.977, 0.989) * | 0.875 (0.869, 0.881) * |
| Other unspecified disease | 456,211 | 438,243 | 384,449 | 1.045 (1.041, 1.049) * | 0.876 (0.873, 0.880) * |
| Chronic laryngopharyngeal disorder | 91,298 | 101,291 | 88,812 | 0.904 (0.896, 0.912) * | 0.878 (0.870, 0.886) * |
| Headache | 314,265 | 330,363 | 298,417 | 0.954 (0.949, 0.958) * | 0.903 (0.899, 0.908) * |
| Other disease of external ear | 829,479 | 848,497 | 767,562 | 0.980 (0.977, 0.983) * | 0.903 (0.900, 0.906) * |
| Oral cavity and salivary gland disorder | 589,787 | 609,723 | 551,857 | 0.969 (0.966, 0.973) * | 0.904 (0.901, 0.908) * |
| Congenital deformity | 7237 | 7048 | 6691 | 1.030 (0.997, 1.064) | 0.951 (0.919, 0.983) * |
| Foreign body of head and neck | 217,335 | 217,557 | 206,815 | 1.002 (0.996, 1.008) | 0.952 (0.946, 0.957) * |
| Other disease of middle ear | 25,757 | 25,924 | 24,673 | 0.997 (0.980, 1.014) | 0.953 (0.937, 0.970) * |
| Hearing loss and tinnitus | 398,731 | 409,350 | 391,463 | 0.977 (0.972, 0.981) * | 0.957 (0.953, 0.961) * |
| Benign neoplasm | 32,168 | 33,604 | 32,147 | 0.960 (0.946, 0.975) * | 0.958 (0.943, 0.973) * |
| Vertigo | 516,618 | 537,690 | 523,948 | 0.963 (0.959, 0.967) * | 0.975 (0.972, 0.979) * |
| Skin/subcutaneous tissue/lymphatic disorder | 278,644 | 289,382 | 282,235 | 0.965 (0.960, 0.970) * | 0.976 (0.971, 0.981) * |
| Otitis externa | 651,451 | 677,400 | 674,152 | 0.964 (0.960, 0.967) * | 0.996 (0.993, 0.999) * |
| Unexpected Inpatient Diagnoses |
2018 (n) |
2019 (n) |
2020 (n) |
Odds Ratio in 2018 (95% CI) |
Odds Ratio in 2020 (95% CI) |
|---|---|---|---|---|---|
| Decreasing numbers from 2019 to 2020 | |||||
| Acute sinusitis, unspecified | 233 | 203 | 125 | 1.151 (0.954, 1.390) | 0.617 (0.493, 0.770) * |
| Pneumonitis due to inhalation of food and vomit | 199 | 179 | 130 | 1.115 (0.911, 1.365) | 0.728 (0.579, 0.911) * |
| Acute pharyngitis, unspecified | 143 | 155 | 116 | 0.925 (0.737, 1.162) | 0.750 (0.588, 0.953) * |
| Acute epiglottitis without obstruction | 465 | 510 | 388 | 0.915 (0.806, 1.037) | 0.762 (0.667, 0.869) * |
| Supraglottitis, unspecified, without obstruction | 149 | 165 | 127 | 0.906 (0.725, 1.130) | 0.771 (0.611, 0.971) * |
| Local infection of the skin and subcutaneous tissue, unspecified | 193 | 197 | 156 | 0.983 (0.805, 1.199) | 0.793 (0.642, 0.978) * |
| Acute tonsillitis, unspecified | 1876 | 1787 | 1611 | 1.053 (0.987, 1.123) | 0.903 (0.844, 0.966) * |
| Sudden idiopathic hearing loss | 2164 | 2047 | 1860 | 1.060 (0.998, 1.126) | 0.910 (0.854, 0.969) * |
| No difference from 2019 to 2020 | |||||
| Aspergillosis, unspecified | 65 | 93 | 100 | 0.702 (0.509, 0.961) * | 1.077 (0.812, 1.430) |
| Unspecified mycosis | 670 | 710 | 698 | 0.947 (0.852, 1.052) | 0.984 (0.887, 1.093) |
| Klebsiella pneumoniae [K. pneumoniae] as the cause of diseases classified elsewhere | 83 | 78 | 97 | 1.067 (0.783, 1.456) | 1.245 (0.925, 1.681) |
| Bell’s palsy | 189 | 168 | 157 | 1.128 (0.917, 1.390) | 0.936 (0.752, 1.163) |
| Acute recurrent tonsillitis, unspecified | 89 | 123 | 126 | 0.726 (0.551, 0.953) * | 1.026 (0.800, 1.316) |
| Pneumonia, unspecified organism | 405 | 382 | 354 | 1.063 (0.925, 1.223) | 0.928 (0.803, 1.072) |
| Abscess, furuncle and carbuncle of nose | 91 | 95 | 75 | 0.961 (0.720, 1.282) | 0.791 (0.583, 1.070) |
| Peritonsillar abscess | 1464 | 1376 | 1371 | 1.067 (0.991, 1.149) | 0.998 (0.926, 1.075) |
| Edema of larynx | 137 | 128 | 134 | 1.073 (0.843, 1.367) | 1.048 (0.823, 1.337) |
| Retropharyngeal and parapharyngeal abscess | 381 | 364 | 317 | 1.050 (0.909, 1.212) | 0.872 (0.750, 1.014) |
| Other abscess of pharynx | 164 | 140 | 129 | 1.175 (0.938, 1.474) | 0.923 (0.726, 1.172) |
| Other diseases of pharynx | 775 | 895 | 927 | 0.869 (0.789, 0.956) * | 1.037 (0.946, 1.137) |
| Acute respiratory failure, unspecified whether with hypoxia or hypercapnia | 115 | 119 | 95 | 0.969 (0.750, 1.253) | 0.800 (0.609, 1.047) |
| Sialoadenitis, unspecified | 459 | 447 | 418 | 1.030 (0.904, 1.173) | 0.936 (0.819, 1.070) |
| Acute sialoadenitis | 134 | 129 | 107 | 1.042 (0.818, 1.328) | 0.831 (0.642, 1.073) |
| Abscess of salivary gland | 187 | 171 | 167 | 1.097 (0.891, 1.350) | 0.978 (0.790, 1.211) |
| Cellulitis and abscess of mouth | 665 | 691 | 655 | 0.965 (0.868, 1.074) | 0.949 (0.853, 1.056) |
| Cutaneous abscess of face | 237 | 210 | 210 | 1.132 (0.940, 1.364) | 1.001 (0.827, 1.213) |
| Cutaneous abscess of neck | 332 | 334 | 314 | 0.997 (0.856, 1.161) | 0.941 (0.807, 1.098) |
| Cellulitis of face | 695 | 701 | 730 | 0.994 (0.895, 1.104) | 1.043 (0.940, 1.157) |
| Cellulitis of neck | 489 | 454 | 437 | 1.080 (0.951, 1.228) | 0.964 (0.845, 1.099) |
| Acute lymphadenitis of face, head and neck | 170 | 154 | 140 | 1.107 (0.890, 1.378) | 0.910 (0.724, 1.145) |
| Inflammatory conditions of jaws | 238 | 268 | 257 | 0.891 (0.748, 1.061) | 0.960 (0.809, 1.140) |
| Epistaxis | 417 | 372 | 382 | 1.124 (0.978, 1.293) | 1.028 (0.891, 1.186) |
| Dyspnea, unspecified | 191 | 276 | 254 | 0.694 (0.577, 0.834) * | 0.922 (0.777, 1.093) |
| Dizziness and giddiness | 552 | 491 | 468 | 1.128 (0.999, 1.274) | 0.955 (0.841, 1.083) |
Disclaimer/Publisher’s Note: The statements, opinions and data contained in all publications are solely those of the individual author(s) and contributor(s) and not of MDPI and/or the editor(s). MDPI and/or the editor(s) disclaim responsibility for any injury to people or property resulting from any ideas, methods, instructions or products referred to in the content. |
© 2023 by the authors. Licensee MDPI, Basel, Switzerland. This article is an open access article distributed under the terms and conditions of the Creative Commons Attribution (CC BY) license (https://creativecommons.org/licenses/by/4.0/).
Share and Cite
Cho, H.-Y.; Hung, C.-H.; Kao, Y.-W.; Shia, B.-C.; Chen, M. Impact of COVID-19 Preventative Measures on Otolaryngology in Taiwan: A Nationwide Study. Int. J. Environ. Res. Public Health 2023, 20, 3371. https://doi.org/10.3390/ijerph20043371
Cho H-Y, Hung C-H, Kao Y-W, Shia B-C, Chen M. Impact of COVID-19 Preventative Measures on Otolaryngology in Taiwan: A Nationwide Study. International Journal of Environmental Research and Public Health. 2023; 20(4):3371. https://doi.org/10.3390/ijerph20043371
Chicago/Turabian StyleCho, Hsiao-Yun, Chia-Hung Hung, Yi-Wei Kao, Ben-Chang Shia, and Mingchih Chen. 2023. "Impact of COVID-19 Preventative Measures on Otolaryngology in Taiwan: A Nationwide Study" International Journal of Environmental Research and Public Health 20, no. 4: 3371. https://doi.org/10.3390/ijerph20043371
APA StyleCho, H.-Y., Hung, C.-H., Kao, Y.-W., Shia, B.-C., & Chen, M. (2023). Impact of COVID-19 Preventative Measures on Otolaryngology in Taiwan: A Nationwide Study. International Journal of Environmental Research and Public Health, 20(4), 3371. https://doi.org/10.3390/ijerph20043371