
Development, Validation, and Measurement Invariance of the Body Image Bidimensional Assessment (BIBA) in Italian and Spanish Children and Early Adolescent Samples

 , , , , , , ,
  and
and
Abstract
:1. Introduction
2. Study 1: Factor Structure and Internal Consistency of the BIBA in the Italian Sample
2.1. Participants
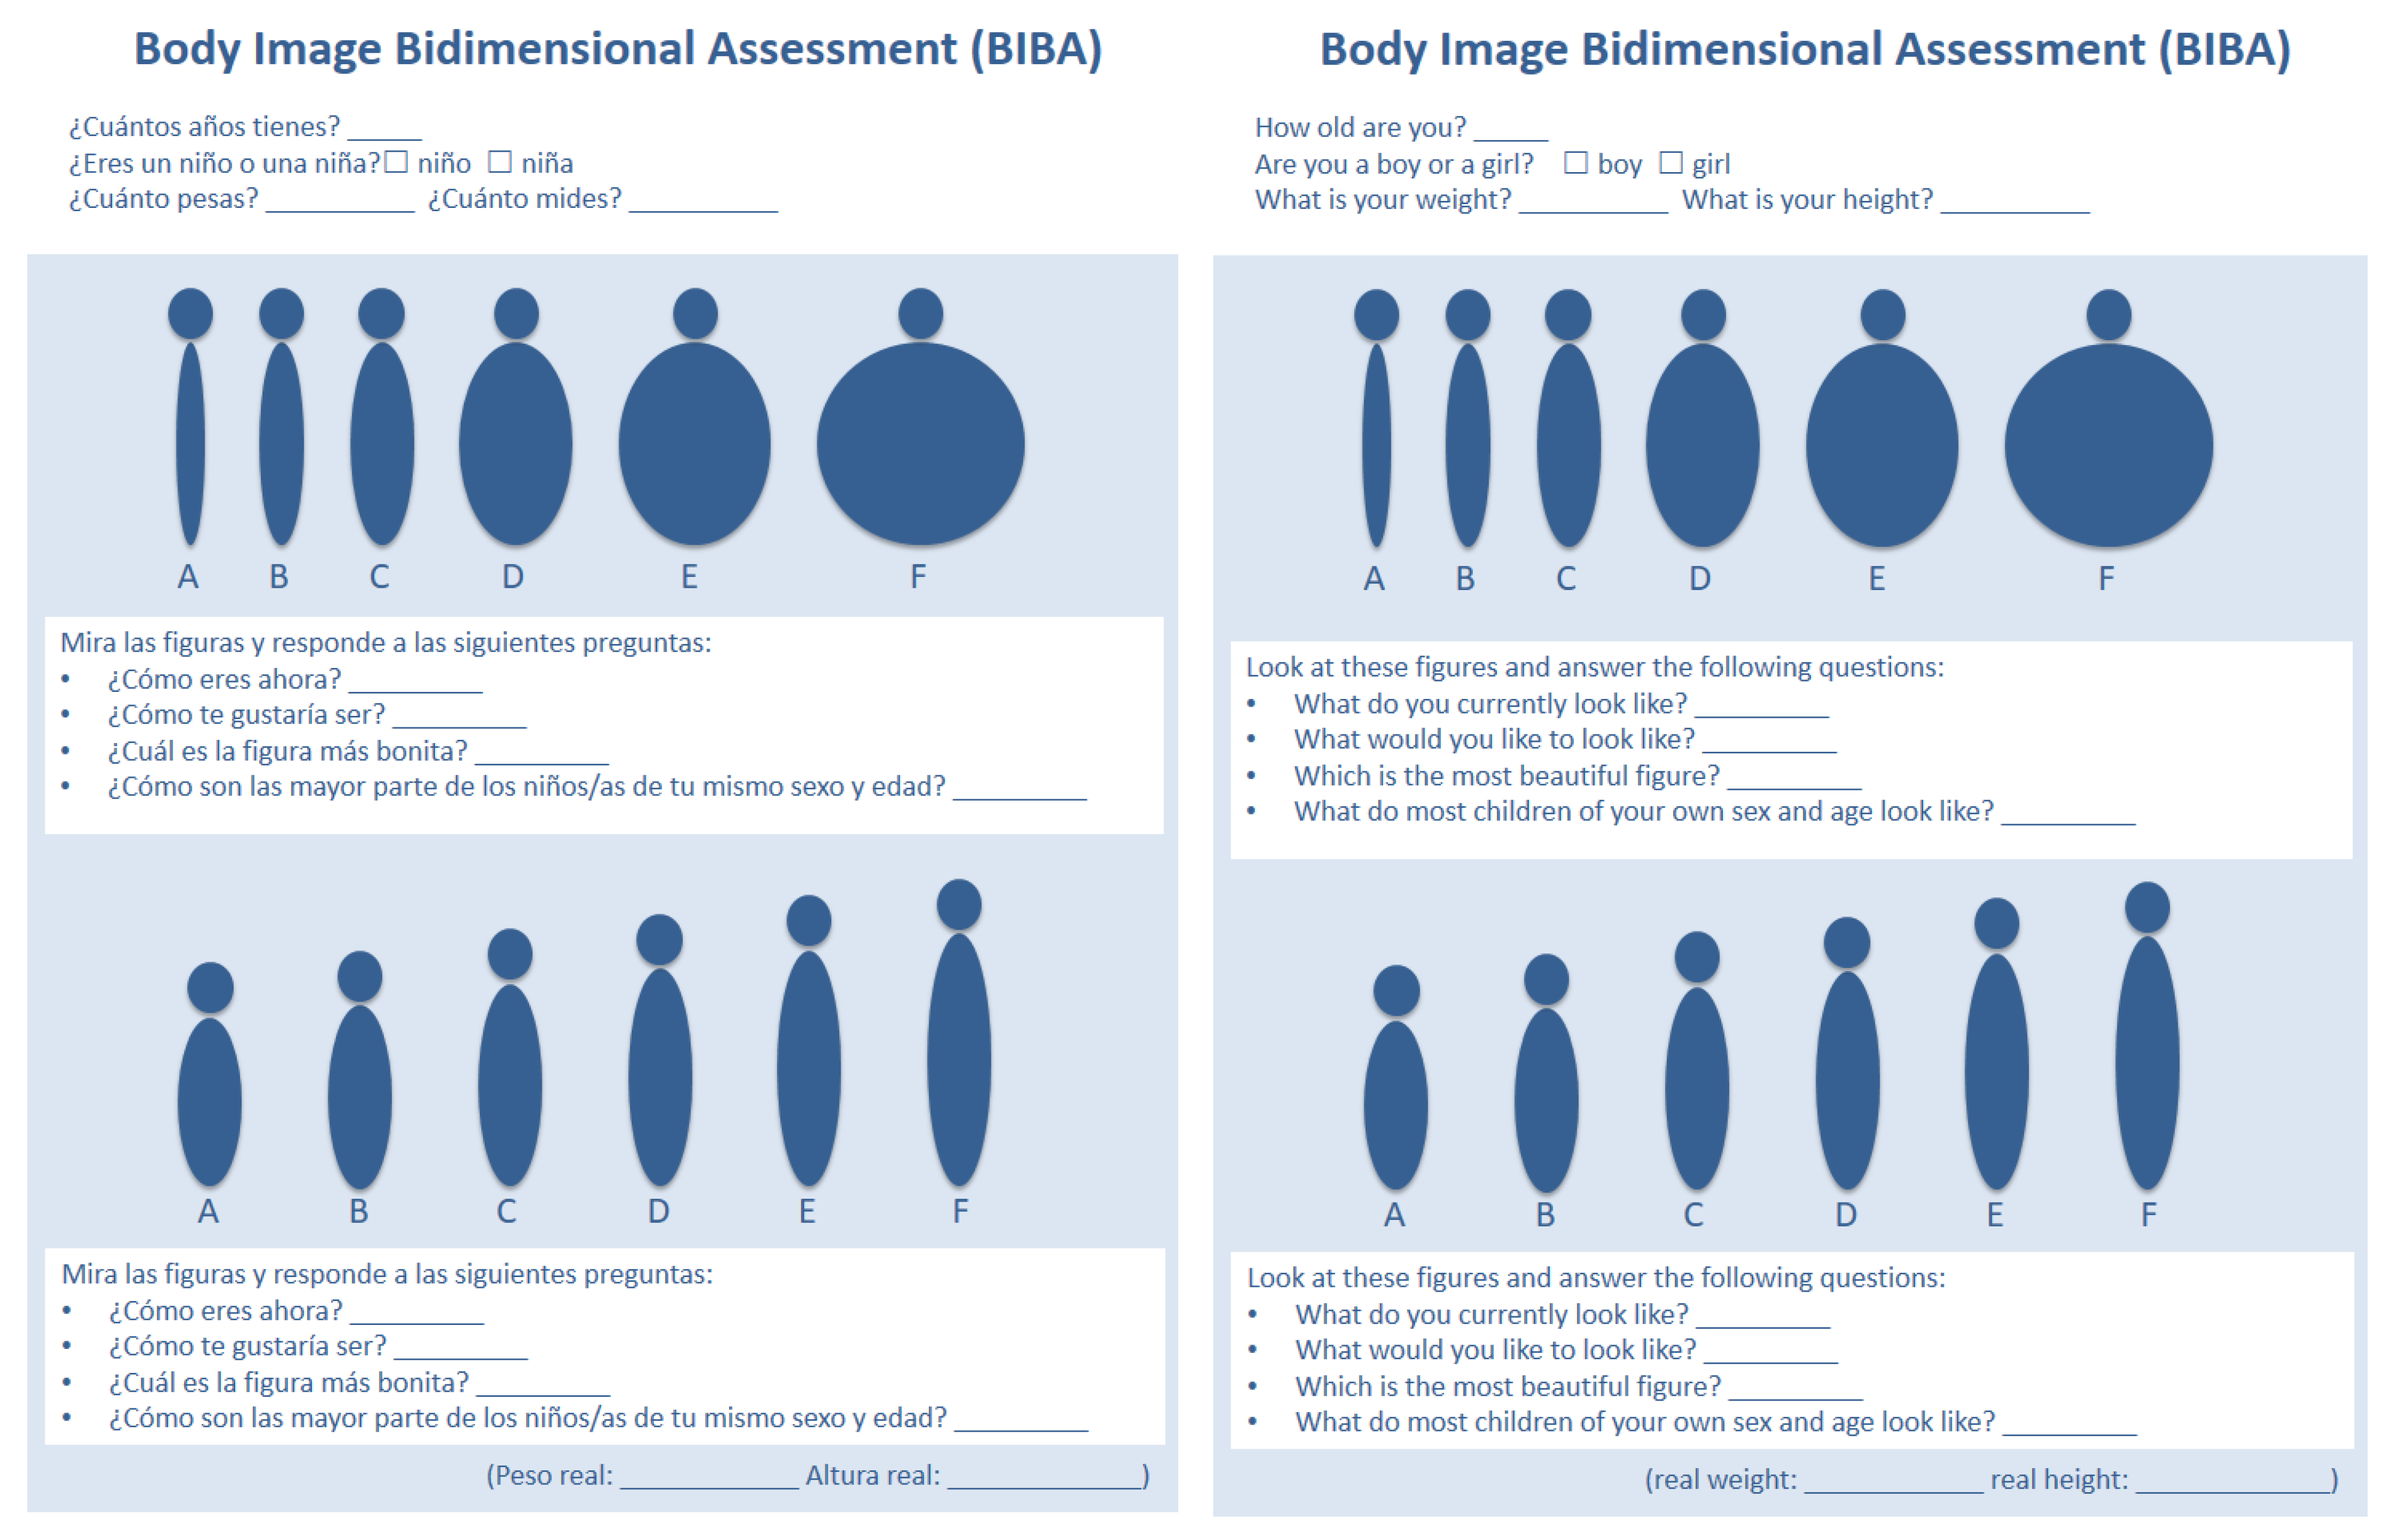
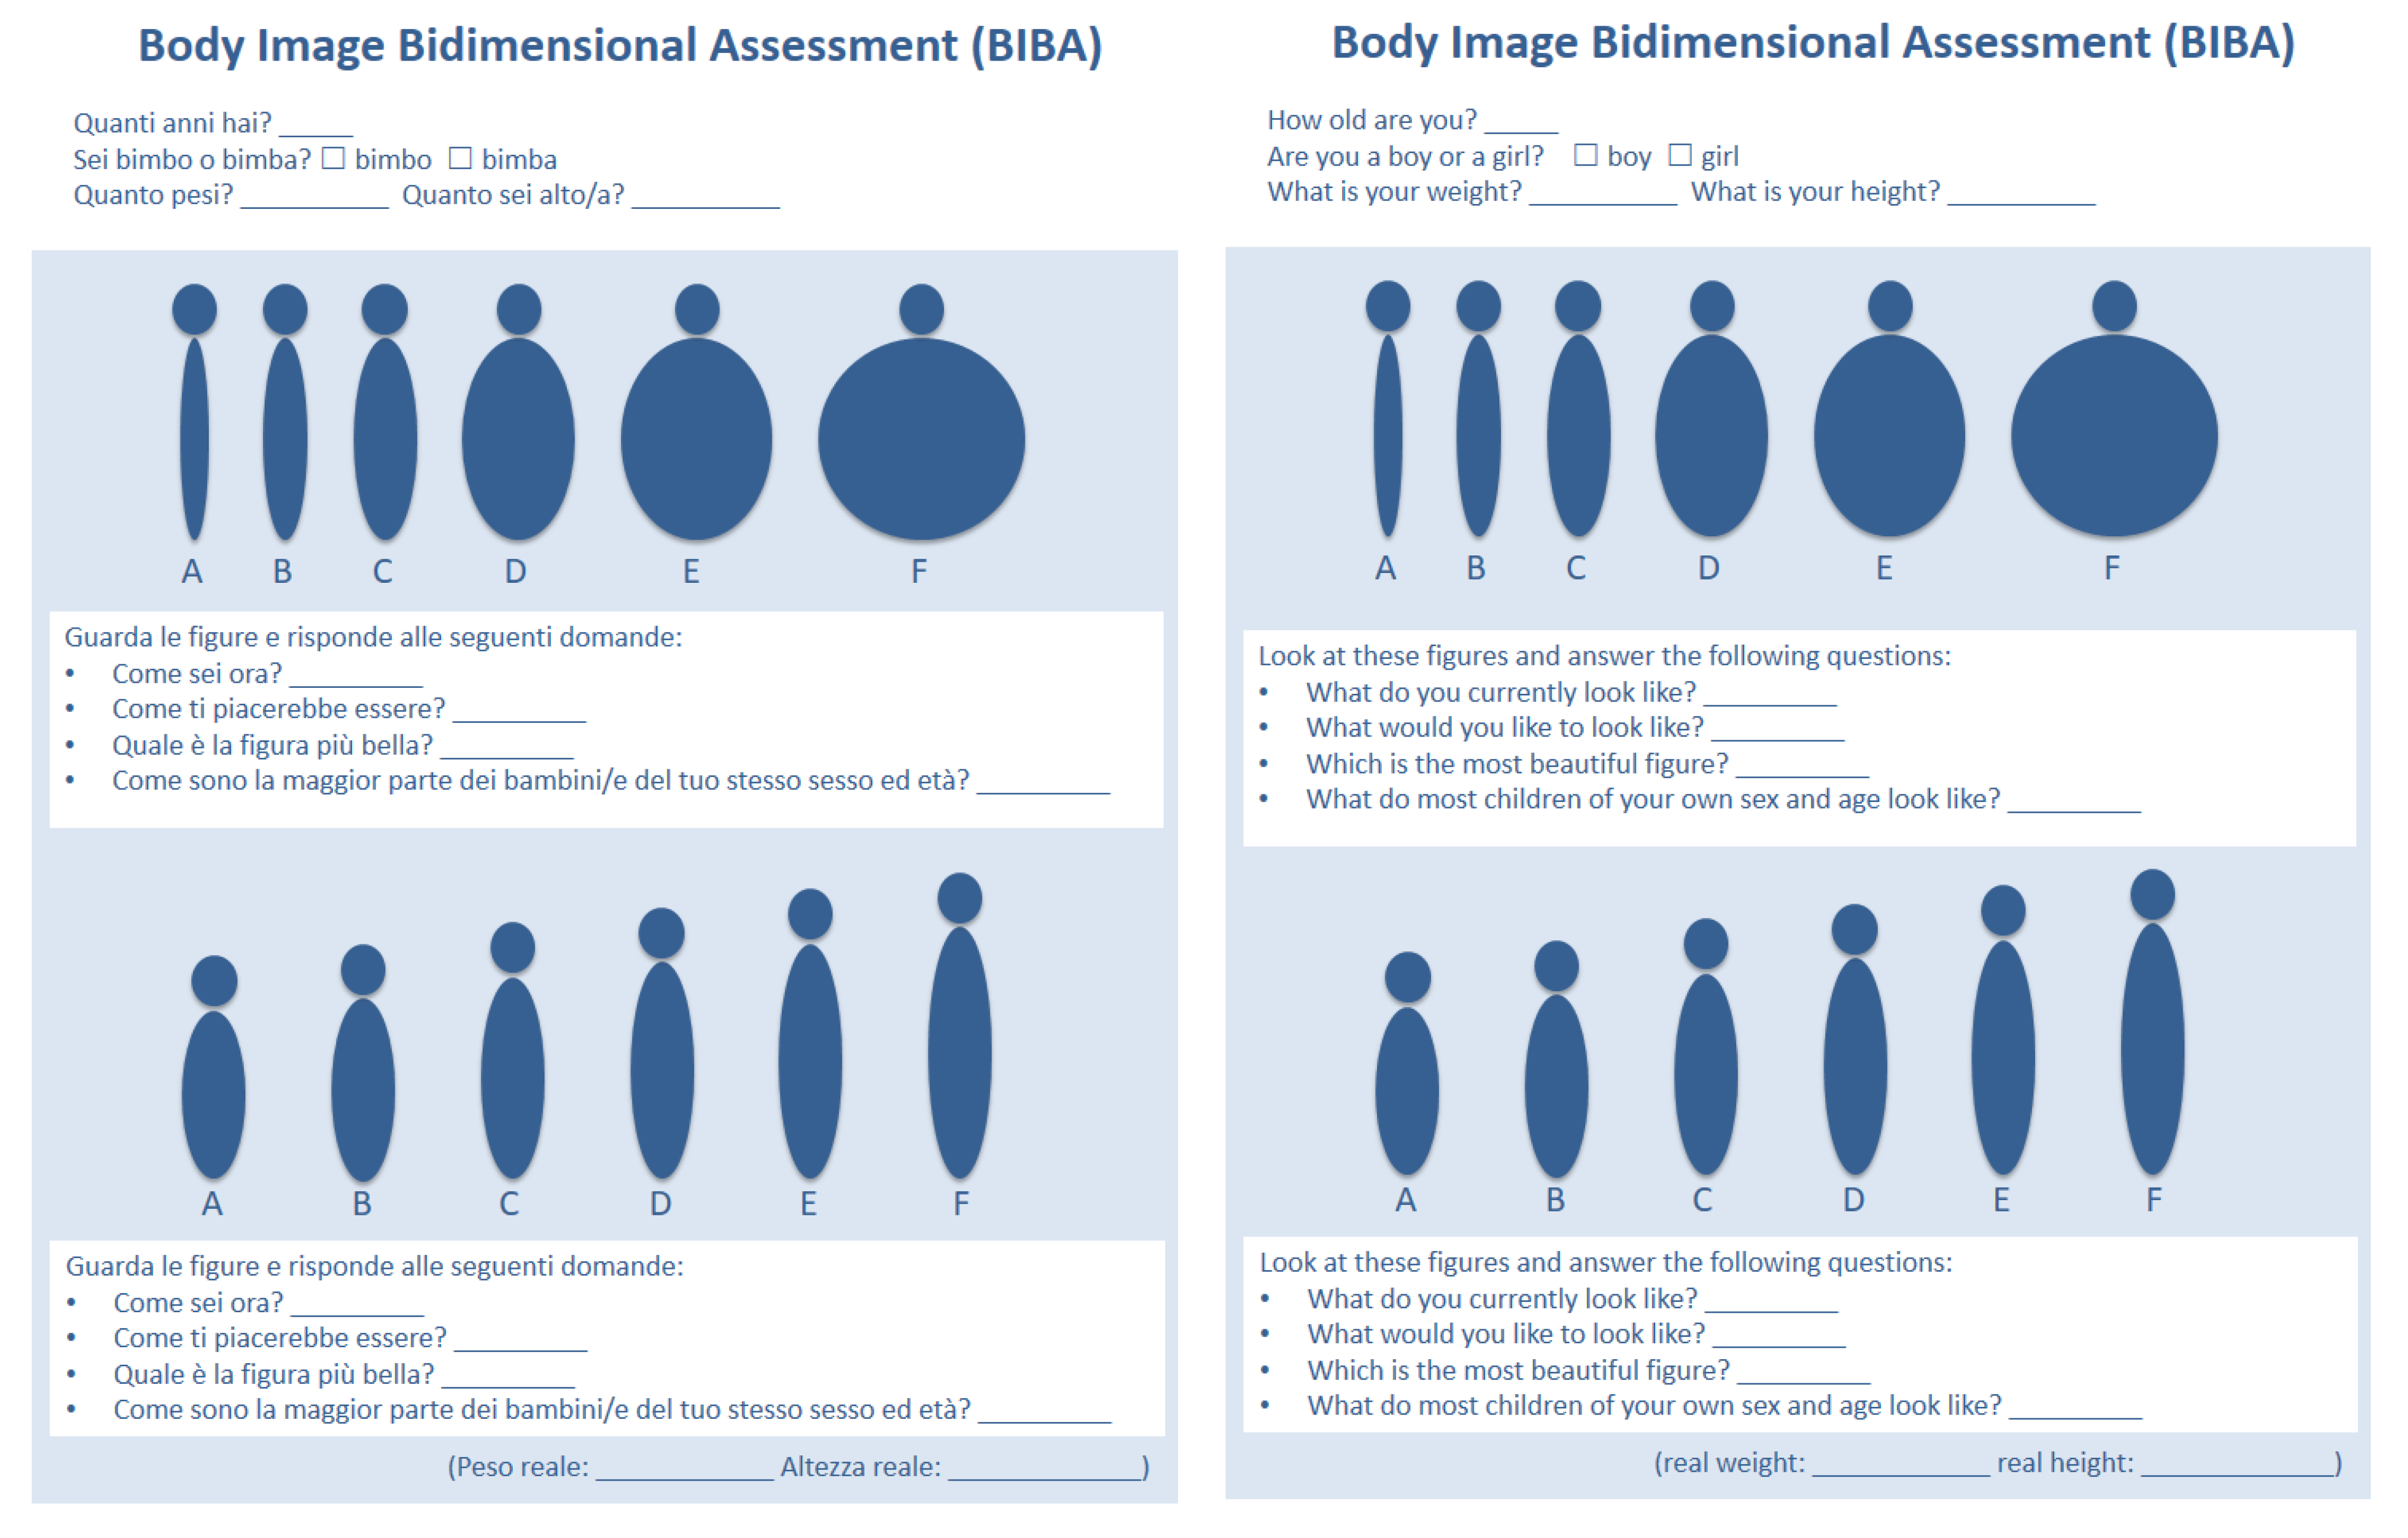
2.2. Measures
- In relation to the weight:
- In relation to the height:
2.3. Sociodemographics
2.4. Statistical Analysis
2.5. Results
Factor Structure of the BIBA
3. Study 2: Factor Structure and Internal Consistency of the BIBA in the Spanish Sample
3.1. Participants
3.2. Measures
3.3. Results
Factor Structure of the BIBA
4. Study 3: Confirmatory Factor Analysis and Measurement of Invariance of the BIBA across Countries and Sexes
4.1. Participants and Methods
4.2. Results
4.2.1. CFA in the Italian Sample
4.2.2. CFA in the Spanish Sample
4.2.3. Measurement of Invariance across Countries
4.2.4. Measurement of Invariance across Sex
5. General Discussion
6. Conclusions
Author Contributions
Funding
Institutional Review Board Statement
Informed Consent Statement
Data Availability Statement
Acknowledgments
Conflicts of Interest
References
- Smolak, L. Body Image Development–Girl Children. In Encyclopedia of Body Image and Human Appearance; Elsevier: Amsterdam, The Netherlands, 2012; pp. 212–218. [Google Scholar]
- León, M.P.; González-Martí, I.; Contreras-Jordán, O.R. What Do Children Think of Their Perceived and Ideal Bodies? Understandings of Body Image at Early Ages: A Mixed Study. Int. J. Environ. Res. Public Health 2021, 18, 4871. [Google Scholar] [CrossRef] [PubMed]
- Brown, Z.; Tiggemann, M. Celebrity Influence on Body Image and Eating Disorders: A Review. J. Health Psychol. 2022, 27, 1233–1251. [Google Scholar] [CrossRef] [PubMed]
- Tatangelo, G.; McCabe, M.; Mellor, D.; Mealey, A. A Systematic Review of Body Dissatisfaction and Sociocultural Messages Related to the Body among Preschool Children. Body Image 2016, 18, 86–95. [Google Scholar] [CrossRef] [PubMed]
- Costa, L.d.C.F.; Silva, D.A.S.; Alvarenga, M.d.S.; de Vasconcelos, F.d.A.G. Association between Body Image Dissatisfaction and Obesity among Schoolchildren Aged 7–10 Years. Physiol. Behav. 2016, 160, 6–11. [Google Scholar] [CrossRef]
- Stice, E.; Marti, C.N.; Shaw, H.; Rohde, P. Meta-Analytic Review of Dissonance-Based Eating Disorder Prevention Programs: Intervention, Participant, and Facilitator Features That Predict Larger Effects. Clin. Psychol. Rev. 2019, 70, 91–107. [Google Scholar] [CrossRef] [PubMed]
- Paterna, A.; Alcaraz-Ibáñez, M.; Fuller-Tyszkiewicz, M.; Sicilia, Á. Internalization of Body Shape Ideals and Body Dissatisfaction: A Systematic Review and Meta-analysis. Int. J. Eat. Disord. 2021, 54, 1575–1600. [Google Scholar] [CrossRef]
- Colizzi, M.; Lasalvia, A.; Ruggeri, M. Prevention and Early Intervention in Youth Mental Health: Is It Time for a Multidisciplinary and Trans-Diagnostic Model for Care? Int. J. Ment. Health Syst. 2020, 14, 23. [Google Scholar] [CrossRef] [Green Version]
- Byrne, N.M.; Hills, A.P. Should Body-Image Scales Designed for Adults Be Used with Adolescents? Percept. Mot. Skills 1996, 82, 747–753. [Google Scholar] [CrossRef]
- Baker, C.; Wertheim, E.H. Body Image: A Handbook of Theory, Research, and Clinical Practice, Edited by Thomas F. Cash and Thomas Pruzinsky, New York: Guilford Press, 2002, 530 Pages, $60.00. Eat. Disord. 2003, 11, 247–248. [Google Scholar] [CrossRef]
- Gardner, R.M.; Brown, D.L. Body Image Assessment: A Review of Figural Drawing Scales. Pers. Individ. Dif. 2010, 48, 107–111. [Google Scholar] [CrossRef]
- Stunkard, A.J.; Sørensen, T.; Schulsinger, F. Use of the Danish Adoption Register for the Study of Obesity and Thinness. Res. Publ. Assoc. Res. Nerv. Ment. Dis. 1983, 60, 115–120. [Google Scholar]
- Truby, H.; Paxton, S.J. Development of the Children’s Body Image Scale. Br. J. Clin. Psychol. 2002, 41, 185–203. [Google Scholar] [CrossRef] [PubMed]
- Chen, H.; Jackson, T.; Huang, X. The Negative Physical Self Scale: Initial Development and Validation in Samples of Chinese Adolescents and Young Adults. Body Image 2006, 3, 401–412. [Google Scholar] [CrossRef] [PubMed]
- Judge, T.A.; Cable, D.M. The Effect of Physical Height on Workplace Success and Income: Preliminary Test of a Theoretical Model. J. Appl. Psychol. 2004, 89, 428–441. [Google Scholar] [CrossRef] [PubMed] [Green Version]
- Collins, M.E. Body Figure Perceptions and Preferences among Preadolescent Children. Int. J. Eat. Disord. 1991, 10, 199–208. [Google Scholar] [CrossRef]
- Thompson, J.K.; Altabe, M.N. Psychometric Qualities of the Figure Rating Scale. Int. J. Eat. Disord. 1991, 10, 615–619. [Google Scholar] [CrossRef]
- Sánchez-Miguel, P.A.; Vaquero-Solís, M.; Sánchez-Oliva, D.; Pulido-González, J.J.; Segura-García, C.; Tapia-Serrano, M.A. Validation of the Body Image Dimensional Assessment in Adolescents from Spanish High School. Eat. Weight Disord.-Stud. Anorexia, Bulim. Obes. 2021, 26, 1749–1756. [Google Scholar] [CrossRef]
- Segura-García, C.; Papaianni, M.C.; Rizza, P.; Flora, S.; De Fazio, P. The Development and Validation of the Body Image Dimensional Assessment (BIDA). Eat. Weight Disord. 2012, 17, e219-25. [Google Scholar] [CrossRef]
- Putnick, D.L.; Bornstein, M.H. Measurement Invariance Conventions and Reporting: The State of the Art and Future Directions for Psychological Research. Dev. Rev. 2016, 41, 71–90. [Google Scholar] [CrossRef] [Green Version]
- Cole, T.J. Establishing a Standard Definition for Child Overweight and Obesity Worldwide: International Survey. BMJ 2000, 320, 1240. [Google Scholar] [CrossRef] [Green Version]
- R Core Team. R: A Language and Environment for Statistical Computing; R Foundation for Statistical Computing: Vienna, Austria, 2021. [Google Scholar]
- Revelle, W. Psych: Procedures for Psychological, Psychometric, and Personality Research; R Package Version 2.2.9; Northwestern University: Evanston, IL, USA, 2022. [Google Scholar]
- Jorgensen, T.D.; Pornprasertmanit, S.; Schoemann, A.M.; Rosseel, Y. SemTools: Useful Tools for Structural Equation Modeling; R Team: Vienna, Austria, 2022. [Google Scholar]
- Rosseel, Y. Lavaan: An R Package for Structural Equation Modeling. J. Stat. Softw. 2012, 48, 1–36. [Google Scholar] [CrossRef] [Green Version]
- MacCallum, R.C.; Browne, M.W.; Sugawara, H.M. Power Analysis and Determination of Sample Size for Covariance Structure Modeling. Psychol. Methods 1996, 1, 130–149. [Google Scholar] [CrossRef]
- Cudeck, R.; Browne, M.W. Constructing a Covariance Matrix That Yields a Specified Minimizer and a Specified Minimum Discrepancy Function Value. Psychometrika 1992, 57, 357–369. [Google Scholar] [CrossRef]
- Hu, L.; Bentler, P.M. Cutoff Criteria for Fit Indexes in Covariance Structure Analysis: Conventional Criteria versus New Alternatives. Struct. Equ. Model. Multidiscip. J. 1999, 6, 1–55. [Google Scholar] [CrossRef]
- Shi, D.; Maydeu-Olivares, A. The Effect of Estimation Methods on SEM Fit Indices. Educ. Psychol. Meas. 2020, 80, 421–445. [Google Scholar] [CrossRef]
- Trizano-Hermosilla, I.; Alvarado, J.M. Best Alternatives to Cronbach’s Alpha Reliability in Realistic Conditions: Congeneric and Asymmetrical Measurements. Front. Psychol. 2016, 7, 769. [Google Scholar] [CrossRef] [PubMed] [Green Version]
- Revelle, W.; Zinbarg, R.E. Coefficients Alpha, Beta, Omega, and the Glb: Comments on Sijtsma. Psychometrika 2009, 74, 145–154. [Google Scholar] [CrossRef]
- McNeish, D. Thanks Coefficient Alpha, We’ll Take It from Here. Psychol. Methods 2018, 23, 412–433. [Google Scholar] [CrossRef]
- Bollen, K.A. Structural Equations with Latent Variables; John Wiley & Sons, Inc.: Hoboken, NJ, USA, 1989; ISBN 9781118619179. [Google Scholar]
- Rutkowski, L.; Svetina, D. Measurement Invariance in International Surveys: Categorical Indicators and Fit Measure Performance. Appl. Meas. Educ. 2017, 30, 39–51. [Google Scholar] [CrossRef]
- Byrne, B.M.; Shavelson, R.J.; Muthén, B. Testing for the Equivalence of Factor Covariance and Mean Structures: The Issue of Partial Measurement Invariance. Psychol. Bull. 1989, 105, 456–466. [Google Scholar] [CrossRef]
- Spinelli, A.; Buoncristiano, M.; Nardone, P.; Starc, G.; Hejgaard, T.; Júlíusson, P.B.; Fismen, A.; Weghuber, D.; Musić Milanović, S.; García-Solano, M.; et al. Thinness, Overweight, and Obesity in 6- to 9-year-old Children from 36 Countries: The World Health Organization European Childhood Obesity Surveillance Initiative—COSI 2015–2017. Obes. Rev. 2021, 22, e13214. [Google Scholar] [CrossRef] [PubMed]
- Buoncristiano, M.; Spinelli, A.; Williams, J.; Nardone, P.; Rito, A.I.; García-Solano, M.; Grøholt, E.K.; Gutiérrez-González, E.; Klepp, K.I.; Starc, G.; et al. Childhood Overweight and Obesity in Europe: Changes from 2007 to 2017. Obes. Rev. 2021, 22, e13226. [Google Scholar] [CrossRef] [PubMed]
- Rodriguez-Martinez, A.; Zhou, B.; Sophiea, M.K.; Bentham, J.; Paciorek, C.J.; Iurilli, M.L.; Carrillo-Larco, R.M.; Bennett, J.E.; Di Cesare, M.; Taddei, C.; et al. Height and Body-Mass Index Trajectories of School-Aged Children and Adolescents from 1985 to 2019 in 200 Countries and Territories: A Pooled Analysis of 2181 Population-Based Studies with 65 Million Participants. Lancet 2020, 396, 1511–1524. [Google Scholar] [CrossRef] [PubMed]
- Sutter, C.; Kim, J.H.; Bost, K.K. Connections between Friendship Quality, Peer Competence, and Obesity in Early Childhood through Adolescence. Child. Obes. 2020, 16, 393–402. [Google Scholar] [CrossRef] [PubMed]
- Swami, V.; Furnham, A.; Balakumar, N.; Williams, C.; Canaway, K.; Stanistreet, D. Factors Influencing Preferences for Height: A Replication and Extension. Pers. Individ. Dif. 2008, 45, 395–400. [Google Scholar] [CrossRef]
- Talbot, D.; Mahlberg, J. Exploration of Height Dissatisfaction, Muscle Dissatisfaction, Body Ideals, and Eating Disorder Symptoms in Men. J. Am. Coll. Health 2021, 71, 18–23. [Google Scholar] [CrossRef]


| Components | ||
|---|---|---|
| 1 | 2 | |
| Dissatisfaction with ideal weight | 0.895 | |
| Dissatisfaction with weight canon | 0.732 | |
| Comparative weight dissatisfaction | 0.597 | |
| Dissatisfaction with ideal height | 0.814 | |
| Dissatisfaction with height canon | 0.776 | |
| Comparative height dissatisfaction | 0.556 | |
| Components | ||
|---|---|---|
| 1 | 2 | |
| Dissatisfaction with ideal weight | 0.814 | |
| Dissatisfaction with weight canon | 0.683 | |
| Comparative weight dissatisfaction | 0.748 | |
| Dissatisfaction with ideal height | 0.698 | |
| Dissatisfaction with height canon | 0.778 | |
| Comparative height dissatisfaction | 0.624 | |
| Robust Model Fit Indices | Model Difference | ||||||||||||
|---|---|---|---|---|---|---|---|---|---|---|---|---|---|
| Model | χ2 | df | CFI | TLI | RMSEA | SRMR | ΔM | Δ χ2 | Δdf | ΔCFI | ΔTLI | ΔRMSEA | ΔSRMR |
| M1 | 34.960 | 14 | 0.98 | 0.97 | 0.06 | 0.04 | |||||||
| M2 * | 44.923 | 19 | 0.98 | 0.97 | 0.06 | 0.05 | M2 VS. M1 | 9.963 | 5 | 0.004 | −0.003 | 0.003 | −0.011 |
| M3 * | 51.538 | 22 | 0.98 | 0.97 | 0.06 | 0.05 | M3 VS. M2 | 6.615 | 3 | 0.003 | −0.001 | 0.000 | −0.002 |
| Robust Model Fit Indices | Model Difference | ||||||||||||
|---|---|---|---|---|---|---|---|---|---|---|---|---|---|
| Model | χ2 | df | CFI | TLI | RMSEA | SRMR | ΔM | Δ χ2 | Δdf | ΔCFI | ΔTLI | ΔRMSEA | ΔSRMR |
| M1 | 36.666 | 14 | 0.98 | 0.96 | 0.06 | 0.03 | |||||||
| M2 * | 37.859 | 19 | 0.96 | 0.98 | 0.05 | 0.04 | M2 VS. M1 | 1.193 | 5 | −0.003 | −0.014 | 0.013 | −0.003 |
| M3 * | 41.255 | 22 | 0.99 | 0.980 | 0.05 | 0.04 | M3 VS. M2 | 3.395 | 3 | 0.000 | −0.003 | 0.003 | −0.001 |
Disclaimer/Publisher’s Note: The statements, opinions and data contained in all publications are solely those of the individual author(s) and contributor(s) and not of MDPI and/or the editor(s). MDPI and/or the editor(s) disclaim responsibility for any injury to people or property resulting from any ideas, methods, instructions or products referred to in the content. |
© 2023 by the authors. Licensee MDPI, Basel, Switzerland. This article is an open access article distributed under the terms and conditions of the Creative Commons Attribution (CC BY) license (https://creativecommons.org/licenses/by/4.0/).
Share and Cite
Segura-Garcia, C.; Aloi, M.; Carbone, E.A.; Staltari, F.A.; Rania, M.; Papaianni, M.C.; Vaquero-Solís, M.; Tapia-Serrano, M.Á.; Sánchez-Miguel, P.A.; Liuzza, M.T. Development, Validation, and Measurement Invariance of the Body Image Bidimensional Assessment (BIBA) in Italian and Spanish Children and Early Adolescent Samples. Int. J. Environ. Res. Public Health 2023, 20, 3626. https://doi.org/10.3390/ijerph20043626
Segura-Garcia C, Aloi M, Carbone EA, Staltari FA, Rania M, Papaianni MC, Vaquero-Solís M, Tapia-Serrano MÁ, Sánchez-Miguel PA, Liuzza MT. Development, Validation, and Measurement Invariance of the Body Image Bidimensional Assessment (BIBA) in Italian and Spanish Children and Early Adolescent Samples. International Journal of Environmental Research and Public Health. 2023; 20(4):3626. https://doi.org/10.3390/ijerph20043626
Chicago/Turabian StyleSegura-Garcia, Cristina, Matteo Aloi, Elvira Anna Carbone, Filippo Antonio Staltari, Marianna Rania, Maria Cristina Papaianni, Mikel Vaquero-Solís, Miguel Ángel Tapia-Serrano, Pedro Antonio Sánchez-Miguel, and Marco Tullio Liuzza. 2023. "Development, Validation, and Measurement Invariance of the Body Image Bidimensional Assessment (BIBA) in Italian and Spanish Children and Early Adolescent Samples" International Journal of Environmental Research and Public Health 20, no. 4: 3626. https://doi.org/10.3390/ijerph20043626