


Digital Inclusion, Cultural Capital, and Health Status of Urban and Rural Residents: An Empirical Study Based on 2017 CGSS Database

 ,
,
Abstract
:1. Introduction
2. Materials and Methods
2.1. Data Processing
2.2. Variables and Measures
2.2.1. Dependent Variable
2.2.2. Independent Variable
2.2.3. Mediating Variable
2.2.4. Control Variable
2.3. Statistical Analysis
2.3.1. The Mediation Effect Test Model
2.3.2. Post Hoc Analyses
3. Results
3.1. Characteristics of the Samples
3.2. OLS Analysis (Model 1)
3.3. CSR Analysis (Models 2 and 3)
3.4. Bootstrap Analysis (Model 2)
3.5. Urban–Rural Heterogeneous Analysis
3.6. Post Hoc Analyses
3.6.1. Common Method Variance
3.6.2. Endogeneity Issues
3.6.3. Data Bias and Confounding Factor Interference
4. Discussion
4.1. Digital Inclusion Is a Health Booster
4.2. Cultural Capital Mediated the Effect of Digital Inclusion for Promoting Health
4.3. Digital Inclusion Risks Exacerbating Health Inequities between Urban and Rural Populations
4.4. Strengths and Limitations
5. Conclusions
Author Contributions
Funding
Institutional Review Board Statement
Informed Consent Statement
Data Availability Statement
Acknowledgments
Conflicts of Interest
References
- Locsin, R.C.; Soriano, G.P.; Juntasopeepun, P.; Kunaviktikul, W.; Evangelista, L.S. Social transformation and social isolation of older adults: Digital technologies, nursing, healthcare. Collegian 2021, 28, 551–558. [Google Scholar] [CrossRef] [PubMed]
- Peng, C. Digital Inclusive Finance Data Mining and Model-Driven Analysis of the Impact of Urban-Rural Income Gap. Wirel. Commun. Mob. Comput. 2022, 2022, 5820145. [Google Scholar] [CrossRef]
- Riggins, F.; Dewan, S. The Digital Divide: Current and Future Research Directions. J. Assoc. Inf. Syst. 2005, 6, 298–337. [Google Scholar] [CrossRef] [Green Version]
- Kan, K.; Heard-Garris, N.; Bendelow, A.; Morales, L.; Lewis-Thames, M.W.; Davis, M.M.; Heffernan, M. Examining Access to Digital Technology by Race and Ethnicity and Child Health Status Among Chicago Families. JAMA Netw. Open 2022, 5, e2228992. [Google Scholar] [CrossRef] [PubMed]
- Chen, W.; Yang, L.; Wang, X. Internet Use, Cultural Engagement, and Multi-Dimensional Health of Older Adults: A Cross-Sectional Study in China. Front. Public Health 2022, 10, 887840. [Google Scholar] [CrossRef]
- Kirsten, N.; Augustin, M.; Strömer, K. Digitale Gesundheitsanwendungen und Datenschutz. Der Hautarzt 2022, 73, 391–397. [Google Scholar] [CrossRef]
- Yu, F.; Peng, K.; Hu, X. Knowledge is money: Do people think cultural capital can be transformed into economic value? Psych J. 2021, 10, 87–95. [Google Scholar] [CrossRef]
- Bygren, L.O.; Johansson, S.; Konlaan, B.B.; Grjibovski, A.M.; Wilkinson, A.V.; Sjöström, M. Attending cultural events and cancer mortality: A Swedish cohort study. Arts Health 2009, 1, 64–73. [Google Scholar] [CrossRef]
- Xie, C.; Ma, Y. The mediating role of cultural capital in the relationship between socioeconomic status and student achievement in 14 economies. Br. Educ. Res. J. 2019, 45, 838–855. [Google Scholar] [CrossRef]
- Kraaykamp, G.; van Eijck, K. The Intergenerational Reproduction of Cultural Capital: A Threefold Perspective. Soc. Forces 2010, 89, 209–231. [Google Scholar] [CrossRef] [Green Version]
- Pan, H.; Chen, Z. Cultural capital and mediatory role of meaning-making in post-bereavement depression among older adults in rural China. Curr. Psychol. 2021. [Google Scholar] [CrossRef]
- Gagné, T.; Frohlich, K.L.; Abel, T. Cultural capital and smoking in young adults: Applying new indicators to explore social inequalities in health behaviour. Eur. J. Public Health 2015, 25, 818–823. [Google Scholar] [CrossRef] [PubMed] [Green Version]
- Xu, P.; Jiang, J. Individual Capital Structure and Health Behaviors among Chinese Middle-Aged and Older Adults: A Cross-Sectional Analysis Using Bourdieu’s Theory of Capitals. Int. J. Environ. Res. Public health 2020, 17, 7369. [Google Scholar] [CrossRef] [PubMed]
- Ten Kate, J.; de Koster, W.; van der Waal, J. Why are Depressive Symptoms More Prevalent Among The Less Educated? The Relevance of Low Cultural Capital and Cultural Entitlement. Sociol. Spectr. 2017, 37, 63–76. [Google Scholar] [CrossRef] [Green Version]
- van Druten, V.P.; Bartels, E.A.; van de Mheen, D.; de Vries, E.; Kerckhoffs, A.P.M.; Nahar-van Venrooij, L.M.W. Concepts of health in different contexts: A scoping review. BMC Health Serv. Res. 2022, 22, 389. [Google Scholar] [CrossRef] [PubMed]
- Adib-Hajbaghery, M.; Aghahoseini, S. The evaluation of disability and its related factors among the elderly population in Kashan, Iran. BMC Public Health 2007, 7, 261. [Google Scholar] [CrossRef] [PubMed] [Green Version]
- Cilesiz, S. Educational Computer Use in Leisure Contexts: A Phenomenological Study of Adolescents’ Experiences at Internet Cafés. Am. Educ. Res. J. 2009, 46, 232–274. [Google Scholar] [CrossRef]
- Liang, X.; Xiong, F.; Xie, F. The effect of smartphones on the self-rated health levels of the elderly. BMC Public Health 2022, 22, 508. [Google Scholar] [CrossRef]
- Huber, M.; van Vliet, M.; Giezenberg, M.; Winkens, B.; Heerkens, Y.; Dagnelie, P.C.; Knottnerus, J.A. Towards a ‘patient-centred’ operationalisation of the new dynamic concept of health: A mixed methods study. BMJ Open 2016, 6, e10091. [Google Scholar] [CrossRef] [Green Version]
- Tilbrook, N.; Shifrer, D. Field-specific cultural capital and persistence in college majors. Soc. Sci. Res. 2022, 103, 102654. [Google Scholar] [CrossRef]
- Hou, B.; Wu, Y.; Huang, S. Participating in health insurance and health improvements for the relatively poor population: A propensity score analysis. Front. Public Health 2022, 10, 968009. [Google Scholar] [CrossRef] [PubMed]
- Rojas, M. Experienced Poverty and Income Poverty in Mexico: A Subjective Well-Being Approach. World Dev. 2008, 36, 1078–1093. [Google Scholar] [CrossRef]
- Zhang, Y.; Su, D.; Chen, Y.; Tan, M.; Chen, X. Effect of socioeconomic status on the physical and mental health of the elderly: The mediating effect of social participation. BMC Public Health 2022, 22, 605. [Google Scholar] [CrossRef] [PubMed]
- Baron, R.M.; Kenny, D.A. The moderator-mediator variable distinction in social psychological research: Conceptual, strategic, and statistical considerations. J. Pers. Soc. Psychol. 1986, 51, 1173–1182. [Google Scholar] [CrossRef]
- Berndt, N.C.; Hayes, A.F.; Verboon, P.; Lechner, L.; Bolman, C.; De Vries, H. Self-efficacy mediates the impact of craving on smoking abstinence in low to moderately anxious patients: Results of a moderated mediation approach. Psychol. Addict. Behav. 2013, 27, 113–124. [Google Scholar] [CrossRef] [Green Version]
- Singh-Manoux, A.; Marmot, M.G.; Adler, N.E. Does Subjective Social Status Predict Health and Change in Health Status Better Than Objective Status? Psychosom. Med. 2005, 67, 855–861. [Google Scholar] [CrossRef]
- Fiedler, S.; Krüger, N.; Daseking, M. Structural Equation Modeling of Common Cognitive Abilities in Preschool-Aged Children Using WPPSI-IV and BRIEF-P. Children 2022, 9, 1089. [Google Scholar] [CrossRef]
- Angrist, J.D.; Pischke, J.R. Mostly Harmless Econometrics: An Empiricist’s Companion. Eur. Rev. Agric. Econ. 2011, 38, 281–283. [Google Scholar] [CrossRef]
- Fortney, J.C.; Steffick, D.E.; Burgess, J.F.; Maciejewski, M.L.; Petersen, L.A. Are Primary Care Services a Substitute or Complement for Specialty and Inpatient Services? Health Serv. Res. 2005, 40, 1422–1442. [Google Scholar] [CrossRef] [Green Version]
- Thompson, C.A.; Hay, J.W. Estimating the association between metabolic risk factors and marijuana use in U.S. adults using data from the continuous National Health and Nutrition Examination Survey. Ann. Epidemiol. 2015, 25, 486–491. [Google Scholar] [CrossRef]
- Sun, J.; Lyu, S. Does Health Insurance Lead to Improvement of Health Status Among Chinese Rural Adults? Evidence From the China Family Panel Studies. Int. J. Health Serv. 2020, 50, 350–359. [Google Scholar] [CrossRef]
- IBM Corp. IBM SPSS Statistics for Windows, Version 25.0; IBM Corp.: Armonk, NY, USA, 2017. [Google Scholar]
- StataCorp. Stata Statistical Software: Release 15; StataCorp LLC: College Station, TX, USA, 2017. [Google Scholar]
- Văidean, V.L.; Achim, M.V. When more is less: Do information and communication technologies (ICTs) improve health outcomes? An empirical investigation in a non-linear framework. Socio-Econ. Plan. Sci. 2022, 80, 101218. [Google Scholar] [CrossRef]
- Farooq, S.; Taylor, C.D.; Gire, N.; Riley, M.; Caton, N.; Husain, N. Digital inclusion: The concept and strategies for people with mental health difficulties. Aust. N. Z. J. Psychiatry 2015, 49, 772–773. [Google Scholar] [CrossRef]
- Rantanen, T.; Gluschkoff, K.; Silvennoinen, P.; Heponiemi, T. The Associations Between Mental Health Problems and Attitudes Toward Web-Based Health and Social Care Services: Evidence from a Finnish Population-Based Study. J. Med. Internet Res. 2021, 23, e28066. [Google Scholar] [CrossRef]
- Jones, R.B.; Ashurst, E.J.; Atkey, J.; Duffy, B. Older People Going Online: Its Value and Before-After Evaluation of Volunteer Support. J. Med. Internet Res. 2015, 17, e122. [Google Scholar] [CrossRef]
- Ghouse, G.; Aslam, A.; Bhatti, M.I. The Impact of the Environment, Digital–Social Inclusion, and Institutions on Inclusive Growth: A Conceptual and Empirical Analysis. Energies 2022, 15, 7098. [Google Scholar] [CrossRef]
- Keesara, S.; Jonas, A.; Schulman, K. COVID-19 and Health Care’s Digital Revolution. N. Engl. J. Med. 2020, 382, e82. [Google Scholar] [CrossRef] [PubMed]
- Cano-Hila, A.B.; Argemí-Baldich, R. Early Childhood and Lockdown: The Challenge of Building a Virtual Mutual Support Network between Children, Families and School for Sustainable Education and Increasing Their Well-Being. Sustainability 2021, 13, 3654. [Google Scholar] [CrossRef]
- Goldfarb, A.; Tucker, C. Digital Economics. J. Econ. Lit. 2019, 57, 3–43. [Google Scholar] [CrossRef] [Green Version]
- Li, M.; Guo, X.; Zhang, L. Digitalization, Cultural Capital and Productivity: Evidence from Resource-based Enterprises in China. In Proceedings of the 2nd International Conference on Big Data Economy and Information Management, Sanya, China, 3–5 December 2021; pp. 36–41. [Google Scholar]
- Willekens, M.; Lievens, J. Who participates and how much? Explaining non-attendance and the frequency of attending arts and heritage activities. Poetics 2016, 56, 50–63. [Google Scholar] [CrossRef]
- Ma, A.S. Social networks, cultural capital and attachment to the host city: Comparing overseas Chinese students and foreign students in Taipei. Asia Pac. Viewp. 2014, 55, 226–241. [Google Scholar] [CrossRef]
- Leonhardt, M.; Brodahl, M.; Cogan, N.; Lien, L. How did the first COVID-19 lockdown affect persons with concurrent mental health and substance use disorders in Norway? A qualitative study. BMC Psychiatry 2022, 22, 179. [Google Scholar] [CrossRef]
- Khawaja, M.; Mowafi, M. Cultural Capital and Self-Rated Health in Low Income Women: Evidence from the Urban Health Study, Beirut, Lebanon. J. Urban Health 2006, 83, 444–458. [Google Scholar] [CrossRef] [PubMed]
- Saville, C.; Mann, R. Cross-level group density interactions on mental health for cultural, but not economic, components of social class. Soc. Sci. Med. 2022, 296, 114790. [Google Scholar] [CrossRef] [PubMed]
- Pinxten, W.; Lievens, J. The importance of economic, social and cultural capital in understanding health inequalities: Using a Bourdieu-based approach in research on physical and mental health perceptions. Sociol. Health Illn. 2014, 36, 1095–1110. [Google Scholar] [CrossRef] [PubMed] [Green Version]
- Wan, Y.; Hu, W.; Hu, H. Understanding nutritional intake of Chinese farmers from the perspective of sustainable livelihood analysis. Environ. Sci. Pollut. Res. 2021, 28, 33632–33648. [Google Scholar] [CrossRef]
- Haenssgen, M.J. The struggle for digital inclusion: Phones, healthcare, and marginalisation in rural India. World Dev. 2018, 104, 358–374. [Google Scholar] [CrossRef] [Green Version]
- Kaihlanen, A.; Virtanen, L.; Buchert, U.; Safarov, N.; Valkonen, P.; Hietapakka, L.; Hörhammer, I.; Kujala, S.; Kouvonen, A.; Heponiemi, T. Towards digital health equity-a qualitative study of the challenges experienced by vulnerable groups in using digital health services in the COVID-19 era. BMC Health Serv. Res. 2022, 22, 188. [Google Scholar] [CrossRef]
- Sieck, C.J.; Sheon, A.; Ancker, J.S.; Castek, J.; Callahan, B.; Siefer, A. Digital inclusion as a social determinant of health. NPJ Digit. Med. 2021, 4, 52. [Google Scholar] [CrossRef]
- Richardson, S.; Lawrence, K.; Schoenthaler, A.M.; Mann, D. A framework for digital health equity. NPJ Digit. Med. 2022, 5, 119. [Google Scholar] [CrossRef]


| Variables | Category | Descriptions | Mean | Standard Deviation |
|---|---|---|---|---|
| Dependent variables | Physical health | Ranging from 1 to 5 | 3.80 | 0.973 |
| Psychical health | Ranging from 2 to 10 | 8.09 | 1.365 | |
| Social adaptability | Ranging from 0 to 3 | 0.75 | 0.934 | |
| Independent variables | Digital inclusion | Ranging from 0 to 25 | 16.64 | 6.201 |
| Mediating variables | Cultural capital | Ranging from 0 to 15 | 9.33 | 2.821 |
| Control variables | Living region | Eastern area = 1, Central area = 2, Western area = 3 | 1.64 | 0.796 |
| Census register | 0 = Rural, Urban = 1 | 0.48 | 0.500 | |
| Gender | Female = 0, Male = 1 | 0.50 | 0.500 | |
| Age | Ranging from 18 to 86 | 41.40 | 14.012 | |
| Race | Minority = 0, Han = 1 | 0.94 | 0.246 | |
| Marital status | Not “married with spouse” = 0, Married with spouse = 1 | 0.75 | 0.433 | |
| Religion | Nonreligious = 0, Religious = 1 | 0.09 | 0.282 | |
| Family income | Poor = 1, General = 2, Rich = 3 | 1.72 | 0.614 | |
| Working status | Jobless = 0, Working = 1 | 0.67 | 0.471 |
| Variables | Category | N | Percentage (%) |
|---|---|---|---|
| Living region | Eastern area | 1255 | 55.70 |
| Central area | 543 | 24.10 | |
| Western area | 455 | 20.20 | |
| Census register | Rural | 1173 | 52.06 |
| Urban | 1080 | 47.94 | |
| Gender | Female | 1127 | 50.02 |
| Male | 1126 | 49.98 | |
| Age | From 18 to 44 | 1348 | 59.83 |
| From 45 to 64 | 762 | 33.82 | |
| At least 65 | 143 | 6.35 | |
| Race | Minority | 146 | 6.48 |
| Han | 2107 | 93.52 | |
| Marital status | Not “married with spouse” | 561 | 24.90 |
| Married with spouse | 1692 | 75.10 | |
| Religion | Nonreligious | 2057 | 91.30 |
| Religious | 196 | 8.70 | |
| Family income | Poor | 820 | 36.40 |
| Average | 1234 | 54.77 | |
| Good | 199 | 8.83 | |
| Working status | Jobless | 747 | 33.16 |
| Working | 1506 | 66.84 |
| Variables | Physical Health | Psychical Health | Social Adaptability | |||
|---|---|---|---|---|---|---|
| β | p-Value | β | p-Value | β | p-Value | |
| Digital inclusion | 0.019 *** | <0.001 | 0.017 *** | 0.004 | 0.033 *** | <0.001 |
| Living region | −0.086 *** | 0.001 | −0.251 *** | <0.001 | 0.104 *** | <0.001 |
| Census register | −0.017 | 0.67 | 0.020 | 0.74 | 0.213 *** | <0.001 |
| Gender | 0.115 *** | 0.003 | 0.113 ** | 0.05 | 0.108 *** | 0.005 |
| Age | −0.019 *** | <0.001 | 0.012 *** | <0.001 | 0.006 *** | 0.003 |
| Race | 0.047 | 0.56 | −0.166 | 0.17 | −0.079 | 0.29 |
| Marital status | 0.084 * | 0.07 | 0.300 *** | <0.001 | −0.146 *** | 0.004 |
| Religion | 0.029 | 0.69 | −0.102 | 0.35 | 0.169 ** | 0.01 |
| Family income | 0.284 *** | <0.001 | 0.220 *** | <0.001 | 0.242 *** | <0.001 |
| Working status | 0.168 *** | <0.001 | −0.144 ** | 0.02 | −0.013 | 0.76 |
| Constant terms | 3.628 *** | <0.001 | 7.333 *** | <0.001 | −0.601 *** | <0.001 |
| Sample size | 2253 | 2253 | 2253 | |||
| R2 | 0.179 | 0.077 | 0.108 | |||
| Variables | Cultural Capital | Physical Health | Psychical Health | Social Adaptability | ||||
|---|---|---|---|---|---|---|---|---|
| β | p-Value | β | p-Value | β | p-Value | β | p-Value | |
| Cultural capital | NA | 0.019 ** | 0.03 | 0.001 | 0.91 | 0.124 *** | <0.001 | |
| Digital inclusion | 0.184 *** | <0.001 | 0.016 *** | <0.001 | 0.017 *** | 0.007 | 0.010 ** | 0.01 |
| Control variables | Yes | Yes | Yes | Yes | ||||
| Constant terms | 5.069 *** | <0.001 | 3.533 *** | <0.001 | 7.326 *** | <0.001 | −1.229 *** | <0.001 |
| Sample size | 2253 | 2253 | 2253 | 2253 | ||||
| R2 | 0.394 | 0.181 | 0.077 | 0.193 | ||||
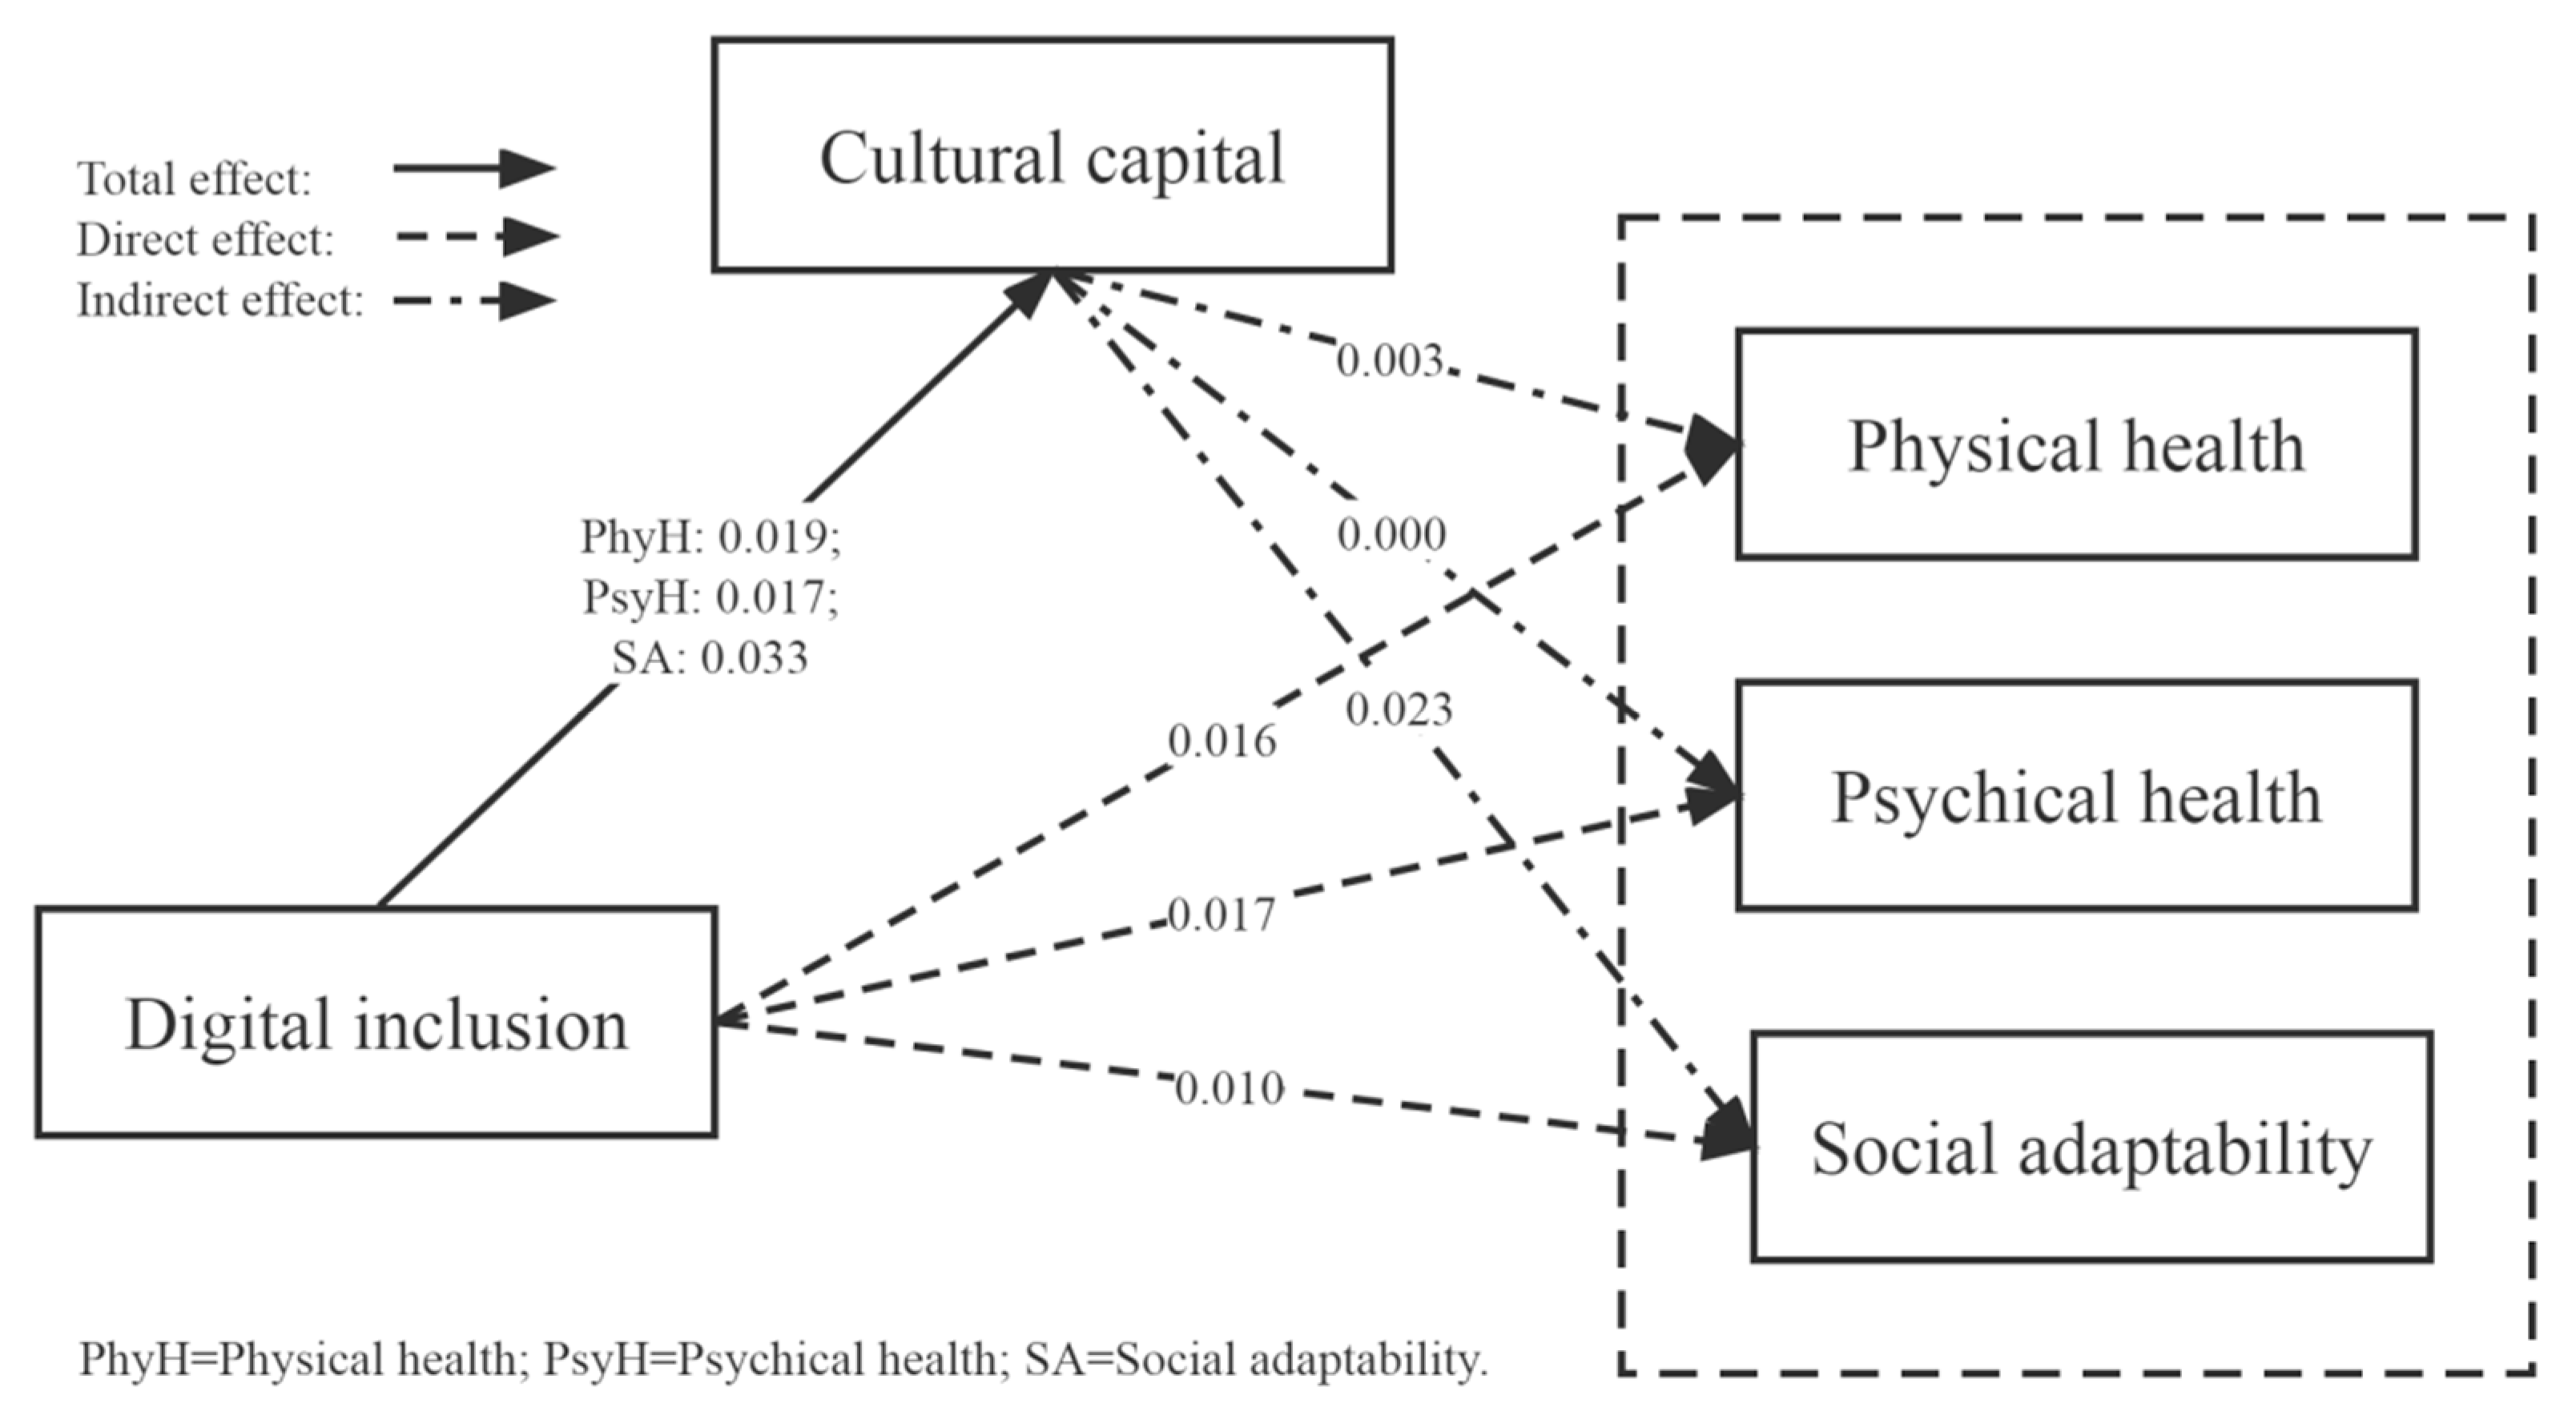
| Variables | DI→(CC→) PhyH | DI→(CC→) PsyH | DI→(CC→) SA | |||
|---|---|---|---|---|---|---|
| Coefficient | 95% CI | Coefficient | 95% CI | Coefficient | 95% CI | |
| Direct effect | 0.016 | [0.008–0.024] | 0.017 | [0.005–0.029] | 0.010 | [0.002–0.018] |
| Indirect effect | 0.003 | [0.003–0.042] | 0.000 | [−0.018–0.024] | 0.023 | [0.128–0.177] |
| Total effect | 0.019 | [0.012–0.027] | 0.017 | [0.006–0.028] | 0.033 | [0.025–0.040] |
| Proportion of mediating effect | 17.88% | 0 | 69.81% | |||
| Variables | Rural (N = 1173) | Urban (N = 1080) | ||||||
|---|---|---|---|---|---|---|---|---|
| Mean | Standard Deviation | Minimum | Maximum | Mean | Standard Deviation | Minimum | Maximum | |
| Physical health | 3.82 | 1.006 | 1 | 5 | 3.78 | 0.937 | 1 | 5 |
| Psychical health | 7.97 | 1.314 | 5 | 10 | 8.22 | 1.379 | 4 | 10 |
| Social adaptability | 0.60 | 0.871 | 0 | 3 | 0.91 | 0.974 | 0 | 3 |
| Digital inclusion | 15.75 | 6.523 | 0 | 25 | 17.60 | 5.681 | 0 | 25 |
| Cultural capital | 8.35 | 2.808 | 1 | 14 | 10.39 | 2.423 | 2 | 15 |
| Variables | Physical Health | Psychical Health | Social Adaptability | |||||||||
|---|---|---|---|---|---|---|---|---|---|---|---|---|
| Urban | Rural | Urban | Rural | Urban | Rural | |||||||
| β | p-Value | β | p-Value | β | p-Value | β | p-Value | β | p-Value | β | p-Value | |
| Digital inclusion | 0.023 *** | <0.001 | 0.015 ** | 0.01 | 0.018 ** | 0.05 | 0.013 * | 0.08 | 0.034 *** | <0.001 | 0.034 *** | <0.001 |
| Control variables | Yes | Yes | Yes | Yes | Yes | Yes | ||||||
| Constant terms | 3.357 *** | <0.001 | 3.913 *** | <0.001 | 7.401 *** | <0.001 | 7.359 *** | <0.001 | −0.373 | 0.15 | −0.635 *** | 0.002 |
| Sample size | 1080 | 1173 | 1080 | 1173 | 1080 | 1173 | ||||||
| R2 | 0.191 | 0.179 | 0.073 | 0.067 | 0.085 | 0.091 | ||||||
Disclaimer/Publisher’s Note: The statements, opinions and data contained in all publications are solely those of the individual author(s) and contributor(s) and not of MDPI and/or the editor(s). MDPI and/or the editor(s) disclaim responsibility for any injury to people or property resulting from any ideas, methods, instructions or products referred to in the content. |
© 2023 by the authors. Licensee MDPI, Basel, Switzerland. This article is an open access article distributed under the terms and conditions of the Creative Commons Attribution (CC BY) license (https://creativecommons.org/licenses/by/4.0/).
Share and Cite
Sun, Z.; Sun, W.; Gao, H.; Fa, R.; Chen, S.; Qian, D. Digital Inclusion, Cultural Capital, and Health Status of Urban and Rural Residents: An Empirical Study Based on 2017 CGSS Database. Int. J. Environ. Res. Public Health 2023, 20, 4022. https://doi.org/10.3390/ijerph20054022
Sun Z, Sun W, Gao H, Fa R, Chen S, Qian D. Digital Inclusion, Cultural Capital, and Health Status of Urban and Rural Residents: An Empirical Study Based on 2017 CGSS Database. International Journal of Environmental Research and Public Health. 2023; 20(5):4022. https://doi.org/10.3390/ijerph20054022
Chicago/Turabian StyleSun, Zhenyu, Wei Sun, Hongliang Gao, Ruobing Fa, Shaofan Chen, and Dongfu Qian. 2023. "Digital Inclusion, Cultural Capital, and Health Status of Urban and Rural Residents: An Empirical Study Based on 2017 CGSS Database" International Journal of Environmental Research and Public Health 20, no. 5: 4022. https://doi.org/10.3390/ijerph20054022