
A Model for Predicting and Grading the Quality of Grain Storage Processes Affected by Microorganisms under Different Environments


Abstract
1. Introduction
2. Literature Review
2.1. Factors Affecting the Quality of Wheat and Corn during Storage
2.2. Overview of Prediction Methods
3. Methodology and Study Area
3.1. Data Source
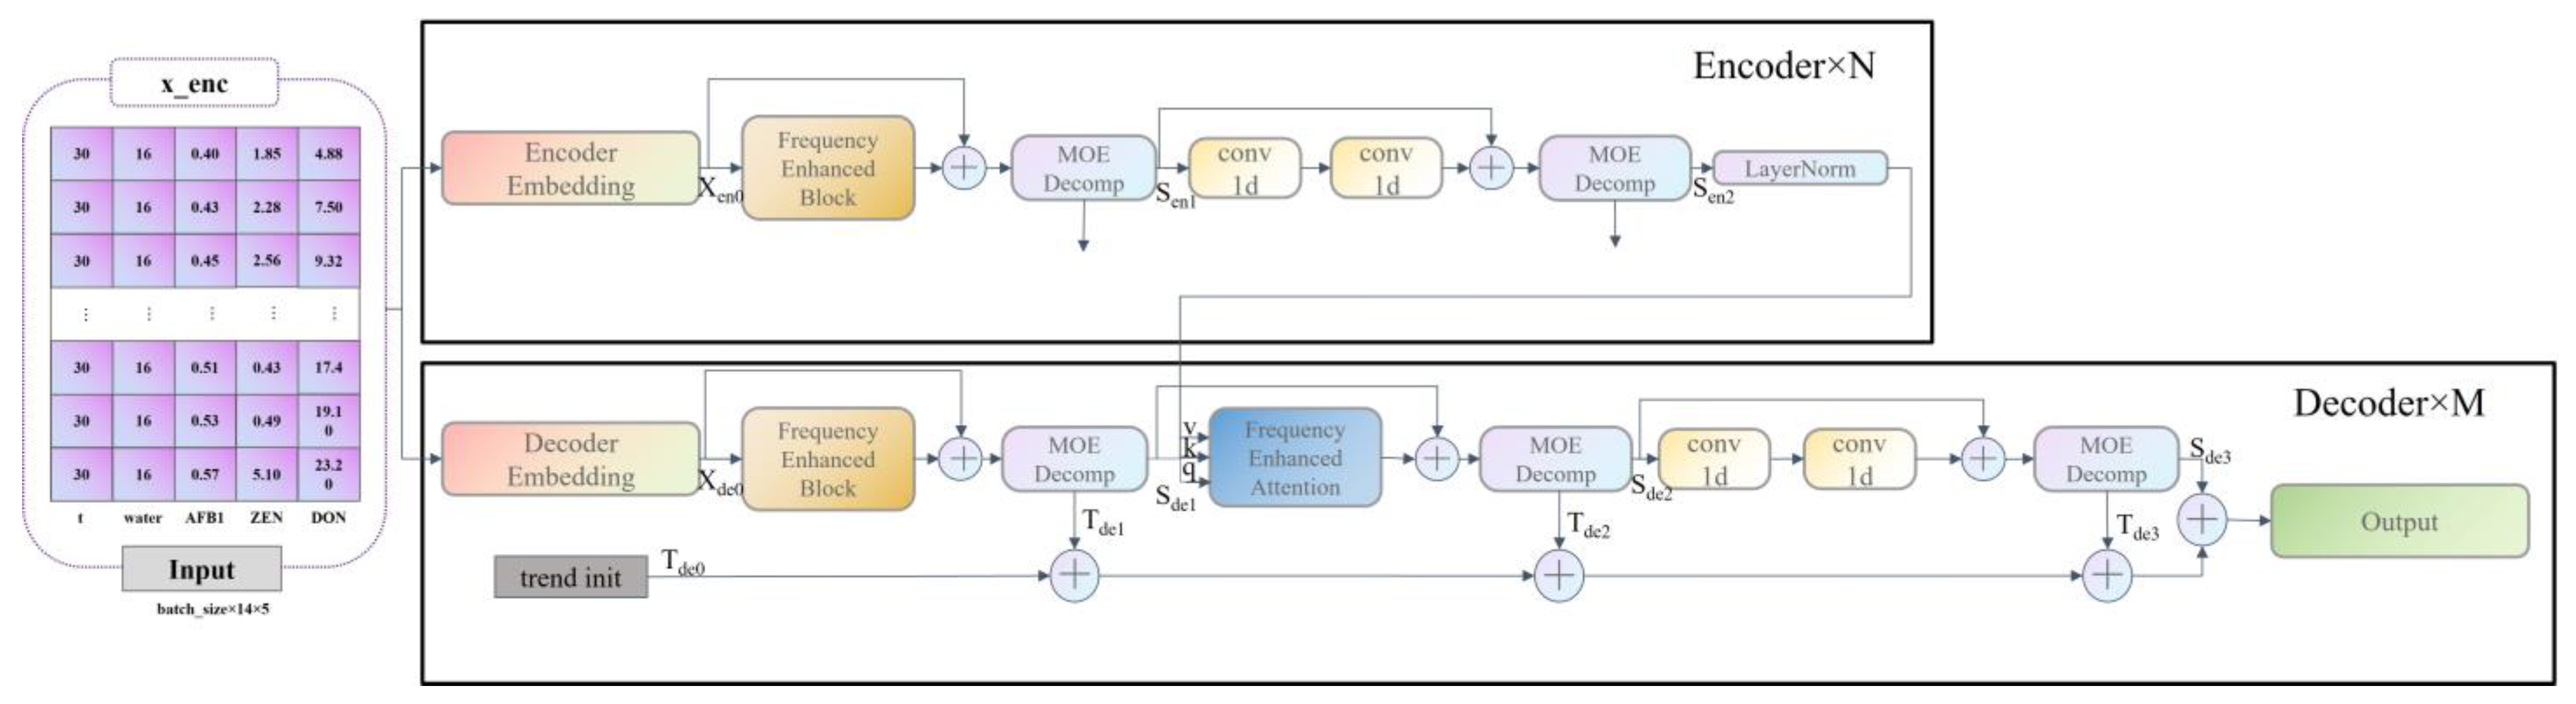
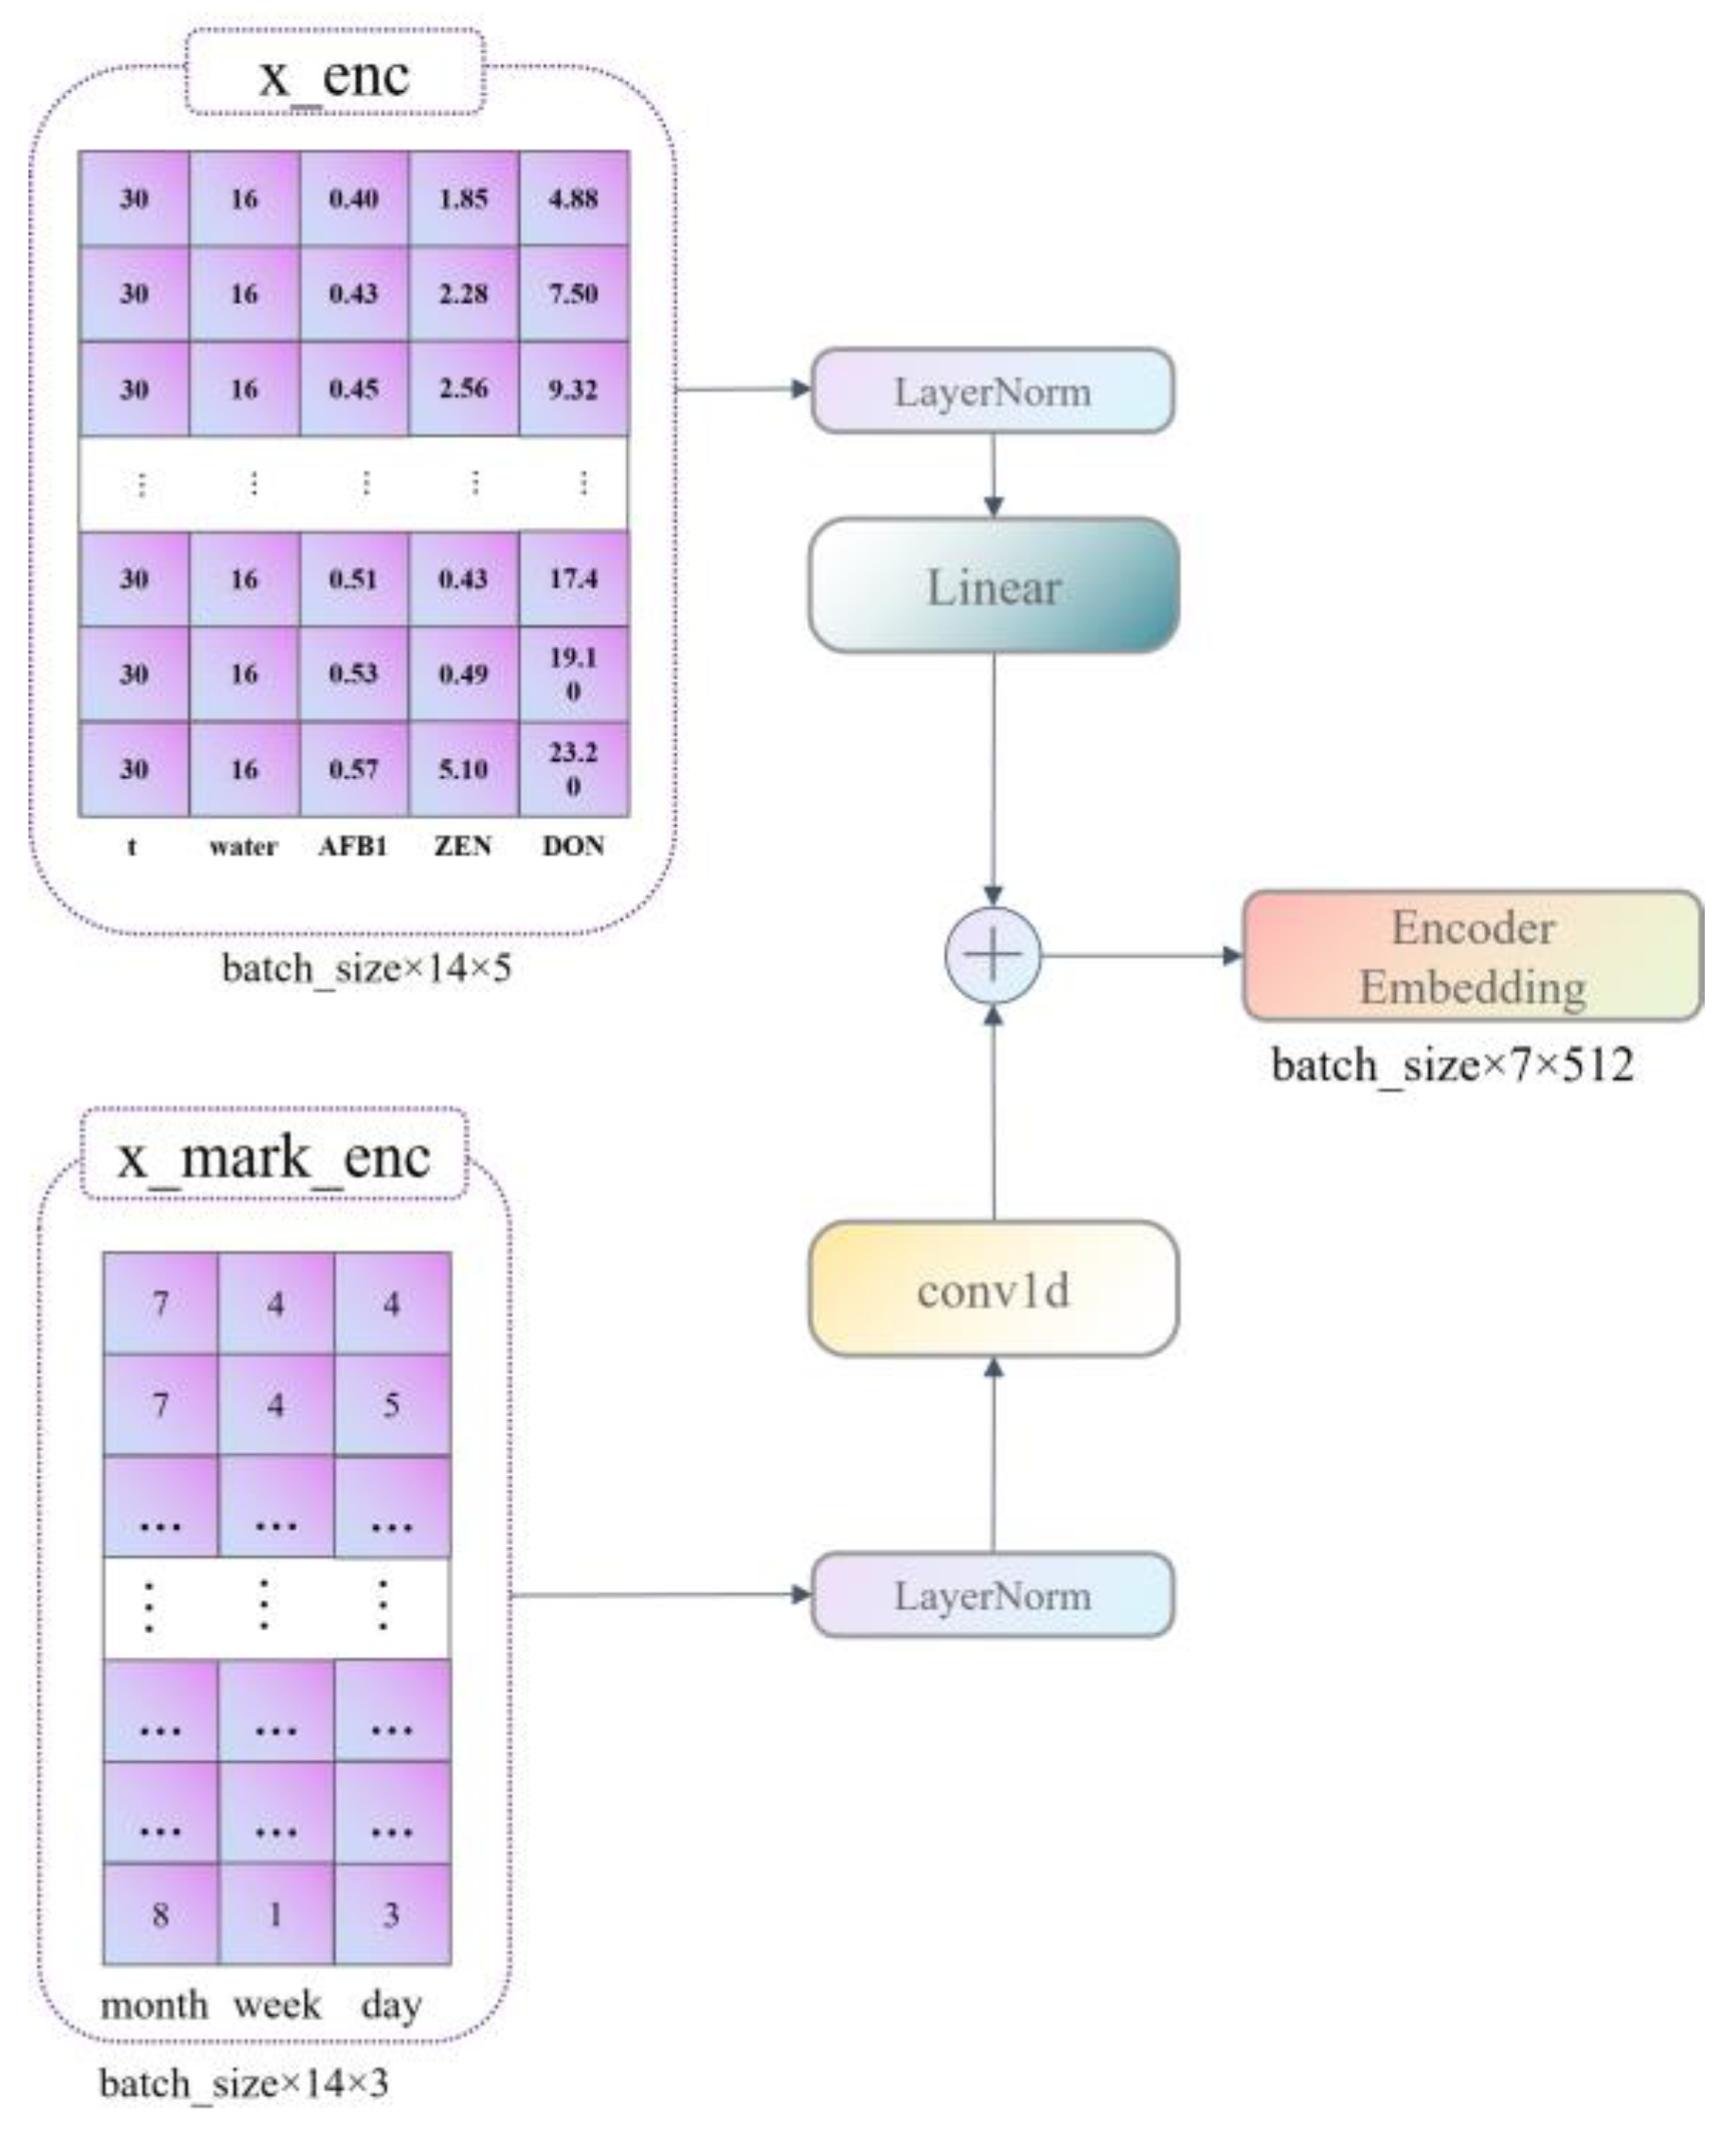
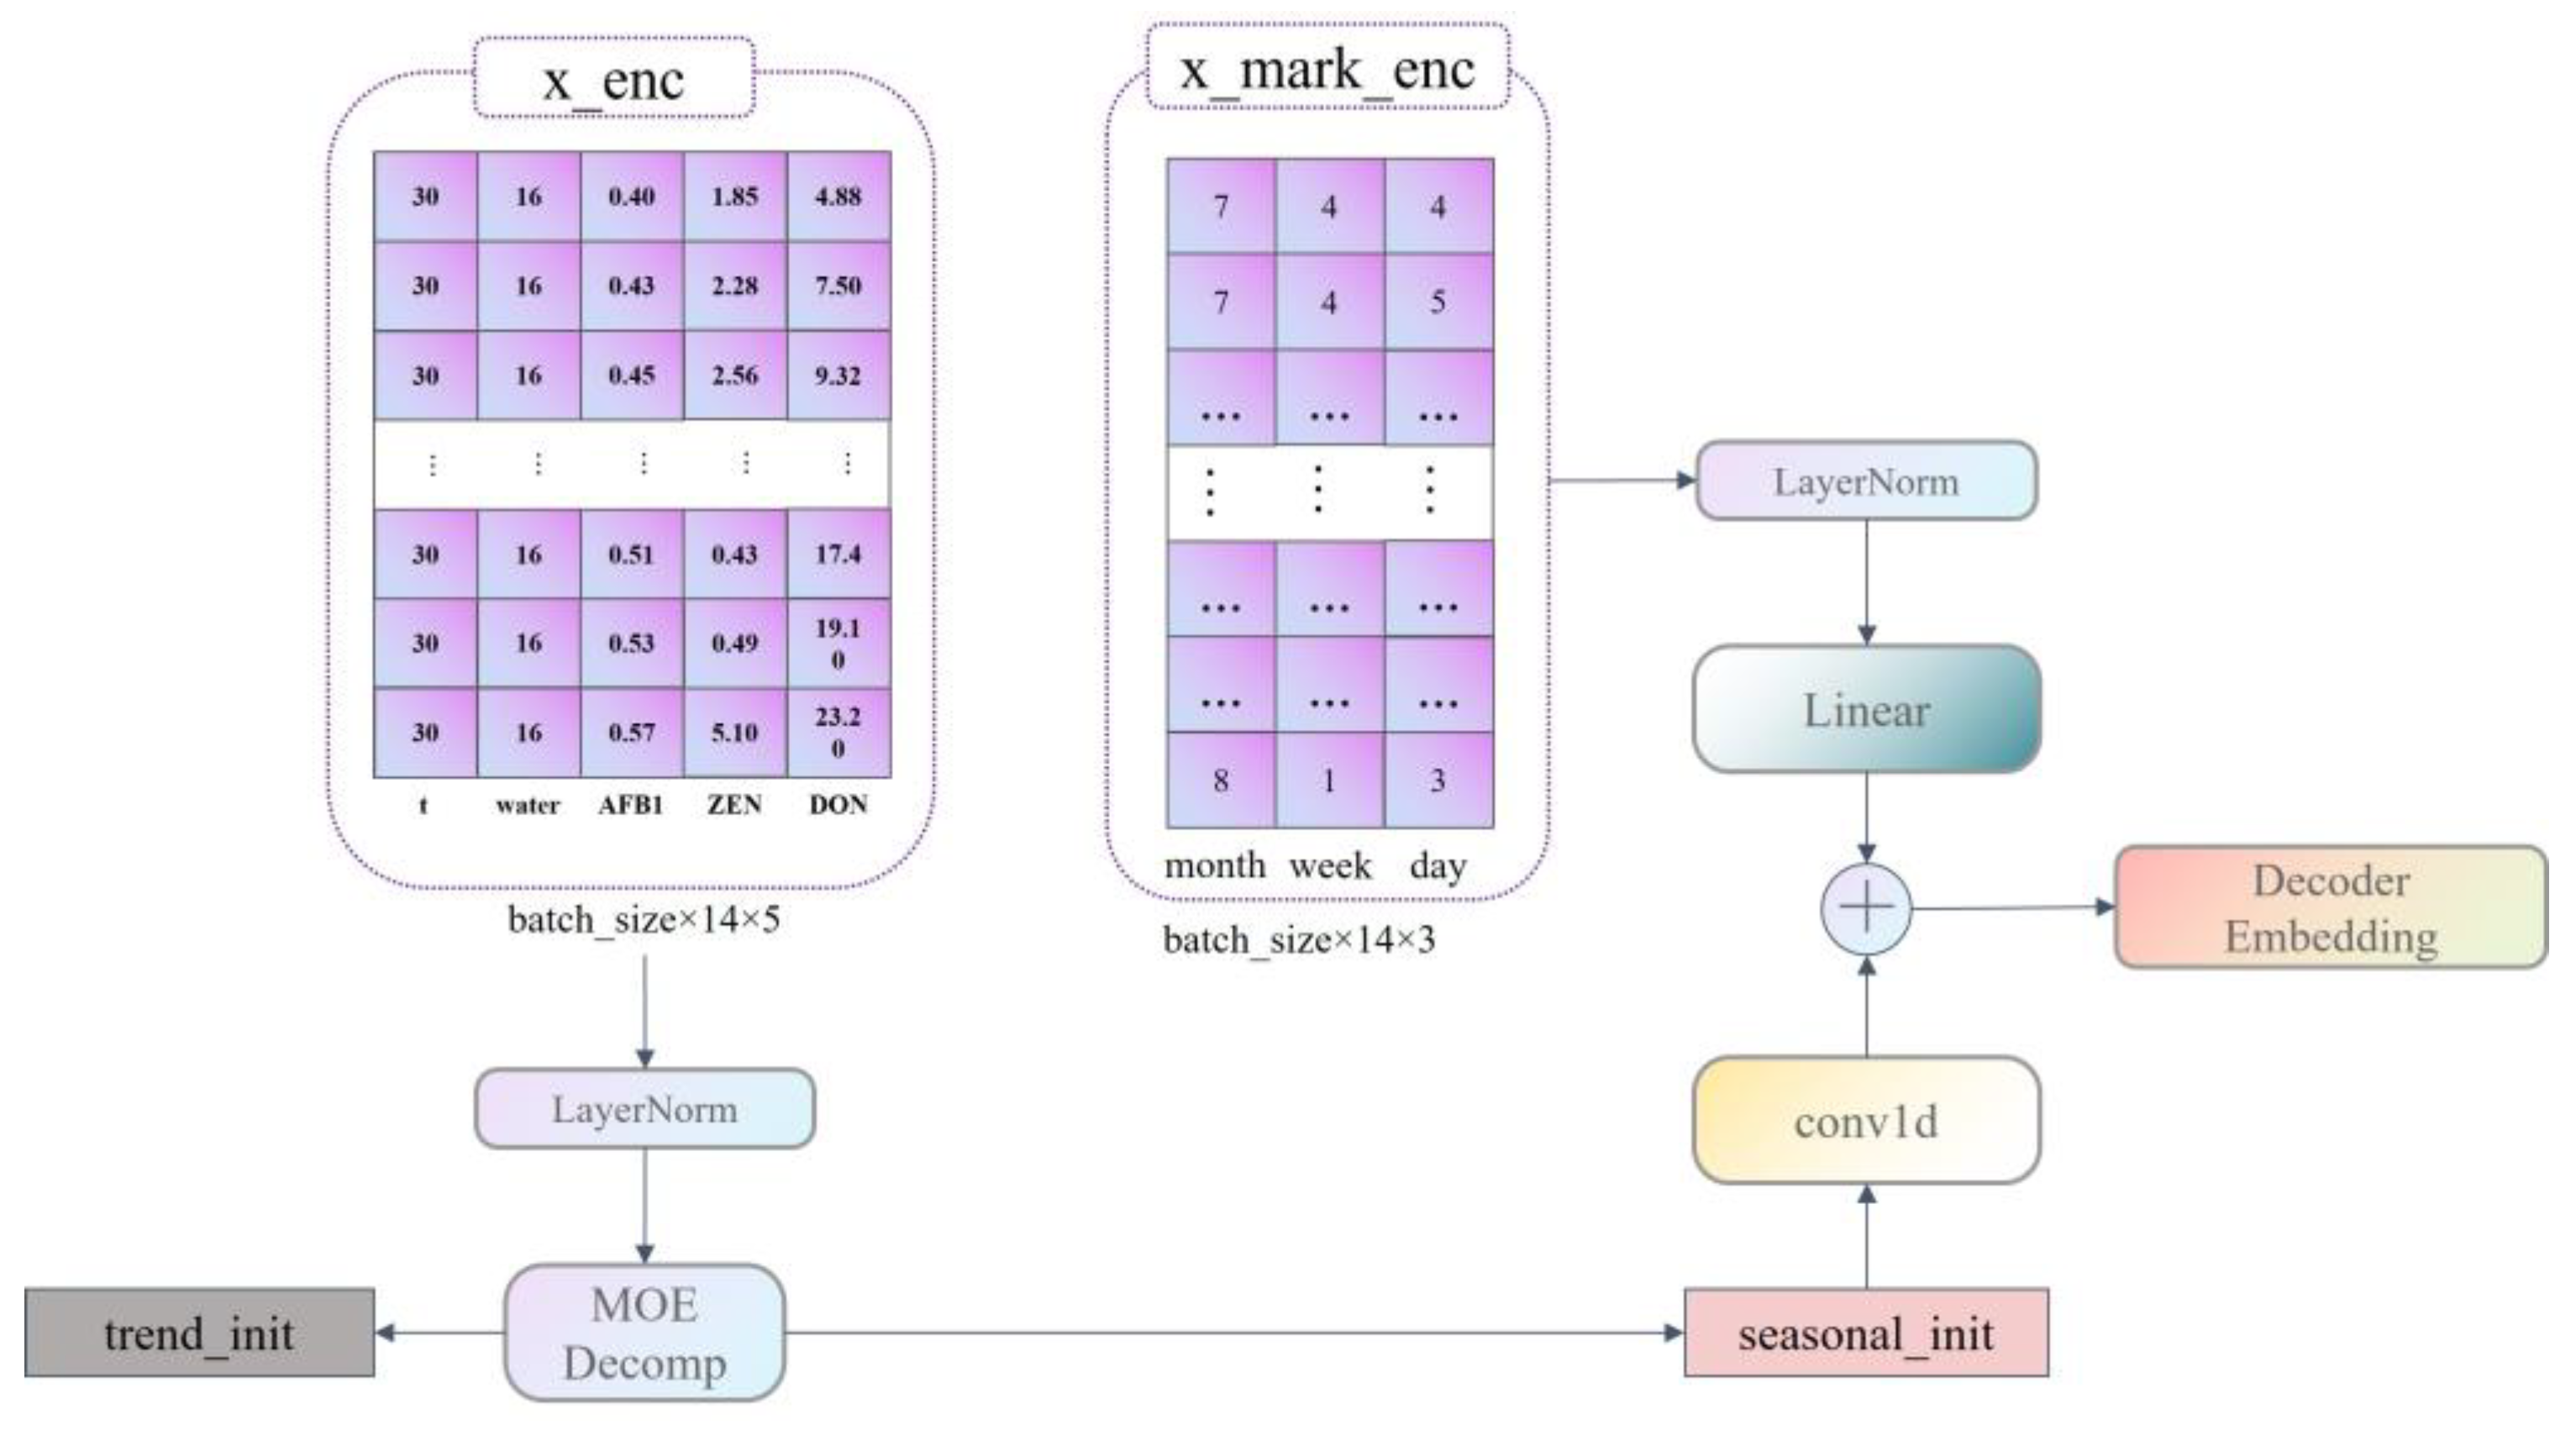
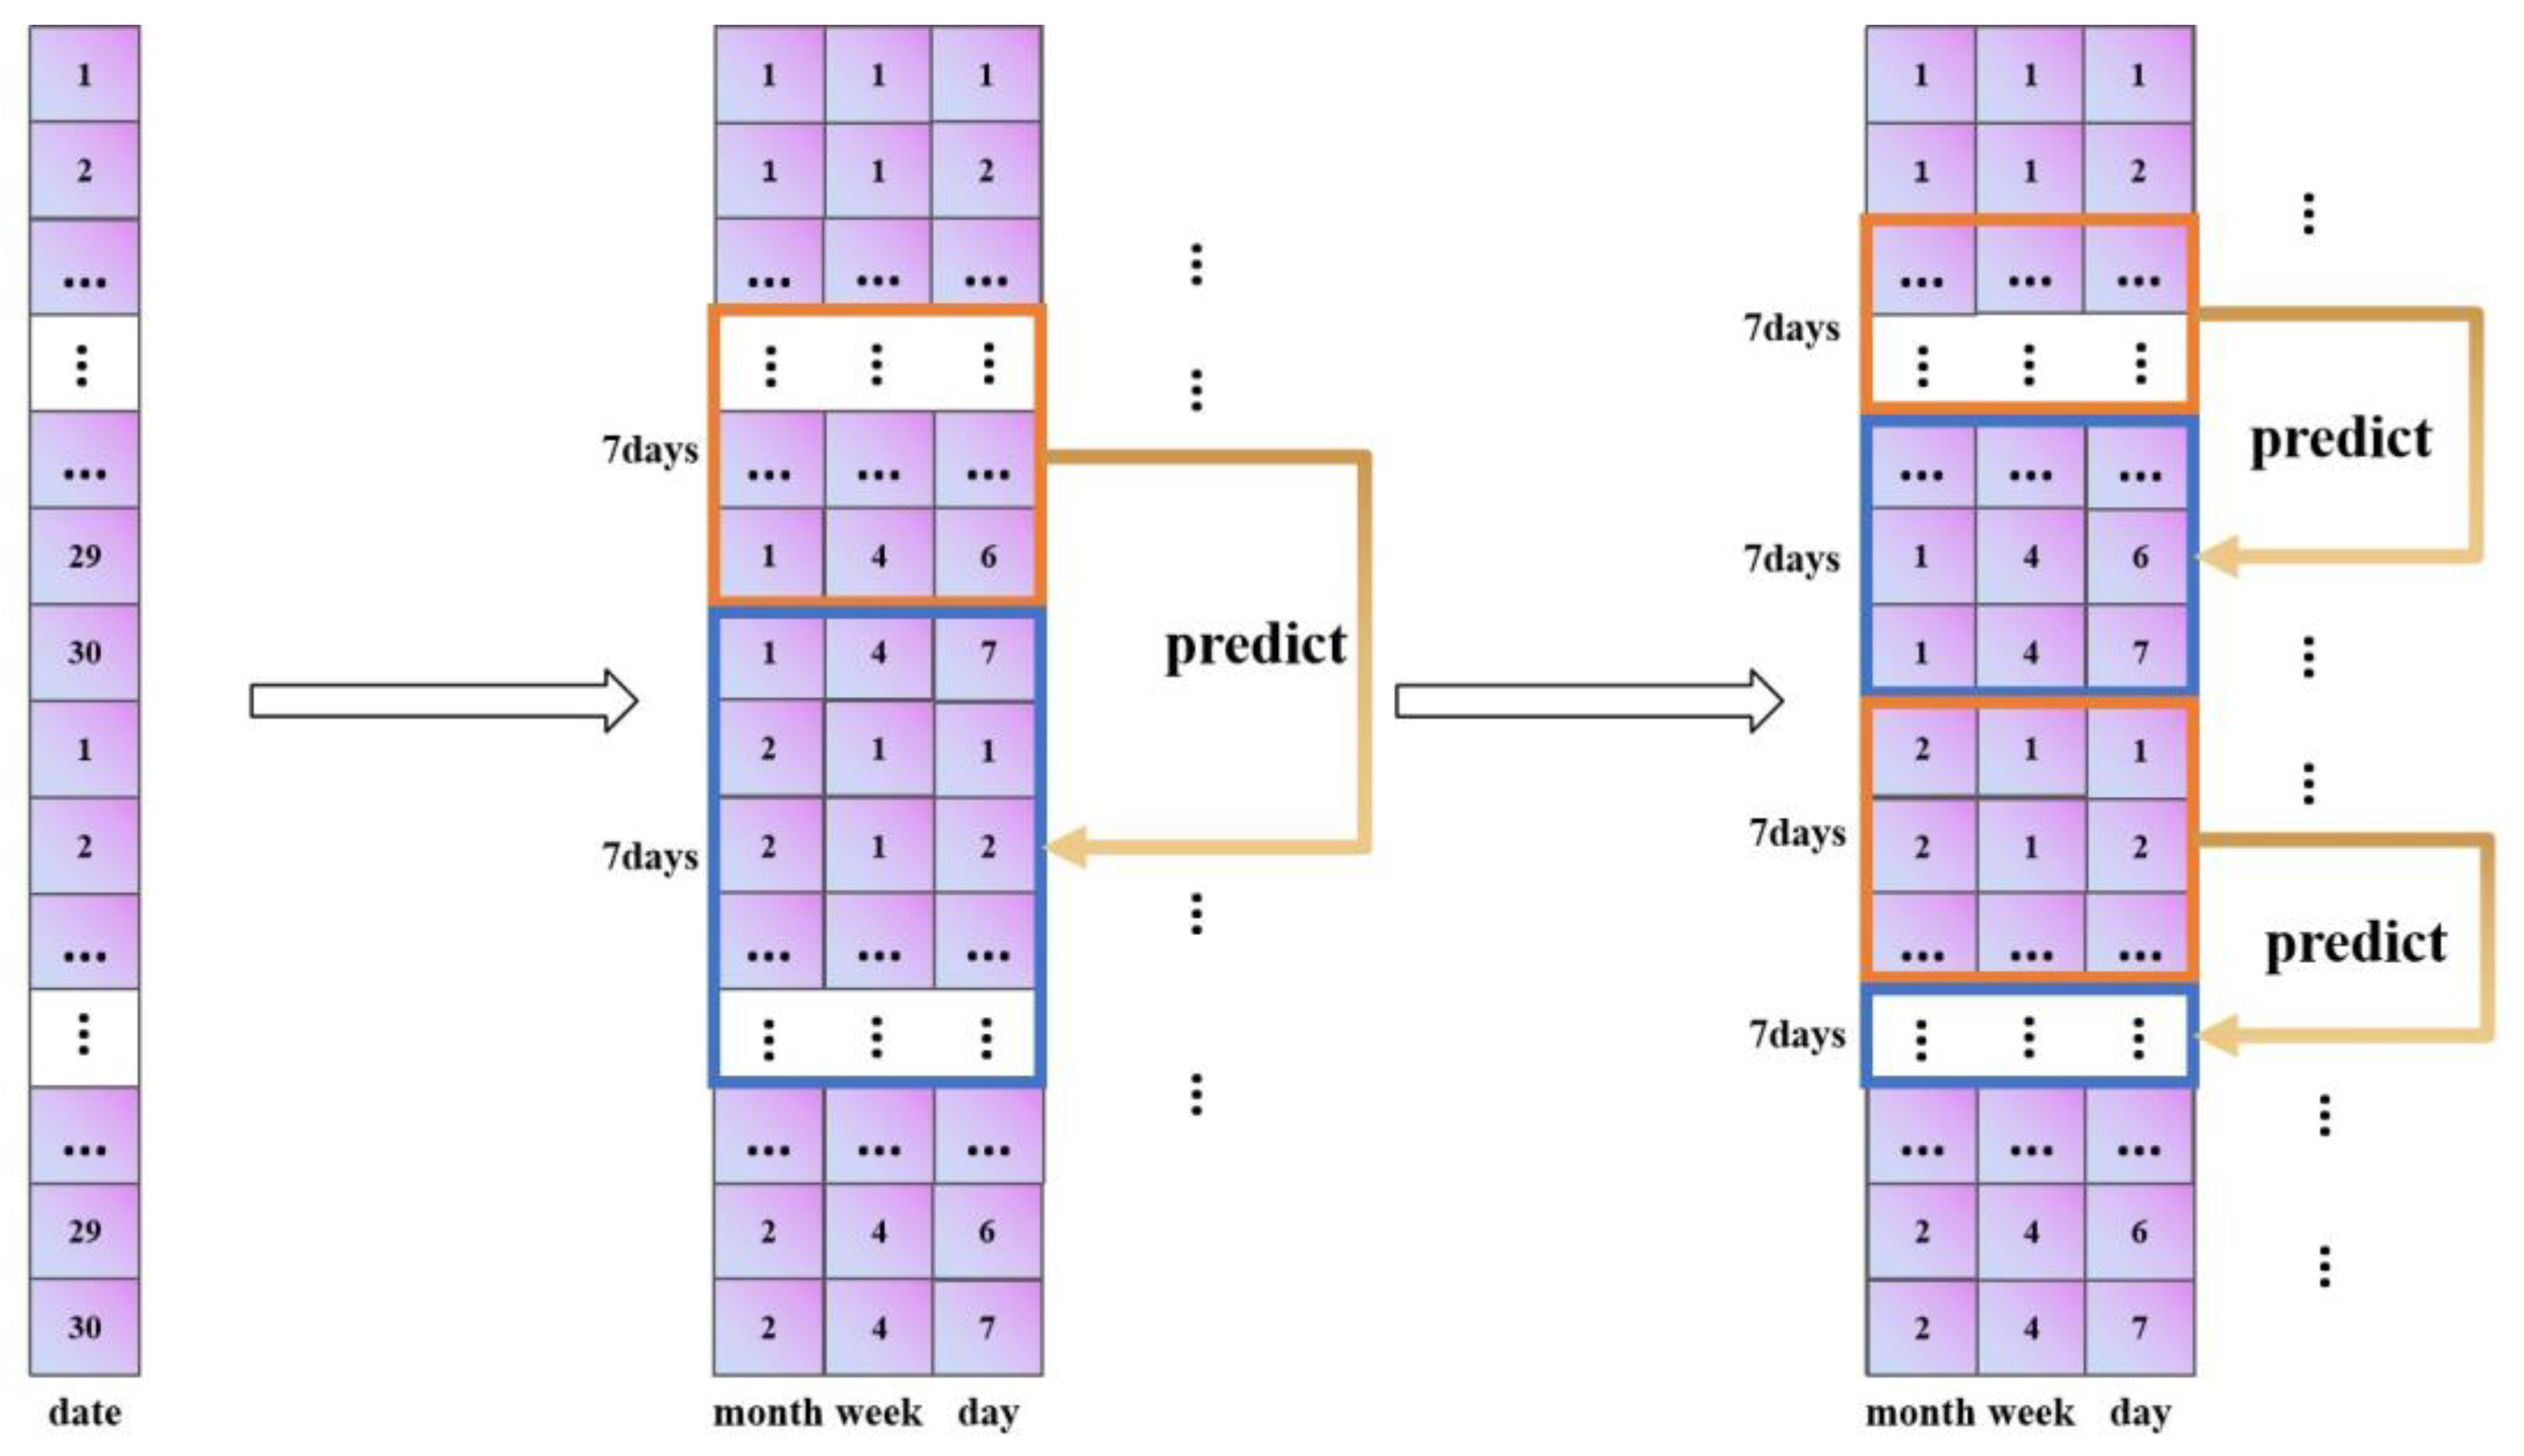
3.2. FEDformer-Based Model for Predicting Quality Changes in Grain Storage Processes
3.2.1. Model Fundamentals
3.2.2. Model for Predicting Quality Changes during Grain Storage
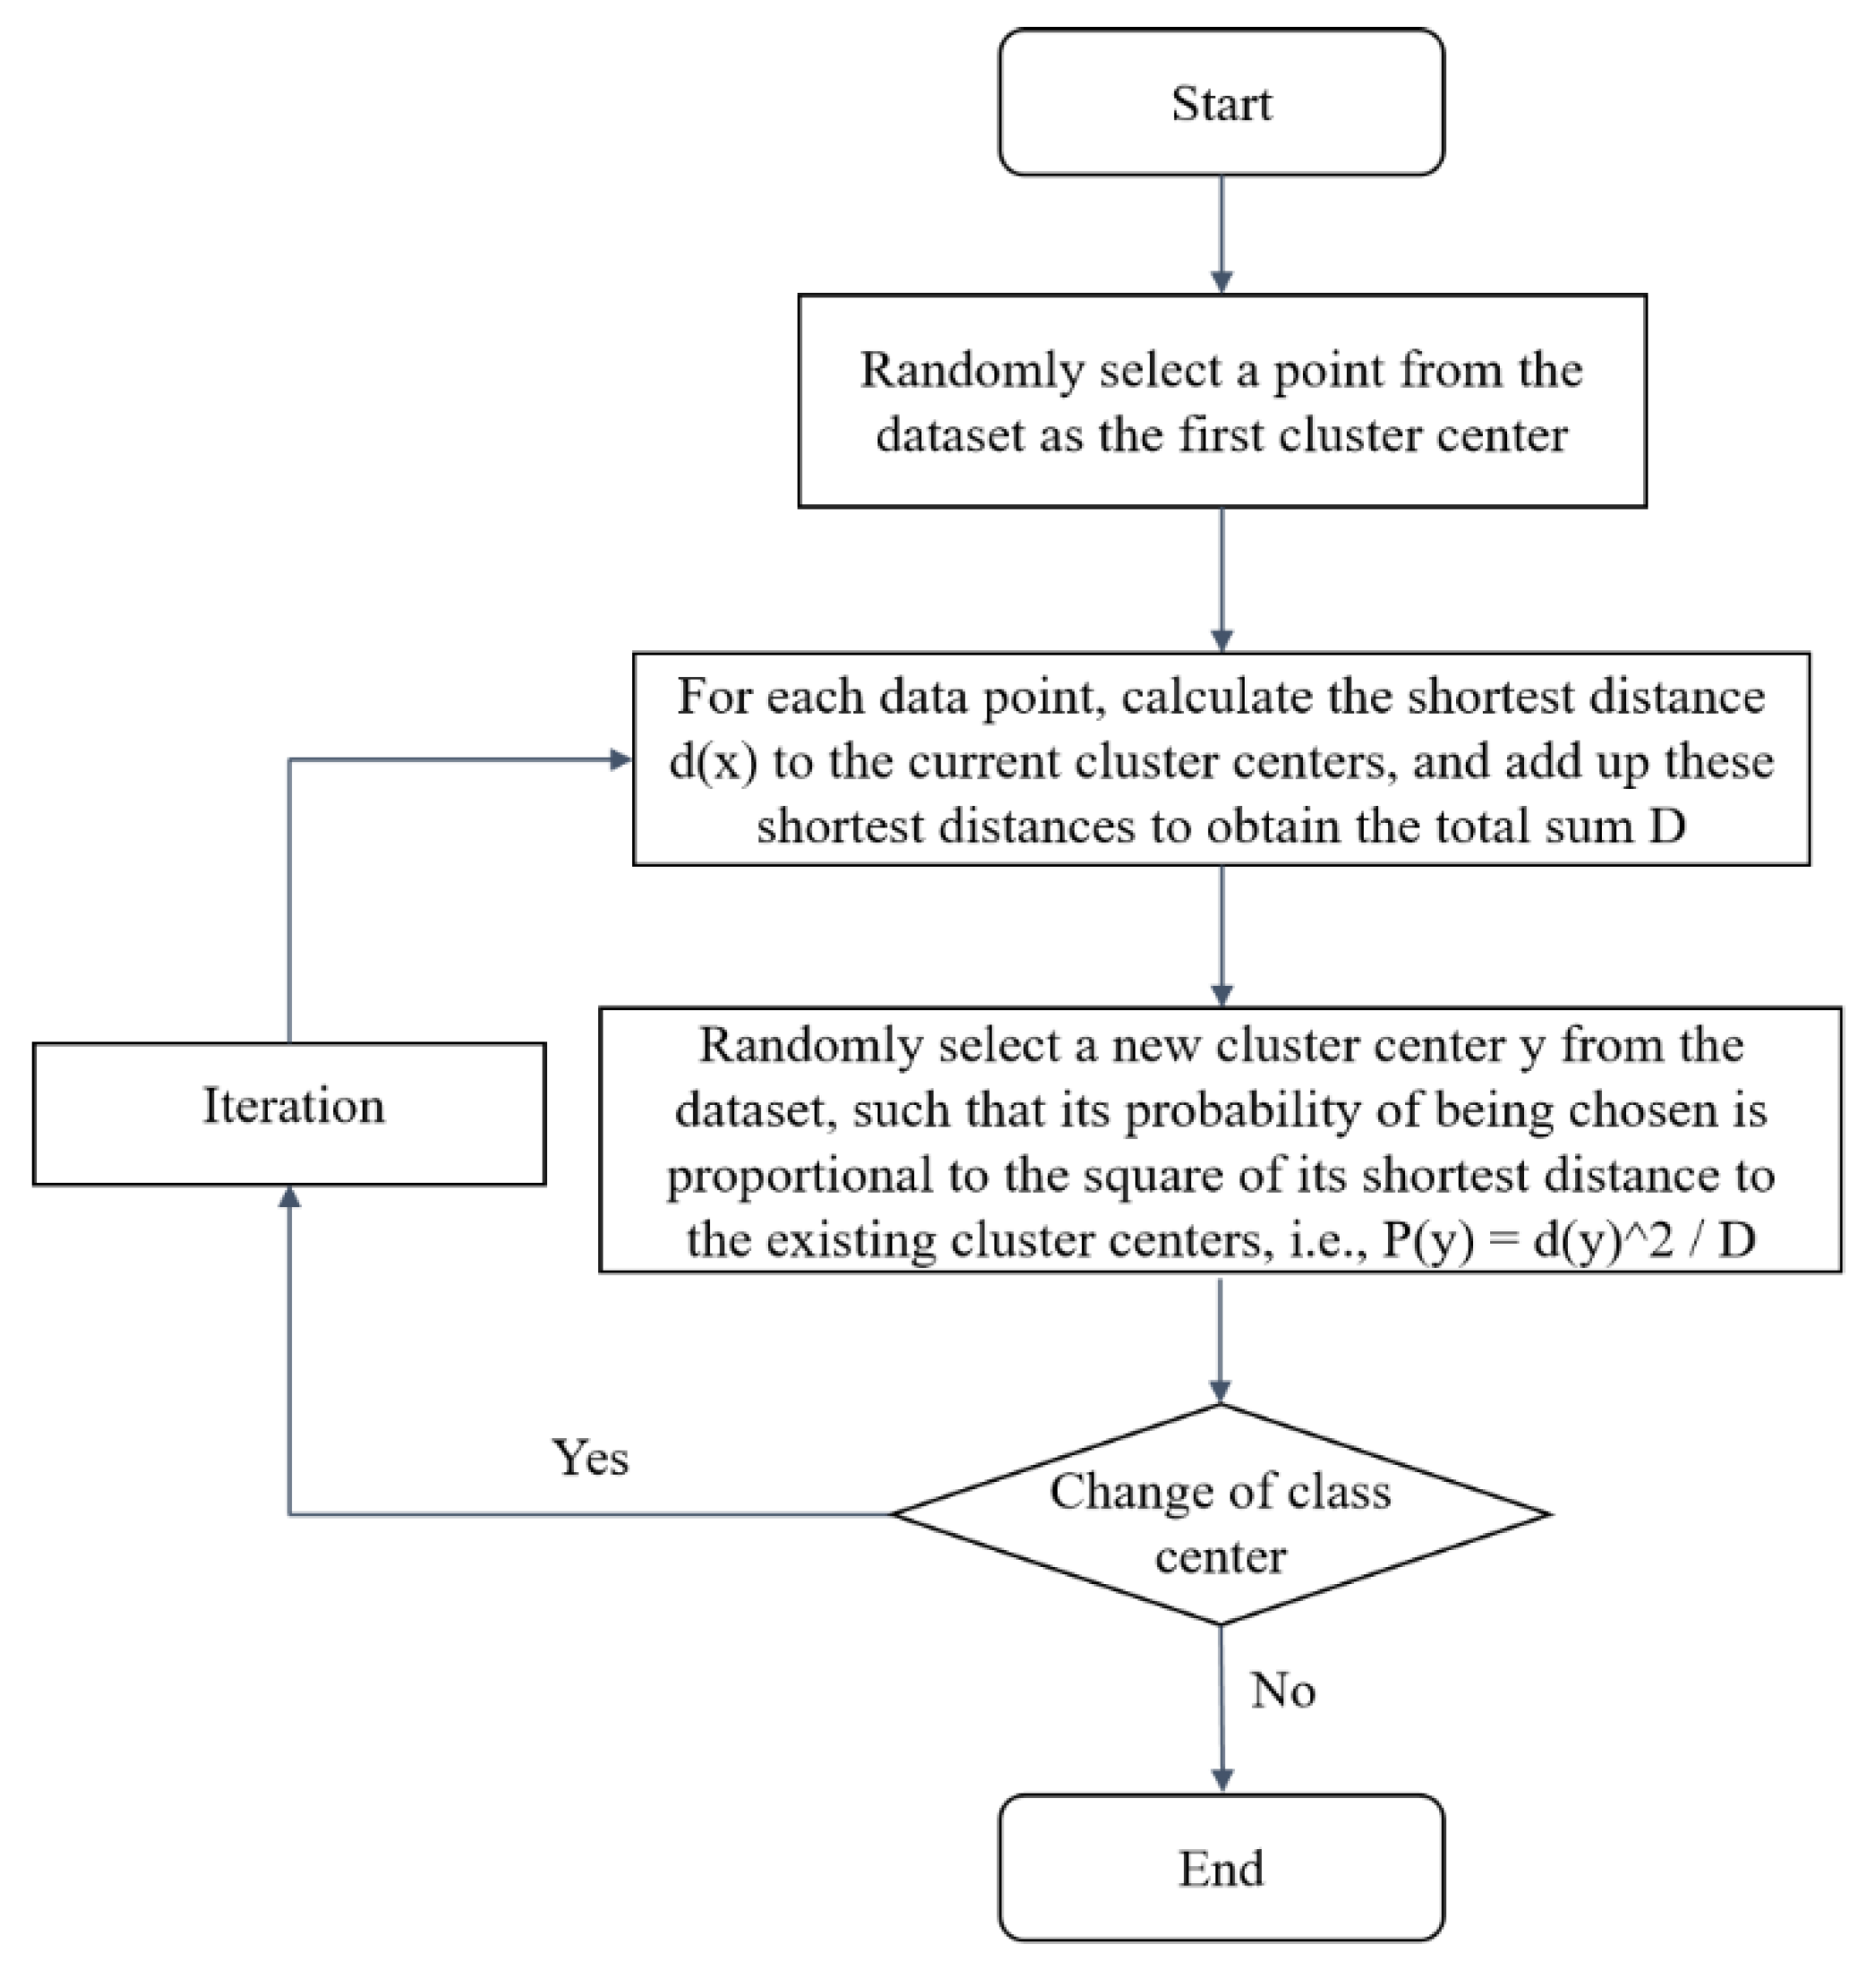
3.3. Grading Evaluation of Quality Changes in Grain Storage Process Based on K-Means++
3.4. Model Evaluation Metrics
3.4.1. Evaluation Metrics for Predictive Models
3.4.2. Evaluation Metrics for Clustering Models
4. Results
4.1. Comparative Experiments of Models for Predicting Quality Changes during Grain Storage
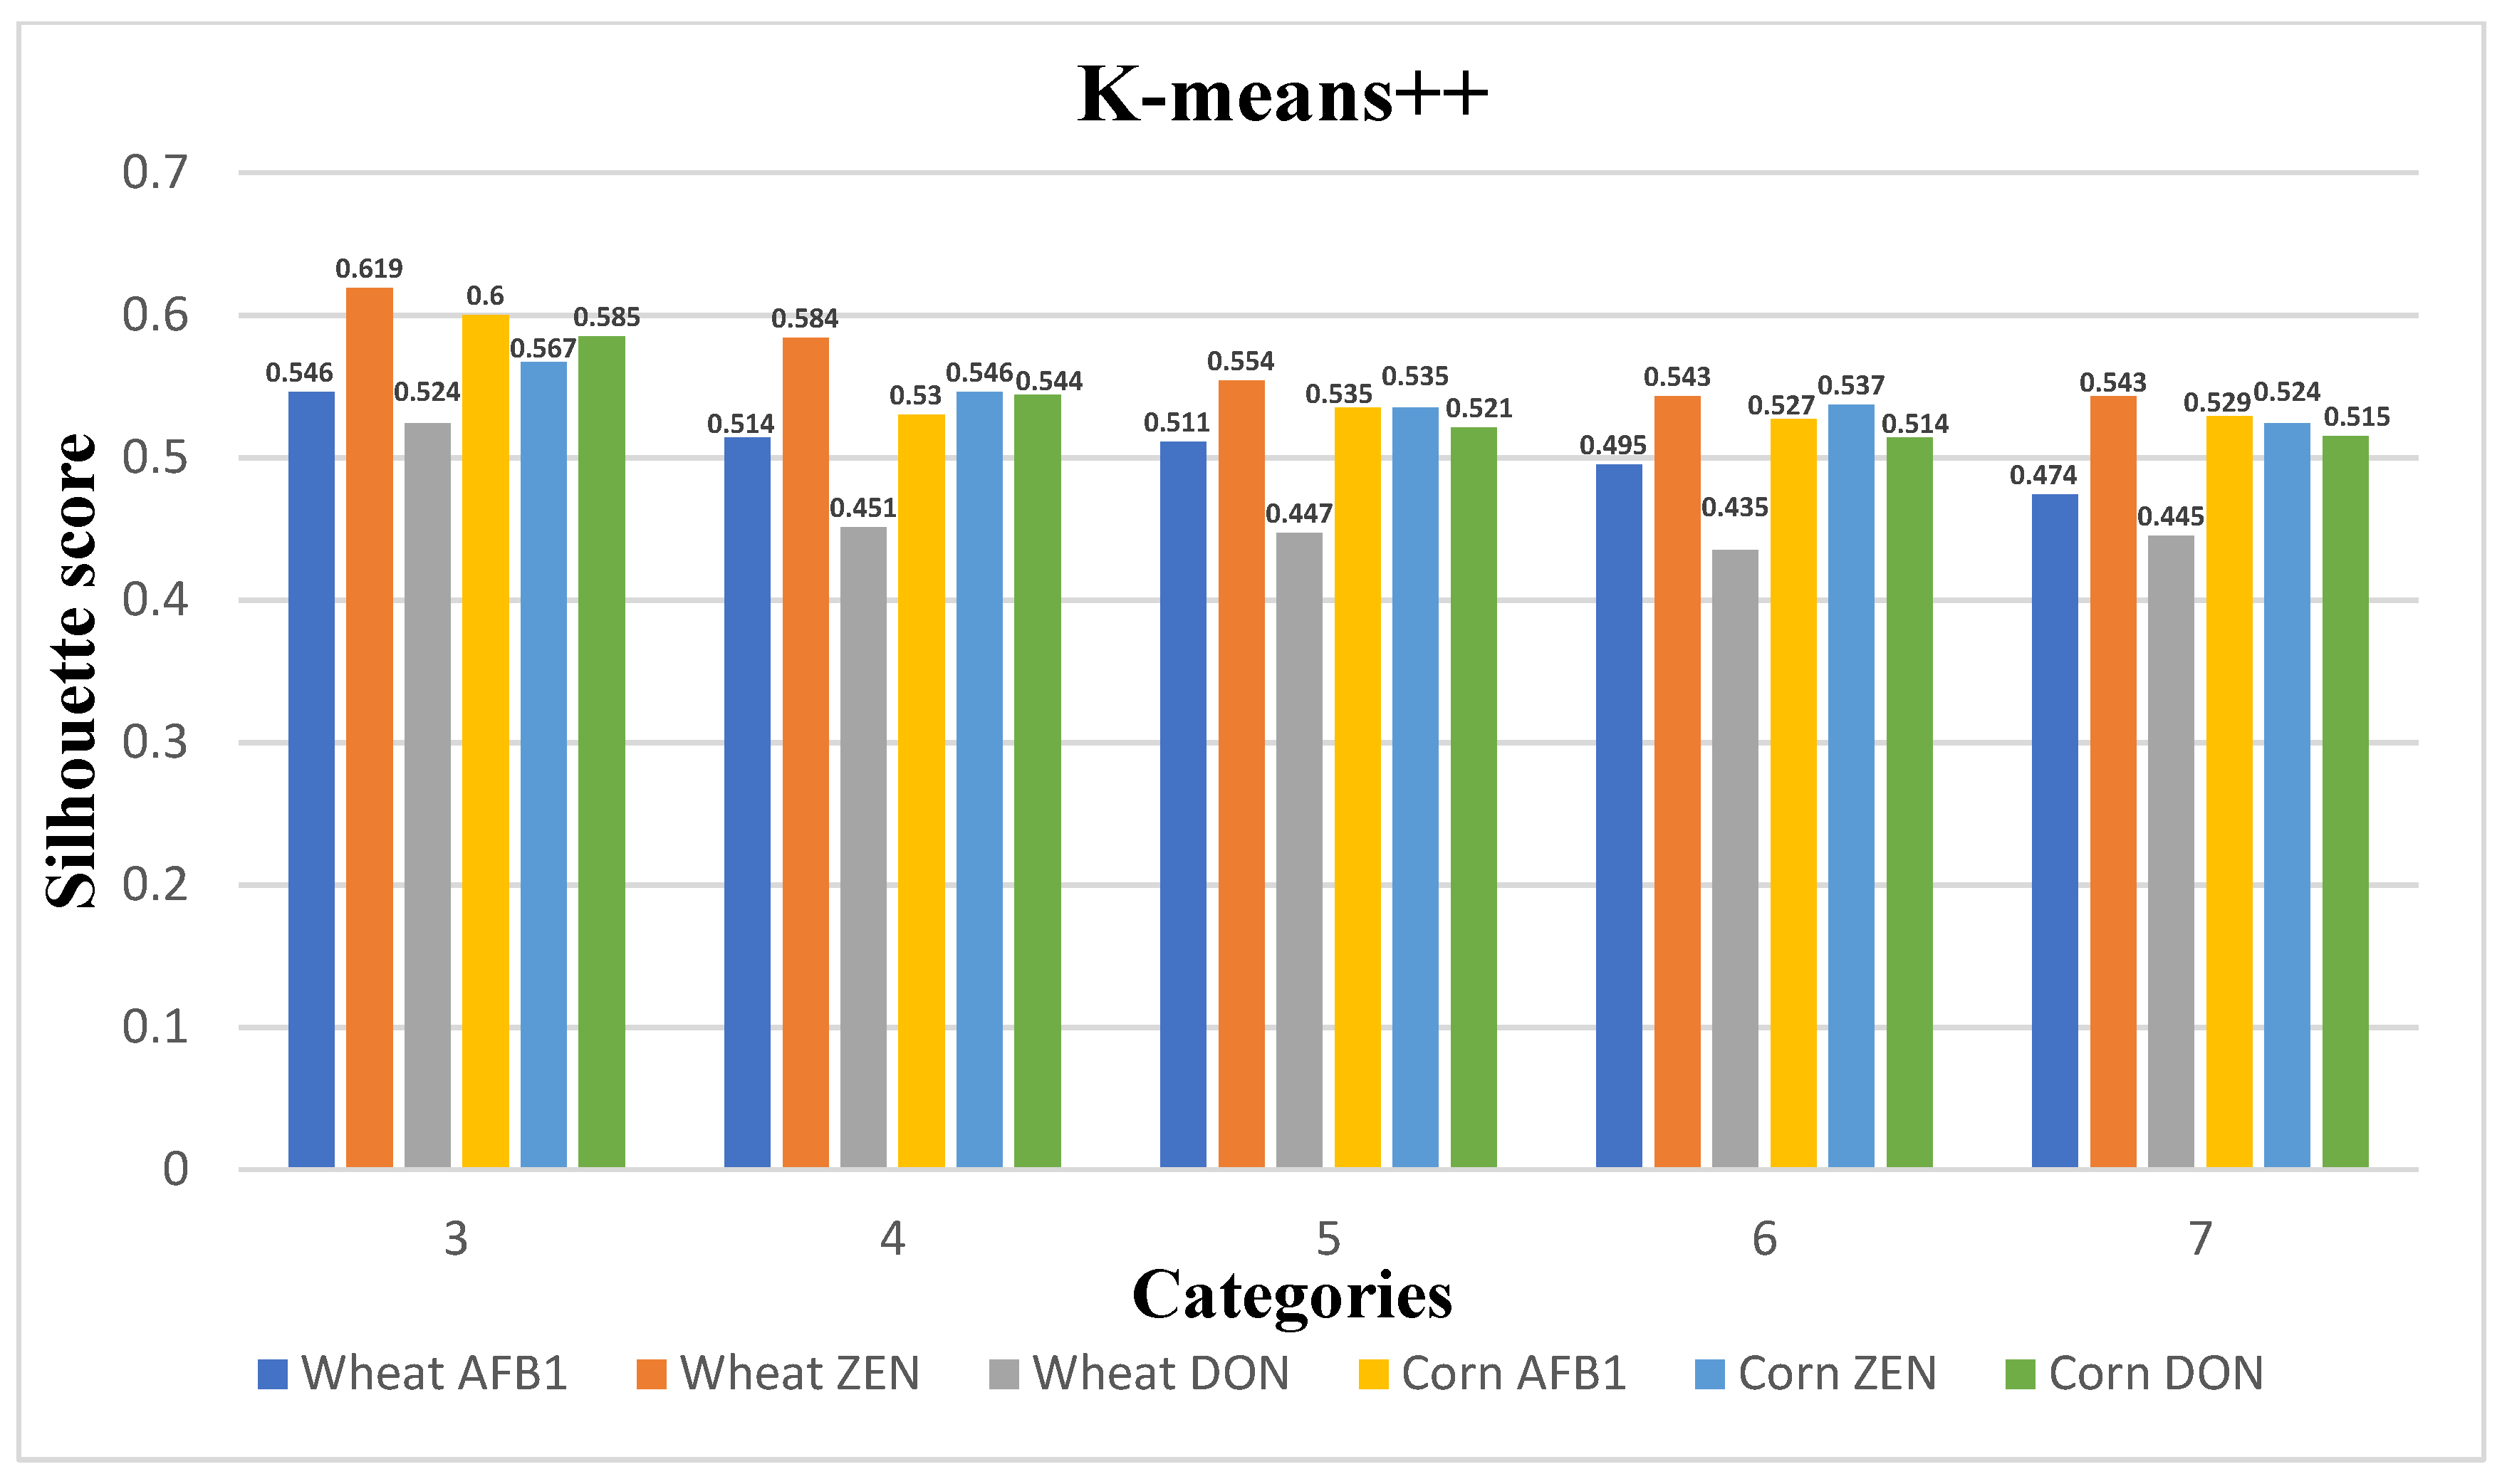
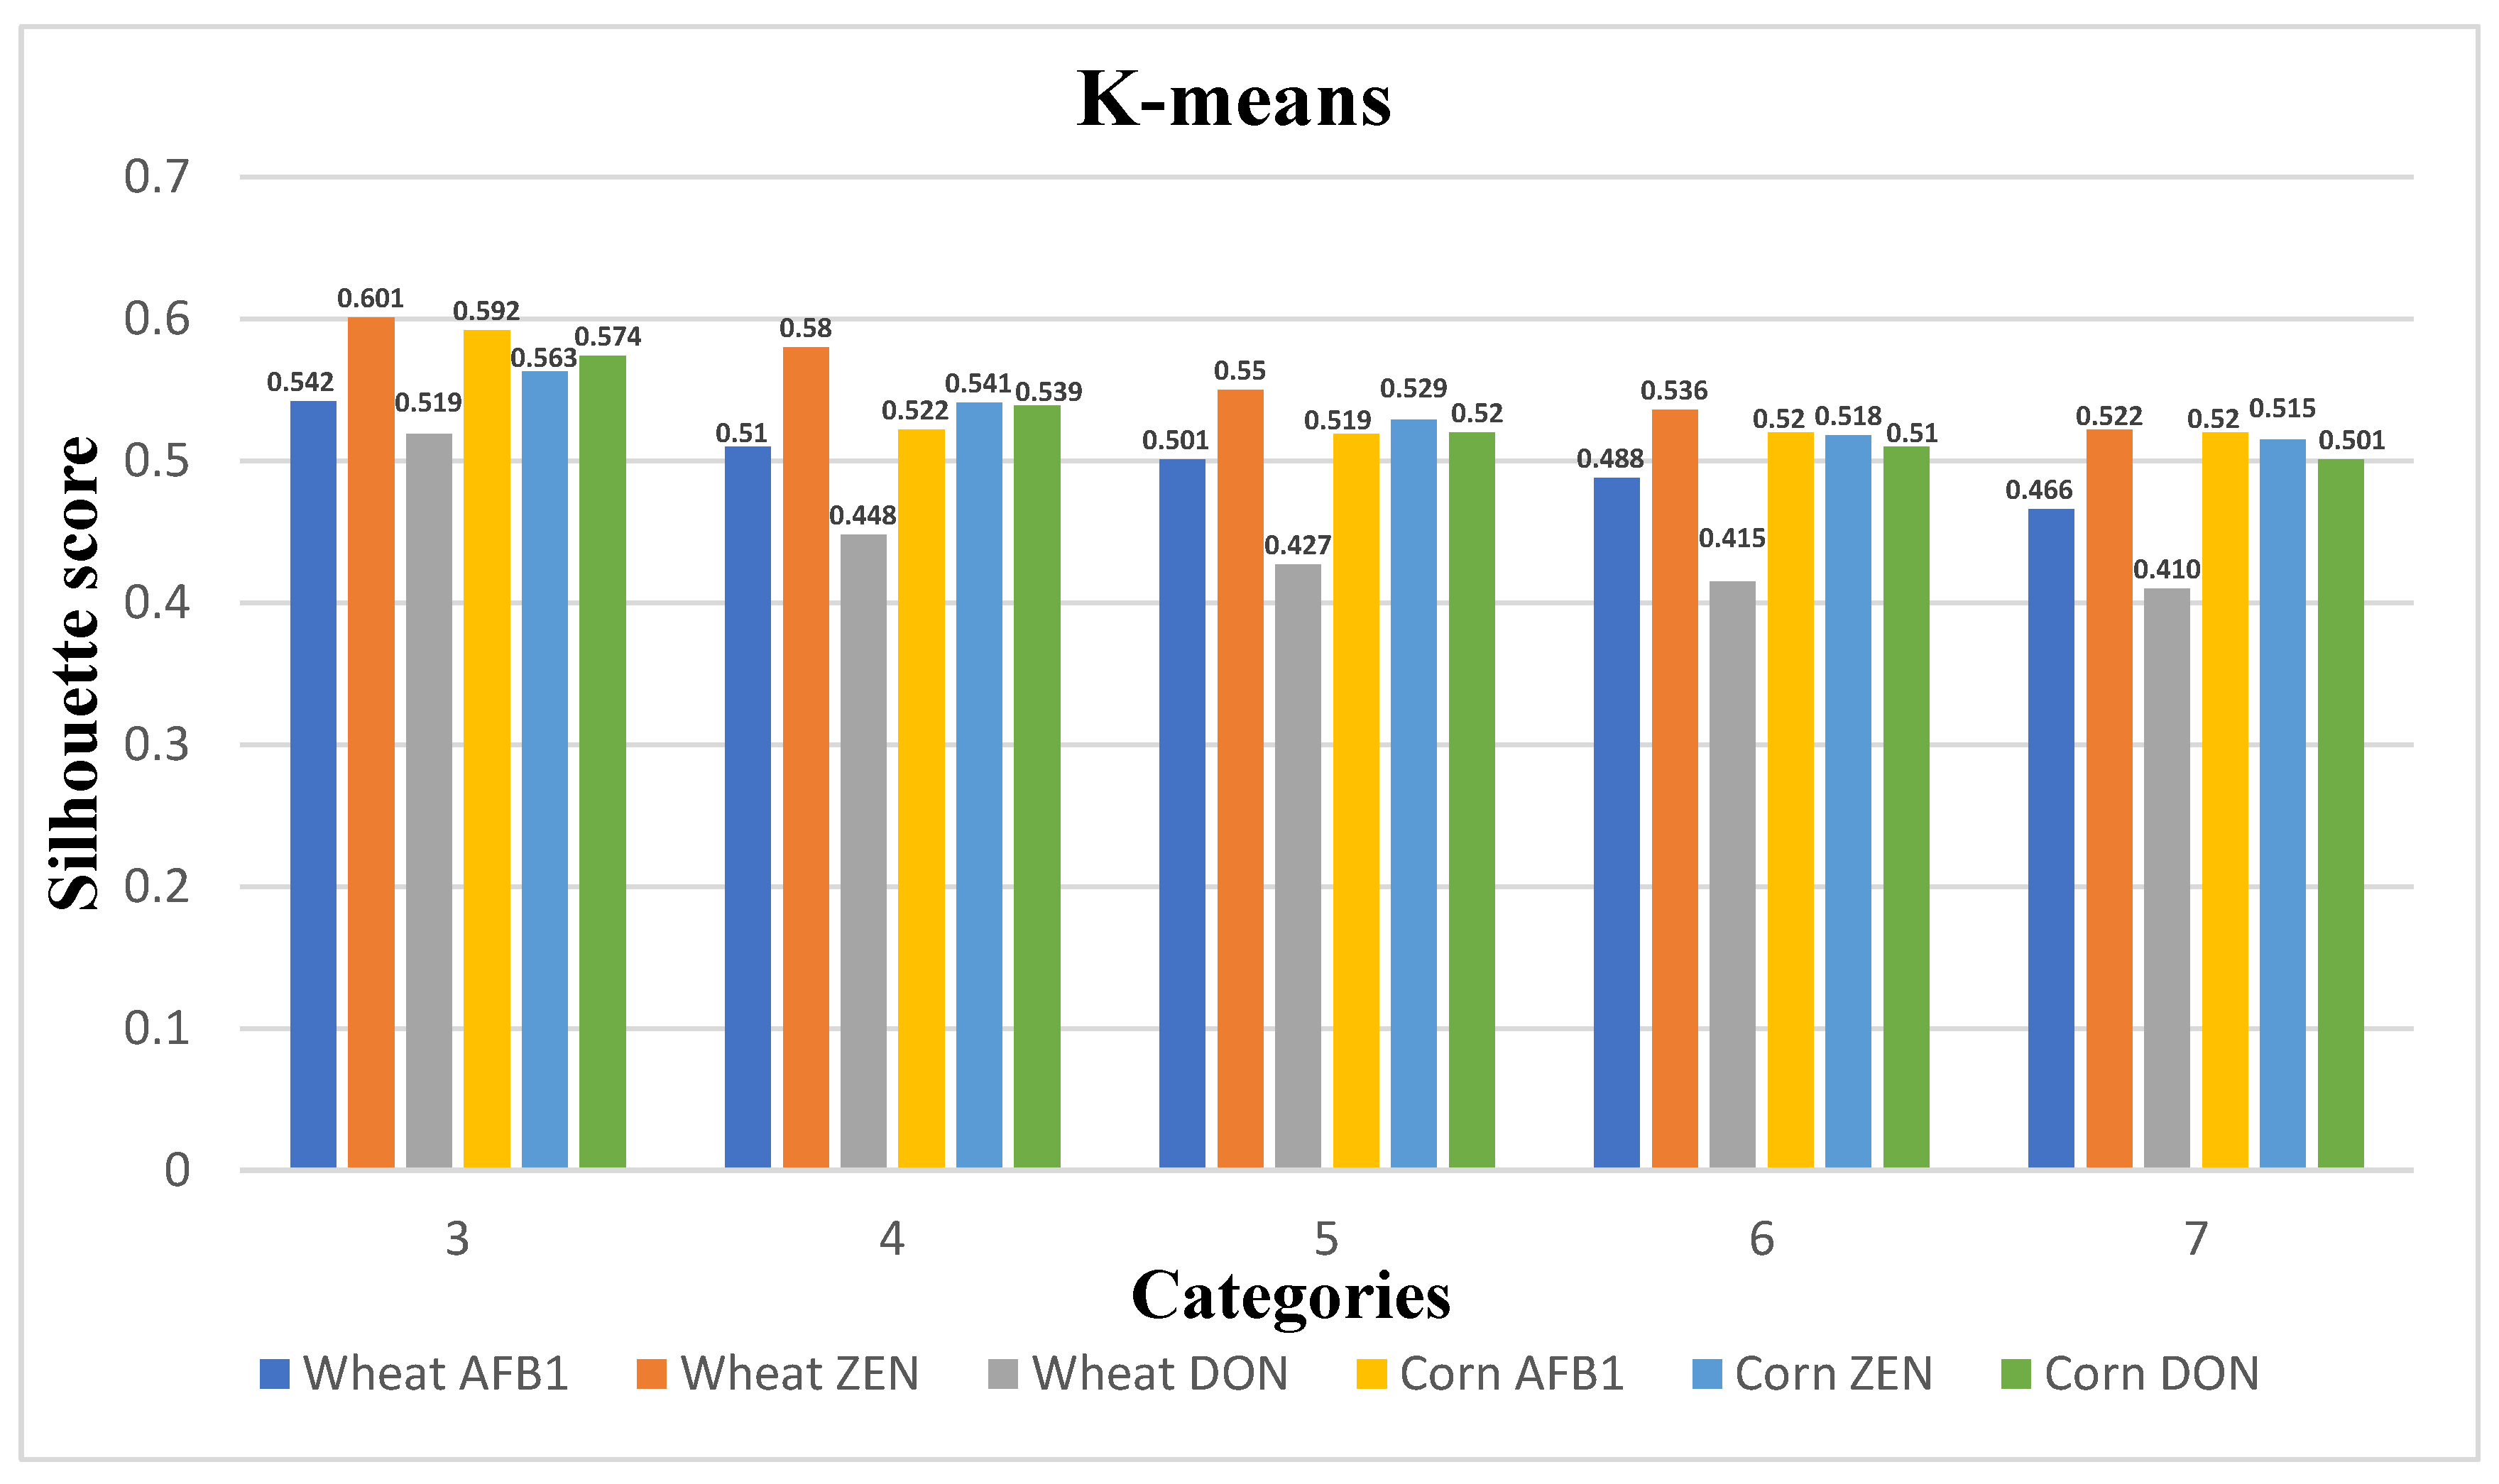
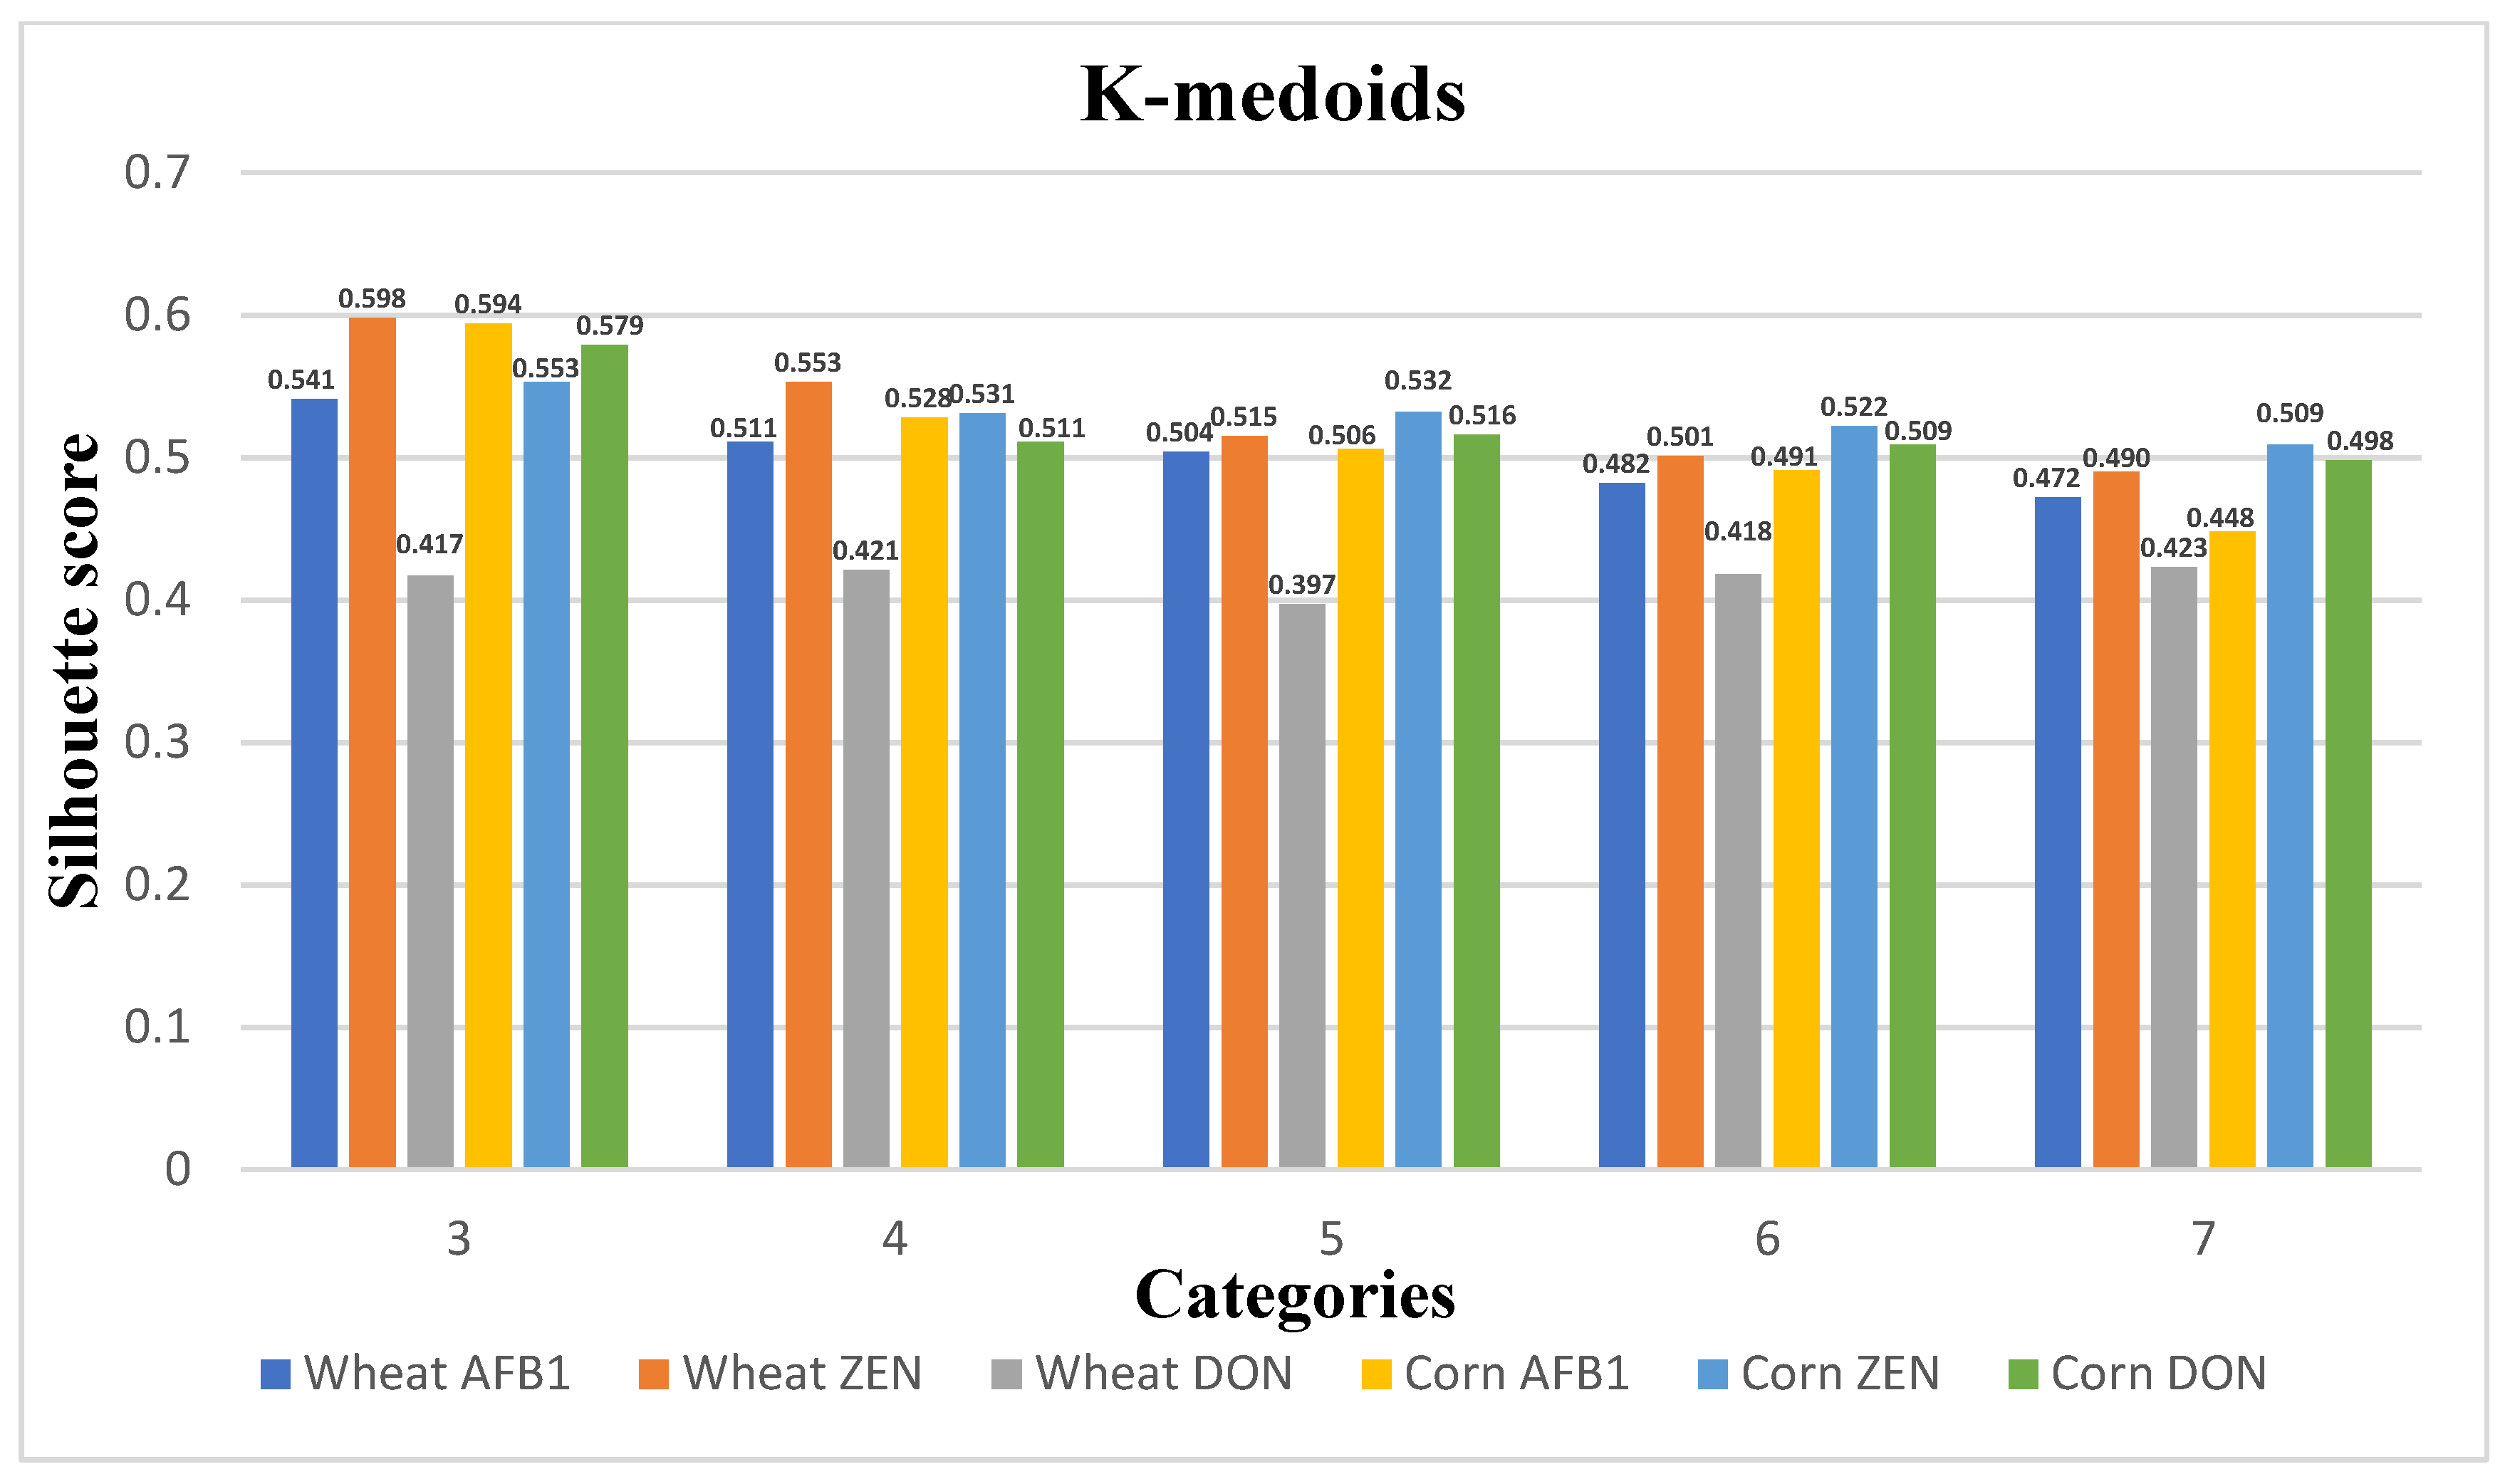
4.2. Comparison of Clustering Models for Quality Changes during Grain Storage
5. Discussion
6. Conclusions
Author Contributions
Funding
Institutional Review Board Statement
Informed Consent Statement
Data Availability Statement
Conflicts of Interest
References
- Coradi, P.C.; Lutz, É.; dos Santos Bilhalva, N.; Jaques, L.B.A.; Leal, M.M.; Teodoro, L.P.R. Prototype Wireless Sensor Network and Internet of Things Platform for Real-Time Monitoring of Intergranular Equilibrium Moisture Content and Predict the Quality Corn Stored in Silos Bags. Expert Syst. Appl. 2022, 208, 118242. [Google Scholar] [CrossRef]
- Faree, A.; Wang, Y.; Li, G. Modeling Grain Storage Quality with Linear Regression. In Proceedings of the 2017 3rd IEEE International Conference on Computer and Communications (ICCC), Chengdu, China, 13–16 December 2017; pp. 2904–2909. [Google Scholar]
- Zain, M.E. Impact of Mycotoxins on Humans and Animals. J. Saudi Chem. Soc. 2011, 15, 129–144. [Google Scholar] [CrossRef]
- Lutz, É.; Coradi, P.C. Applications of New Technologies for Monitoring and Predicting Grains Quality Stored: Sensors, Internet of Things, and Artificial Intelligence. Measurement 2022, 188, 110609. [Google Scholar] [CrossRef]
- Lutz, É.; Coradi, P.C.; Jaques, L.B.A.; de Oliveira Carneiro, L.; Teodoro, L.P.R.; Teodoro, P.E.; Meneghetti, V.L.; de Souza, G.A.C. Real-time Equilibrium Moisture Content Monitoring to Predict Grain Quality of Corn Stored in Silo and Raffia Bags. J. Food Process Eng. 2022, 45, e14076. [Google Scholar] [CrossRef]
- Szwedziak, K. The Use of Vision Techniques for the Evaluation of Selected Quality Parameters of Maize Grain during Storage. E3S Web Conf. 2019, 132, 01026. [Google Scholar] [CrossRef]
- Xie, Q.H.; Xue, Y. The Prediction of Public Risk Perception by Internal Characteristics and External Environment: Machine Learning on Big Data. Int. J. Environ. Res. Public Health 2022, 19, 9545. [Google Scholar] [CrossRef]
- Liu, B.C.; Zhang, N.B.; Wang, L.L.; Zhang, X.M. Electricity Generation Forecast of Shanghai Municipal Solid Waste Based on Bidirectional Long Short-Term Memory Model. Int. J. Environ. Res. Public Health 2022, 19, 6616. [Google Scholar] [CrossRef] [PubMed]
- Xu, L.D.; Lu, Y.; Li, L. Embedding blockchain technology into IoT for security: A survey. IEEE Internet Things J. 2021, 8, 10452–10473. [Google Scholar] [CrossRef]
- Lu, Y. Implementing blockchain in information systems: A review. Enterp. Inf. Syst. 2021, 16, 1876–1907. [Google Scholar] [CrossRef]
- Bennett, J.W.; Klich, M. Mycotoxins. Clin. Microbiol. Rev. 2003, 16, 497–516. [Google Scholar] [CrossRef]
- Hazel, C.M.; Patel, S. Influence of Processing on Trichothecene Levels. Toxicol. Lett. 2004, 153, 51–59. [Google Scholar] [CrossRef] [PubMed]
- Cowger, C.; Arrellano, C. Plump Kernels with High Deoxynivalenol Linked to Late Gibberella Zeae Infection and Marginal Disease Conditions in Winter Wheat. Phytopathology 2010, 100, 719–728. [Google Scholar] [CrossRef] [PubMed]
- Sobrova, P.; Adam, V.; Vasatkova, A.; Beklova, M.; Zeman, L.; Kizek, R. Deoxynivalenol and Its Toxicity. Interdiscip. Toxicol. 2010, 3, 94–99. [Google Scholar] [CrossRef]
- Sharma, P.C.; Sharma, D.; Sharma, A.; Bhagat, M.; Ola, M.; Thakur, V.K.; Bhardwaj, J.K.; Goyal, R.K. Recent Advances in Microbial Toxin-Related Strategies to Combat Cancer. Semin. Cancer Biol. 2022, 86, 753–768. [Google Scholar] [CrossRef]
- Jeong, J.H.; Resop, J.P.; Mueller, N.D.; Fleisher, D.H.; Yun, K.; Butler, E.E.; Timlin, D.J.; Shim, K.-M.; Gerber, J.S.; Reddy, V.R.; et al. Random Forests for Global and Regional Crop Yield Predictions. PLoS ONE 2016, 11, e0156571. [Google Scholar] [CrossRef]
- Jaques, L.B.A.; Coradi, P.C.; Lutz, E.; Teodoro, P.E.; Jaeger, D.V.; Teixeira, A.L. Nondestructive Technology for Real-Time Monitoring and Prediction of Soybean Quality Using Machine Learning for a Bulk Transport Simulation. IEEE Sens. J. 2022, 23, 3028–3040. [Google Scholar] [CrossRef]
- Coradi, P.C.; Lima, R.E.; Alves, C.Z.; Teodoro, P.E.; Cândido, A.C.d.S. Evaluation of Coatings for Application in Raffia Big Bags in Conditioned Storage of Soybean Cultivars in Seed Processing Units. PLoS ONE 2020, 15, e0242522. [Google Scholar] [CrossRef]
- Baliukoniene, V.; Bakutis, B.; Stankevicius, H. Mycological and Mycotoxicological Evaluation of Grain. Ann. Agric. Environ. Med. 2003, 10, 223–227. [Google Scholar] [PubMed]
- Cotty, P.J.; Jaime-Garcia, R. Influences of Climate on Aflatoxin Producing Fungi and Aflatoxin Contamination. Int. J. Food Microbiol. 2007, 119, 109–115. [Google Scholar] [CrossRef] [PubMed]
- Saleemullah; Iqbal, A.; Khalil, I.A.; Shah, H. Aflatoxin Contents of Stored and Artificially Inoculated Cereals and Nuts. Food Chem. 2006, 98, 699–703. [Google Scholar] [CrossRef]
- Kumar, V.; Basu, M.S.; Rajendran, T.P. Mycotoxin Research and Mycoflora in Some Commercially Important Agricultural Commodities. Crop Prot. 2008, 27, 891–905. [Google Scholar] [CrossRef]
- Youness, J.; Driss, M. An ARIMA Model for Modeling and Forecasting the Dynamic of Univariate Time Series: The Case of Moroccan Inflation Rate. In Proceedings of the 2022 International Conference on Intelligent Systems and Computer Vision (ISCV), Fez, Morocco, 18–20 May 2022; pp. 1–5. [Google Scholar]
- Liu, D.; Chen, H.; Tang, Y.; Liu, C.; Cao, M.; Gong, C.; Jiang, S. Slope Micrometeorological Analysis and Prediction Based on an ARIMA Model and Data-Fitting System. Sensors 2022, 22, 1214. [Google Scholar] [CrossRef]
- Drucker, H.; Burges, C.J.C.; Kaufman, L.; Smola, A.J.; Vapnik, V. Support Vector Regression Machines. In Advances in Neural Information Processing Systems 9; NeurIPS Proceedings: New Orleans, LA, USA, 1996. [Google Scholar]
- Jie, Y. A Bayesian Inference Based Two-Stage Support Vector Regression Framework for Soft Sensor Development in Batch Bioprocesses. Comput. Chem. Eng. 2012, 41, 134–144. [Google Scholar] [CrossRef]
- Asadollahfardi, G.; Zangooi, H.; Asadi, M.; Tayebi Jebeli, M.; Meshkat-Dini, M.; Roohani, N. Comparison of Box-Jenkins Time Series and ANN in Predicting Total Dissolved Solid at the Zāyandé-Rūd River, Iran. J. Water Supply Res. Technol.-Aqua 2018, 67, 673–684. [Google Scholar] [CrossRef]
- Shi, H.; Xu, M.; Li, R. Deep Learning for Household Load Forecasting—A Novel Pooling Deep RNN. IEEE Trans. Smart Grid 2018, 9, 5271–5280. [Google Scholar] [CrossRef]
- Che, Z.; Purushotham, S.; Cho, K.; Sontag, D.; Liu, Y. Recurrent Neural Networks for Multivariate Time Series with Missing Values. Sci. Rep. 2018, 8, 6085. [Google Scholar] [CrossRef] [PubMed]
- Gensler, A.; Henze, J.; Sick, B.; Raabe, N. Deep Learning for Solar Power Forecasting—An Approach Using AutoEncoder and LSTM Neural Networks. In Proceedings of the 2016 IEEE International Conference on Systems, Man, and Cybernetics (SMC), Budapest, Hungary, 9–12 October 2016; pp. 002858–002865. [Google Scholar]
- Zheng, H.; Lin, F.; Feng, X.; Chen, Y. A Hybrid Deep Learning Model With Attention-Based Conv-LSTM Networks for Short-Term Traffic Flow Prediction. IEEE Trans. Intell. Transp. Syst. 2021, 22, 6910–6920. [Google Scholar] [CrossRef]
- Zheng, J.; Xu, C.; Zhang, Z.; Li, X. Electric Load Forecasting in Smart Grid Using Long-Short-Term-Memory Based Recurrent Neural Network. In Proceedings of the 2017 51st Annual Conference on Information Sciences and Systems (CISS), Baltimore, MD, USA, 22–24 March 2017. [Google Scholar]
- Kang, H.; Yang, S.; Huang, J.; Oh, J. Time Series Prediction of Wastewater Flow Rate by Bidirectional LSTM Deep Learning. Int. J. Control Autom. Syst. 2020, 18, 3023–3030. [Google Scholar] [CrossRef]
- Vo, A.H.; Nguyen, T.; Le, T. Brent Oil Price Prediction Using Bi-LSTM Network. Intell. Autom. Soft Comput. 2020, 26, 1307–1317. [Google Scholar] [CrossRef]
- Kuan, L.; Yan, Z.; Xin, W.; Yan, C.; Xiangkun, P.; Wenxue, S.; Zhe, J.; Yong, Z.; Nan, X.; Xin, Z. Short-Term Electricity Load Forecasting Method Based on Multilayered Self-Normalizing GRU Network. In Proceedings of the 2017 IEEE Conference on Energy Internet and Energy System Integration (EI2), Beijing, China, 26–28 November 2017. [Google Scholar]
- Ji, S.P.; Meng, Y.L.; Yan, L.; Dong, G.S.; Liu, D. GRU-Corr Neural Network Optimized by Improved PSO Algorithm for Time Series Prediction. Int. J. Artif. Intell. Tools 2020, 29, 2040010. [Google Scholar] [CrossRef]
- Yang, H.; Wu, S. Prediction of Remaining Time of Tram Charging Based on Bi-GRU. In Proceedings of the 2022 3rd Asia-Pacific Conference on Image Processing, Electronics and Computers, Dalian, China, 14–16 April 2022; pp. 521–524. [Google Scholar]
- Vaswani, A.; Shazeer, N.; Parmar, N.; Uszkoreit, J.; Jones, L.; Gomez, A.N.; Kaiser, Ł.; Polosukhin, I. Attention Is All You Need. In Advances in Neural Information Processing Systems 30; NeurIPS Proceedings: New Orleans, LA, USA, 2017. [Google Scholar]
- Zhang, J.; Zhang, H.; Ding, S.; Zhang, X. Power Consumption Predicting and Anomaly Detection Based on Transformer and K-Means. Front. Energy Res. 2021, 9, 779587. [Google Scholar] [CrossRef]
- Zhou, H.; Zhang, S.; Peng, J.; Zhang, S.; Li, J.; Xiong, H.; Zhang, W. Informer: Beyond Efficient Transformer for Long Sequence Time-Series Forecasting. Proc. AAAI Conf. Artif. Intell. 2021, 35, 11106–11115. [Google Scholar] [CrossRef]
- Lu, Y.; Williams, T.L. Modeling analytics in COVID-19: Prediction, prevention, control, and evaluation. J. Manag. Anal. 2021, 8, 424–442. [Google Scholar] [CrossRef]
- Aizpurua, J.I.; McArthur, S.D.J.; Stewart, B.G.; Lambert, B.; Cross, J.G.; Catterson, V.M. Adaptive Power Transformer Lifetime Predictions Through Machine Learning and Uncertainty Modeling in Nuclear Power Plants. IEEE Trans. Ind. Electron. 2019, 66, 4726–4737. [Google Scholar] [CrossRef]
- Zhou, T.; Ma, Z.; Wen, Q.; Wang, X.; Sun, L.; Jin, R. FEDformer: Frequency Enhanced Decomposed Transformer for Long-Term Series Forecasting. arXiv 2022, arXiv:2201.12740. [Google Scholar]
- Wen, Q.; Gao, J.; Song, X.; Sun, L.; Xu, H.; Zhu, S. RobustSTL: A Robust Seasonal-Trend Decomposition Algorithm for Long Time Series. Proc. AAAI Conf. Artif. Intell. 2019, 33, 5409–5416. [Google Scholar] [CrossRef]
- Baoua, I.B.; Amadou, L.; Margam, V.; Murdock, L.L. Comparative Evaluation of Six Storage Methods for Postharvest Preservation of Cowpea Grain. J. Stored Prod. Res. 2012, 49, 171–175. [Google Scholar] [CrossRef]
- De Groote, H.; Kimenju, S.C.; Likhayo, P.; Kanampiu, F.; Tefera, T.; Hellin, J. Effectiveness of Hermetic Systems in Controlling Maize Storage Pests in Kenya. J. Stored Prod. Res. 2013, 53, 27–36. [Google Scholar] [CrossRef]


| Dataset | Training Set | Test Set | Validation Set |
|---|---|---|---|
| 2100 | 1470 | 420 | 210 |
| Model | Learn Rate | Pred Length | RMSE | MAPE |
|---|---|---|---|---|
| FEDformer | 0.001 | 3 | 0.028 | 0.14 |
| 0.001 | 7 | 0.026 | 0.12 | |
| 0.001 | 14 | 0.032 | 0.14 | |
| 0.001 | 21 | 0.042 | 0.17 | |
| 0.0001 | 3 | 0.026 | 0.13 | |
| 0.0001 | 7 | 0.023 | 0.10 | |
| 0.0001 | 14 | 0.027 | 0.12 | |
| 0.0001 | 21 | 0.035 | 0.15 |
| Model | MAE | MSE | RMSE | MAPE | MSPE |
|---|---|---|---|---|---|
| CNN | 0.20 | 0.05 | 0.24 | 1.00 | 15.00 |
| LSTM | 0.19 | 0.04 | 0.20 | 0.80 | 7.30 |
| GRU | 0.17 | 0.04 | 0.20 | 0.79 | 7.40 |
| BILSTM | 0.17 | 0.04 | 0.20 | 0.78 | 7.20 |
| BIGRU | 0.18 | 0.04 | 0.20 | 0.77 | 6.80 |
| Transformer | 0.04 | 0.0230 | 0.470 | 0.35 | 1.77 |
| Informer | 0.02 | 0.0006 | 0.025 | 0.12 | 0.20 |
| FEDformer | 0.01 | 0.0005 | 0.023 | 0.10 | 0.09 |
| Model | MAE | MSE | RMSE | MAPE | MSPE |
|---|---|---|---|---|---|
| CNN | 0.19 | 0.05 | 0.23 | 1.05 | 4.10 |
| LSTM | 0.18 | 0.05 | 0.23 | 0.90 | 4.00 |
| GRU | 0.19 | 0.05 | 0.23 | 0.78 | 3.85 |
| BILSTM | 0.18 | 0.05 | 0.22 | 0.77 | 3.80 |
| BIGRU | 0.18 | 0.05 | 0.23 | 0.77 | 3.80 |
| Transformer | 0.022 | 0.0008 | 0.030 | 0.152 | 0.239 |
| Informer | 0.020 | 0.0007 | 0.029 | 0.138 | 0.219 |
| FEDformer | 0.017 | 0.0006 | 0.025 | 0.108 | 0.140 |
| Categories | Sample Size | Quality Level | ||
|---|---|---|---|---|
| AFB1 1 | 0.18296259 | 0.37745829 | 437 | Level 1 |
| AFB1 2 | 0.38632914 | 0.51953385 | 479 | Level 2 |
| AFB1 3 | 0.59146268 | 0.70412027 | 257 | Level 3 |
| ZEN 1 | 0.56973928 | 6.38460694 | 574 | Level 1 |
| ZEN 2 | 3.72524785 | 9.18565112 | 347 | Level 2 |
| ZEN 3 | 7.84181363 | 13.71952964 | 252 | Level 3 |
| DON 1 | 1.5854636 | 10.74325581 | 848 | Level 1 |
| DON 2 | 6.5297169 | 16.27524666 | 233 | Level 2 |
| DON 3 | 18.18865713 | 32.91086986 | 92 | Level 3 |
| Categories | Sample Size | Quality Level | ||
|---|---|---|---|---|
| AFB1 1 | 2.23192665 | 4.45638545 | 604 | Level 1 |
| AFB1 2 | 5.82095175 | 8.20041504 | 334 | Level 2 |
| AFB1 3 | 10.01755404 | 12.27797104 | 252 | Level 3 |
| ZEN 1 | 15.59706445 | 28.90062257 | 482 | Level 1 |
| ZEN 2 | 25.73757556 | 38.30160156 | 428 | Level 2 |
| ZEN 3 | 35.83231475 | 47.86063413 | 280 | Level 3 |
| DON 1 | 347.19803286 | 540.86074515 | 482 | Level 1 |
| DON 2 | 472.40014244 | 711.26046271 | 396 | Level 2 |
| DON 3 | 638.92666501 | 878.91088989 | 286 | Level 3 |
Disclaimer/Publisher’s Note: The statements, opinions and data contained in all publications are solely those of the individual author(s) and contributor(s) and not of MDPI and/or the editor(s). MDPI and/or the editor(s) disclaim responsibility for any injury to people or property resulting from any ideas, methods, instructions or products referred to in the content. |
© 2023 by the authors. Licensee MDPI, Basel, Switzerland. This article is an open access article distributed under the terms and conditions of the Creative Commons Attribution (CC BY) license (https://creativecommons.org/licenses/by/4.0/).
Share and Cite
Zhang, Q.; Li, Z.; Dong, W.; Wei, S.; Liu, Y.; Zuo, M. A Model for Predicting and Grading the Quality of Grain Storage Processes Affected by Microorganisms under Different Environments. Int. J. Environ. Res. Public Health 2023, 20, 4120. https://doi.org/10.3390/ijerph20054120
Zhang Q, Li Z, Dong W, Wei S, Liu Y, Zuo M. A Model for Predicting and Grading the Quality of Grain Storage Processes Affected by Microorganisms under Different Environments. International Journal of Environmental Research and Public Health. 2023; 20(5):4120. https://doi.org/10.3390/ijerph20054120
Chicago/Turabian StyleZhang, Qingchuan, Zihan Li, Wei Dong, Siwei Wei, Yingjie Liu, and Min Zuo. 2023. "A Model for Predicting and Grading the Quality of Grain Storage Processes Affected by Microorganisms under Different Environments" International Journal of Environmental Research and Public Health 20, no. 5: 4120. https://doi.org/10.3390/ijerph20054120
APA StyleZhang, Q., Li, Z., Dong, W., Wei, S., Liu, Y., & Zuo, M. (2023). A Model for Predicting and Grading the Quality of Grain Storage Processes Affected by Microorganisms under Different Environments. International Journal of Environmental Research and Public Health, 20(5), 4120. https://doi.org/10.3390/ijerph20054120