Article

Profile Distributions of Potentially Toxic Metal(loid)s in Soils of the Middle Odra Floodplain (SW Poland)

Institute of Soil Science, Plant Nutrition and Environmental Protection, Wrocław University of Environmental and Life Sciences, ul. Grunwaldzka 53, 50-357 Wrocław, Poland
*
Author to whom correspondence should be addressed.
Int. J. Environ. Res. Public Health 2023, 20(5), 4196; https://doi.org/10.3390/ijerph20054196
Submission received: 1 February 2023 / Revised: 22 February 2023 / Accepted: 23 February 2023 / Published: 26 February 2023
(This article belongs to the Section Environmental Science and Engineering)

Abstract

:
Floodplain soils are often contaminated with potentially toxic elements of geogenic and anthropogenic origin. This also applies to a valley of the Odra river, which in its upper reach flows through areas of historical and contemporary mining and heavy industry. This study examined the distribution of typically anthropogenic metal(loid)s, i.e., Pb, Zn, Cu, As and Cd, and geogenic metals, i.e., Mn and Fe, in soil profiles of the middle Odra valley, and analyzed factors that determine their concentrations. Thirteen soil profiles, located inter the embankment area and outside the embankments, were examined. Most of profiles indicated stratification typical for alluvial soils. Topsoil layers in the inter-embankment zone showed considerable enrichment in Pb, Zn and Cd, and to a lesser extent in Cu and As. Low soil pH is an important factor of environmental risk; therefore, acidic soils definitely require liming. The soils located out of embankments did not show any considerable enrichment in the elements examined. Based on significant correlations between the concentrations of metal(loid)s in deep soil layers and soil texture, the values of local geochemical background were derived. Outliers, particularly in the case of As, were explained by possible redistribution under reducing conditions.

1. Introduction

Floodplain soils are often contaminated with potentially toxic elements, particularly when they adversely affected by effluents from mining or industrial areas. Possible sources of metals include discharges of insufficiently treated wastewater, seepage from poorly protected mine dumps and historical landfills, as well as diffuse input from the catchments [1,2,3,4,5,6]. The contaminants can be transported by the river, sometimes over long distances, in the forms of both dissolved and suspended matter. Metals and metalloids, however, tend to precipitate relatively soon and enrich the bottom sediments, in particular in the close vicinity of their source. Enriched sediments can also be a potential secondary source of contamination. Their transport over longer distances, often associated with flood events, can cause the accumulation of water-borne contaminants in floodplain soils [7,8,9,10]. Such enrichment occurs mainly in the surface levels of alluvial soils, up to a certain depth. However, metal(loid)s can be further subject to remobilization. Soil enrichment in various elements at longer distances from the source of contamination, the relationships among the elements and their profile distributions in soils can provide information on their environmental behavior.
These issues also apply to the floodplains of the Odra river, the second largest river of Poland (Figure 1), which, in its upper reach, flows through Upper Silesia, the region of historical and contemporary coal and Zn-Pb ore mining and heavy industry [11,12,13]. In addition, tributaries of the upper Odra river are also heavily polluted [14,15,16]. The amounts of underground water from ore mines, as well as from coal mines, discharged into the Odra river reached their maximum values in the second half of the 20th century [17]. Several authors confirmed that the sediments in the upper Odra reach, upstream of Wrocław city, are strongly enriched in metals. Many studies on the redistribution of metals in river sediments have been carried out in this part of the Odra valley. Some of them focused on the displacement of sediments during the river regulation and modification of the embankment system. The groyne fields filled with highly contaminated sediments were then dissected by new bank lines, and their material was partially keyed into the floodplains of the upper Odra reach [13,18].
In addition to the upper part of the Odra river valley, studies on river sediments were also carried out in the lower reaches of the river [19,20,21], downstream of Głogów, where water from the largest European center of copper ore mining and processing is discharged [22]. They confirmed the enrichment of sediments in heavy metals, in particular Cu and Pb, in that part of the river system.
Unlike the upper and lower reaches of the Odra river, its middle reach has not been so extensively examined in terms of the accumulation of metal(loid)s in sediments and floodplain soils. Related data are scarce, mainly of a screening nature [18,21,22,23,24,25]. This part of the river is much less influenced by contaminants released from Upper Silesia, but water discharge from the city may be an additional source of contamination. To this day, no soil-science-oriented studies have been carried out on the distribution of metals in deep profiles of alluvial soils in the middle Odra valley. It should be emphasized that the profile distribution of elements can be significantly influenced by soil properties and pedological processes. Some metal(loid)s, for instance Cd and Zn, considered mobile and susceptible to remobilization, may migrate downward the soil profile or may be transported with water over greater distances [26,27,28]. Other metal(loid)s, particularly Mn and As, as well as Fe, are susceptible to reductive dissolution and mobilization under reducing conditions [29,30,31,32]. On the contrary, Pb is considered relatively immobile [33,34]. Therefore, the relationships between the concentrations of various elements of the same origin in soils may differ along the river course.
The present study aimed to: (1) examine the extent to which the soils in the Odra valley, in its middle course, are enriched in toxic elements; (2) describe their profile distribution, which will allow us to discuss their origin and fate; (3) check whether there are considerable differences between the inter-embankment zone and the sites out of embankments; (4) attempt to determine local geochemical background of elements based on their concentrations in deep soil layers differing in texture. Additionally, the conditions required for the safe use of contaminated floodplain soils for agricultural purposes are discussed.

2. Materials and Methods

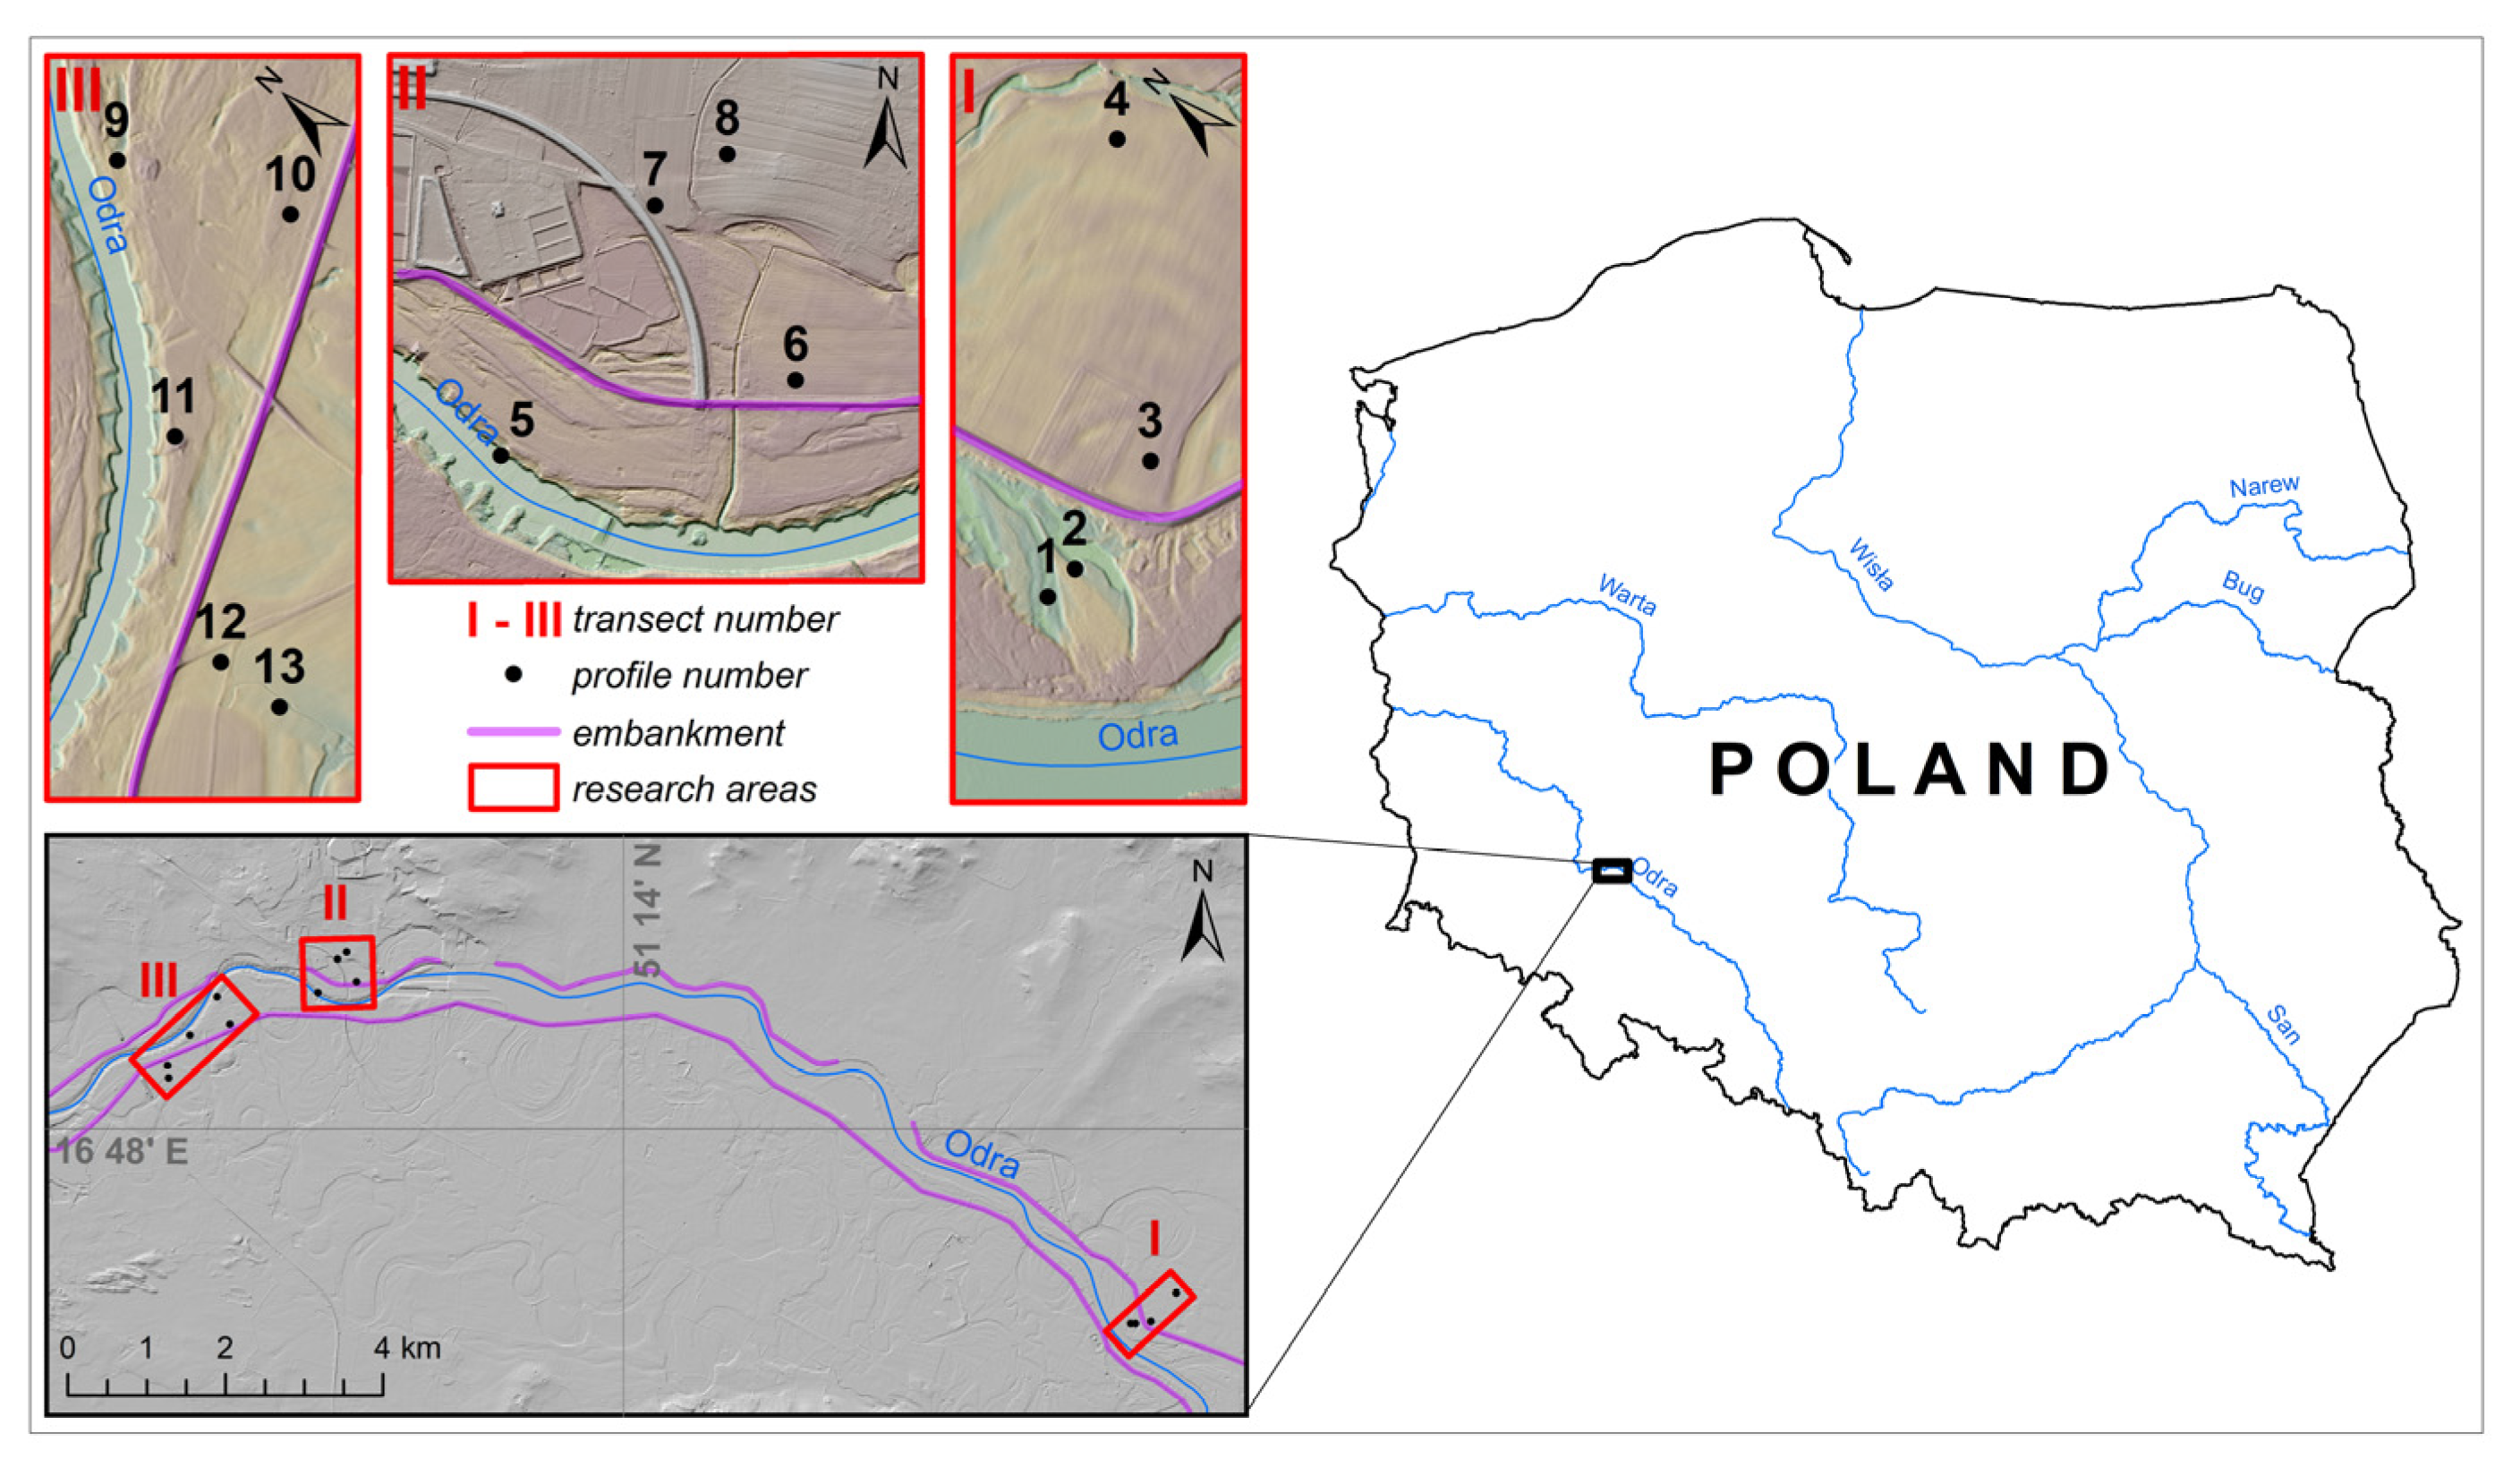
2.1. Research Area and Location of Soil Profiles

The research was carried out in the Odra river valley, in its middle course, downstream from Wrocław (Figure 1), along the length of 15 km. The Pleistocene terraces, shaped by fluvioglacial water of Weichselian glaciation, are mainly built of sands and gravels, while the Holocene terraces contain fine-textured interbeddings. The top layers of floodplains are typically built of loams or silts [35,36,37]. Channeling of the river and the construction of embankments at the beginning of the 20th century effectively protected the zones out of embankment from floods and additionally led to lowering of the groundwater table [18,38]. These changes created favorable conditions for the agricultural use of soils and the replacement of riparian forests by farmlands and pastures by plowed fields [39]. The inter-embankment areas are also used for agricultural purposes, mostly as meadows or pastures.
Thirteen soil profiles examined in this study were situated in three transects (Figure 1) and included six profiles in the inter-embankment zone and seven profiles outside of embankments. All the sites represented agricultural lands: pastures, meadows and arable fields.

2.2. Soil Sampling and Analysis

Soil pits were dug to a depth of 1.5 m or to the level of groundwater. Profile No. 1 was relatively shallow, with a silty clay loam texture and the groundwater depth of 45 cm. All soil profiles were classified and described according to the FAO-WRB [40]. The samples were collected from all morphologically distinguishable horizons and layers. Basic soil properties were determined in representative aliquots of collected samples. Soil texture was determined using a combined sieve and hydrometer method [41]. Chemical analyses were carried out with the methods commonly used in soil science [42], after soil was ground to a fine powder. Soil pH was measured potentiometrically in a suspension in 1 M KCl (1:2.5; v/v). A dry combustion method (Vario MacroCube, Elementar) was used for the determination of organic carbon (Corg). Total concentrations of Pb, Zn, Cu, As, Cd, Mn and Fe were determined, after soil digestion with aqua regia (concentrated HCl + HNO3, 3 + 1) in a microwave system, according to ISO 11466 [43]. The concentrations of elements in the digests were measured via ICP-AES (iCAP 7400, Thermo Fisher Scientific). All analyses were made in triplicates. The accuracy of the results was checked with two reference materials: CNS 392 and CRM 027, supplied by Sigma-Aldrich, certified for aqua regia extracted elements. The recoveries of elements in CRMs ranged 82–124% for Cd and 94–109% for all the elements, which we considered satisfactory.

2.3. Data Analysis

Basic descriptive statistics was applied to examine the distributions of data in all the samples as well as in the subsets defined as: inter-embankment zone (In), out of embankment zone (Out), topsoil A horizons (Top) and deep soil layers (>60 cm). The first comparison of the results between the groups was based on the medians, and further, the data were subject to analysis of variance (ANOVA) followed by Tukey’s test to assess the significance of differences between the means at p < 0.05. Shapiro–Wilk’s normality test (p < 0.05) was applied to check the normality of data distribution. Since the distributions of element concentrations in the entire sets of data were not normal and showed high skewness, the relationships between the concentrations of elements and the parameters of soil properties were examined using a non-parametrical test, in which Spearman correlation coefficients were calculated at p < 0.001. After applying log-transformation, the distributions became close to normal; therefore, a principal component analysis was used in order to illustrate the associations between the variables, as often applied [44,45,46,47]. Only those principal components that contributed to a total variance more than 10% were taken into account. For a subgroup of deeper, uncontaminated horizons, where the data showed distributions close to normal, the equations of simple linear regression were derived to describe key relationships between the concentrations of elements and the parameters of basic soil properties. Statistical analyses were performed using Statistica 13.0 software (TIBCO, Palo Alto, CA, USA).

3. Results and Discussion

3.1. Basic Soil Properties

All soils showed a stratification typical for alluvial soils [48,49,50]. Soil texture showed a broad spectrum from sands, through loams and silts to clays. The clay texture was found in the deep layers of profile 13, out of the embankment, while the presence of layers built of sand was a typical feature for deeper parts of soil profiles both in the inter-embankment and out of the embankment. The top layer of soils in the inter-embankment zone was typically, except for profile 1, developed of silt–loamy material. The depth of this layer was different in various soil profiles, with a maximum of 100 cm in profile 9. Table 1 presents the aggregate data on soil properties in all collected soil samples, as well as in the subgroups: inter-embankment zone (In), out of embankment (Out), topsoils (Top) and deeper layers (>60 cm).
The median content of silt fraction in the group of samples collected from the inter-embankment zone was 47%, which was much higher than that in the samples from the profiles situated out of embankments (18%), most of which had sandy textures (Table S1). The values of soil pH were in a very broad range: 3.40–7.37. Strongly acidic soils (with pH < 4.0) were present in both zones: in profiles 1 and 2 in the inter-embankment zone as well as in profile 13 out of the embankment. Soil CEC values differed widely, ranging from 0.4 to 34.3 mmol(+)/kg, and were clearly dependent on the content of Corg in topsoil samples and on the content of clay fraction in deeper layers.

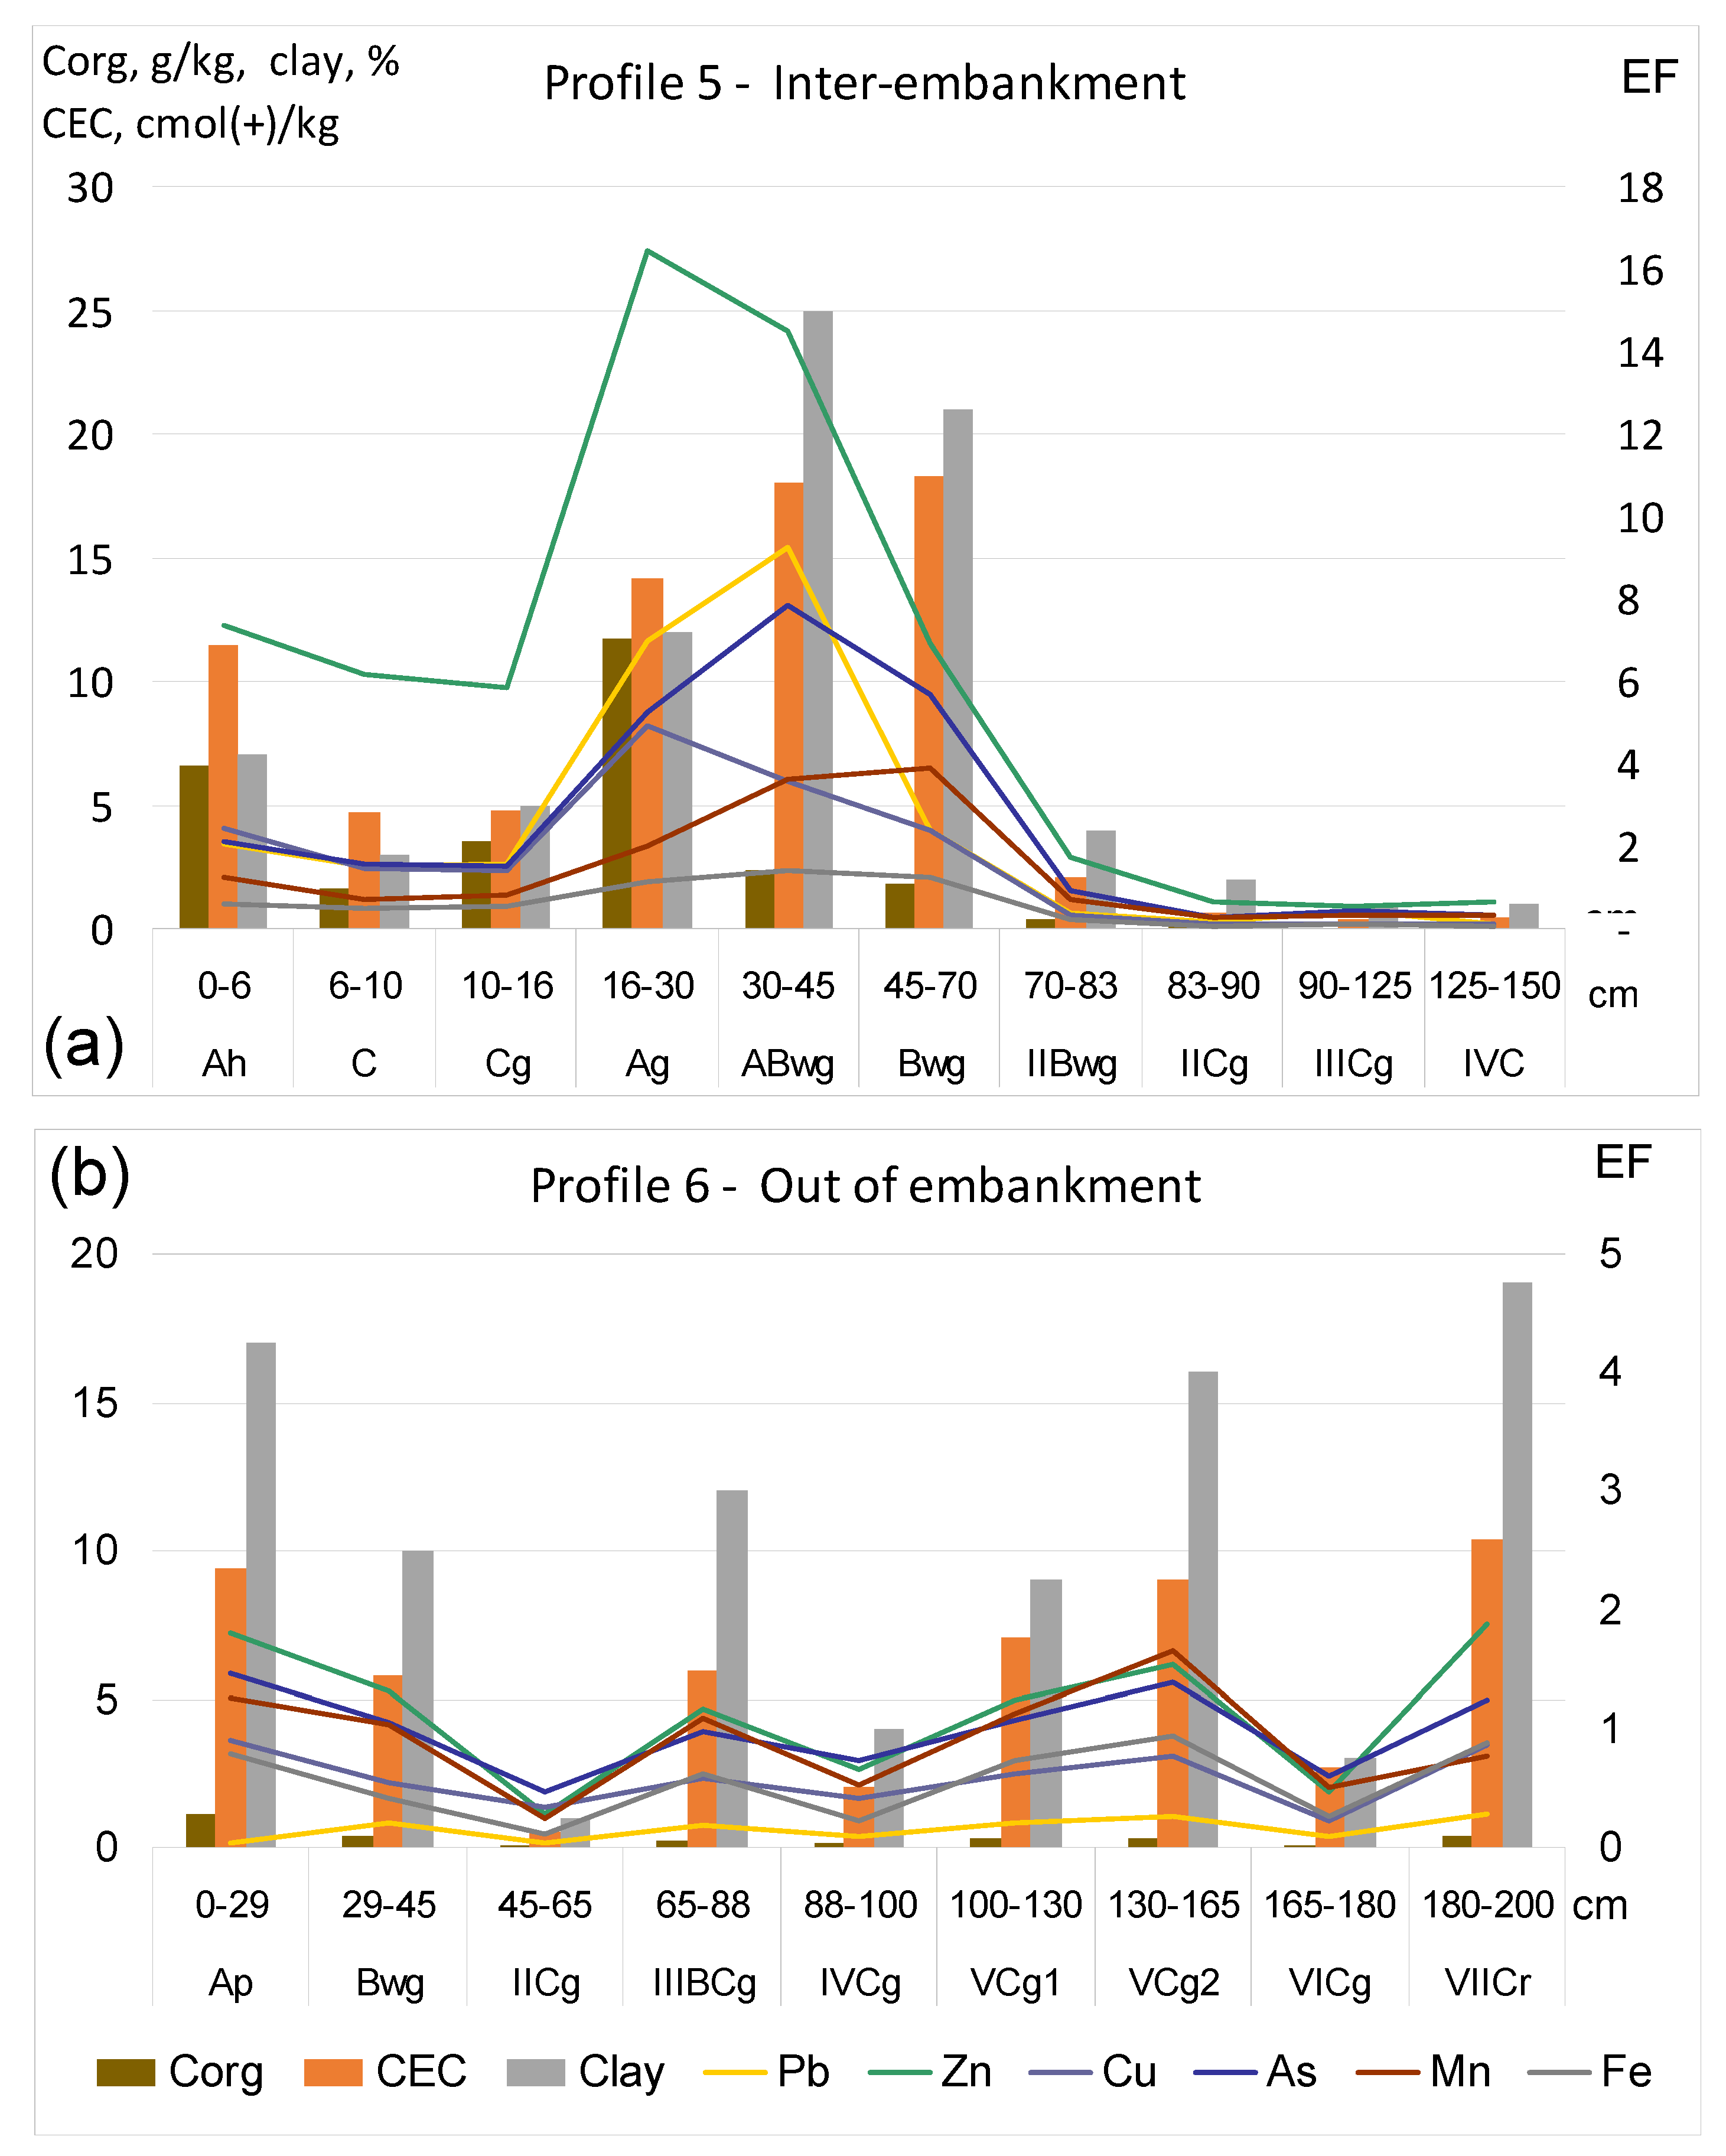
3.2. Metal(loid)s in Soil Profiles

The concentrations of metal(loid)s in soil samples differed widely (Table 2). Particularly high concentrations of typically anthropogenic elements, i.e., Pb, Zn, Cu, As and Cd, occurred in the inter-embankment zone in the surface soil layers (Top). This group of samples was additionally the richest in Corg (Table 1), with a median of 41.4 g/kg Corg and the highest median CEC of 17 cmol(+)/kg.
Illustrations of profile distributions of all metal(loid)s and crucial soil properties in the profiles representative of inter-embankment and out of embankment-zones, in transects II and III, are shown in Figure 2a,b and Figure 3a–c. Due to the fact that the concentrations of individual elements fell in different orders of values, the graphs illustrate the enrichment factors (EFs) instead of absolute concentrations of metal(loid)s. The values of EF were calculated in relation to concentrations commonly accepted as the geochemical background (Table 3), i.e., the median values for European subsoil, according to FOREGS [51,52].
The graphs clearly show that the patterns of profile concentrations of metal(loid)s in soils of transect II (Figure 2a,b) mimic those of CEC values, which are determined mainly by the content of Corg in topsoil and by clay in deeper layers. A particular morphological feature of profile 5, important for the distribution of soil properties and concentrations of metal(loid)s, is the presence of buried, organic-matter-rich Ag (16–30 cm) and ABwg (30–45 cm) horizons, of silty–loam texture, covered by sandy and sand–loamy layers, in which a histic horizon Ah (0–6 cm) has already developed.
The maximum concentrations of typically anthropogenic elements, i.e., Pb, Zn, Cu, As and Cd, in this profile were found in the Ag buried horizon, although in the topsoil layers, they also significantly exceeded the geochemical background. The EF values for these layers were much above 1, and for Zn, they reached a value of 16. Undoubtedly, sediments that build the topsoil layers in this part of the embankment zone were deposited in a relatively recent time, probably during hydrotechnical works reported by Ciszewski and Grygar [9].
Unlike profile 5, the other soil profiles of the inter-embankment zone did not show any disorders in the layout of horizons typical for alluvial soils. The surface soil layers in all the profiles situated in the inter-embankment zone contained relatively high concentrations of metals. Profile 11 turned out to be most contaminated, with very high concentrations of Pb, Zn, Cu, As and Cd in the Ah, ABw and Ap horizons, down to the depth of 55 cm (Figure 3a). Those concentrations exceeded the permissible levels for agricultural soils, defined in Polish law [53] and discussed further in Section 3.5.
In contrast to the soils in the inter-embankment zone, those situated out of the embankment showed no significant enrichment in metal(loid)s in either the surface or deeper horizons. The exception was As in profile 8, with clearly elevated concentrations in deeper soil layers, with a maximum of 24.5 mg/kg in the Cg3 horizon at a depth of 60–80 cm. This horizon was also very rich in aqua regia-extractable Fe (>5%). This concurrence of those two elements is not surprising, confirming a well-known affinity of As to Fe hydroxides [55,56]. Though, this may indicate the importance of ancient hydromorphic processes on the distribution of As in soils, not only in the inter-embankment but also outside the embankment. The source of soil enrichment in As is unknown, but Szerszeń et al. [57] also reported relatively high As concentrations in the deeper layers of alluvial soils, rich in Fe, in the further course of the Odra river, regardless of soil texture.
Figure 4 shows the mean concentrations of metal(loid)s in the samples that belong to four distinguished subgroups, i.e., the surface humus layers (Top) and deeper, mineral layers (>60 cm), collected from the profiles situated in the inter-embankment zone (Int) and out of the embankment (Out). Cadmium was not included in the graph because its concentrations in most samples, particularly in sandy ones, were extremely low, i.e., below the ICP-AES limit of quantification (0.14 mg/kg). Therefore, for Cd, it was not possible to quantitatively determine the means, and only the median values were provided (Table 1). The mean concentrations of other metal(loid)s were compared with the reference values for European subsoils, according to FOREGS [51,52].
The highest concentrations of all metal(loid)s definitely occurred in the subgroup “topsoil in the inter-embankment” (Figure 4). In the case of Pb, Zn and Cu, the maximum concentrations were several times higher compared to the other subgroups and to the European reference values.

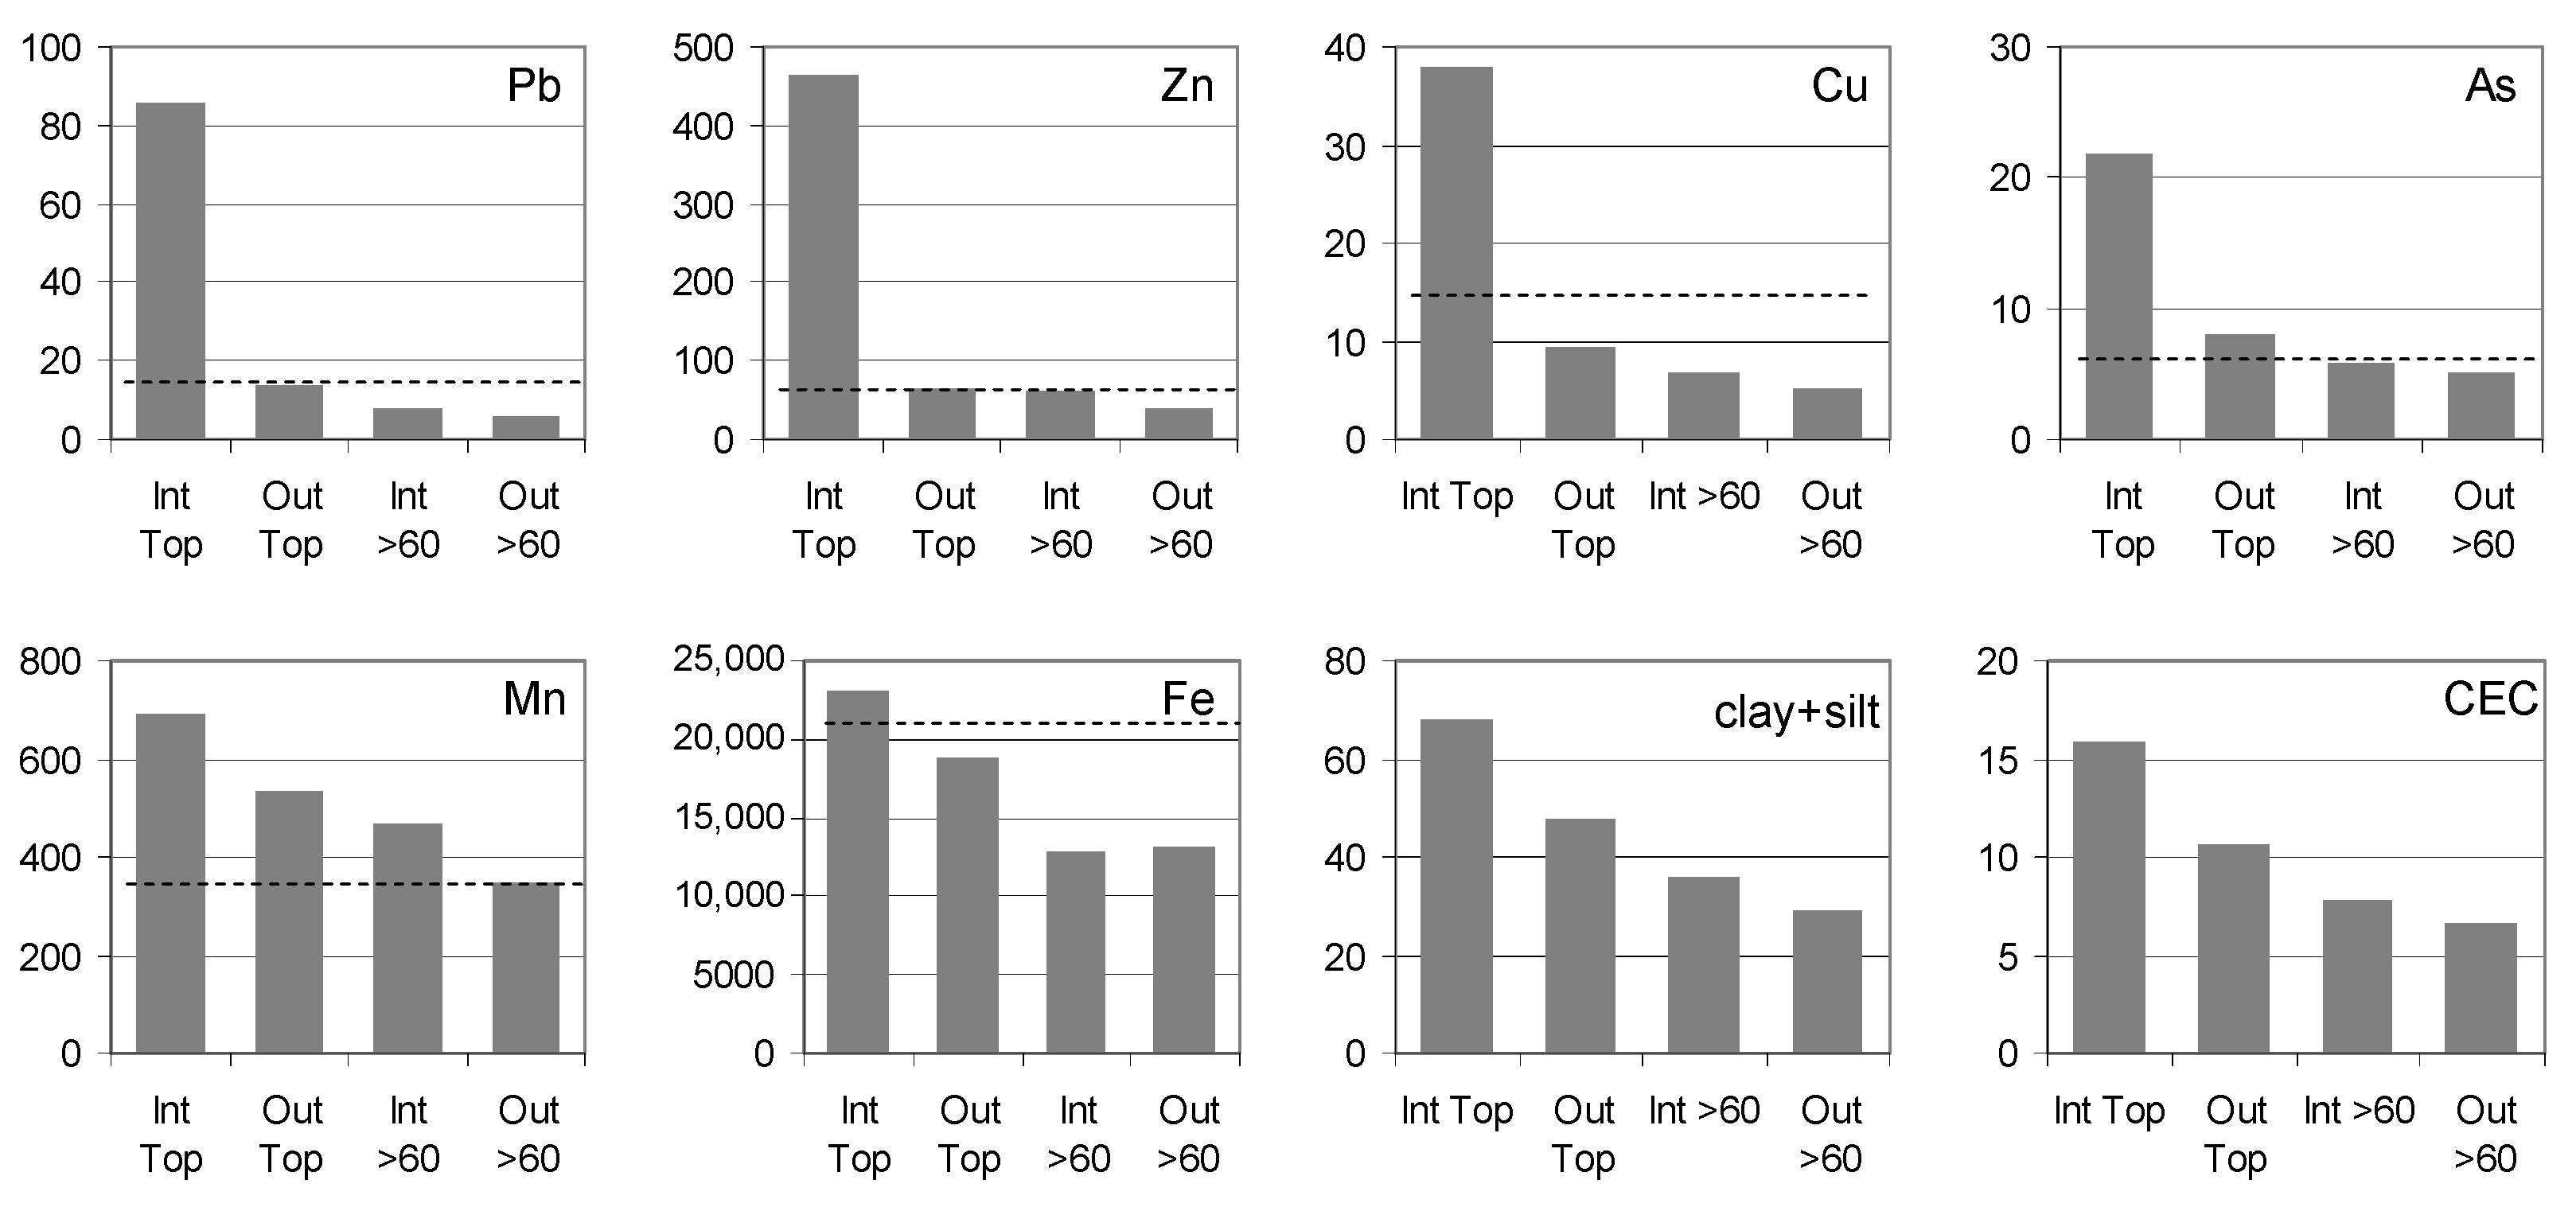
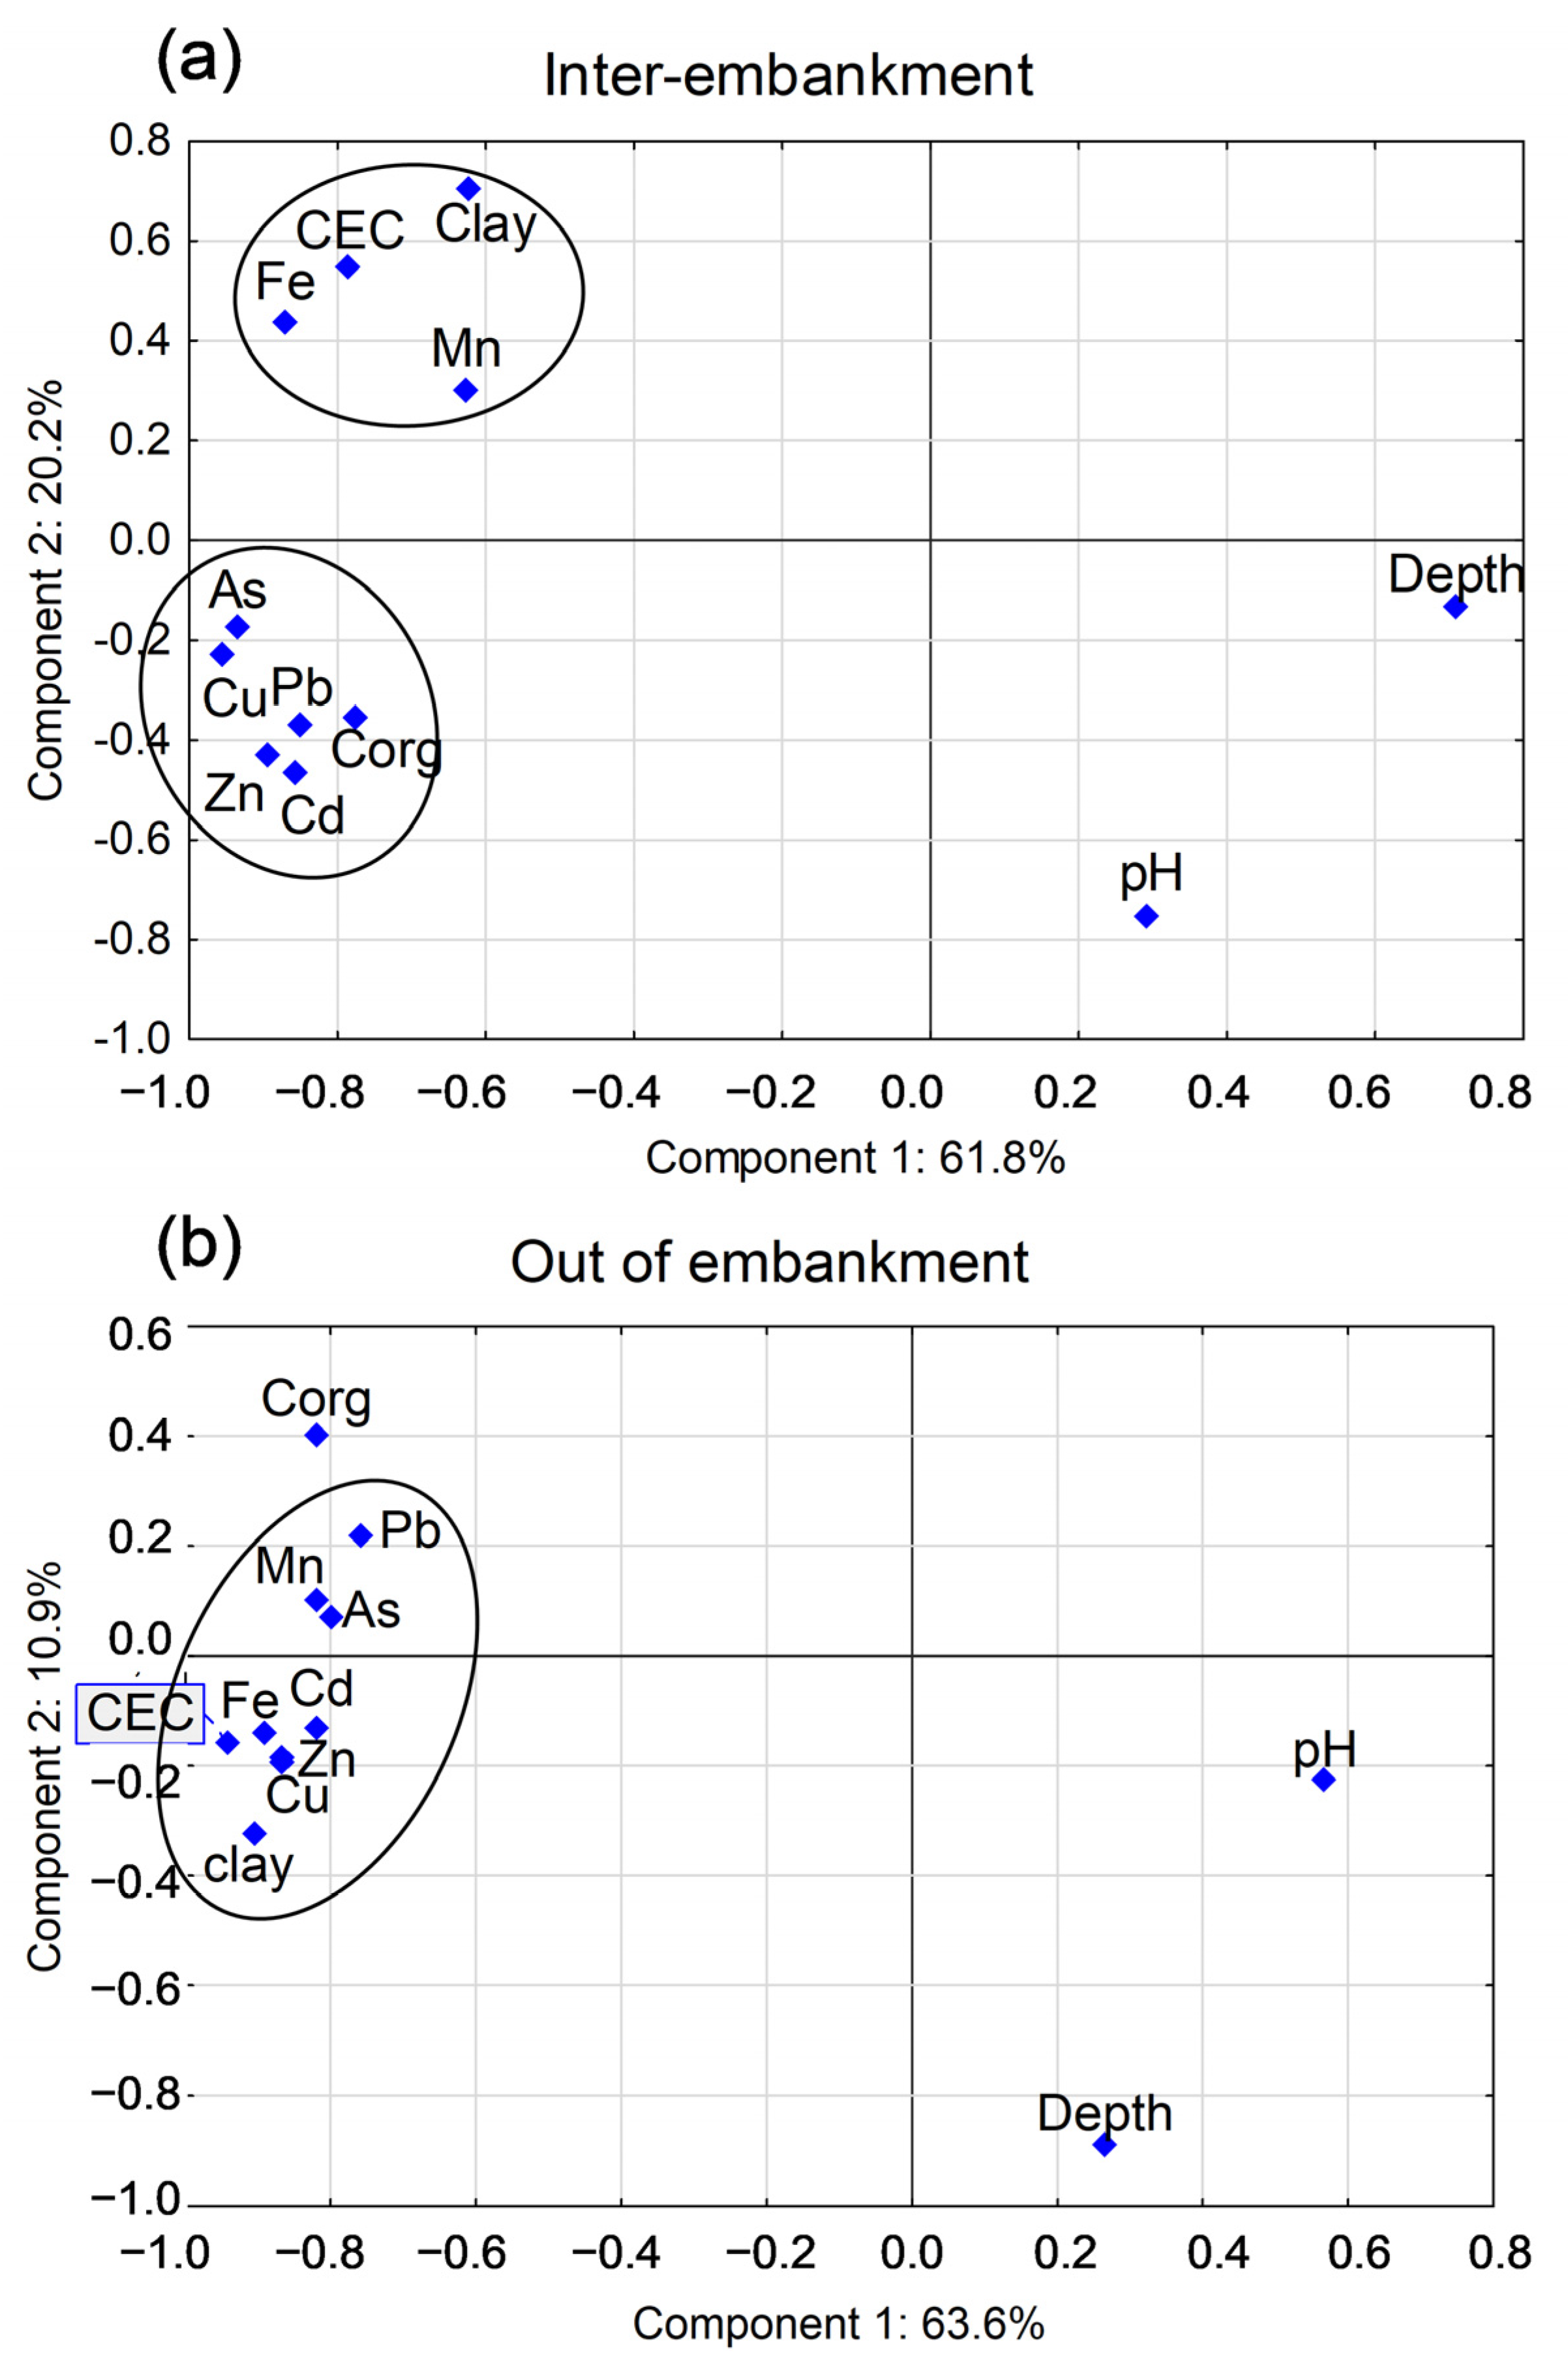
3.3. Factors That Determine Soil Concentrations of Metal(loid)s

The above-presented observations concerning the patterns of profile distribution of elements in soil profiles were confirmed by statistical analysis. Calculated Spearman correlation coefficients (Table 4) indicated strong relationships between the concentrations of elements and soil parameters.
As some of those parameters are interrelated, for instance soil texture and CEC, therefore, the PCA analysis was used to illustrate the complex relationships. This analysis was carried out separately for the soils of the inter-embankment and out-of-embankments zones, with log-transformed concentrations of metal(loid)s. The results confirmed strong relationships between the elements originating from anthropogenic sources, i.e., Pb, Zn, Cu, As, and Cd, and their accumulation in inter-embankment soils, mainly in their surface horizons, rich in humus (Figure 5a). The concentrations of lithogenic elements, i.e., Mn and Fe, in the soils of the inter-embankment zone proved to be mainly related to soil clay content and the CEC values. In the case of out-of-embankment soils, a similar analysis showed no clear division of elements into anthropogenic and lithogenic groups (Figure 5b), and CEC turned out to be the main factor that determined the total concentrations of all elements in those soils. Detailed data on related correlation coefficients are given in Table S2.
The anthropogenic enrichment of surface soil layers in the inter-embankment zone is therefore beyond doubt. It is worth asking, however, whether in the deeper soil horizons, built of older sediments, the relationships between soil properties and concentrations of metal(loid)s differ between the inter- and out-of-embankment zones. Possible differences between them could result from the translocation of elements, their redistribution and secondary enrichment. Therefore, for the deeper (>60 cm) soil layers of both zones, simple correlations between the concentrations of metal(loid)s and crucial soil parameters—clay content, the sum of clay and silt fractions and CEC values—were analyzed. The most significant correlations (Table S3) were obtained for the sum clay + silt. Related graphs are shown in Figure S1. There were single outliers, in particular in profile 11, with a thick layer of silty sediments strongly enriched in metal(loid)s, in which high concentrations of anthropogenic metal(loid)s occurred to the depth of 70 cm. In the case of As, Mn and Fe, there were also some outliers in profiles 8 and 13 (Figure S1) that had particularly heavy clay textures.

3.4. Assessment of Local Geochemical Background

Statistically significant linear relationships between soil concentrations of metal(loids) vs. the sum clay + silt in the subsoils (>60 cm) were quite similar in the inter- and out-of-embankment zones (Figure S1). Therefore, based on related linear equations, it was possible to calculate the concentrations of elements that can be considered natural in the alluvial soils of the Odra valley (Table 5).
Taking into account the discussion concerning the most appropriate methodology of determining the geochemical background [58,59,60,61,62], we believe that these values can be applied as local geochemical background values for soils that have different textures.

3.5. Assessment of Soil Contamination and Environmental Risk

The risk associated with soil contamination was assessed according to the Polish legal regulations [53,63] which differentiate permissible concentrations of contaminants according to the categories of soil usage. In the case of farmland topsoils (0–25 cm), the permissible concentrations of metal(loid)s depend on soil texture and pH. At deeper layers (>25 cm), they are only related to soil water permeability. The permissible concentrations of metal(loid)s in farmland soils are shown in Table 2 as reference values. In our study, they were exceeded in two soil profiles, No. 5 and 11, located in the inter-embankment zone. In profile 5, excessive concentrations applied to Zn, Cd and As in the Ag horizon (16–30 cm), which fell mainly in the 0–25 cm layer, and to Zn in ABwg horizon (30–45 cm). In profile 11, excessive concentrations of Zn, Cd and As were also present in the top horizon Ah (0–15 cm) and Ap (15–30 cm). It should be noted that, in this assessment, the current acidic soil reaction was considered. Although, the efficient liming of those soils would result in their shift from the subgroup 2 to subgroup 3, which would allow the requirements for farmlands to be met.
What will still remain problematic, however, are the concentrations of Zn in deeper soil layers (>25 cm) of two profiles, i.e., in the ABwg horizon of profile 5 (30–45 cm) and the ABw horizon in profile 11, which were as high as 638 and 1145 mg/kg, respectively. Those values exceed the permissible concentrations for low permeability subsoil, i.e., 500 mg/kg. In such a situation, the provisions of Polish law say that the assessment of environmental risk should be carried out in order to make a decision on the need for and method of remediation. A rough analysis of possible adverse environmental effects that could be associated with such high concentrations of Zn in soils, indicated, however, that its partial release due to desorption should not cause any massive pollution of water or any risk to arable crops, provided that topsoils are subject to liming. Therefore, assuming that the soils are limed, the overall environmental risk can be assessed as low.

4. Conclusions

The soils located both in the inter-embankment zone and out of the embankment showed the stratification which is a typical feature of floodplain soils. The surface horizons of inter-embankment soils are built of silty–loam layers of various depths, considerably enriched in metals of anthropogenic origin, in particular Pb, Zn and Cd, and to a lesser extent also in Cu and the metalloid As. Those soils that proved to have acidic reactions will require liming to reduce the risk associated with their potential use for agricultural purposes. It should be stressed, however, that this problem is confined to the inter-embankment zone, while the soils situated out of the embankment did not show any significant enrichment with potentially toxic elements. The concentrations of all the elements in deeper soil layers (>60 cm) in both zones showed a strong, statistically proven, linear dependence on the parameters related to soils’ sorption properties, i.e., CEC, clay content and the sum of clay + silt, with the latter relationship being statistically most significant. Based on this, the typical concentrations of elements related to soil texture were assessed, which can be used as the values of geochemical background for soils of the Odra valley. Some outliers that did not fit to these relationships may indicate a redistribution of elements. For example, particular enrichment in As in the layers composed of sediments with very heavy textures, rich in Fe, may have resulted from a historical redistribution of As under reducing conditions. Confirming this hypothesis would require more detailed, targeted research.

Supplementary Materials

The following supporting information can be downloaded at: https://www.mdpi.com/article/10.3390/ijerph20054196/s1, Table S1: The numbers of soil samples that represented various textural groups and the ranges of pH in all soil samples (N = 99) and in the subgroups: inter-embankment zone and out of embankment; Table S2: The correlations of particular parameters with principal components determined in the PCA analysis; Table S3: Single Pearson correlation coefficients calculated for deep soil samples (>60 cm); Figure S1: The relationships between soil concentrations of metal(loid)s and the sum of clay + silt fraction in the subsoil (>60 cm).

Author Contributions

Conceptualization, D.K. and A.K.; methodology, D.K.; software, D.K.; validation, D.K. and A.K.; formal analysis, D.K.; investigation, D.K.; resources, D.K.; data curation, D.K.; writing—original draft preparation, D.K.; writing—review and editing, A.K.; visualization, D.K.; supervision, A.K.; project administration, D.K.; funding acquisition, D.K. All authors have read and agreed to the published version of the manuscript.

Funding

This research was financed by Wroclaw University of Environmental and Life Sciences from the statutory funds for research. The APC was co-financed by Wrocław University of Environmental and Life Sciences.

Institutional Review Board Statement

Not applicable.

Informed Consent Statement

Not applicable.

Data Availability Statement

The data that support the findings of this study are available from the authors upon request.

Acknowledgments

We would like to express special thanks to Cezary Kabała and Paweł Jezierski for their advice and assistance in field works and description of soil morphology.

Conflicts of Interest

The authors declare no conflict of interest.

References

  1. Rinklebe, J.; Shaheen, S.M. Assessing the mobilization of cadmium, lead, and nickel using a seven-step sequential extraction technique in contaminated floodplain soil profiles along the central Elbe River, Germany. Water Air Soil Poll. 2014, 225, 2039. [Google Scholar] [CrossRef]
  2. Dung, T.T.; Cappuyns, V.; Swennen, R.; Phung, N.K. From geochemical background determination to pollution assessment of heavy metals in sediments and soils. Rev. Environ. Sci. Bio./Technol. 2013, 12, 335–353. [Google Scholar] [CrossRef]
  3. Frohne, T.; Rinklebe, J.; Diaz-Bone, R.A. Contamination of foodplain soils along the Wupper river, Germany, with As Co, Cu, Ni, Sb, and Zn and the impact of predefnite redox variations on the mobility of these elements. Soil Sediment Contam. Int. J. 2014, 23, 779–799. [Google Scholar] [CrossRef]
  4. Popov, S.I.; Stafilov, T.; Šajn, R.; Tănăselia, C. Distribution of trace elements in sediment and soil from river Vardar basin, Macedonia/Greece. J. Environ. Sci. Health Part A 2016, 51, 1–14. [Google Scholar] [CrossRef]
  5. Suleymanov, R.; Dorogaya, E.; Gareev, A.; Minnegaliev, A.; Gaynanshin, M.; Zaikin, S.; Belan, L.; Tuktarova, I.; Suleymanov, A. Assessment of Chemical Properties, Heavy Metals, and Metalloid Contamination in Floodplain Soils under the Influence of Copper Mining: A Case Study of Sibay, Southern Urals. Ecologies 2022, 3, 530–538. [Google Scholar] [CrossRef]
  6. Kanianska, R.; Varga, J.; Benková, N.; Kizeková, M.; Jančová, Ľ. Floodplain soils contamination assessment using the sequential extraction method of heavy metals from past mining activities. Sci. Rep. 2022, 12, 2927. [Google Scholar] [CrossRef] [PubMed]
  7. Cebula, E.; Ciba, J. Effects of flooding in southern Poland on heavy metal concentrations in soils. Soil Use Manag. 2005, 21, 348–351. [Google Scholar] [CrossRef]
  8. Barać, N.; Škrivanj, S.; Bukumirić, Z.; Živojinović, D.; Manojlović, D.; Barać, M.; Petrović, R.; Ćorac, A. Distribution and mobility of heavy elements in floodplain agricultural soils along the Ibar River (Southern Serbia and Northern Kosovo). Chemometric investigation of pollutant sources and ecological risk assessment. Environ. Sci. Pollut. Res. 2016, 23, 9000–9011. [Google Scholar] [CrossRef]
  9. Ciszewski, D.; Grygar, T.M. A review of flood-related storage and remobilization of heavy metal pollutants in river systems. Water Air Soil Pollut. 2016, 227, 239. [Google Scholar] [CrossRef] [Green Version]
  10. Kotková, K.; Nováková, T.; Tůmová, Š.; Kiss, T.; Popelka, J.; Faměra, M. Migration of risk elements within the floodplain of the Litavka River, the Czech Republic. Geomorphology 2019, 329, 46–57. [Google Scholar] [CrossRef]
  11. Absalon, D.; Matysik, M. Changes in water quality and runoff in the Upper Oder River Basin. Geomorphology 2007, 92, 106–118. [Google Scholar] [CrossRef]
  12. Aleksander-Kwaterczak, U.; Helios-Rybicka, E. Contaminated sediments as a potential source of Zn, Pb, and Cd for a river system in the historical metalliferous ore mining and smelting industry area of South Poland. J. Soils Sediments 2009, 9, 13–22. [Google Scholar] [CrossRef]
  13. Ciszewski, D.; Turner, J. Storage of sediment-associated heavy metals along the channelized Odra River, Poland. Earth Surf. Proc. Landforms 2009, 34, 558–572. [Google Scholar] [CrossRef]
  14. Jabłońska-Czapla, M.; Nocoń, K.; Szopa, S.; Łyko, A. Impact of the Pb and Zn ore mining industry on the pollution of the Biała Przemsza River, Poland. Environ. Monit. Assess. 2016, 188, 262. [Google Scholar] [CrossRef] [PubMed] [Green Version]
  15. Faměra, M.; Grygar, T.M.; Ciszewski, D.; Czajka, A.; Álvarez-Vázquez, M.Á.; Hron, K.; Fačevicová, K.; Hýlová, V.; Tůmová, Š.; Světlík, I.; et al. Anthropogenic records in a fluvial depositional system: The Odra River along The Czech-Polish border. Anthropocene 2021, 34, 100286. [Google Scholar] [CrossRef]
  16. Strzebońska, M.; Jarosz-Krzemińska, E.; Adamiec, E. Assessing historical mining and smelting effects on heavy metal pollution of river systems over span of two decades. Water Air Soil Pollut. 2017, 228, 141. [Google Scholar] [CrossRef] [PubMed] [Green Version]
  17. Czaja, S. Changes in river discharge structure and regime in mining-industrial-urban areas. Reg. Environ. Chang. 2005, 5, 18–26. [Google Scholar] [CrossRef]
  18. Ciszewski, D.; Czajka, A. Human-induced sedimentation patterns of a channelized lowland river. Earth Surf. Proc. Landforms 2015, 40, 783–795. [Google Scholar] [CrossRef]
  19. Bojakowska, I.; Sokołowska, G. Influence of ore mining and metallurgy for pollution of the Odra River alluvial deposits with trace elements. Przegl. Geolog. 1998, 46, 603–608. (In Polish) [Google Scholar]
  20. Ciszewski, D. Heavy metals in vertical profiles of the middle Odra River overbank sediments: Evidence for pollution changes. Water Air Soil Pollut. 2003, 143, 81–98. [Google Scholar] [CrossRef]
  21. Lis, J.; Pasieczna, A. (Eds.) Geochemical Atlas of Poland; 1:2 500 000; Państwowy Instytut Geologiczny: Warszawa, Poland, 1995; pp. 1–72.
  22. Karczewska, A.; Kaszubkiewicz, J.; Kabała, C.; Jezierski, P.; Spiak, Z.; Szopka, K. Tailings impoundments of Polish copper mining industry—Environmental effects, risk assessment and reclamation. In Assessment, Restoration and Reclamation of Mining Influenced Soils; Academic Press: Cambridge, MA, USA, 2017; pp. 149–202. [Google Scholar] [CrossRef]
  23. Tomassi-Morawiec, H.; Lis, J.; Pasieczna, A. Geochemical Atlas of Wrocław and Environs. 1: 100 000. Part 1; Państwowy Instytut Geologiczny: Warszawa, Poland, 1998; pp. 1–76.
  24. Kaszubkiewicz, J.; Pora, E.; Kawałko, D.; Jezierski, P.; Gałka, B. Comparison of total content of zinc and arsenic in soils of Średzka Upland and Wrocław Ice-Marginal Valley. Environ. Prot. Nat. Res. 2014, 25, 35–40. [Google Scholar] [CrossRef] [Green Version]
  25. Gielar, A.; Helios-Rybicka, E.; Möller, S.; Einax, J.W. Multivariate analysis of sediment data from the upper and middle Odra River (Poland). Appl. Geochem. 2012, 27, 1540–1545. [Google Scholar] [CrossRef]
  26. Schulz-Zunkel, C.; Krueger, F. Trace metal dynamics in floodplain soils of the River Elbe: A review. J. Environ. Qual. 2009, 38, 1349–1362. [Google Scholar] [CrossRef] [PubMed]
  27. Debnath, A.; Singh, P.K.; Sharma, Y.C. Metallic contamination of global river sediments and latest developments for their remediation. J. Environ. Manag. 2021, 298, 113378. [Google Scholar] [CrossRef]
  28. Ponting, J.; Kelly, T.J.; Verhoef, A.; Watts, M.J.; Sizmur, T. The impact of increased flooding occurrence on the mobility of potentially toxic elements in floodplain soil—A review. Sci. Total Environ. 2021, 754, 142040. [Google Scholar] [CrossRef]
  29. Lynch, S.F.; Batty, L.C.; Byrne, P. Environmental risk of metal mining contaminated river bank sediment at redox-transitional zones. Minerals 2014, 4, 52–73. [Google Scholar] [CrossRef] [Green Version]
  30. Gorny, J.; Billon, G.; Lesven, L.; Dumoulin, D.; Madé, B.; Noiriel, C. Arsenic behavior in river sediments under redox gradient: A review. Sci. Total Environ. 2015, 505, 423–434. [Google Scholar] [CrossRef] [PubMed]
  31. Lewińska, K.; Karczewska, A.; Siepak, M.; Szopka, K.; Gałka, B.; Iqbal, M. Effects of waterlogging on the solubility of antimony and arsenic in variously treated shooting range soils. Appl. Geochem. 2019, 105, 7–16. [Google Scholar] [CrossRef]
  32. Szopka, K.; Gruss, I.; Gruszka, D.; Karczewska, A.; Gediga, K.; Gałka, B.; Dradrach, A. The effects of forest litter and waterlogging on the ecotoxicity of soils strongly enriched in arsenic in a historical mining site. Forests 2021, 12, 355. [Google Scholar] [CrossRef]
  33. Alloway, B.J. (Ed.) Heavy metals in soils. In Trace Metals and Metalloids in Soils and Their Bioavailability; Springer: Dordrecht, The Netherlands, 2013. [Google Scholar] [CrossRef]
  34. Caporale, A.G.; Violante, A. Chemical processes affecting the mobility of heavy metals and metalloids in soil environments. Curr. Poll Rep. 2016, 2, 15–27. [Google Scholar] [CrossRef] [Green Version]
  35. Marks, L. Quaternary glaciations in Poland. In Developments in Quaternary Sciences; Elsevier: Amsterdam, The Netherlands, 2011; Volume 15, pp. 299–303. [Google Scholar] [CrossRef]
  36. Kabała, C. (Ed.) Soils of Lower Silesia. Origins, Diversity and Protection; Monograph. Polish Society of Soil Science, Polish Humic Substances Society; PTG; PTSH: Wrocław, Poland, 2015; Available online: https://www.org.up.wroc.pl/igosr/PTG29/monografia.pdf (accessed on 1 September 2022).
  37. Kawałko, D.; Jezierski, P.; Kabała, C. Morphology and physicochemical properties of alluvial soils in riparian forests after river regulation. Forests 2021, 12, 329. [Google Scholar] [CrossRef]
  38. Głuchowska, B.; Pływaczyk, L. Contemporary Problems in Environmental Engineering. In Groundwater Level in the Odra River Valley Downstream the Brzeg Dolny; Wydawnictwo UP We: Wrocławiu, Poland, 2008; pp. 1–109. [Google Scholar]
  39. Kabala, C.; Gałka, B.; Jezierski, P.; Bogacz, A. Transformation of Fluvisols caused by river regulation and long-term farming—A case study from the Dobra River valley in the Silesian Lowland. Rocz. Glebozn. (Soil Sci. Annu.) 2011, 62, 141–153. [Google Scholar]
  40. FAO-WRB. World Reference Base for Soil Resources 2014, update 2022. In International Soil Classification System for Naming Soils and Creating Legends for Soil Maps, 4th ed.; IUSS Working Group WRB; International Union of Soil Sciences (IUSS): Vienna, Austria, 2022. [Google Scholar]
  41. Papuga, K.; Kaszubkiewicz, J.; Wilczewski, W.; Stas, M.; Belowski, J.; Kawałko, D. Soil grain size analysis by the dynamometer method—A comparison to the pipette and hydrometer method. Soil Sci. Ann. 2018, 69, 17–27. [Google Scholar] [CrossRef]
  42. Tan, K. Soil Sampling, Preparation, and Analysis, 2nd ed.; CRC Press: Boca Raton, FL, USA, 2005. [Google Scholar]
  43. ISO 11466; Soil Quality; Extraction of Trace Elements Soluble in Aqua Regia. International Standarization Organization: Geneva, Switzerland; ISO: London, UK, 1995.
  44. Reid, M.K.; Spencer, K.L. Use of principal components analysis (PCA) on estuarine sediment datasets: The effect of data pre-treatment. Environ. Pollut. 2009, 157, 2275–2281. [Google Scholar] [CrossRef] [PubMed]
  45. Šajn, R.; Halamić, J.; Peh, Z.; Galović, L.; Alijagić, J. Assessment of the natural and anthropogenic sources of chemical elements in alluvial soils from the Drava River using multivariate statistical methods. J. Geochem. Explor. 2011, 110, 278–289. [Google Scholar] [CrossRef]
  46. Li, P.; Qian, H.; Howard, K.W.; Wu, J. Heavy metal contamination of Yellow River alluvial sediments, northwest China. Environ. Earth Sci. 2015, 73, 3403–3415. [Google Scholar] [CrossRef]
  47. Setia, R.; Dhaliwal, S.S.; Singh, R.; Kumar, V.; Taneja, S.; Kukal, S.S.; Pateriya, B. Phytoavailability and human risk assessment of heavy metals in soils and food crops around Sutlej river, India. Chemosphere 2021, 263, 128321. [Google Scholar] [CrossRef] [PubMed]
  48. Macklin, M.G.; Benito, G.; Gregory, K.J.; Johnstone, E.; Lewin, J.; Michczyńska, D.J.; Soja, R.; Starkel, L.; Thorndycraft, V.R. Past hydrological events reflected in the Holocene fluvial record of Europe. Catena 2006, 66, 145–154. [Google Scholar] [CrossRef]
  49. Du Laing, G.; Rinklebe, J.; Vandecasteele, B.; Meers, E.; Tack, F.M.G. Trace metal behaviour in estuarine and riverine floodplain soils and sediments: A review. Sci. Total Environ. 2009, 407, 3972–3985. [Google Scholar] [CrossRef]
  50. Łabaz, B.; Bogacz, A.; Kabała, C. Anthropogenic transformation of soils in the Barycz valley-conclusions for soil classification. Soil Sci. Ann. 2014, 65, 103. [Google Scholar] [CrossRef] [Green Version]
  51. Salminen, T. (Ed.) Geochemical Atlas of Europe Part 1: Background Information, Methodology and Maps; EuroGeosurveys & Foregs: Espoo, Finland, 2004; pp. 1–690. [Google Scholar]
  52. Lado, L.R.; Hengl, T.; Reuter, H.I. Heavy metals in European soils: A geostatistical analysis of the FOREGS Geochemical database. Geoderma 2008, 148, 189–199. [Google Scholar] [CrossRef]
  53. Regulation of the Minister for the Environment of 1 September 2016 on the Method How to Carry out the Assessment of Soil Contamination. Polish Journal of Laws of 2016, Item 1395; 2016; (In Polish). Available online: https://isap.sejm.gov.pl/isap.nsf/DocDetails.xsp?id=wdu20160001395 (accessed on 20 January 2023).
  54. Reimann, C.; Fabian, K.; Birke, M.; Filzmoser, P.; Demetriades, A.; Négrel, P.; Oorts, K.; Matschullat, J.; de Caritat, P.; Albanese, S.; et al. GEMAS: Establishing geochemical background and threshold for 53 chemical elements in European agricultural soil. Appl. Geochem. 2018, 88, 302–318. [Google Scholar] [CrossRef] [Green Version]
  55. Komárek, M.; Vaněk, A.; Ettler, V. Chemical stabilization of metals and arsenic in contaminated soils using oxides—A review. Environ. Pollut. 2013, 172, 9–22. [Google Scholar] [CrossRef]
  56. Wenzel, W.W. Arsenic. In Heavy Metals in Soils. Trace Metals and Metalloids in Soils and Their Bioavailability, 3rd ed.; Alloway, B.J., Ed.; Springer: Berlin/Heidelberg, Germany, 2013; pp. 241–282. [Google Scholar] [CrossRef]
  57. Szerszeń, L.; Laskowski, S.; Kollender-Szych, A. Wpływ procesów typologicznych na zawartość arsenu w niektórych gatunkach Mad Odrzańskich z okolic Głogowa. Effect of typological processes on the arsenic content in some kinds of Odra alluvial soils in the environs of Głogów. Zesz. Probl. Post Nauk. Roln. 1983, 242, 83–89. (In Polish) [Google Scholar]
  58. Reimann, C.; Garrett, R.G. Geochemical background—Concept and reality. Sci. Total Environ. 2005, 350, 12–27. [Google Scholar] [CrossRef] [PubMed]
  59. Gałuszka, A.; Migaszewski, Z.M. Geochemical background—An environmental perspective. Mineralogia 2011, 42, 7–17. [Google Scholar] [CrossRef]
  60. Wang, Z.; Darilek, J.L.; Zhao, Y.; Huang, B.; Sun, W. Defining soil geochemical baselines at small scales using geochemical common factors and soil organic matter as normalizers. J. Soils Sediments 2011, 11, 3–14. [Google Scholar] [CrossRef]
  61. Wang, Z.; Wang, K.; Huang, B.; Darilek, J.L.; Zhao, Y. A novel statistical method of defining geochemical baselines and source identification for trace metals in soil in Zhangjiagang County, China. J. Soils Sediments 2021, 21, 2619–2627. [Google Scholar] [CrossRef]
  62. Mao, L.; Kong, H.; Li, F.; Chen, Z.; Wang, L.; Lin, T.; Lu, Z. Improved geochemical baseline establishment based on diffuse sources contribution of potential toxic elements in agricultural alluvial soils. Geoderma 2022, 410, 115669. [Google Scholar] [CrossRef]
  63. Karczewska, A.; Kabała, C. Environmental risk assessment as a new basis for evaluation of soil contamination in Polish law. Soil Sci. Ann. 2017, 68, 67. [Google Scholar] [CrossRef] [Green Version]
Figure 1. Study area and situation of soil profiles.
Ijerph 20 04196 g001
Figure 2. Distribution of metal(loid)s, against the background of crucial parameters of soil properties, in profiles 5 (a) and 6 (b), representative of the inter-embankment and out of embankment zones, respectively, in transect No. II. EF—enrichment factor calculated in relation to geochemical background; details are provided in the text.
Ijerph 20 04196 g002
Figure 3. Distribution of metal(loid)s, against the background of crucial parameters of soil properties, in profiles 11 (a) in inter-embankment zone, 12 (b) and 13 (c) out of embankments, in transect No. III. Deeper soil layers in profile 12 had the light texture of sand, while those in profile 13 were much heavier, i.e., clay loam and clay. EF—enrichment factor calculated in relation to geochemical background; details are provided in the text.
Ijerph 20 04196 g003
Figure 4. Mean concentrations of metal(loid)s: Pb, Zn, Cu, As, Mn and Fe in soils (mg/kg), as well as the mean values of clay + silt content (%) and CEC (cmol(+)/kg). Median values reported by FOREGS (Table 3) for European subsoil are shown with dashed lines.
Ijerph 20 04196 g004
Figure 5. The results of PCA analysis carried out for: (a) inter-embankment (above) and (b) out-of-embankment (below) soil samples, separately.
Ijerph 20 04196 g005
Table 1. Cumulative data on soil properties in all sampled soil samples (N = 99) and in the subgroups: inter-embankment zone (In) and out of embankment (Out), as well as (within them): the top horizons A enriched in organic matter (Top) and deeper layers (>60 cm). Presented are: Min–Max/Median values.
ParameterAll SamplesInter-Embankment Zone (In)Out of Embankment (Out)
AllTop Layers 1>60 cmAllTop Layers 1>60 cm
Number of samples99511530481035
Skeleton, %
(gravel and stones)
0–250–170–170–20–250–210–25
0000010
Sand 2, %8–9910–9910–9916–988–9914–7510–99
61342370745989
Silt 2, %<1–66<1–660–640–63<1–6521–630–53
2547562318275
Clay 2, %1–561–403–311–401–564–281–56
121620118165
Clay + silt 2, %1–921–9013–891–881–9225–861–92
39667626264211
Corg, g/kg0.3–1180.3–11815.3–1180.3–17.90.5–21.13.3–21.10.5–13.3
3.57.741.42.52.411.41.3
pH3.40–7.373.66–6.163.73–5.323.80–6.163.40–7.373.42–6.173.40–7.37
5.094.854.834.935.304.755.31
CEC, cmol(+)/kg0.4–34.30.4–25.44.7–25.40.4–25.00.5–34.33.0–19.10.5–34.3
7.413.617.06.14.99.92.9
1 Top layers—A horizons (having the features of Corg accumulation); 2 in fine soil (<2 mm).
Table 2. Cumulative data on the concentrations of metal(loid)s in all sampled soil samples (N = 99) and in the subgroups: inter-embankment zone (In) and out of embankment (Out), as well as (within them): the top horizons A enriched in organic matter (Top) and deeper layers (>60 cm). Presented are: Min–Max/Median values.
ParameterAll SamplesInter-Embankment Zone (In)Out of Embankment (Out)
AllTop Layers>60 cmAllTop Layers >60 cm
Number of samples99511530481035
Pb, mg/kg1.1–2661.1–26622.6–2661.1–39.71.2–20.11.5–20.11.2–19.6
9.513.150.36.24.714.54.1
Zn, mg/kg5.1–11455.4–1145105–11455.4–3855.1–13825.0–1105.1–138
588632445296027
Cu, mg/kg0.2–74.70.4–74.716.5–74.70.4–27.40.2–22.13.6–17.60.2–22.1
7.411.934.15.04.27.42.6
As, mg/kg1.0–45.81.2–45.87.6–45.81.2–28.51.0–24.52.5–13.91.0–24.5
6.28.616.14.43.67.73.0
Cd, mg/kg<0.14–3.57<0.14–3.570.40–3.57<0.14–1.04<0.14–1.360.40–0.86<0.14–1.36
0.400.561.570.400.400.400.40
Mn, mg/kg15–201031–1560238–122031–156015–2010220–91615–2010
383569678366253465179
Fe, g/kg1.22–57.512.1–32.310.7–32.312.2–31.21.67–57.53.60–47.41.67–57.5
13.319.523.710.99.317.37.34
Table 3. Reference concentrations of metal(loid)s in soils according to various sources.
ElementGeochemical BackgroundPermissible Values
Agricultural Soils Ap Horizon 3According to FOREGS 1According to Polish Law 2
TopsoilSubsoilTopsoil, SubgroupsSubsoil, with Permeability
Q25MedianMin.MedianMin.Median123HL
Pb6.79.7<315<310100250500100300
Zn20304485443005001000300500
Cu5.49.4112<113.9100150300100200
As1.22.3<56.0<55.01020502050
Cd0.080.12<0.010.145<0.010.0923535
Mn154280<10382<10337Not determined
FeNo data70019,60070021,100
1 FOREGS [51,52]; 2 Polish Journal of Laws [53]; subgroups for farmland topsoil (0–25 cm) distinguished according to fraction < 0.02 mm, pH and Corg; permissible values for subsoil: H—with high permeability (>10−7 m/s) and low permeability (≤10−7 m/s); 3 agricultural soils of North Europe, GEMAS [54].
Table 4. Single Spearman correlation coefficients between the main parameters of soil properties and concentrations of metal(loid)s. All the correlations proved significant at the level of 99.9% (p < 0.001). Particularly high values of coefficient (>0.840) have been highlighted in bold.
ElementClayClay + SiltCorgpHCECPbZnCuAsCdMn
Pb0.6850.7750.899−0.4510.804x
Zn0.7540.8190.897−0.3660.8470.898x
Cu0.7610.8430.895−0.4120.8520.9070.938x
As0.7750.8480.876−0.4820.8650.8460.8510.853x
Cd0.5540.6150.759−0.3720.6710.7050.7270.7260.742x
Mn0.6470.7340.690−0.4710.7210.6520.6640.6560.8320.573x
Fe0.9130.9390.813−0.5260.9430.7630.8080.8150.9160.6750.798
Table 5. Assessed values of geochemical background in alluvial soils of the middle Odra valley as related to soil texture (the sum of clay + silt/or sand fractions).
Clay + SiltSandPbZnCuAsMnFe
%%mg/kgmg/kgmg/kgmg/kgmg/kgg/kg
5953.0191.52.21853.8
10903.7252.32.82255.5
20805.1363.93.93048.9
30706.5475.65.138412.3
40607.9587.26.246315.7
50509.4698.97.454319.1
604010.88110.58.562222.6
703012.29212.19.770226.0
802013.610313.810.878129.4
901015.011415.412.086132.8
Disclaimer/Publisher’s Note: The statements, opinions and data contained in all publications are solely those of the individual author(s) and contributor(s) and not of MDPI and/or the editor(s). MDPI and/or the editor(s) disclaim responsibility for any injury to people or property resulting from any ideas, methods, instructions or products referred to in the content.

