
Decreased Functional Connectivity of Brain Networks in the Alpha Band after Sleep Deprivation Is Associated with Decreased Inhibitory Control in Young Male Adults
 ,
, 
Abstract
:1. Introduction
2. Materials and Methods
2.1. Participants
2.2. Experimental Tasks and Procedures
2.2.1. Visual Go/NoGo Task
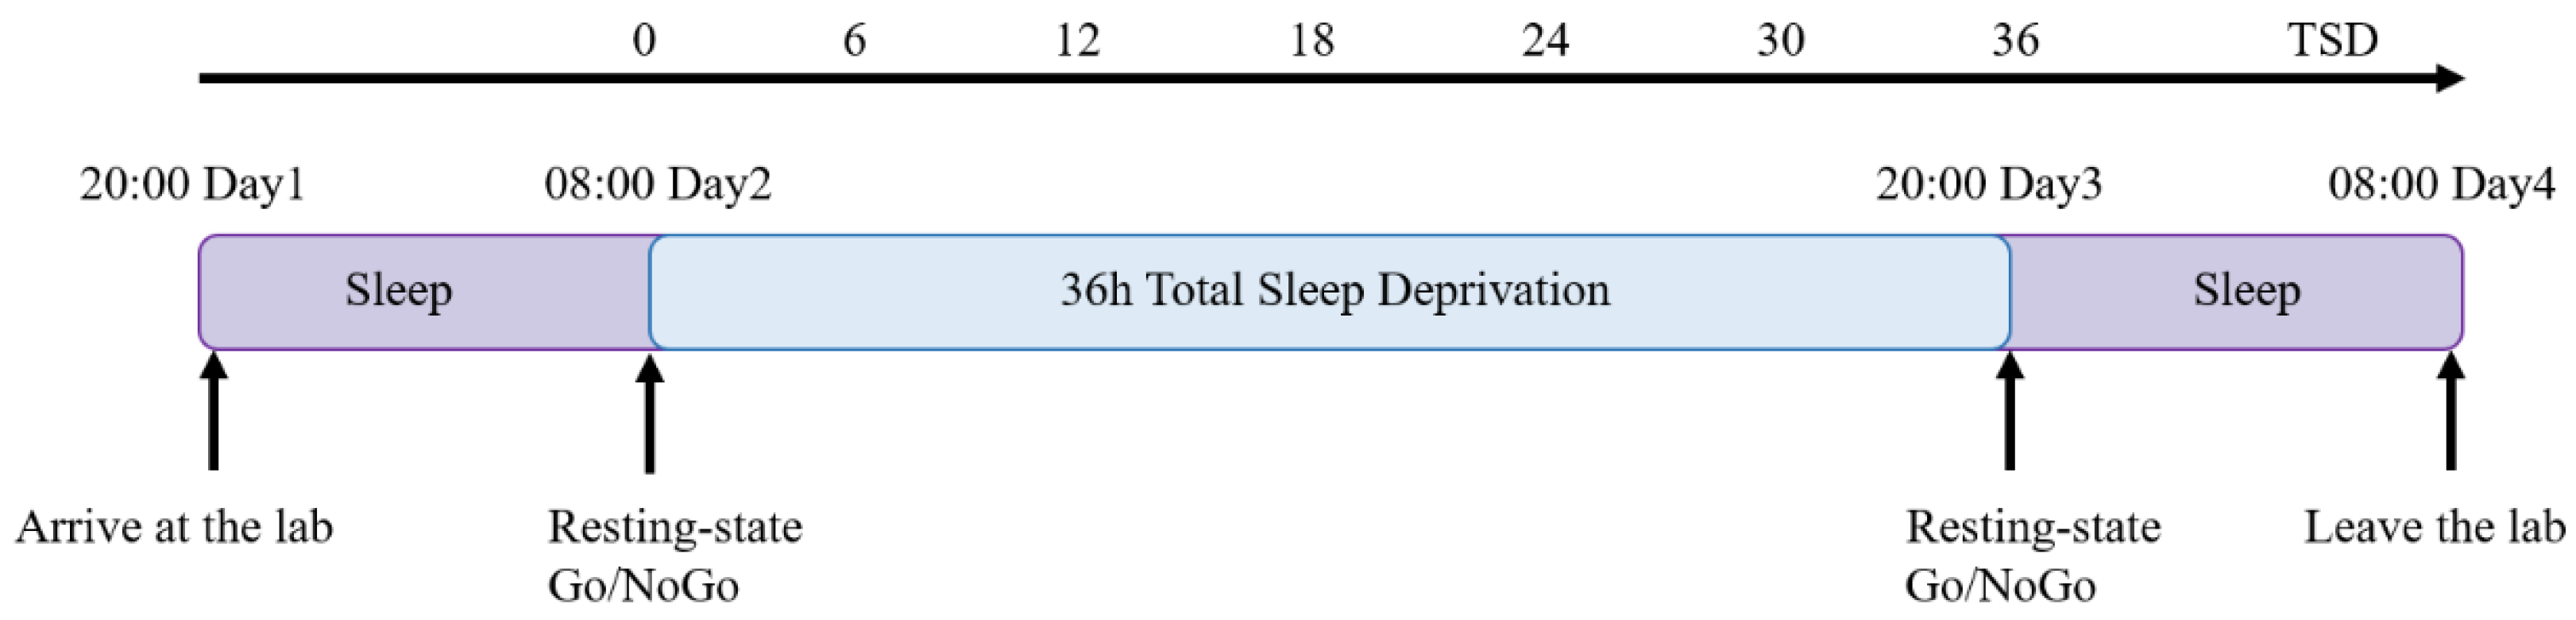
2.2.2. Experimental Procedures
2.3. Data Collection
2.4. Data Analysis
2.4.1. Behavioral Statistical Analysis
2.4.2. Data Preprocessing and ERP Statistical Analysis
2.4.3. EEG Source Connectivity Analysis
2.4.4. Correlation Analysis
3. Results
3.1. Behavioral Performance
3.2. ERP Results
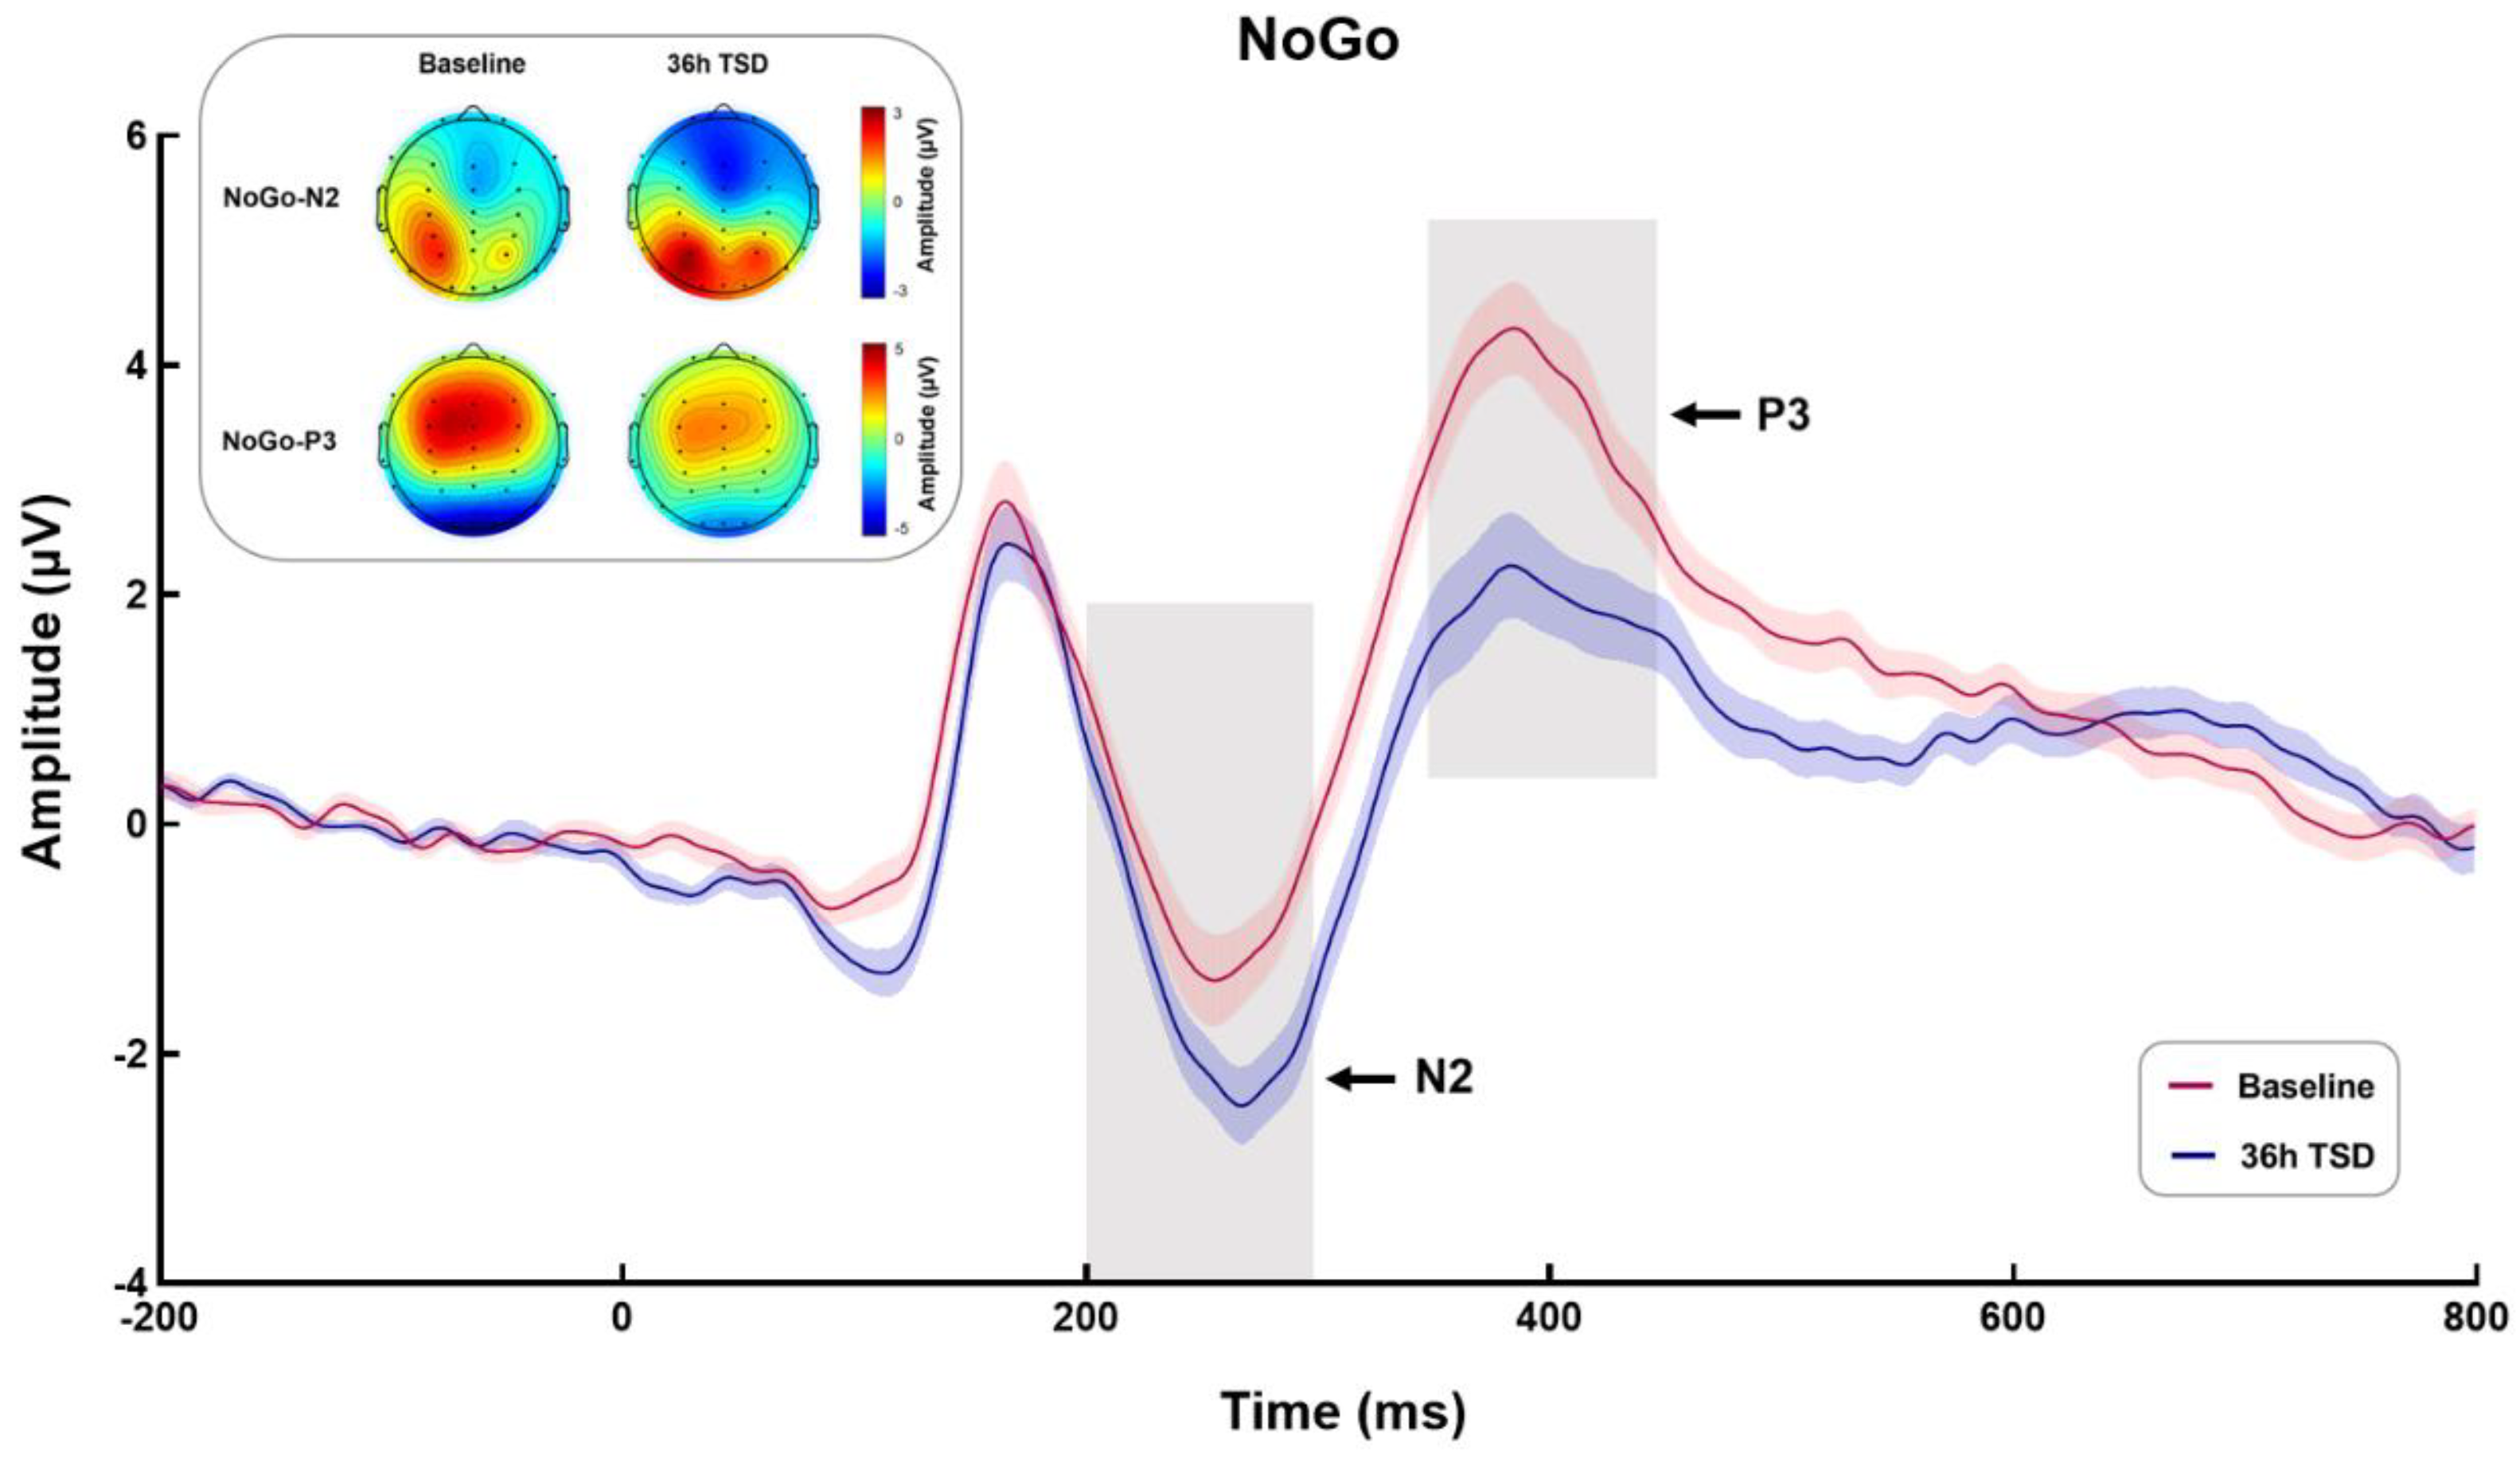
3.2.1. NoGo-N2
3.2.2. NoGo-P3
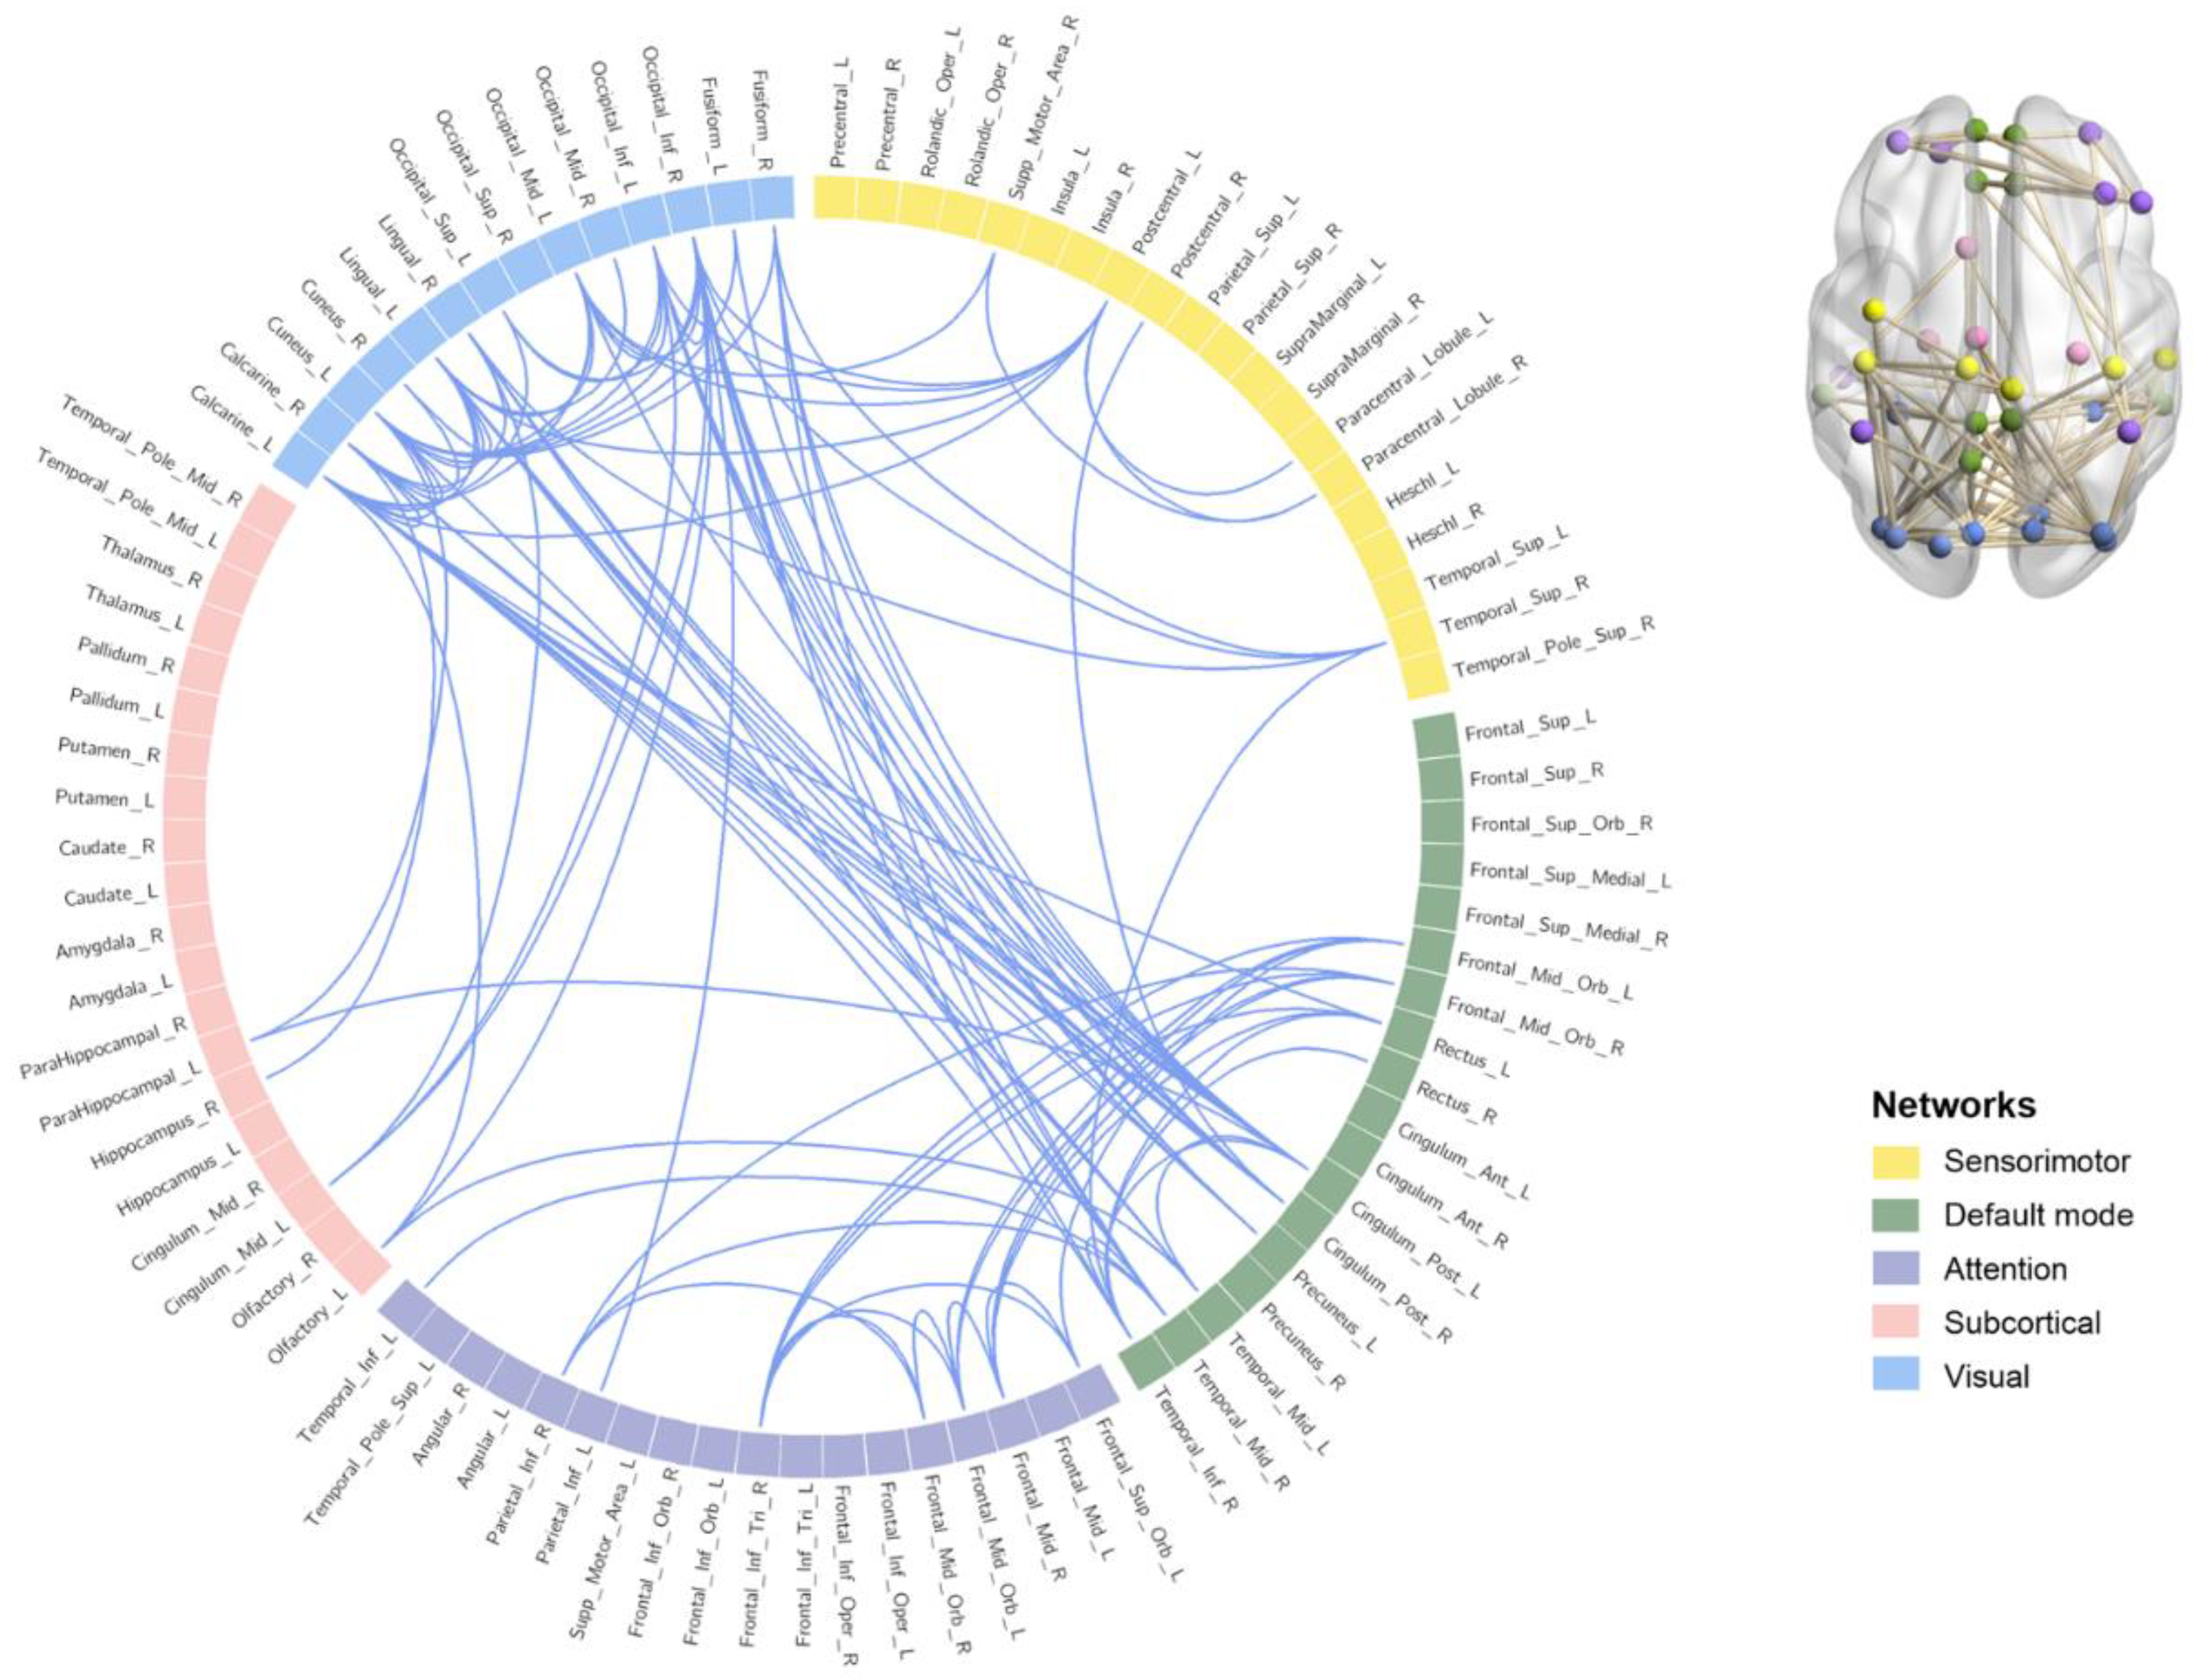
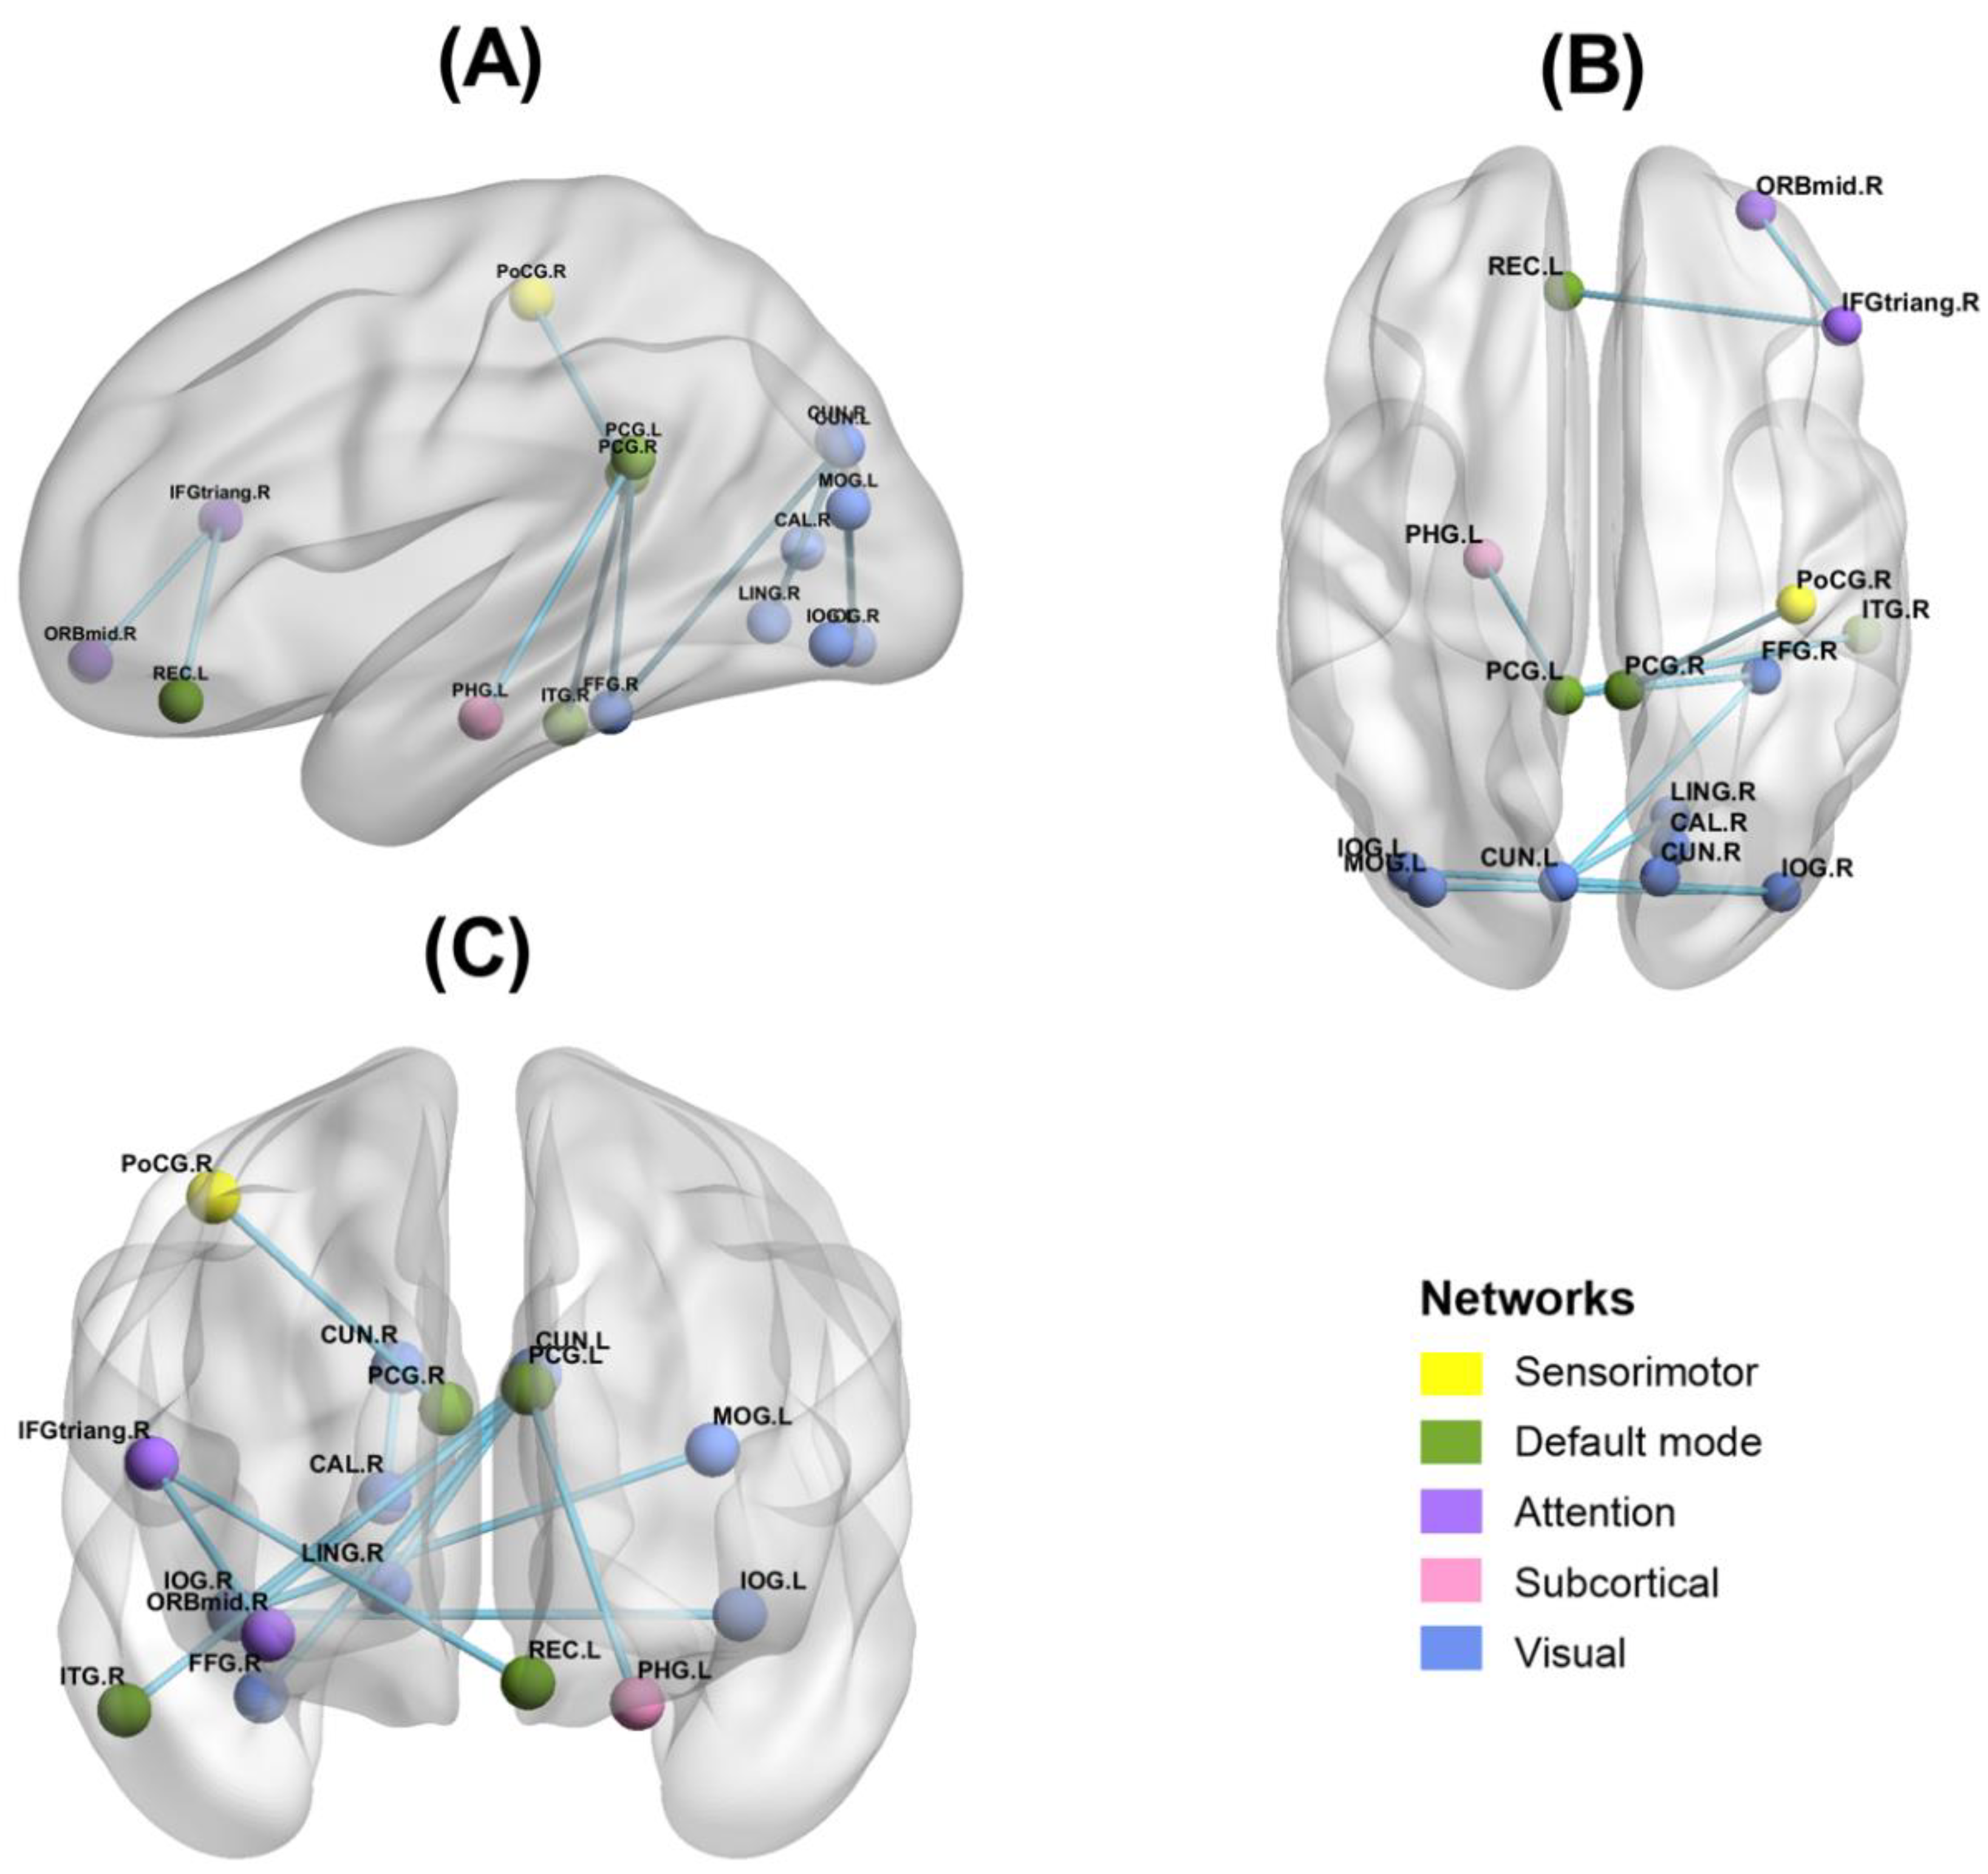
3.3. Functional Connectivity Results
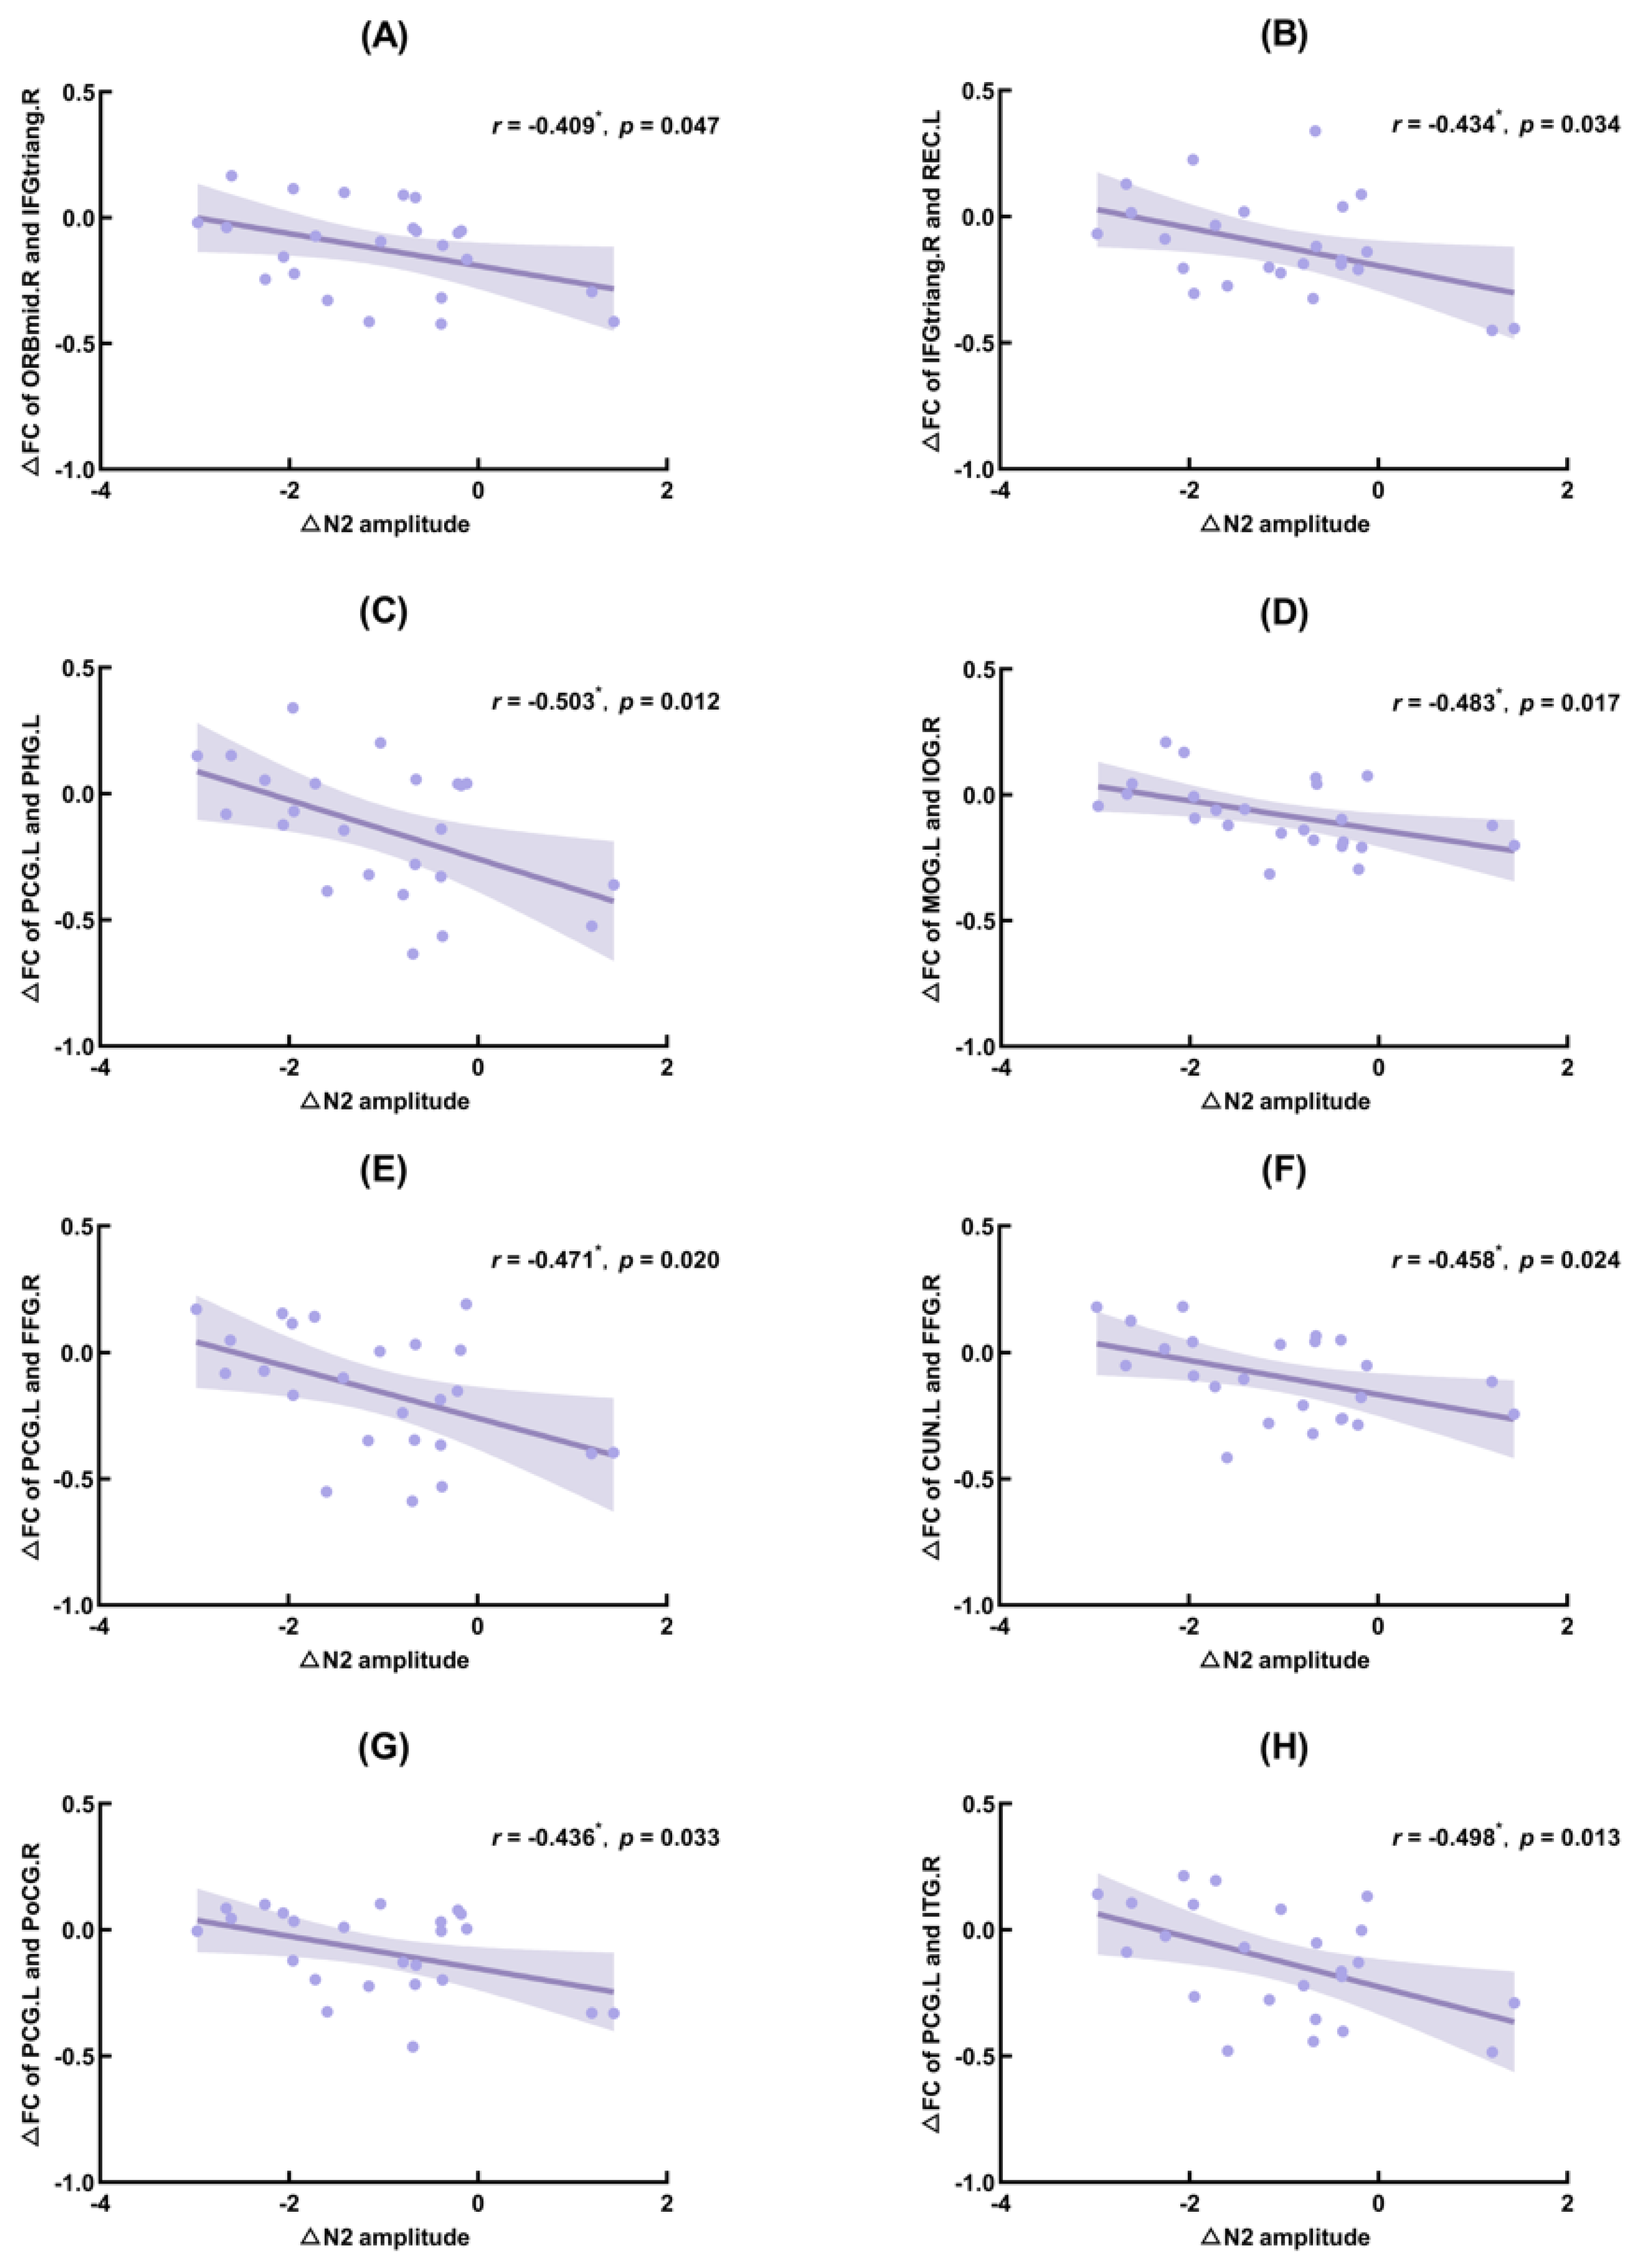
3.4. Correlation Results
4. Discussion
5. Conclusions
Supplementary Materials
Author Contributions
Funding
Institutional Review Board Statement
Informed Consent Statement
Data Availability Statement
Conflicts of Interest
References
- Reynolds, A.C.; Banks, S. Total sleep deprivation, chronic sleep restriction and sleep disruption. Prog. Brain Res. 2010, 185, 91–103. [Google Scholar] [CrossRef]
- Dubal, S.; Jouvent, R. Time-on-task effect in trait anhedonia. Eur. Psychiatry 2004, 19, 285–291. [Google Scholar] [CrossRef]
- Tucker, A.M.; Basner, R.C.; Stern, Y.; Rakitin, B.C. The variable response-stimulus interval effect and sleep deprivation: An unexplored aspect of psychomotor vigilance task performance. Sleep 2009, 32, 1393–1395. [Google Scholar] [CrossRef] [Green Version]
- Williamson, A.M.; Feyer, A.M. Moderate sleep deprivation produces impairments in cog-nitive and motor performance equivalent to legally prescribed levels of alcohol intoxication. Occup. Environ. Med. 2000, 57, 649–655. [Google Scholar] [CrossRef] [Green Version]
- Gujar, N.; Yoo, S.S.; Hu, P.; Walker, M.P. Sleep deprivation amplifies reactivity of brain reward networks, biasing the appraisal of positive emotional experiences. J. Neurosci. 2011, 31, 4466–4474. [Google Scholar] [CrossRef] [Green Version]
- Telzer, E.H.; Fuligni, A.J.; Lieberman, M.D.; Galván, A. The effects of poor quality sleep on brain function and risk taking in adolescence. NeuroImage 2013, 71, 275–283. [Google Scholar] [CrossRef] [PubMed] [Green Version]
- Gibbings, A.; Ray, L.B.; Berberian, N.; Nguyen, T.; Shahidi Zandi, A.; Owen, A.M.; Comeau, F.; Fogel, S.M. EEG and behavioural correlates of mild sleep deprivation and vigilance. Clin. Neurophysiol. 2021, 132, 45–55. [Google Scholar] [CrossRef] [PubMed]
- Liu, S.; Zhang, R. Aerobic Exercise Alleviates the Impairment of Cognitive Control Ability Induced by Sleep Deprivation in College Students: Research Based on Go/NoGo Task. Front. Psychol. 2022, 13, 914568. [Google Scholar] [CrossRef] [PubMed]
- Diamond, A. Executive functions. Annu. Rev. Psychol. 2013, 64, 135–168. [Google Scholar] [CrossRef] [PubMed] [Green Version]
- Smith, J.L.; Johnstone, S.J.; Barry, R.J. Movement-related potentials in the Go/NoGo task: The P3 reflects both cognitive and motor inhibition. Clin. Neurophysiol. 2008, 119, 704–714. [Google Scholar] [CrossRef]
- Yuan, J.; Meng, X.; Yang, J.; Yao, G.; Hu, L.; Yuan, H. The valence strength of unpleasant emotion modulates brain processing of behavioral inhibitory control: Neural correlates. Biol. Psychol. 2012, 89, 240–251. [Google Scholar] [CrossRef]
- Mecklinger, A.; Parra, M.; Waldhauser, G.T. ERP correlates of intentional forgetting. Brain Res. 2009, 1255, 132–147. [Google Scholar] [CrossRef] [PubMed]
- Khedr, E.M.; El Fetoh, N.A.; Gamal, R.M.; Elzohri, M.H.; Azoz, N.; Furst, D.E. Evaluation of cognitive function in systemic sclerosis patients: A pilot study. Clin. Rheumatol. 2020, 39, 1551–1559. [Google Scholar] [CrossRef] [PubMed]
- Wessel, J.R. Prepotent motor activity and inhibitory control demands in different variants of the go/no-go paradigm. Psychophysiology 2018, 55, e12871. [Google Scholar] [CrossRef]
- Qi, J.L.; Shao, Y.C.; Miao, D.; Fan, M.; Bi, G.H.; Yang, Z. The effects of 43 hours of sleep deprivation on executive control functions: Event-related potentials in a visual go/no go task. Soc. Behav. Personal. 2010, 38, 29–42. [Google Scholar] [CrossRef]
- Gosselin, A.; De Koninck, J.; Campbell, K.B. Disentangling specific inhibitory versus general decision-making processes during sleep deprivation using a Go/NoGo ERP paradigm. Int. J. Psychophysiol. 2019, 141, 18–27. [Google Scholar] [CrossRef] [PubMed]
- Liu, Q.; Zhou, R.; Liu, L.; Zhao, X. Kuster deprivation on male astronauts’ executive functions and emotion. Compr. Psychiatry 2015, 61, 28–35. [Google Scholar] [CrossRef]
- Jin, X.; Ye, E.; Qi, J.; Wang, L.; Lei, Y.; Chen, P.; Mi, G.; Zou, F.; Shao, Y.; Yang, Z. Recovery Sleep Reverses Impaired Response Inhibition due to Sleep Restriction: Evidence from a Visual Event Related Potentials Study. PLoS ONE 2015, 10, e0142361. [Google Scholar] [CrossRef] [PubMed]
- Boonstra, T.W.; Stins, J.F.; Daffertshofer, A.; Beek, P.J. Effects of sleep deprivation on neural functioning: An integrative review. Cell. Mol. Life Sci. 2007, 64, 934–946. [Google Scholar] [CrossRef] [Green Version]
- Renn, R.P.; Cote, K.A. Performance monitoring following total sleep deprivation: Effects of task type and error rate. Int. J. Psychophysiol. 2013, 88, 64–73. [Google Scholar] [CrossRef]
- Kusztor, A.; Raud, L.; Juel, B.E.; Nilsen, A.S.; Storm, J.F.; Huster, R.J. Sleep deprivation differentially affects subcomponents of cognitive control. Sleep 2019, 42, zsz016. [Google Scholar] [CrossRef] [PubMed] [Green Version]
- Menon, V. Large-scale brain networks and psychopathology: A unifying triple network model. Trends Cogn. Sci. 2011, 15, 483–506. [Google Scholar] [CrossRef] [PubMed]
- Verweij, I.M.; Romeijn, N.; Smit, D.J.; Piantoni, G.; Van Someren, E.J.; van der Werf, Y.D. Sleep deprivation leads to a loss of functional connectivity in frontal brain regions. BMC Neurosci. 2014, 15, 88. [Google Scholar] [CrossRef] [PubMed] [Green Version]
- Gujar, N.; Yoo, S.S.; Hu, P.; Walker, M.P. The unrested resting brain: Sleep deprivation al-ters activity within the default-mode network. J. Cogn. Neurosci. 2010, 22, 1637–1648. [Google Scholar] [CrossRef] [PubMed] [Green Version]
- Yang, L.; Lei, Y.; Wang, L.; Chen, P.; Cheng, S.; Chen, S.; Sun, J.; Li, Y.; Wang, Y.; Hu, W.; et al. Abnormal functional connectivity density in sleep-deprived subjects. Brain Imaging Behav. 2018, 12, 1650–1657. [Google Scholar] [CrossRef]
- Olbrich, S.; Mulert, C.; Karch, S.; Trenner, M.; Leicht, G.; Pogarell, O.; Hegerl, U. EEG-vigilance and BOLD effect during simultaneous EEG/fMRI measurement. NeuroImage 2009, 45, 319–332. [Google Scholar] [CrossRef] [PubMed]
- Larson-Prior, L.J.; Power, J.D.; Vincent, J.L.; Nolan, T.S.; Coalson, R.S.; Zempel, J.; Snyder, A.Z.; Schlaggar, B.L.; Raichle, M.E.; Petersen, S.E. Modulation of the brain’s functional net-work architecture in the transition from wake to sleep. Prog. Brain Res. 2011, 193, 277–294. [Google Scholar] [CrossRef] [Green Version]
- Yamagishi, N.; Callan, D.E.; Goda, N.; Anderson, S.J.; Yoshida, Y.; Kawato, M. Attentional modulation of oscillatory activity in human visual cortex. NeuroImage 2003, 20, 98–113. [Google Scholar] [CrossRef] [Green Version]
- Boonstra, T.W.; Daffertshofer, A.; Beek, P.J. Effects of sleep deprivation on event-related fields and alpha activity during rhythmic force production. Neurosci. Lett. 2005, 388, 27–32. [Google Scholar] [CrossRef]
- Buysse, D.J.; Reynolds, C.F., 3rd; Monk, T.H.; Berman, S.R.; Kupfer, D.J. The Pittsburgh Sleep Quality Index: A new instrument for psychiatric practice and research. Psychiatry Res. 1989, 28, 193–213. [Google Scholar] [CrossRef]
- Delorme, A.; Makeig, S. EEGLAB: An open source toolbox for analysis of single-trial EEG dynamics including independent component analysis. J. Neurosci. Methods 2004, 134, 9–21. [Google Scholar] [CrossRef] [Green Version]
- Lopez-Calderon, J.; Luck, S.J. ERPLAB: An open-source toolbox for the analysis of event-related potentials. Front. Hum. Neurosci. 2014, 8, 213. [Google Scholar] [CrossRef] [Green Version]
- Jung, T.P.; Makeig, S.; Humphries, C.; Lee, T.W.; McKeown, M.J.; Iragui, V.; Sejnowski, T.J. Removing electroencephalographic artifacts by blind source separation. Psychophysiology 2000, 37, 163–178. [Google Scholar] [CrossRef]
- Baumeister, S.; Hohmann, S.; Wolf, I.; Plichta, M.M.; Rechtsteiner, S.; Zangl, M.; Ruf, M.; Holz, N.; Boecker, R.; Meyer-Lindenberg, A.; et al. Sequential inhibitory control processes assessed through simultaneous EEG-fMRI. NeuroImage 2014, 94, 349–359. [Google Scholar] [CrossRef] [PubMed]
- Schmiedt-Fehr, C.; Basar-Eroglu, C. Event-related delta and theta brain oscillations reflect age-related changes in both a general and a specific neuronal inhibitory mechanism. Clin. Neurophysiol. 2011, 122, 1156–1167. [Google Scholar] [CrossRef]
- Hanslmayr, S.; Backes, H.; Straub, S.; Popov, T.; Langguth, B.; Hajak, G.; Bäuml, K.H.; Landgrebe, M. Enhanced resting-state oscillations in schizophrenia are associated with decreased synchronization during inattentional blindness. Hum. Brain Mapp. 2013, 34, 2266–2275. [Google Scholar] [CrossRef] [PubMed]
- Shephard, E.; Tye, C.; Ashwood, K.L.; Azadi, B.; Johnson, M.H.; Charman, T.; Asherson, P.; McLoughlin, G.; Bolton, P.F. Oscillatory neural networks underlying resting-state, attentional control and social cognition task conditions in children with ASD, ADHD and ASD+ADHD. Cortex 2019, 117, 96–110. [Google Scholar] [CrossRef] [PubMed] [Green Version]
- Xie, W.; Toll, R.T.; Nelson, C.A. EEG functional connectivity analysis in the source space. Dev. Cogn. Neurosci. 2022, 56, 101119. [Google Scholar] [CrossRef]
- Schorr, B.; Schlee, W.; Arndt, M.; Bender, A. Coherence in resting-state EEG as a predictor for the recovery from unresponsive wakefulness syndrome. J. Neurol. 2016, 263, 937–953. [Google Scholar] [CrossRef] [PubMed]
- Oostenveld, R.; Fries, P.; Maris, E.; Schoffelen, J.M. FieldTrip: Open source software for advanced analysis of MEG, EEG, and invasive electrophysiological data. Comput. Intell. Neurosci. 2011, 2011, 156869. [Google Scholar] [CrossRef] [PubMed]
- Oostenveld, R.; Stegeman, D.F.; Praamstra, P.; van Oosterom, A. Brain symmetry and topo-graphic analysis of lateralized event-related potentials. Clin. Neurophysiol. 2003, 114, 1194–1202. [Google Scholar] [CrossRef]
- Schoffelen, J.M.; Gross, J. Source connectivity analysis with MEG and EEG. Hum. Brain Mapp. 2009, 30, 1857–1865. [Google Scholar] [CrossRef]
- Tzourio-Mazoyer, N.; Landeau, B.; Papathanassiou, D.; Crivello, F.; Etard, O.; Delcroix, N.; Mazoyer, B.; Joliot, M. Automated anatomical labeling of activations in SPM using a macroscopic anatomical parcellation of the MNI MRI single-subject brain. NeuroImage 2002, 15, 273–289. [Google Scholar] [CrossRef]
- Nunez, P.L.; Srinivasan, R. Electric Fields of the Brain: The Neurophysics of EEG; Oxford University Press: Cary, NC, USA, 2006. [Google Scholar]
- van Diessen, E.; Numan, T.; van Dellen, E.; van der Kooi, A.W.; Boersma, M.; Hofman, D.; van Lutterveld, R.; van Dijk, B.W.; van Straaten, E.C.; Hillebrand, A.; et al. Opportunities and methodological challenges in EEG and MEG resting state functional brain network research. Clin. Neurophysiol. 2015, 126, 1468–1481. [Google Scholar] [CrossRef] [PubMed]
- Zalesky, A.; Fornito, A.; Bullmore, E.T. Network-based statistic: Identifying differences in brain networks. NeuroImage 2010, 53, 1197–1207. [Google Scholar] [CrossRef] [PubMed]
- Xia, M.; Wang, J.; He, Y. BrainNet Viewer: A network visualization tool for human brain connectomics. PLoS ONE 2013, 8, e68910. [Google Scholar] [CrossRef] [PubMed] [Green Version]
- Krzywinski, M.; Schein, J.; Birol, I.; Connors, J.; Gascoyne, R.; Horsman, D.; Jones, S.J.; Marra, M.A. Circos: An information aesthetic for comparative genomics. Genome Res. 2009, 19, 1639–1645. [Google Scholar] [CrossRef] [PubMed] [Green Version]
- Acosta-Rodríguez, V.A.; Rijo-Ferreira, F.; Green, C.B.; Takahashi, J.S. Importance of circadian timing for aging and longevity. Nat. Commun. 2021, 12, 2862. [Google Scholar] [CrossRef]
- Drummond, S.P.; Meloy, M.J.; Yanagi, M.A.; Orff, H.J.; Brown, G.G. Compensatory recruitment after sleep deprivation and the relationship with performance. Psychiatry Res. 2005, 140, 211–223. [Google Scholar] [CrossRef]
- Lowe, C.J.; Safati, A.; Hall, P.A. The neurocognitive consequences of sleep restriction: A meta-analytic review. Neurosci. Biobehav. Rev. 2017, 80, 586–604. [Google Scholar] [CrossRef]
- Praamstra, P.; Seiss, E. The neurophysiology of response competition: Motor cortex activation and inhibition following subliminal response priming. J. Cogn. Neurosci. 2005, 17, 483–493. [Google Scholar] [CrossRef] [PubMed]
- Fueggle, S.N.; Bucks, R.S.; Fox, A.M. The relationship between naturalistic sleep variation and error monitoring in young adults: An event-related potential (ERP) study. Int. J. Psychophysiol. 2018, 134, 151–158. [Google Scholar] [CrossRef] [PubMed]
- Lo, J.C.; Ong, J.L.; Leong, R.L.; Gooley, J.J.; Chee, M.W. Cognitive Performance, Sleepiness, and Mood in Partially Sleep Deprived Adolescents: The Need for Sleep Study. Sleep 2016, 39, 687–698. [Google Scholar] [CrossRef] [PubMed] [Green Version]
- Goldman, R.I.; Stern, J.M.; Engel, J., Jr.; Cohen, M.S. Simultaneous EEG and fMRI of the alpha rhythm. Neuroreport 2002, 13, 2487–2492. [Google Scholar] [CrossRef] [PubMed]
- Klimesch, W.; Sauseng, P.; Hanslmayr, S. EEG alpha oscillations: The inhibition-timing hypothesis. Brain Res. Rev. 2007, 53, 63–88. [Google Scholar] [CrossRef]
- Kaufmann, T.; Elvsåshagen, T.; Alnæs, D.; Zak, N.; Pedersen, P.Ø.; Norbom, L.B.; Quraishi, S.H.; Tagliazucchi, E.; Laufs, H.; Bjørnerud, A.; et al. The brain functional connectome is robustly altered by lack of sleep. NeuroImage 2016, 127, 324–332. [Google Scholar] [CrossRef]
- Dai, X.J.; Liu, C.L.; Zhou, R.L.; Gong, H.H.; Wu, B.; Gao, L.; Wang, Y.X. Long-term total sleep deprivation decreases the default spontaneous activity and connectivity pattern in healthy male subjects: A resting-state fMRI study. Neuropsychiatr. Dis. Treat. 2015, 11, 761–772. [Google Scholar] [CrossRef] [Green Version]
- Honey, C.J.; Sporns, O.; Cammoun, L.; Gigandet, X.; Thiran, J.P.; Meuli, R.; Hagmann, P. Predicting human resting-state functional connectivity from structural connectivity. Proc. Natl. Acad. Sci. USA 2009, 106, 2035–2040. [Google Scholar] [CrossRef] [PubMed] [Green Version]
- Murphy, M.; Riedner, B.A.; Huber, R.; Massimini, M.; Ferrarelli, F.; Tononi, G. Source modeling sleep slow waves. Proc. Natl. Acad. Sci. USA 2009, 106, 1608–1613. [Google Scholar] [CrossRef] [Green Version]
- Kantarci, K.; Senjem, M.L.; Avula, R.; Zhang, B.; Samikoglu, A.R.; Weigand, S.D.; Przybelski, S.A.; Edmonson, H.A.; Vemuri, P.; Knopman, D.S.; et al. Diffusion tensor imaging and cognitive function in older adults with no dementia. Neurology 2011, 77, 26–34. [Google Scholar] [CrossRef] [Green Version]
- Fransson, P.; Marrelec, G. The precuneus/posterior cingulate cortex plays a pivotal role in the default mode network: Evidence from a partial correlation network analysis. NeuroImage 2008, 42, 1178–1184. [Google Scholar] [CrossRef] [PubMed]
- Coito, A.; Michel, C.M.; Vulliemoz, S.; Plomp, G. Directed functional connections underlying spontaneous brain activity. Hum. Brain Mapp. 2019, 40, 879–888. [Google Scholar] [CrossRef] [PubMed] [Green Version]
- Kreutzmann, J.C.; Havekes, R.; Abel, T.; Meerlo, P. Sleep deprivation and hippocampal vulnerability: Changes in neuronal plasticity, neurogenesis and cognitive function. Neuroscience 2015, 309, 173–190. [Google Scholar] [CrossRef]
- Aron, A.R.; Fletcher, P.C.; Bullmore, E.T.; Sahakian, B.J.; Robbins, T.W. Stop-signal inhibition disrupted by damage to right inferior frontal gyrus in humans. Nat. Neurosci. 2003, 6, 115–116. [Google Scholar] [CrossRef]
- Chuah, Y.M.; Venkatraman, V.; Dinges, D.F.; Chee, M.W. The neural basis of interindividual variability in inhibitory efficiency after sleep deprivation. J. Neurosci. 2006, 26, 7156–7162. [Google Scholar] [CrossRef] [PubMed] [Green Version]
- Aron, A.R.; Robbins, T.W.; Poldrack, R.A. Inhibition and the right inferior frontal cortex: One decade on. Trends Cogn. Sci. 2014, 18, 177–185. [Google Scholar] [CrossRef] [PubMed]
- Bosch, O.G.; Rihm, J.S.; Scheidegger, M.; Landolt, H.P.; Stämpfli, P.; Brakowski, J.; Esposito, F.; Rasch, B.; Seifritz, E. Sleep deprivation increases dorsal nexus connectivity to the dorsolateral prefrontal cortex in humans. Proc. Natl. Acad. Sci. USA 2013, 110, 19597–19602. [Google Scholar] [CrossRef] [PubMed] [Green Version]
- Vanni, S.; Tanskanen, T.; Seppä, M.; Uutela, K.; Hari, R. Coinciding early activation of the human primary visual cortex and anteromedial cuneus. Proc. Natl. Acad. Sci. USA 2001, 98, 2776–2780. [Google Scholar] [CrossRef] [Green Version]
- Kong, D.; Soon, C.S.; Chee, M.W. Reduced visual processing capacity in sleep deprived persons. NeuroImage 2011, 55, 629–634. [Google Scholar] [CrossRef]
- Zhao, R.; Zhang, X.; Fei, N.; Zhu, Y.; Sun, J.; Liu, P.; Yang, X.; Qin, W. Decreased cortical and subcortical response to inhibition control after sleep deprivation. Brain Imaging Behav. 2019, 13, 638–650. [Google Scholar] [CrossRef] [PubMed]
- Hodkinson, D.J.; O’Daly, O.; Zunszain, P.A.; Pariante, C.M.; Lazurenko, V.; Zelaya, F.O.; Howard, M.A.; Williams, S.C. Circadian and homeostatic modulation of functional connectivity and regional cerebral blood flow in humans under normal entrained conditions. J. Cereb. Blood Flow Metab. 2014, 34, 1493–1499. [Google Scholar] [CrossRef] [Green Version]


| Behavioral Variables | Baseline | 36 h-TSD | t | p |
|---|---|---|---|---|
| Go-RT (ms) | 347.83 ± 55.55 | 377.13 ± 75.95 | −2.412 * | 0.0240 |
| Go-Hit Rates (%) | 0.968 ± 0.041 | 0.919 ± 0.091 | 3.158 ** | 0.0040 |
| NoGo-FA (%) | 0.125 ± 0.085 | 0.220 ± 0.124 | −4.187 *** | 0.0003 |
| Baseline | 36 h-TSD | t | p | ||
|---|---|---|---|---|---|
| NoGo-N2 | Amplitude (μV) | −2.03 ± 2.20 | −3.15 ± 1.76 | 4.85 *** | <0.001 |
| Latency (ms) | 257.28 ± 22.19 | 267.76 ± 21.72 | −3.178 ** | 0.004 | |
| NoGo-P3 | Amplitude (μV) | 4.80 ± 2.25 | 2.84 ± 2.62 | 5.104 *** | <0.001 |
| Latency (ms) | 386.48 ± 21.32 | 398.96 ± 27.10 | −2.382 * | 0.025 |
Disclaimer/Publisher’s Note: The statements, opinions and data contained in all publications are solely those of the individual author(s) and contributor(s) and not of MDPI and/or the editor(s). MDPI and/or the editor(s) disclaim responsibility for any injury to people or property resulting from any ideas, methods, instructions or products referred to in the content. |
© 2023 by the authors. Licensee MDPI, Basel, Switzerland. This article is an open access article distributed under the terms and conditions of the Creative Commons Attribution (CC BY) license (https://creativecommons.org/licenses/by/4.0/).
Share and Cite
Lian, J.; Xu, L.; Song, T.; Peng, Z.; Gong, X.; Chen, J.; Zhong, X.; An, X.; Chen, S.; Shao, Y. Decreased Functional Connectivity of Brain Networks in the Alpha Band after Sleep Deprivation Is Associated with Decreased Inhibitory Control in Young Male Adults. Int. J. Environ. Res. Public Health 2023, 20, 4663. https://doi.org/10.3390/ijerph20054663
Lian J, Xu L, Song T, Peng Z, Gong X, Chen J, Zhong X, An X, Chen S, Shao Y. Decreased Functional Connectivity of Brain Networks in the Alpha Band after Sleep Deprivation Is Associated with Decreased Inhibitory Control in Young Male Adults. International Journal of Environmental Research and Public Health. 2023; 20(5):4663. https://doi.org/10.3390/ijerph20054663
Chicago/Turabian StyleLian, Jie, Lin Xu, Tao Song, Ziyi Peng, Xinxin Gong, Jie Chen, Xiao Zhong, Xin An, Shufang Chen, and Yongcong Shao. 2023. "Decreased Functional Connectivity of Brain Networks in the Alpha Band after Sleep Deprivation Is Associated with Decreased Inhibitory Control in Young Male Adults" International Journal of Environmental Research and Public Health 20, no. 5: 4663. https://doi.org/10.3390/ijerph20054663
APA StyleLian, J., Xu, L., Song, T., Peng, Z., Gong, X., Chen, J., Zhong, X., An, X., Chen, S., & Shao, Y. (2023). Decreased Functional Connectivity of Brain Networks in the Alpha Band after Sleep Deprivation Is Associated with Decreased Inhibitory Control in Young Male Adults. International Journal of Environmental Research and Public Health, 20(5), 4663. https://doi.org/10.3390/ijerph20054663