
Multi-City Analysis of the Acute Effect of Polish Smog on Cause-Specific Mortality (EP-PARTICLES Study)

Abstract
:
1. Introduction
2. Material and Methods
2.1. Study Design
2.2. Studied Region
Pollution and Meteorological Data
2.3. Statistical Analysis
3. Results
3.1. Cohort Analyses
3.2. Subgroup Analyses
4. Discussion
5. Limitations
6. Conclusions
Supplementary Materials
Author Contributions
Funding
Institutional Review Board Statement
Informed Consent Statement
Data Availability Statement
Conflicts of Interest
References
- World Health Organization. Global Health Estimates: Leading Causes of Death. Cause-Specific Mortality, 2000–2019. Available online: https://www.who.int/data/gho/data/themes/mortality-and-global-health-estimates/ghe-leading-causes-of-death (accessed on 10 September 2021).
- GBD 2019 Risk Factors Collaborators. Global burden of 87 risk factors in 204 countries and territories, 1990–2019: A systematic analysis for the Global Burden of Disease Study 2019. Lancet 2020, 396, 1223–1249. [Google Scholar] [CrossRef] [PubMed]
- Lelieveld, J.; Pozzer, A.; Pöschl, U.; Fnais, M.; Haines, A.; Münzel, T. Loss of life expectancy from air pollution compared to other risk factors: A worldwide perspective. Cardiovasc. Res. 2020, 116, 1910–1917, Erratum in Cardiovasc. Res. 2020, 116, 1334. [Google Scholar] [CrossRef] [PubMed]
- Tan, Y.; Wang, H.; Zhu, B.; Zhao, T.; Shi, S.; Liu, A.; Liu, D.; Pan, C.; Cao, L. The interaction between black carbon and planetary boundary layer in the Yangtze River Delta from 2015 to 2020: Why O3 didn’t decline so significantly as PM2.5. Environ. Res. 2022, 214, 114095. [Google Scholar] [CrossRef] [PubMed]
- Liu, J.; Yin, H.; Tang, X.; Zhu, T.; Zhang, Q.; Liu, Z.; Tang, X.; Yi, H. Transition in air pollution, disease burden and health cost in China: A comparative study of long-term and short-term exposure. Environ. Pollut. 2021, 277, 116770. [Google Scholar] [CrossRef] [PubMed]
- Jaganathan, S.; Jaacks, L.M.; Magsumbol, M.; Walia, G.K.; Sieber, N.L.; Shivasankar, R.; Dhillon, P.K.; Hameed, S.S.; Schwartz, J.; Prabhakaran, D. Association of Long-Term Exposure to Fine Particulate Matter and Cardio-Metabolic Diseases in Low- and Middle-Income Countries: A Systematic Review. Int. J. Environ. Res. Public Health 2019, 16, 2541. [Google Scholar] [CrossRef]
- Badaloni, C.; Cesaroni, G.; Cerza, F.; Davoli, M.; Brunekreef, B.; Forastiere, F. Effects of long-term exposure to particulate matter and metal components on mortality in the Rome longitudinal study. Environ. Int. 2017, 109, 146–154. [Google Scholar] [CrossRef]
- Tonne, C.; Wilkinson, P. Long-term exposure to air pollution is associated with survival following acute coronary syndrome. Eur. Heart J. 2013, 34, 1306–1311. [Google Scholar] [CrossRef]
- Byrne, C.P.; Bennett, K.E.; Hickey, A.; Kavanagh, P.; Broderick, B.; O’Mahony, M.; Williams, D.J. Short-Term Air Pollution as a Risk for Stroke Admission: A Time-Series Analysis. Cerebrovasc. Dis. 2020, 49, 404–411. [Google Scholar] [CrossRef]
- O’Donnell, M.J.; Fang, J.; Mittleman, M.; Kapral, M.K.; Wellenius, G. Fine Particulate Air Pollution (PM2.5) and the Risk of Acute Ischemic Stroke. Epidemiology 2011, 22, 422–431. [Google Scholar] [CrossRef]
- Sun, S.; Stewart, J.D.; Eliot, M.N.; Yanosky, J.D.; Liao, D.; Tinker, L.F.; Eaton, C.B.; Whitsel, E.A.; Wellenius, G.A. Short-term exposure to air pollution and incidence of stroke in the Women’s Health Initiative. Environ. Int. 2019, 132, 105065. [Google Scholar] [CrossRef]
- Kuzma, Ł.; Roszkowska, S.; Święczkowski, M.; Dąbrowski, E.J.; Kurasz, A.; Wańha, W.; Bachórzewska-Gajewska, H.; Dobrzycki, S. Exposure to air pollution and its effect on ischemic strokes (EP-PARTICLES study). Sci. Rep. 2022, 12, 17150. [Google Scholar] [CrossRef]
- Collart, P.; Dramaix, M.; Levêque, A.; Coppieters, Y. Short-term effects of air pollution on hospitalization for acute myocardial infarction: Age effect on lag pattern. Int. J. Environ. Health Res. 2017, 27, 68–81. [Google Scholar] [CrossRef]
- Li, J.; Liu, C.; Cheng, Y.; Guo, S.; Sun, Q.; Kan, L.; Chen, R.; Kan, H.; Bai, H.; Cao, J. Association between ambient particulate matter air pollution and ST-elevation myocardial infarction: A case-crossover study in a Chinese city. Chemosphere 2018, 219, 724–729. [Google Scholar] [CrossRef]
- Kim, H.; Byun, G.; Choi, Y.; Kim, S.; Kim, S.-Y.; Lee, J.-T. Effects of long-term exposure to air pollution on all-cause mortality and cause-specific mortality in seven major cities of South Korea: Korean national health and nutritional examination surveys with mortality follow-up. Environ. Res. 2020, 192, 110290. [Google Scholar] [CrossRef]
- Gaines, B.; Kloog, I.; Zucker, I.; Ifergane, G.; Novack, V.; Libruder, C.; Hershkovitz, Y.; Sheffield, P.E.; Yitshak-Sade, M. Particulate Air Pollution Exposure and Stroke among Adults in Israel. Int. J. Environ. Res. Public Health 2023, 20, 1482. [Google Scholar] [CrossRef]
- Zhao, S.; Liu, S.; Hou, X.; Sun, Y.; Beazley, R. Air pollution and cause-specific mortality: A comparative study of urban and rural areas in China. Chemosphere 2021, 262, 127884. [Google Scholar] [CrossRef]
- Wielgosiński, G.; Czerwińska, J. Smog Episodes in Poland. Atmosphere 2020, 11, 277. [Google Scholar] [CrossRef]
- Czerwińska, J.; Wielgosiński, G.; Szymańska, O. Is the Polish Smog a New Type of Smog? Ecol. Chem. Eng. S 2019, 26, 465–474. [Google Scholar] [CrossRef]
- Kuźma, Ł.; Pogorzelski, S.; Struniawski, K.; Dobrzycki, S.; Bachórzewska-Gajewska, H. Evaluation of the influence of air pollution on the number of hospital admissions for acute coronary syndrome in elderly patients (BIA–ACS Registry). Pol. Arch. Intern. Med. 2020, 130, 38–46. [Google Scholar] [CrossRef]
- Khomenko, S.; Cirach, M.; Pereira-Barboza, E.; Mueller, N.; Barrera-Gómez, J.; Rojas-Rueda, D.; de Hoogh, K.; Hoek, G.; Nieuwenhuijsen, M. Premature mortality due to air pollution in European cities: A health impact assessment. Lancet Planet. Health 2021, 5, e121–e134. [Google Scholar] [CrossRef]
- Sun, Q.; Ren, X.; Sun, Z.; Duan, J. The critical role of epigenetic mechanism in PM2.5-induced cardiovascular diseases. Genes Environ. 2021, 43, 47. [Google Scholar] [CrossRef] [PubMed]
- Feng, S.; Gao, D.; Liao, F.; Zhou, F.; Wang, X. The health effects of ambient PM2.5 and potential mechanisms. Ecotoxicol. Environ. Saf. 2016, 128, 67–74. [Google Scholar] [CrossRef] [PubMed]
- World Health Organization. WHO Global Air Quality Guidelines: Particulate Matter (PM2.5 and PM10), Ozone, Nitrogen Di-oxide, Sulfur Dioxide and Carbon Monoxide. Available online: https://apps.who.int/iris/handle/10665/345329 (accessed on 27 December 2022).
- Liu, Y.; Pan, J.; Fan, C.; Xu, R.; Wang, Y.; Xu, C.; Xie, S.; Zhang, H.; Cui, X.; Peng, Z.; et al. Short-Term Exposure to Ambient Air Pollution and Mortality from Myocardial Infarction. J. Am. Coll. Cardiol. 2021, 77, 271–281. [Google Scholar] [CrossRef]
- Gestro, M.; Condemi, V.; Bardi, L.; Tomaino, L.; Roveda, E.; Bruschetta, A.; Solimene, U.; Esposito, F. Short-term air pollution exposure is a risk factor for acute coronary syndromes in an urban area with low annual pollution rates: Results from a retrospective observational study (2011–2015). Arch. Cardiovasc. Dis. 2020, 113, 308–320. [Google Scholar] [CrossRef] [PubMed]
- Bañeras, J.; Ferreira-González, I.; Marsal, J.R.; Barrabés, J.A.; Ribera, A.; Lidón, R.M.; Domingo, E.; Martí, G.; García-Dorado, D. Short-term exposure to air pollutants increases the risk of ST elevation myocardial infarction and of infarct-related ventricular arrhythmias and mortality. Int. J. Cardiol. 2018, 250, 35–42. [Google Scholar] [CrossRef]
- Vaudrey, B.; Mielcarek, M.; Sauleau, E.; Meyer, N.; Marchandot, B.; Moitry, M.; Robellet, P.; Reeb, T.; Jesel, L.; Ohlmann, P.; et al. Short-Term Effects of Air Pollution on Coronary Events in Strasbourg, France—Importance of Seasonal Variations. Med. Sci. 2020, 8, 31. [Google Scholar] [CrossRef]
- Bateson, T.F.; Schwartz, J. Who is Sensitive to the Effects of Particulate Air Pollution on Mortality? Epidemiology 2004, 15, 143–149. [Google Scholar] [CrossRef]
- Ueda, K.; Nitta, H.; Ono, M. Effects of Fine Particulate Matter on Daily Mortality for Specific Heart Diseases in Japan. Circ. J. 2009, 73, 1248–1254. [Google Scholar] [CrossRef]
- PopeIII, C.A.; Muhlestein, J.B.; Anderson, J.L.; Cannon, J.B.; Hales, N.M.; Meredith, K.G.; Le, V.; Horne, B.D. Short-Term Exposure to Fine Particulate Matter Air Pollution Is Preferentially Associated with the Risk of ST-Segment Elevation Acute Coronary Events. J. Am. Hear. Assoc. 2015, 4, e002506. [Google Scholar] [CrossRef]
- Berglind, N.; Bellander, T.; Forastiere, F.; von Klot, S.; Aalto, P.; Elosua, R.; Kulmala, M.; Lanki, T.; Löwel, H.; Peters, A.; et al. Ambient Air Pollution and Daily Mortality among Survivors of Myocardial Infarction. Epidemiology 2009, 20, 110–118. [Google Scholar] [CrossRef]
- Franklin, M.; Zeka, A.; Schwartz, J. Association between PM2.5 and all-cause and specific-cause mortality in 27 US communities. J. Expo. Sci. Environ. Epidemiol. 2006, 17, 279–287. [Google Scholar] [CrossRef]
- Qian, Z.; He, Q.; Lin, H.-M.; Kong, L.; Liao, D.; Dan, J.; Bentley, C.M.; Wang, B. Association of daily cause-specific mortality with ambient particle air pollution in Wuhan, China. Environ. Res. 2007, 105, 380–389. [Google Scholar] [CrossRef]
- Revich, B.; Shaposhnikov, D. The effects of particulate and ozone pollution on mortality in Moscow, Russia. Air Qual. Atmos. Health 2010, 3, 117–123. [Google Scholar] [CrossRef]
- Kettunen, J.; Lanki, T.; Tiittanen, P.; Aalto, P.P.; Koskentalo, T.; Kulmala, M.; Salomaa, V.; Pekkanen, J. Associations of Fine and Ultrafine Particulate Air Pollution with Stroke Mortality in an Area of Low Air Pollution Levels. Stroke 2007, 38, 918–922. [Google Scholar] [CrossRef]
- Yorifuji, T.; Kawachi, I.; Sakamoto, T.; Doi, H. Associations of Outdoor Air Pollution with Hemorrhagic Stroke Mortality. J. Occup. Environ. Med. 2011, 53, 124–126. [Google Scholar] [CrossRef]
- Díaz, J.; Tobías, A.; Linares, C. Saharan dust and association between particulate matter and case-specific mortality: A case-crossover analysis in Madrid (Spain). Environ. Health 2012, 11, 11. [Google Scholar] [CrossRef]
- Chen, Z.; Wang, B.; Hu, Y.; Dai, L.; Liu, Y.; Wang, J.; Cao, X.; Wu, Y.; Zhou, T.; Cui, X.; et al. Short-Term Effects of Low-Level Ambient Air NO2 on the Risk of Incident Stroke in Enshi City, China. Int. J. Environ. Res. Public Health 2022, 19, 6683. [Google Scholar] [CrossRef]
- Cui, M.; Zhan, C.; Wu, W.; Guo, D.; Song, Y. Acute Gaseous Air Pollution Exposure and Hospitalizations for Acute Ischemic Stroke: A Time-Series Analysis in Tianjin, China. Int. J. Environ. Res. Public Health 2022, 19, 13344. [Google Scholar] [CrossRef]
- Chen, R.; Jiang, Y.; Hu, J.; Chen, H.; Li, H.; Meng, X.; Ji, J.S.; Gao, Y.; Wang, W.; Liu, C.; et al. Hourly Air Pollutants and Acute Coronary Syndrome Onset in 1.29 million Patients. Circulation 2022, 145, 1749–1760. [Google Scholar] [CrossRef]
- Argacha, J.; Collart, P.; Wauters, A.; Kayaert, P.; Lochy, S.; Schoors, D.; Sonck, J.; de Vos, T.; Forton, M.; Brasseur, O.; et al. Air pollution and ST-elevation myocardial infarction: A case-crossover study of the Belgian STEMI registry 2009–2013. Int. J. Cardiol. 2016, 223, 300–305. [Google Scholar] [CrossRef]
- Liang, H.; Qiu, H.; Tian, L. Short-term effects of fine particulate matter on acute myocardial infraction mortality and years of life lost: A time series study in Hong Kong. Sci. Total Environ. 2018, 615, 558–563. [Google Scholar] [CrossRef] [PubMed]
- Nuvolone, D.; Balzi, D.; Chini, M.; Scala, D.; Giovannini, F.; Barchielli, A. Short-Term Association between Ambient Air Pollution and Risk of Hospitalization for Acute Myocardial Infarction: Results of the Cardiovascular Risk and Air Pollution in Tuscany (RISCAT) Study. Am. J. Epidemiol. 2011, 174, 63–71. [Google Scholar] [CrossRef] [PubMed]
- Sade, M.Y.; Novack, V.; Ifergane, G.; Horev, A.; Kloog, I. Air Pollution and Ischemic Stroke among Young Adults. Stroke 2015, 46, 3348–3353. [Google Scholar] [CrossRef] [PubMed]
- Chen, C.; Liu, X.; Wang, X.; Qu, W.; Li, W.; Dong, L. Effect of air pollution on hospitalization for acute exacerbation of chronic obstructive pulmonary disease, stroke, and myocardial infarction. Environ. Sci. Pollut. Res. 2020, 27, 3384–3400. [Google Scholar] [CrossRef] [PubMed]
- Wellenius, G.A.; Schwartz, J.; Mittleman, M.A. Air Pollution and Hospital Admissions for Ischemic and Hemorrhagic Stroke among Medicare Beneficiaries. Stroke 2005, 36, 2549–2553. [Google Scholar] [CrossRef]
- Chang, C.-H.; Chen, S.-H.; Liu, P.-H.; Huang, K.-C.; Chiu, I.-M.; Pan, H.-Y.; Cheng, F.-J. Ambient Air Pollution and Risk for Stroke Hospitalization: Impact on Susceptible Groups. Toxics 2022, 10, 350. [Google Scholar] [CrossRef]
- Kim, C.S.; Hu, S.C. Regional deposition of inhaled particles in human lungs: Comparison between men and women. J. Appl. Physiol. 1998, 84, 1834–1844. [Google Scholar] [CrossRef]
- Sørensen, M.; Daneshvar, B.; Hansen, M.; Dragsted, L.O.; Hertel, O.; Knudsen, L.; Loft, S. Personal PM2.5 exposure and markers of oxidative stress in blood. Environ. Health Perspect. 2003, 111, 161–166. [Google Scholar] [CrossRef]
- Leiser, C.L.; Smith, K.R.; VanDerslice, J.A.; Glotzbach, J.P.; Farrell, T.W.; Hanson, H.A. Evaluation of the Sex-and-Age-Specific Effects of PM2.5 on Hospital Readmission in the Presence of the Competing Risk of Mortality in the Medicare Population of Utah 1999–2009. J. Clin. Med. 2019, 8, 2114. [Google Scholar] [CrossRef]
- Zhang, R.; Jiang, Y.; Zhang, G.; Yu, M.; Wang, Y.; Liu, G. Association between short-term exposure to ambient air pollution and hospital admissions for transient ischemic attacks in Beijing, China. Environ. Sci. Pollut. Res. 2021, 28, 6877–6885. [Google Scholar] [CrossRef]
- Stewart, R.A.; Held, C.; Hadziosmanovic, N.; Armstrong, P.W.; Cannon, C.P.; Granger, C.B.; Hagström, E.; Hochman, J.S.; Koenig, W.; Lonn, E.; et al. Physical Activity and Mortality in Patients with Stable Coronary Heart Disease. J. Am. Coll. Cardiol. 2017, 70, 1689–1700. [Google Scholar] [CrossRef] [PubMed]
- Kyu, H.H.; Bachman, V.F.; Alexander, L.T.; Mumford, J.E.; Afshin, A.; Estep, K.; Veerman, J.L.; Delwiche, K.; Iannarone, M.L.; Moyer, M.L.; et al. Physical activity and risk of breast cancer, colon cancer, diabetes, ischemic heart disease, and ischemic stroke events: Systematic review and dose-response meta-analysis for the Global Burden of Disease Study 2013. BMJ 2016, 354, i3857. [Google Scholar] [CrossRef]
- Deka, P.; Blesa, J.; Pathak, D.; Sempere-Rubio, N.; Iglesias, P.; Micó, L.; Soriano, J.M.; Klompstra, L.; Marques-Sule, E. Combined Dietary Education and High-Intensity Interval Resistance Training Improve Health Outcomes in Patients with Coronary Artery Disease. Int. J. Environ. Res. Public Health 2022, 19, 11402. [Google Scholar] [CrossRef]
- Visseren, F.L.J.; Mach, F.; Smulders, Y.M.; Carballo, D.; Koskinas, K.C.; Bäck, M.; Benetos, A.; Biffi, A.; Boavida, J.-M.; Capodanno, D.; et al. 2021 ESC Guidelines on cardiovascular disease prevention in clinical practice. Eur. J. Prev. Cardiol. 2022, 29, 5–115. [Google Scholar] [CrossRef]
- Kim, S.R.; Choi, S.; Kim, K.; Chang, J.; Kim, S.M.; Cho, Y.; Oh, Y.H.; Lee, G.; Son, J.S.; Kim, K.H.; et al. Association of the combined effects of air pollution and changes in physical activity with cardiovascular disease in young adults. Eur. Heart J. 2021, 42, 2487–2497. [Google Scholar] [CrossRef]
- Elliott, E.G.; Laden, F.; James, P.; Rimm, E.B.; Rexrode, K.M.; Hart, J.E. Interaction between Long-Term Exposure to Fine Particulate Matter and Physical Activity, and Risk of Cardiovascular Disease and Overall Mortality in U.S. Women. Environ. Health Perspect. 2020, 128, 127012. [Google Scholar] [CrossRef]
- Kim, S.R.; Choi, S.; Keum, N.; Park, S.M. Combined Effects of Physical Activity and Air Pollution on Cardiovascular Disease: A Population-Based Study. J. Am. Heart Assoc. 2020, 9, e013611. [Google Scholar] [CrossRef]
- Shafeghat, M.; Aminorroaya, A.; Rezaei, N. How Stable Ischemic Heart Disease Leads to Acute Coronary Syndrome in COVID-19? Acta Biomed. 2021, 92, e2021512. [Google Scholar] [CrossRef]
- Modin, D.; Claggett, B.; Sindet-Pedersen, C.; Lassen, M.C.H.; Skaarup, K.G.; Jensen, J.U.S.; Fralick, M.; Schou, M.; Lamberts, M.; Gerds, T.; et al. Acute COVID-19 and the Incidence of Ischemic Stroke and Acute Myocardial Infarction. Circulation 2020, 142, 2080–2082. [Google Scholar] [CrossRef]
- Katsoularis, I.; Fonseca-Rodríguez, O.; Farrington, P.; Lindmark, K.; Connolly, A.-M.F. Risk of acute myocardial infarction and ischaemic stroke following COVID-19 in Sweden: A self-controlled case series and matched cohort study. Lancet 2021, 398, 599–607. [Google Scholar] [CrossRef]
- Rashid, M.; Wu, J.; Timmis, A.; Curzen, N.; Clarke, S.; Zaman, A.; Nolan, J.; Shoaib, A.; Mohamed, M.O.; de Belder, M.A.; et al. Outcomes of COVID-19-positive acute coronary syndrome patients: A multisource electronic healthcare records study from England. J. Intern. Med. 2021, 290, 88–100. [Google Scholar] [CrossRef] [PubMed]
- Casula, M.; Galimberti, F.; Iommi, M.; Olmastroni, E.; Rosa, S.; Altini, M.; Catapano, A.L.; Tragni, E.; Poluzzi, E. Impact of the COVID-19 Pandemic on the Therapeutic Continuity among Outpatients with Chronic Cardiovascular Therapies. Int. J. Environ. Res. Public Health 2022, 19, 12101. [Google Scholar] [CrossRef] [PubMed]
- Ellingsen, C.L.; Alfsen, G.C.; Ebbing, M.; Pedersen, A.G.; Sulo, G.; Vollset, S.E.; Braut, G.S. Garbage codes in the Norwegian Cause of Death Registry 1996–2019. BMC Public Health 2022, 22, 1301. [Google Scholar] [CrossRef]


| City | Bialystok | Kielce | Lublin | Olsztyn | Rzeszow |
|---|---|---|---|---|---|
| Inhabitants, n | 296,958 | 193,415 | 338,586 | 171,249 | 196,638 |
| Population density, people/km2 | 2908.5 | 1764.7 | 2297.1 | 1938.7 | 1530.3 |
| Male, % | 46.91 | 46.77 | 46.13 | 46.50 | 47.50 |
| Femininity ratio | 113 | 114 | 117 | 115 | 110 |
| Share of elderly people (>65 years old), % | 21.46 | 25.72 | 23.13 | 23.41 | 21.01 |
| Variable | Bialystok | Kielce | Lublin | Olsztyn | Rzeszow | p |
|---|---|---|---|---|---|---|
| Total deaths, n | 19,166 | 16,390 | 25,044 | 12,540 | 14,850 | N/A |
| 2016; N | 3543 | 3002 | 4699 | 2366 | 2902 | N/A |
| 2017; N | 3769 | 3106 | 4953 | 2378 | 2832 | N/A |
| 2018; N | 3900 | 3302 | 4872 | 2571 | 2830 | N/A |
| 2019; N | 3743 | 3251 | 4856 | 2451 | 2991 | N/A |
| 2020; N | 4211 | 3729 | 5664 | 2774 | 3295 | N/A |
| Male. N (%) | 9797 (51.12) | 8590 (52.41) | 12751 (50.91) | 6641 (52.96) | 7871 (53) | <0.001 |
| Mean age (SD) | 73.86 (15.94) | 72.7 (15.71) | 72.64 (16.8) | 71.83 (16.8) | 72.02 (17.84) | <0.001 |
| CDR, (100,000 population/year) | 1290.82 | 1694.8 | 1479.33 | 1464.53 | 1510.49 | <0.001 |
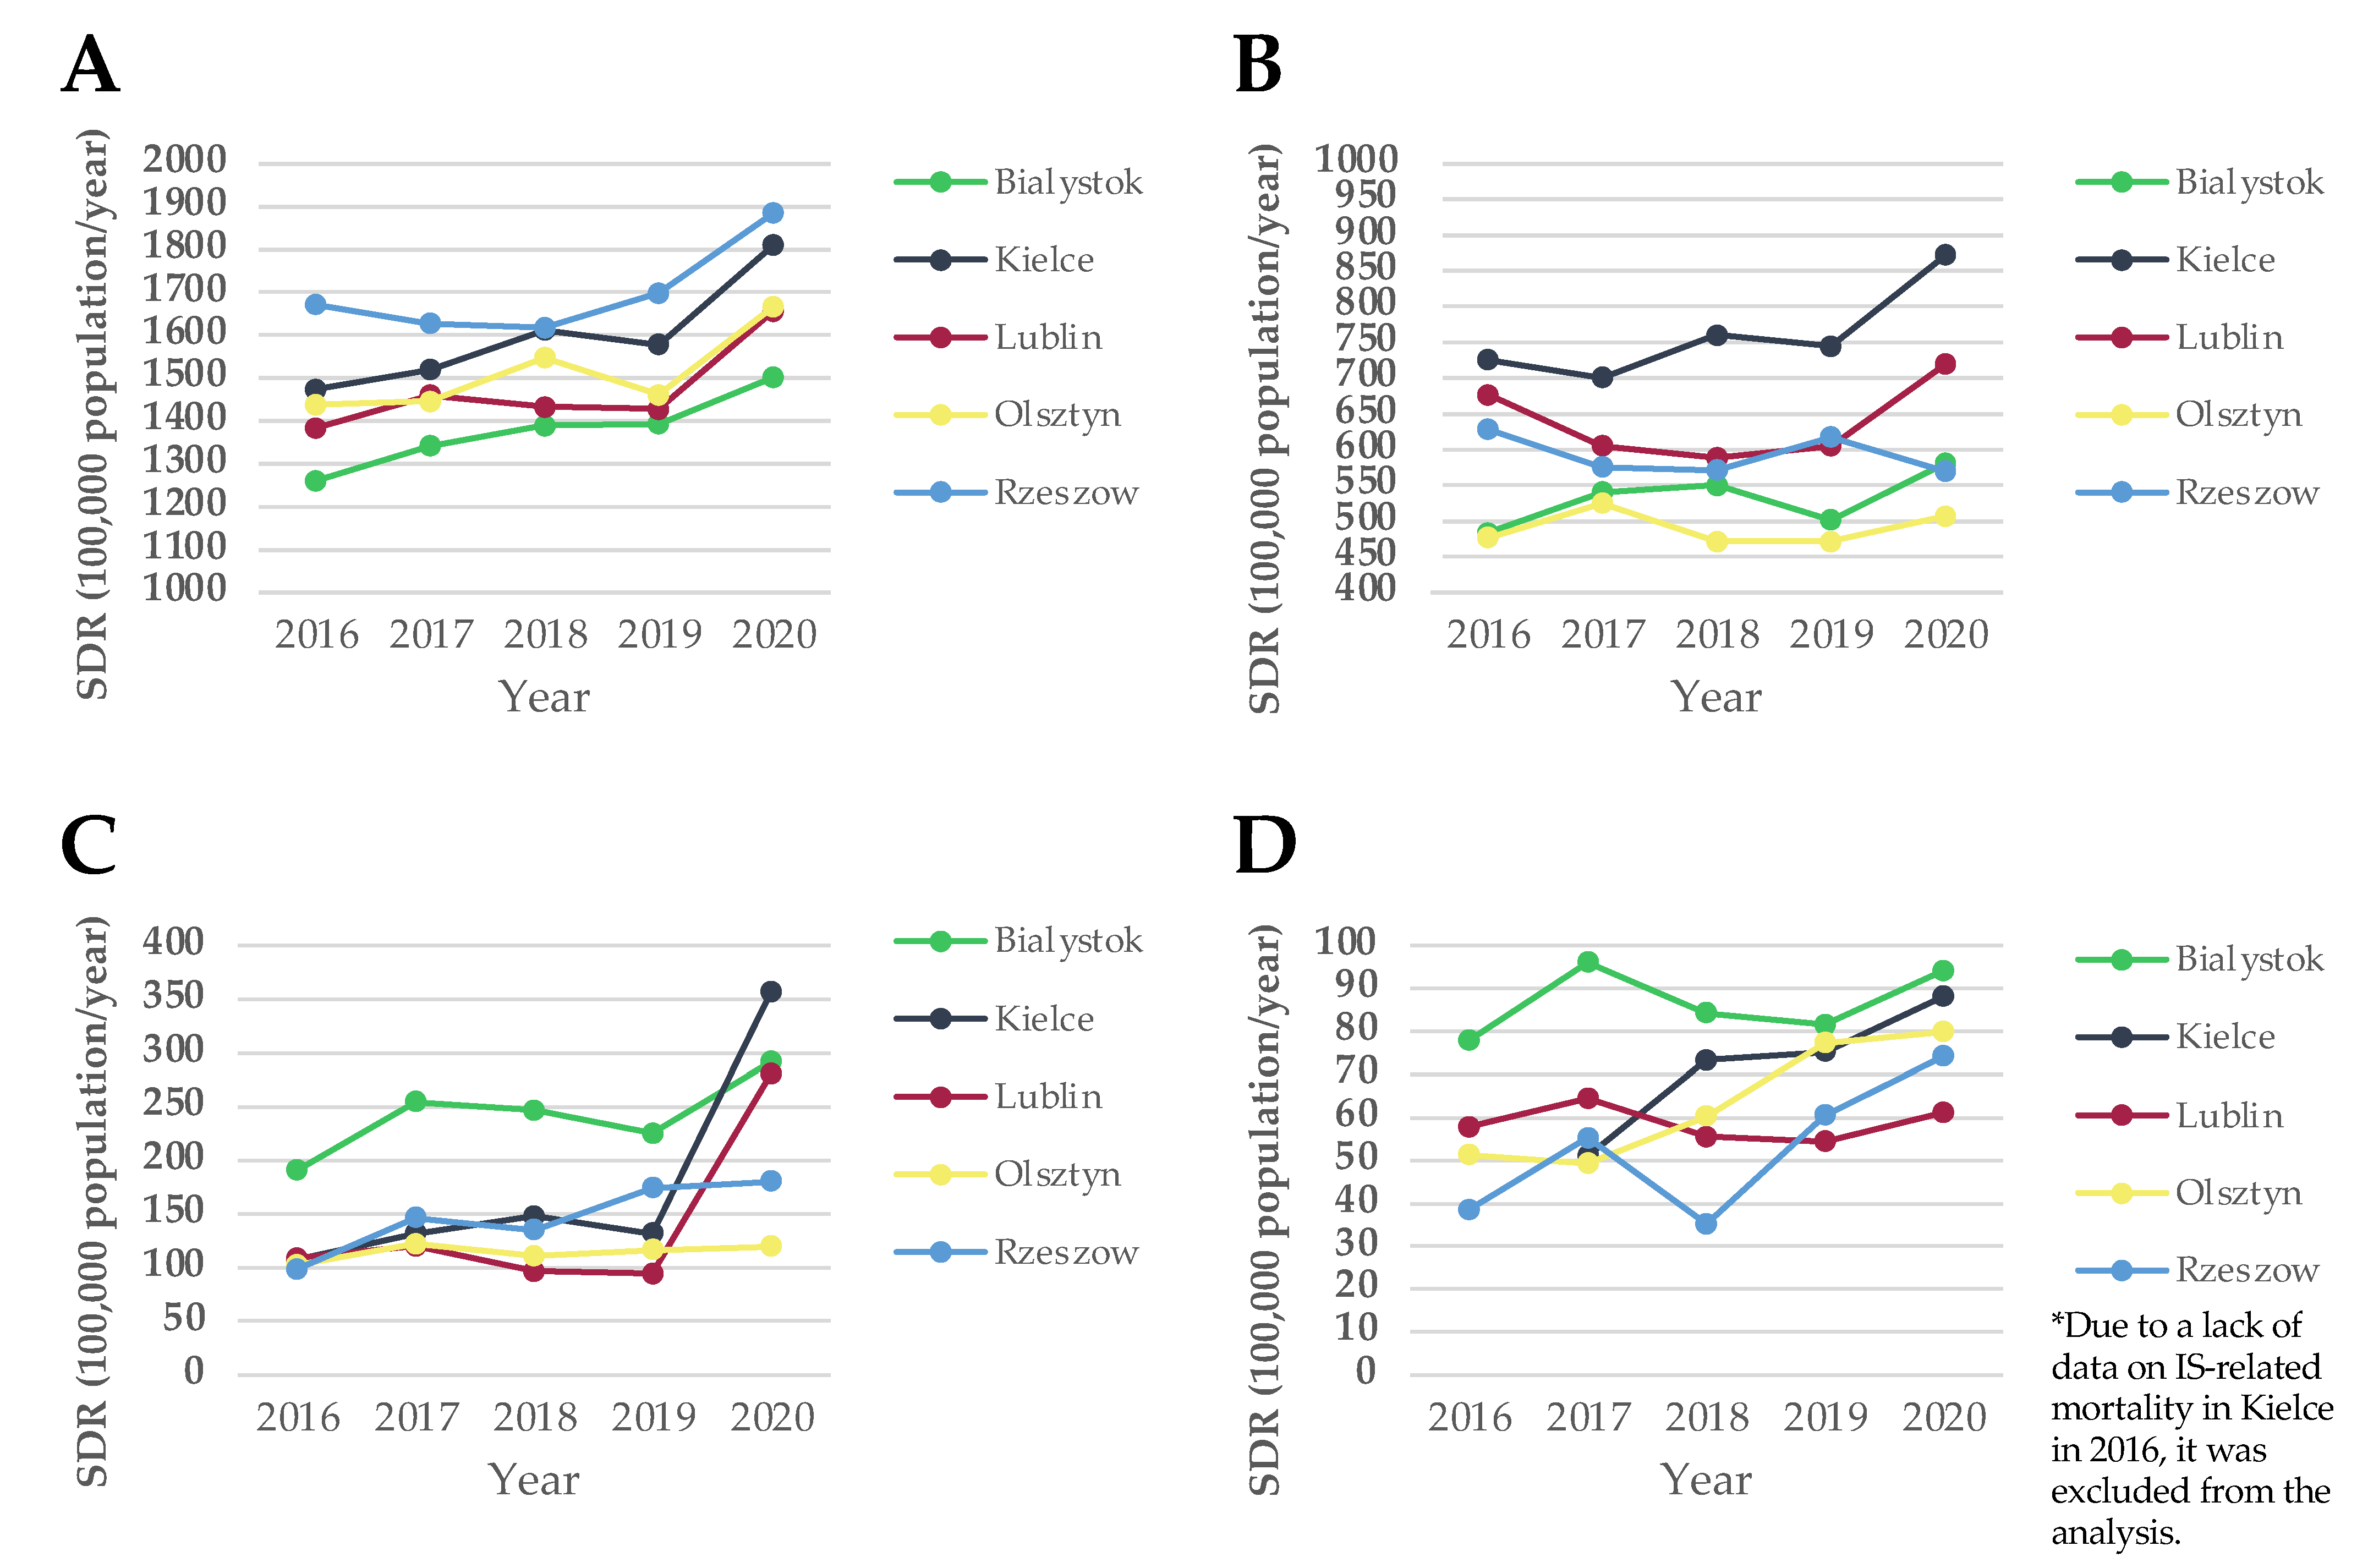
| SDR, (100,000 population/year) | 1365.84 | 1598.27 | 1471.91 | 1511.87 | 1699.7 | <0.001 |
| CVD-related deaths, n (% of total deaths) | 7293 (38.05) | 7729 (47.16) | 10,764 (42.98) | 4039 (32.21) | 5082 (34.22) | <0.001 |
| 2016; N (% of total deaths) | 1330 (37.54) | 1464 (48.77) | 2275 (48.41) | 773 (32.67) | 1074 (37.01) | <0.001 |
| 2017; N (% of total deaths) | 1484 (39.37) | 1422 (45.78) | 2028 (40.94) | 861 (36.21) | 983 (34.71) | <0.001 |
| 2018; N (% of total deaths) | 1507 (38.64) | 1544 (46.76) | 1988 (40.8) | 779 (30.3) | 976 (34.49) | <0.001 |
| 2019; N (% of total deaths) | 1376 (36.76) | 1517 (46.66) | 2040 (42.01) | 787 (32.11) | 1067 (35.67) | <0.001 |
| 2020; N (% of total deaths) | 1596 (37.9) | 1782 (47.79) | 2433 (42.96) | 839 (30.25) | 982 (29.8) | <0.001 |
| Male, N (%) | 3262 (44.73) | 3774 (48.83) | 5073 (47.13) | 2096 (51.89) | 2462 (48.45) | <0.001 |
| Mean age (SD) | 79.94 (11.32) | 77.35 (12.72) | 77.91 (12.7) | 75.7 (13.38) | 78.01 (12.88) | <0.001 |
| CVD CDR (100,000 population/year) | 491.18 | 799.21 | 635.82 | 471.71 | 516.89 | <0.001 |
| CVD SDR (100,000 population/year) | 531.23 | 760.4 | 638.92 | 490.18 | 592.16 | <0.001 |
| ACS-related deaths, n (% of CVD deaths) | 3299 (45.24) | 1793 (23.2) | 2379 (22.1) | 963 (23.84) | 1254 (24.68) | <0.001 |
| Male, N (%) | 1591 (48.23) | 921 (51.37) | 1212 (50.95) | 602 (62.51) | 626 (49.92) | <0.001 |
| Mean age (SD) | 79.43 (9.66) | 77.6 (12.42) | 77.8 (11.94) | 73.55 (11.34) | 79.05 (11.55) | <0.001 |
| ACS CDR (100,000 population/year) | 222.19 | 185.4 | 140.53 | 112.47 | 127.54 | <0.001 |
| ACS SDR (100,000 population/year) | 241.9 | 175.5 | 140.23 | 114.56 | 147.12 | <0.001 |
| IS-related deaths, n (% of CVD deaths) | 1188 (16.29) | 624 (8.07) | 986 (9.16) | 527 (13.05) | 451 (8.87) | <0.001 |
| Male, N (%) | 487 (40.99) | 295 (47.28) | 417 (42.29) | 247 (46.87) | 194 (43.02) | <0.001 |
| Mean age (SD) | 80.67 (10.06) | 77.81 (11.29) | 79.62 (11.17) | 77.22 (11.65) | 78.1 (11.48) | 0.046 |
| IS CDR (100,000 population/year) | 80.01 | 64.52 | 58.24 | 61.55 | 45.87 | <0.001 |
| IS SDR (100,000 population/year) | 86.79 | 60.61 | 58.71 | 63.61 | 52.79 | <0.001 |
| City | Bialystok | Kielce | Lublin | Olsztyn | Rzeszow |
|---|---|---|---|---|---|
| Air pollutant | PM2.5 | ||||
| Days with observation; n (%) | 1778 (97.32) | 1784 (97.65) | 1789 (97.92) | 1772 (96.99) | 1784 (97.65) |
| 2016; mean/day (SD) | 19 (12.66) | 23.39 (23.39) | 26.53 (17.39) | 15.25 (10.11) | 22.21 (14.28) |
| 2017; mean/day (SD) | 16.75 (14.12) | 24.76 (24.76) | 22.01 (20.12) | 16.82 (13.3) | 24.13 (23.26) |
| 2018; mean/day (SD) | 16.35 (11.67) | 24.93 (24.93) | 24.38 (18.16) | 19.56 (13.21) | 22.85 (16.96) |
| 2019; mean/day (SD) | 13.42 (8.59) | 19.94 (19.94) | 20.31 (12.92) | 15 (8.96) | 19.85 (15.11) |
| 2020; mean/day (SD) | 13.46 (8.85) | 16.46 (16.46) | 18.69 (12.6) | 13.96 (8.63) | 20.38 (12.67) |
| Total; mean/day (SD) | 15.82 (11.59) | 21.84 (21.84) | 22.35 (16.73) | 16.11 (11.19) | 21.88 (16.92) |
| Daily median | 12.38 | 15.53 | 17.41 | 12.7 | 16.7 |
| Winter season; mean/day (SD) | 24.38 (15.76) | 36.18 (29.26) | 33.7 (22.79) | 23.07 (14.76) | 33.27 (23.73) |
| Spring season; mean/day (SD) | 11.13 (4.82) | 13.92 (6.97) | 14.54 (7.24) | 11.21 (5.16) | 15.1 (6.39) |
| Summer season; mean/day (SD) | 9.15 (4.44) | 12.21 (6.11) | 13.93 (6.33) | 10.31 (4.47) | 13.77 (6.18) |
| Autumn season; mean/day (SD) | 19.02 (10.71) | 25.39 (16.64) | 27.21 (15.62) | 20.47 (11.35) | 25.91 (16.65) |
| Exceeded daily mean AQG 2021; n (%) | 666 (37.46) | 924 (51.79) | 1054 (58.92) | 708 (39.95) | 1016 (56.95) |
| Air pollutant | PM10 | ||||
| Days with observation; n (%) | 1732 (94.8) | 1776 (97.21) | 1813 (99.23) | 1787 (97.81) | 1821 (99.67) |
| 2016; mean/day (SD) | 23.98 (13.51) | 34.87 (34.87) | 30.92 (18.85) | 24.41 (12.98) | 27.32 (15.32) |
| 2017; mean/day (SD) | 23.25 (15.71) | 36.38 (36.38) | 32.47 (23.53) | 23.39 (15.53) | 30.33 (25.45) |
| 2018; mean/day (SD) | 26.35 (15.61) | 37.41 (37.41) | 33.59 (20.8) | 26.47 (15.77) | 31.19 (18.36) |
| 2019; mean/day (SD) | 21.13 (11.22) | 31.93 (31.93) | 26.47 (14.65) | 19.93 (11.1) | 24.41 (17.68) |
| 2020; mean/day (SD) | 21.49 (12.86) | 24.89 (24.89) | 22.35 (13.46) | 18.08 (9.96) | 19.86 (10.56) |
| Total; mean/day (SD) | 23.17 (13.96) | 32.99 (32.99) | 29.18 (19.11) | 22.43 (13.58) | 26.62 (18.57) |
| Daily median | 19.93 | 26.48 | 24.28 | 19.3 | 21.02 |
| Winter season; mean/day (SD) | 28.77 (18.49) | 47.39 (33.69) | 41.3 (26.84) | 28.33 (16.63) | 38.27 (26.64) |
| Spring season; mean/day (SD) | 20.09 (8.39) | 26.7 (12.06) | 23.69 (11.15) | 19.63 (10.89) | 21.43 (8.55) |
| Summer season; mean/day (SD) | 18.58 (8.09) | 23.66 (9.74) | 20.87 (9.12) | 17.33 (9.1) | 18.44 (7.03) |
| Autumn season; mean/day (SD) | 24.94 (15.31) | 34.55 (20.29) | 31.42 (17.88) | 24.58 (13.89) | 29.07 (18.72) |
| Exceeded daily mean AQG 2021; n (%) | 120 (6.93) | 347 (19.54) | 251 (13.84) | 116 (6.49) | 203 (11.15) |
| Air pollutant | NO2 | ||||
| Days with observation; n (%) | 1799 (98.47) | 1788 (97.87) | 1826 (99.95) | 1818 (99.51) | 1827 (100) |
| 2016; mean/day (SD) | 13.46 (5.55) | 25.66 (11.09) | 21.74 (9.37) | 15.26 (6.41) | 18.65 (6.52) |
| 2017; mean/day (SD) | 13.09 (5.19) | 23.26 (13.04) | 21.73 (9.71) | 14.1 (8.66) | 17.59 (8.55) |
| 2018; mean/day (SD) | 14.05 (6.26) | 26.79 (10.4) | 21.63 (10.07) | 14.72 (9.53) | 18.06 (7.75) |
| 2019; mean/day (SD) | 12.55 (5.2) | 21 (7.94) | 19.49 (8.45) | 12.7 (6.86) | 15.78 (7.3) |
| 2020; mean/day (SD) | 11.93 (5.53) | 24.36 (9.15) | 17.2 (7.05) | 11.47 (6.57) | 12.25 (5.35) |
| Total; mean/day (SD) | 13.03 (5.6) | 24.16 (10.64) | 20.36 (9.16) | 13.65 (7.83) | 16.47 (7.54) |
| Daily median | 11.89 | 22.48 | 18.68 | 12.38 | 15.02 |
| Winter season; mean/day (SD) | 14.55 (6.26) | 28.76 (12.15) | 23.24 (10.32) | 16.83 (8.46) | 20.61 (9.23) |
| Spring season; mean/day (SD) | 11.74 (4.59) | 20.87 (8.86) | 17.98 (7.23) | 9.99 (5.85) | 14.11 (5.38) |
| Summer season; mean/day (SD) | 12.42 (4.92) | 22.92 (9.97) | 19.11 (8.79) | 11.28 (5.61) | 13.61 (4.92) |
| Autumn season; mean/day (SD) | 13.46 (6.06) | 24.2 (9.9) | 21.26 (9.29) | 16.55 (8.42) | 17.8 (7.73) |
| Exceeded daily mean AQG 2021; n (%) | 69 (3.83) | 740 (41.39) | 491 (26.89) | 141 (7.76) | 228 (12.48) |
Disclaimer/Publisher’s Note: The statements, opinions and data contained in all publications are solely those of the individual author(s) and contributor(s) and not of MDPI and/or the editor(s). MDPI and/or the editor(s) disclaim responsibility for any injury to people or property resulting from any ideas, methods, instructions or products referred to in the content. |
© 2023 by the authors. Licensee MDPI, Basel, Switzerland. This article is an open access article distributed under the terms and conditions of the Creative Commons Attribution (CC BY) license (https://creativecommons.org/licenses/by/4.0/).
Share and Cite
Święczkowski, M.; Dobrzycki, S.; Kuźma, Ł. Multi-City Analysis of the Acute Effect of Polish Smog on Cause-Specific Mortality (EP-PARTICLES Study). Int. J. Environ. Res. Public Health 2023, 20, 5566. https://doi.org/10.3390/ijerph20085566
Święczkowski M, Dobrzycki S, Kuźma Ł. Multi-City Analysis of the Acute Effect of Polish Smog on Cause-Specific Mortality (EP-PARTICLES Study). International Journal of Environmental Research and Public Health. 2023; 20(8):5566. https://doi.org/10.3390/ijerph20085566
Chicago/Turabian StyleŚwięczkowski, Michał, Sławomir Dobrzycki, and Łukasz Kuźma. 2023. "Multi-City Analysis of the Acute Effect of Polish Smog on Cause-Specific Mortality (EP-PARTICLES Study)" International Journal of Environmental Research and Public Health 20, no. 8: 5566. https://doi.org/10.3390/ijerph20085566