United States Long-Term Trends in Adult BMI (1959–2018): Unraveling the Roots of the Obesity Epidemic
Abstract
:1. Introduction
2. Materials and Methods
2.1. Data Collection
2.2. Data Analysis
3. Results
3.1. Study Population
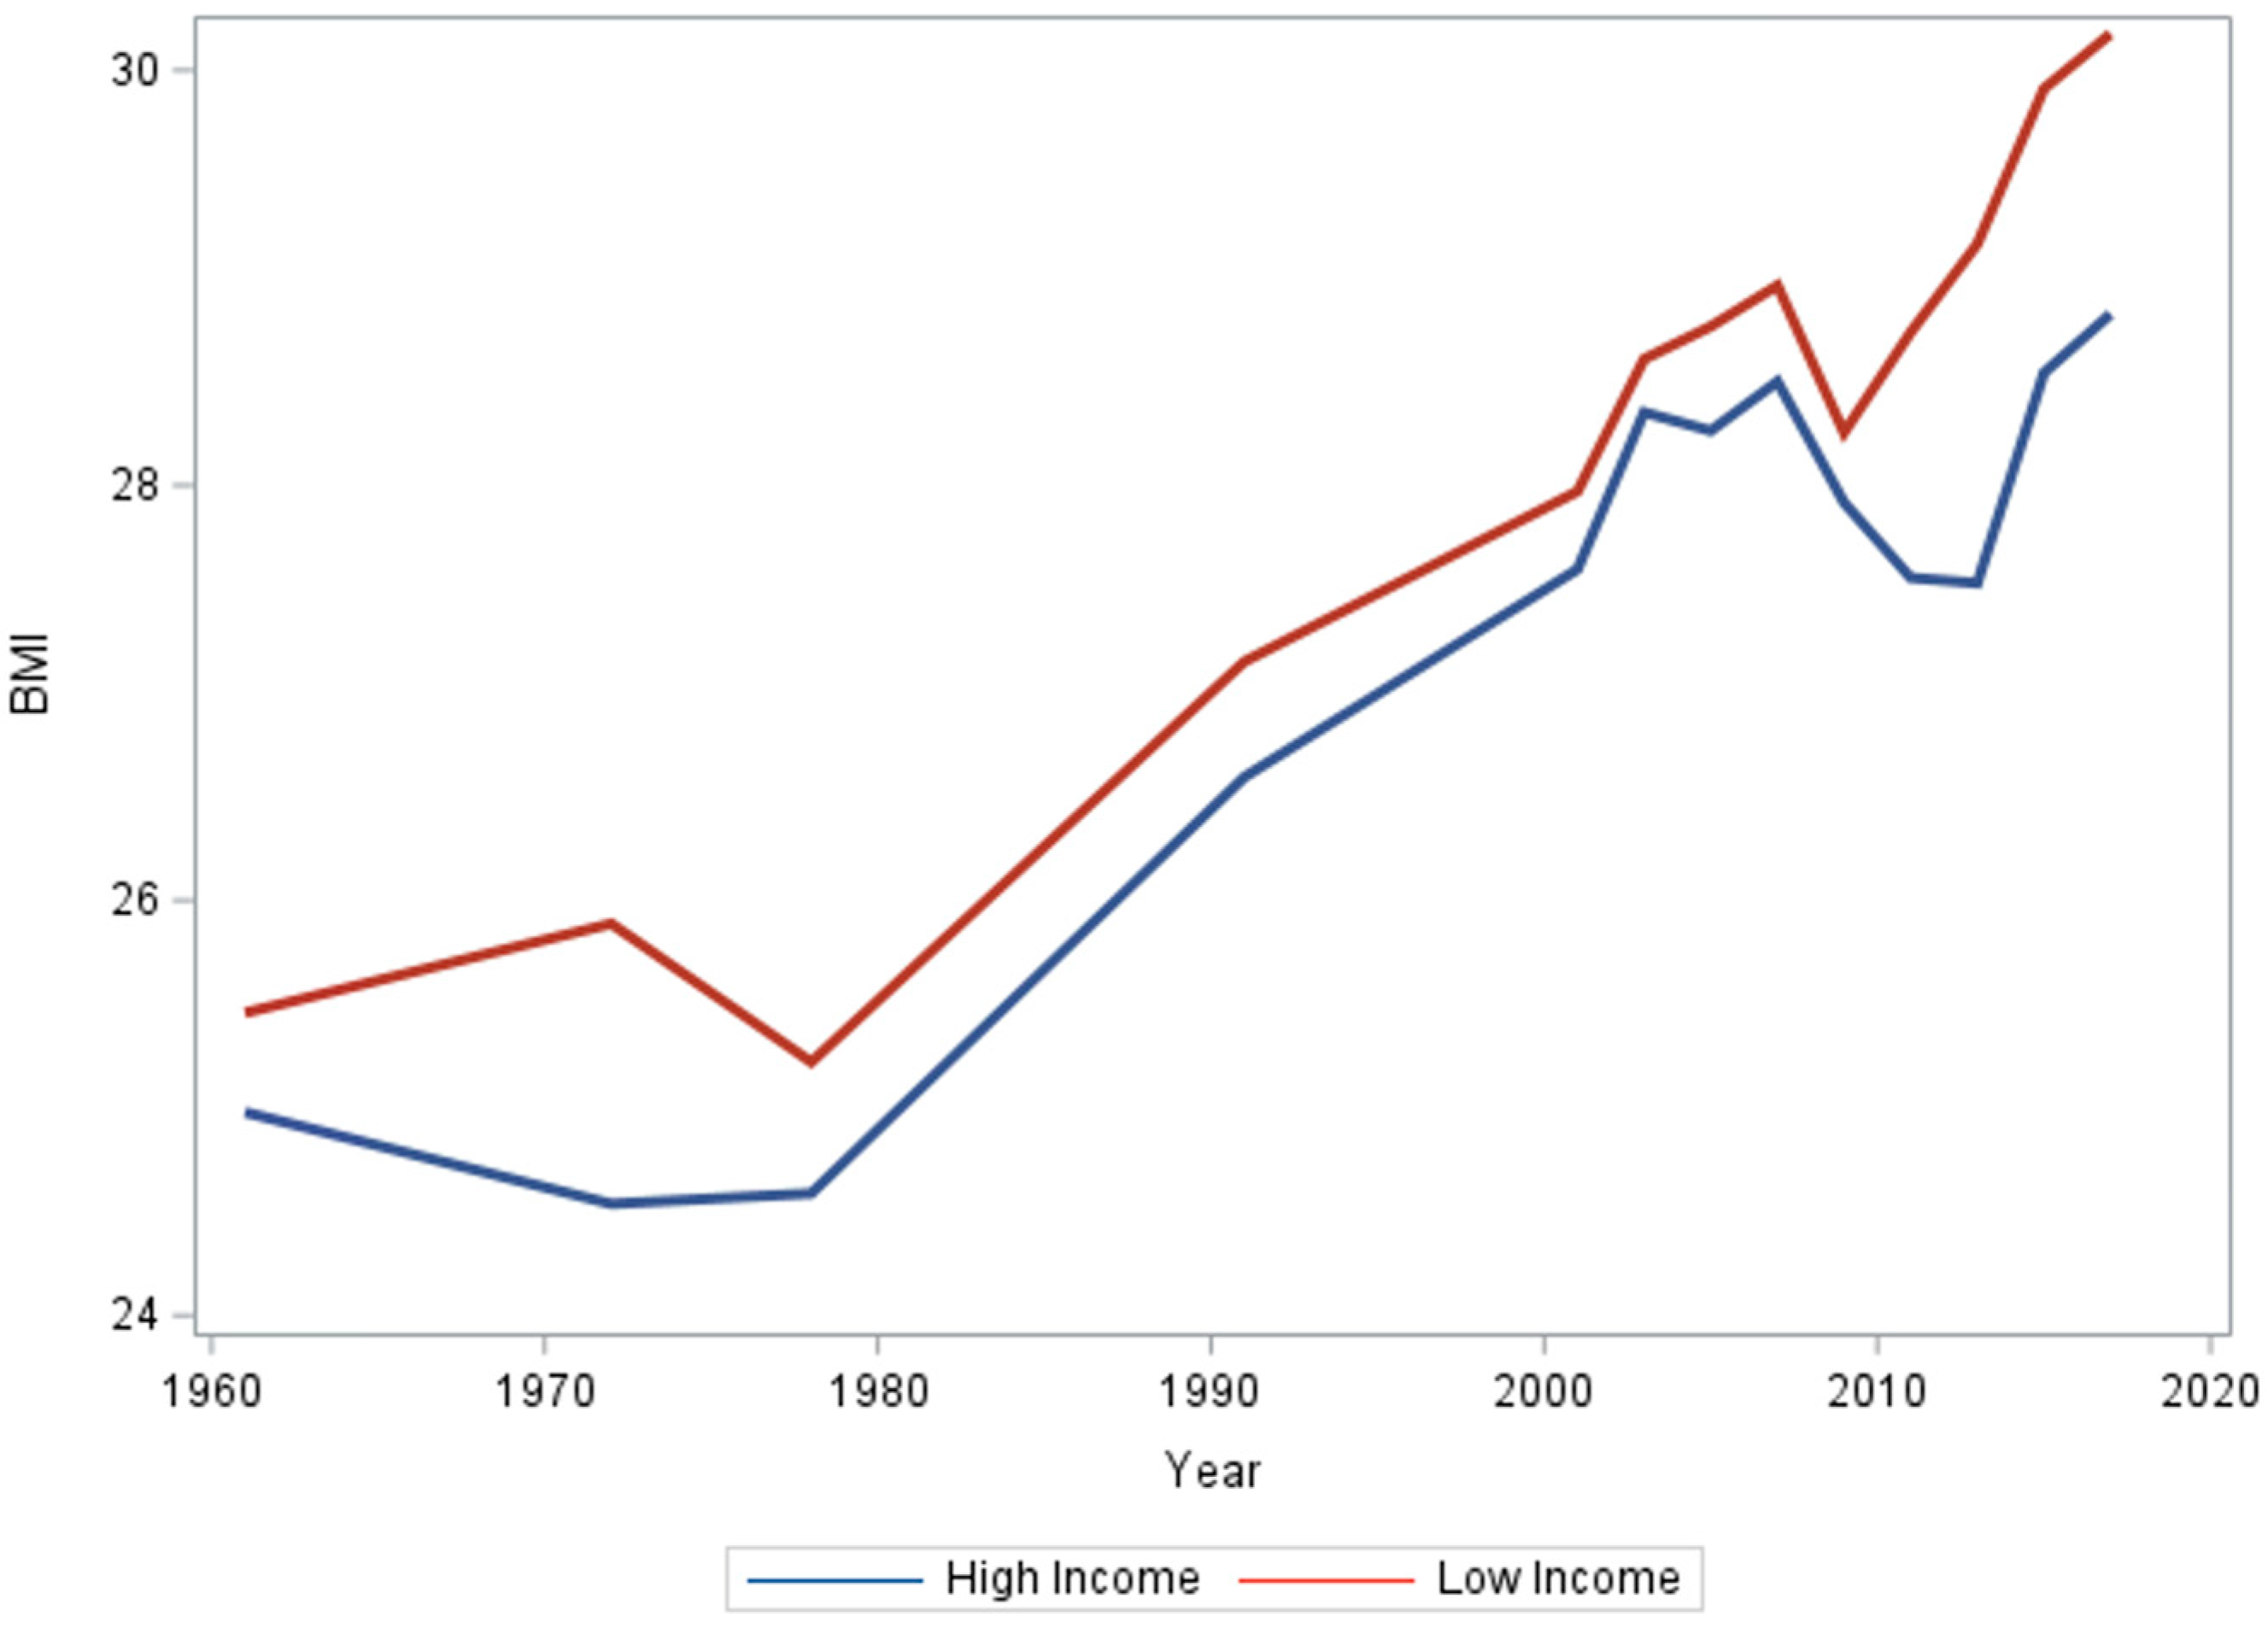
3.2. Income
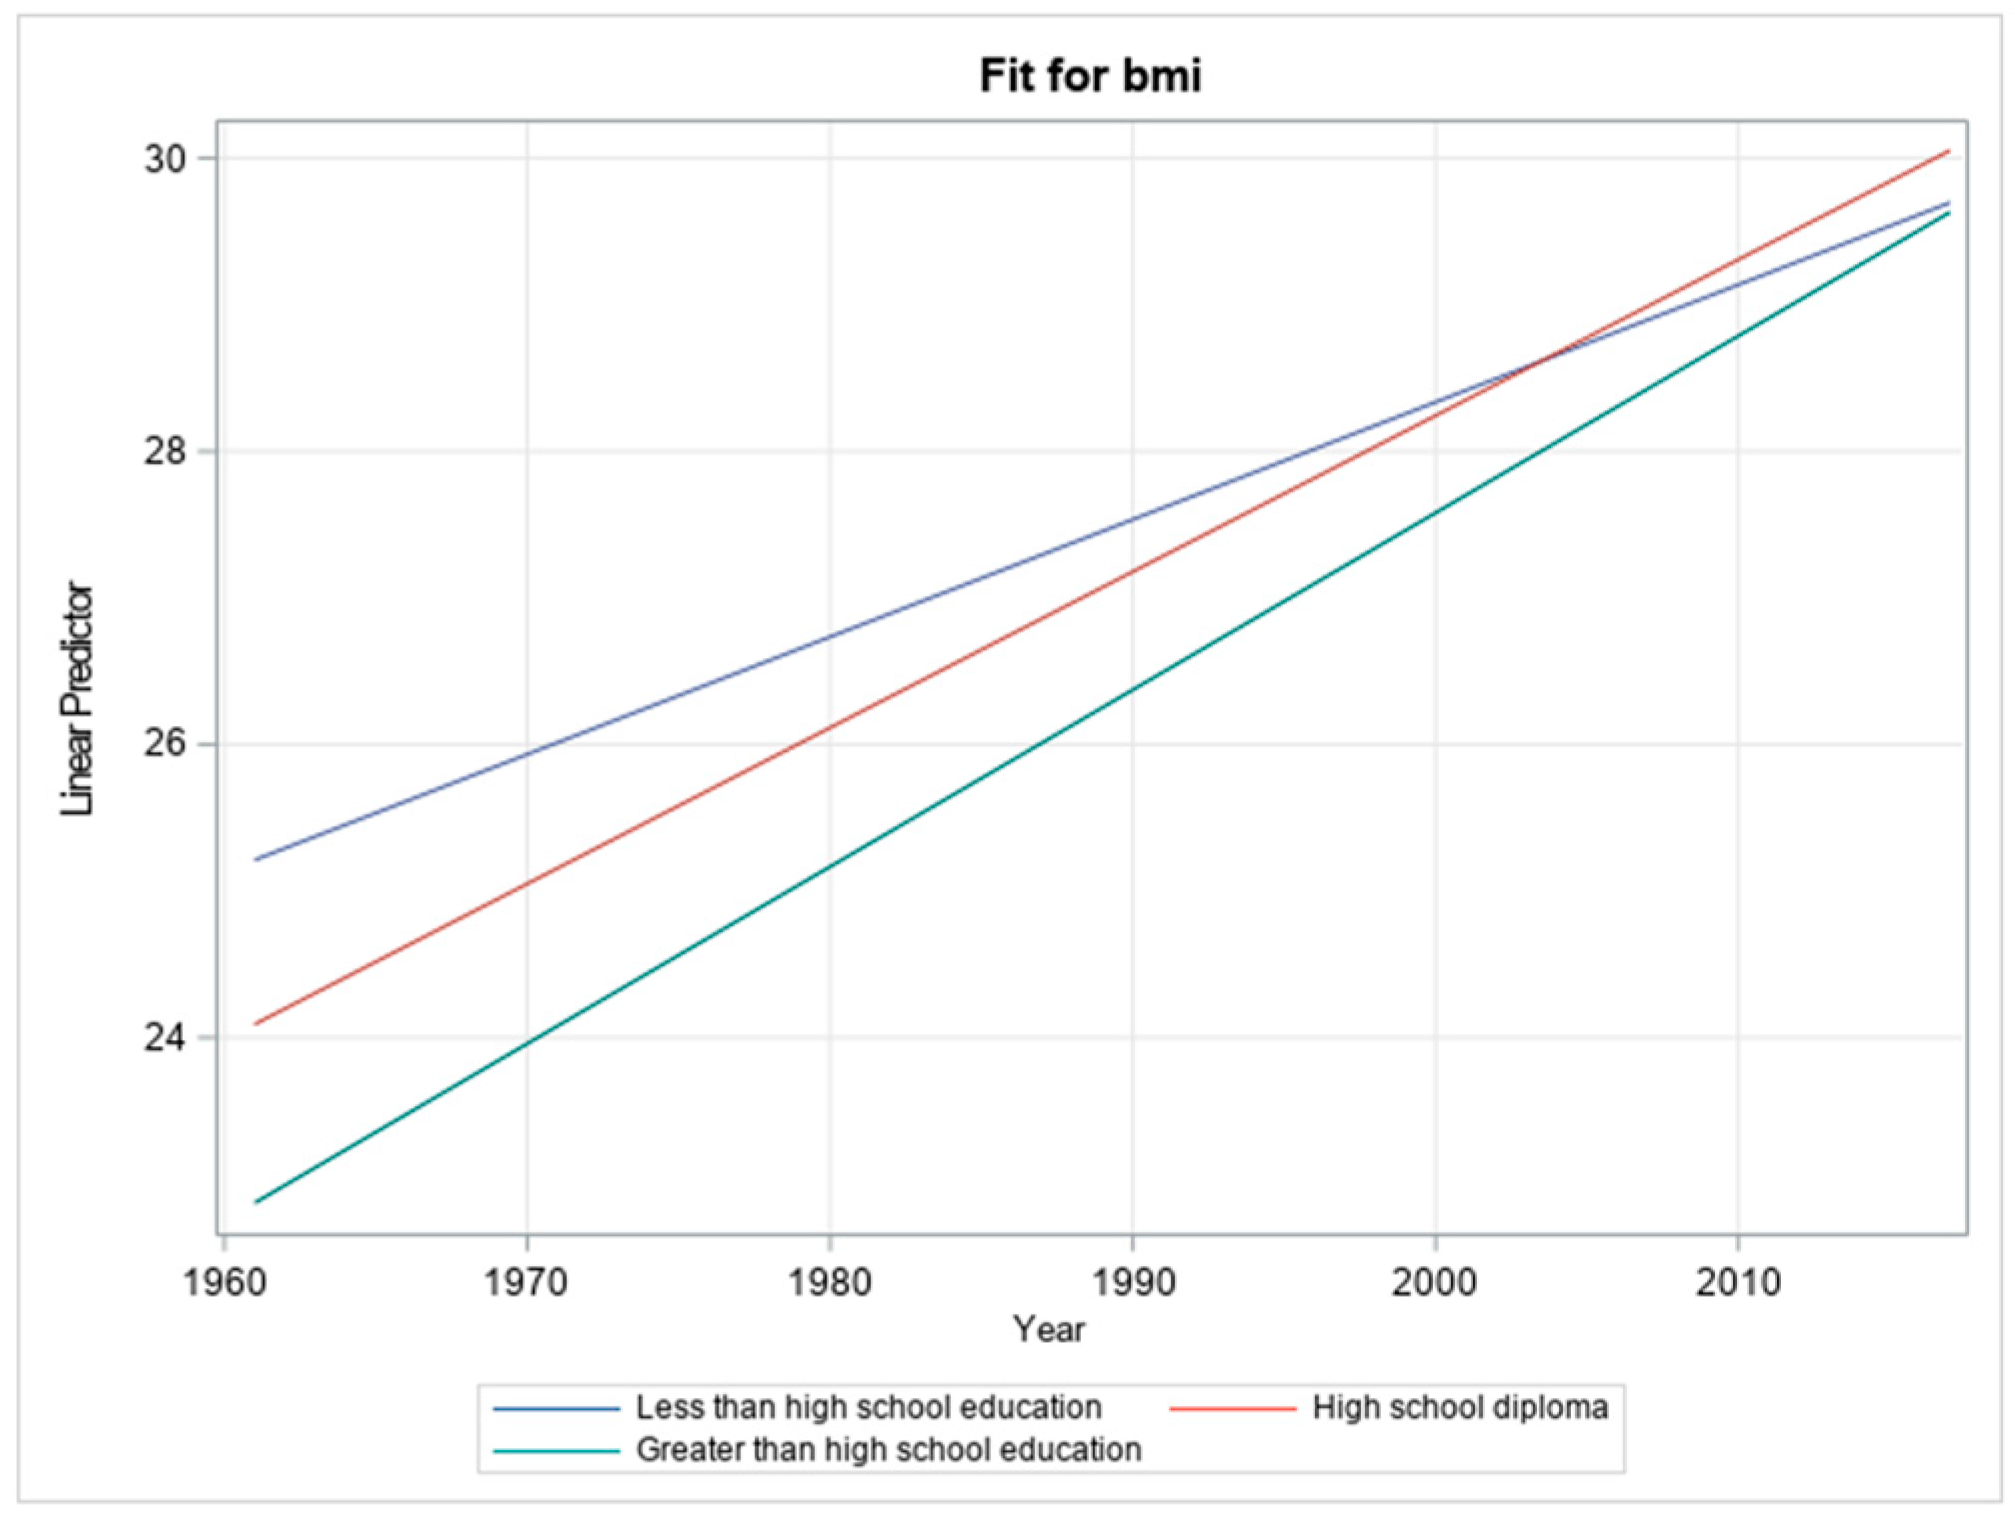
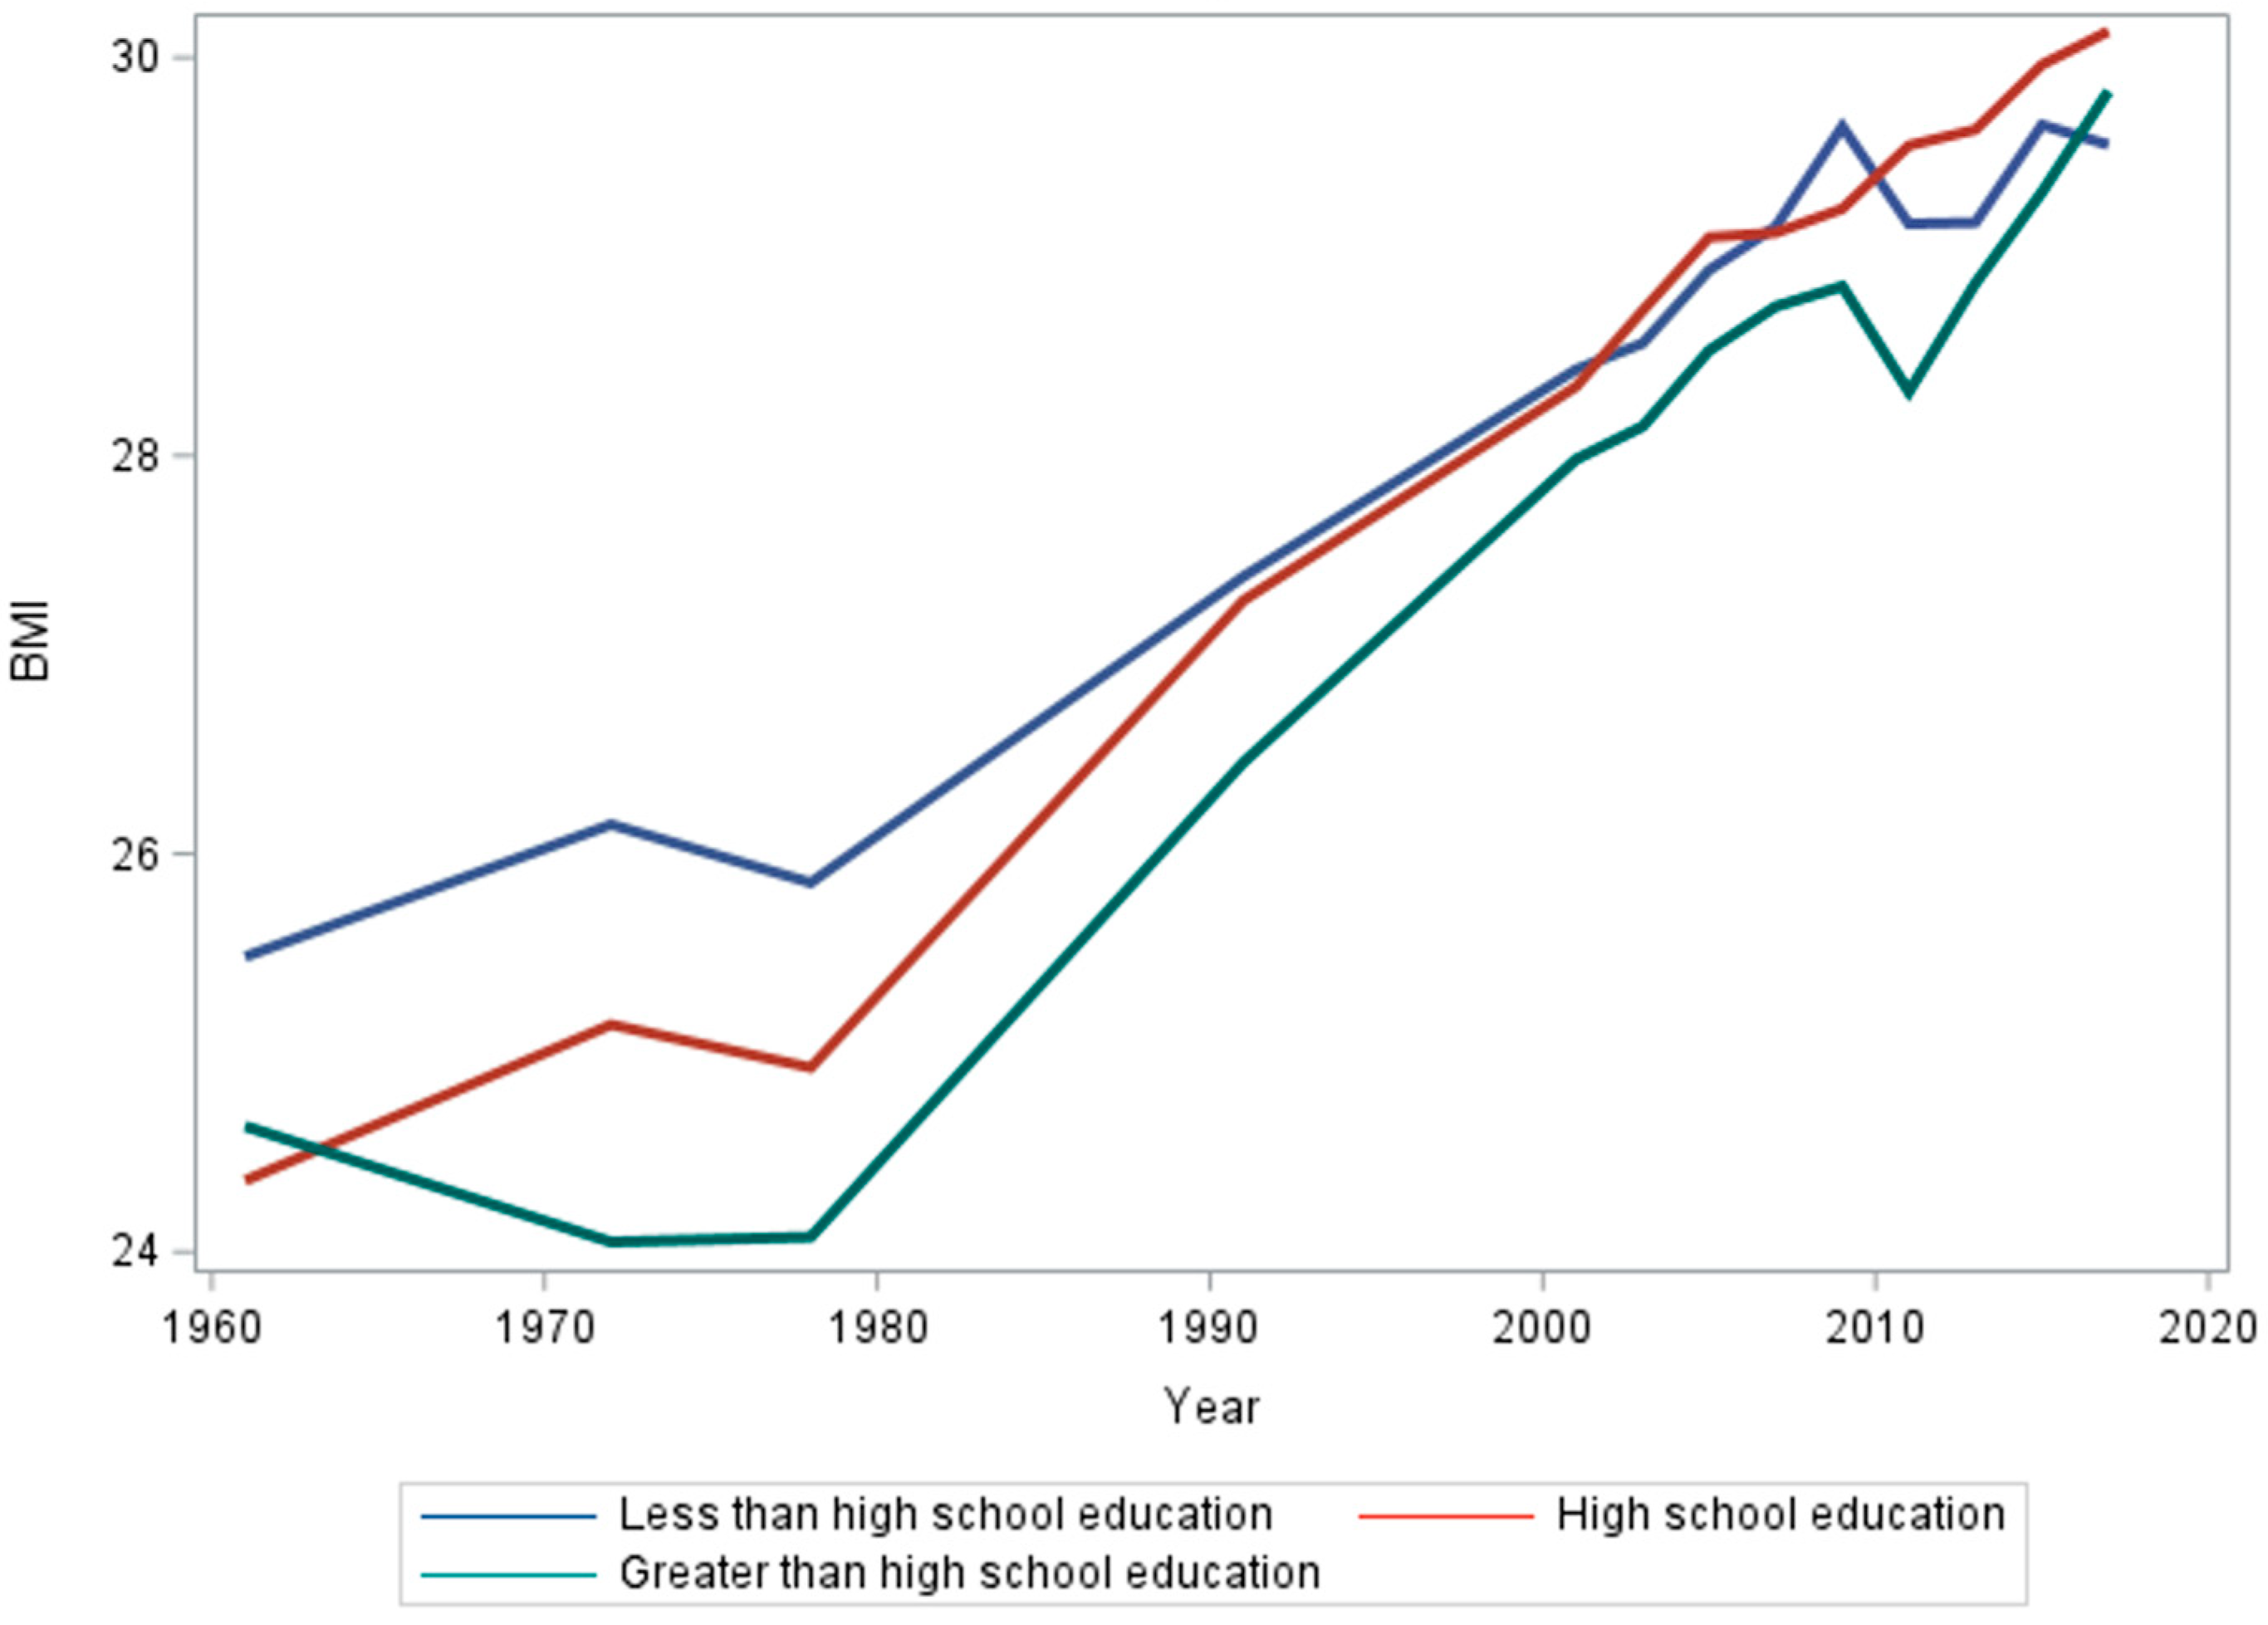
3.3. Education
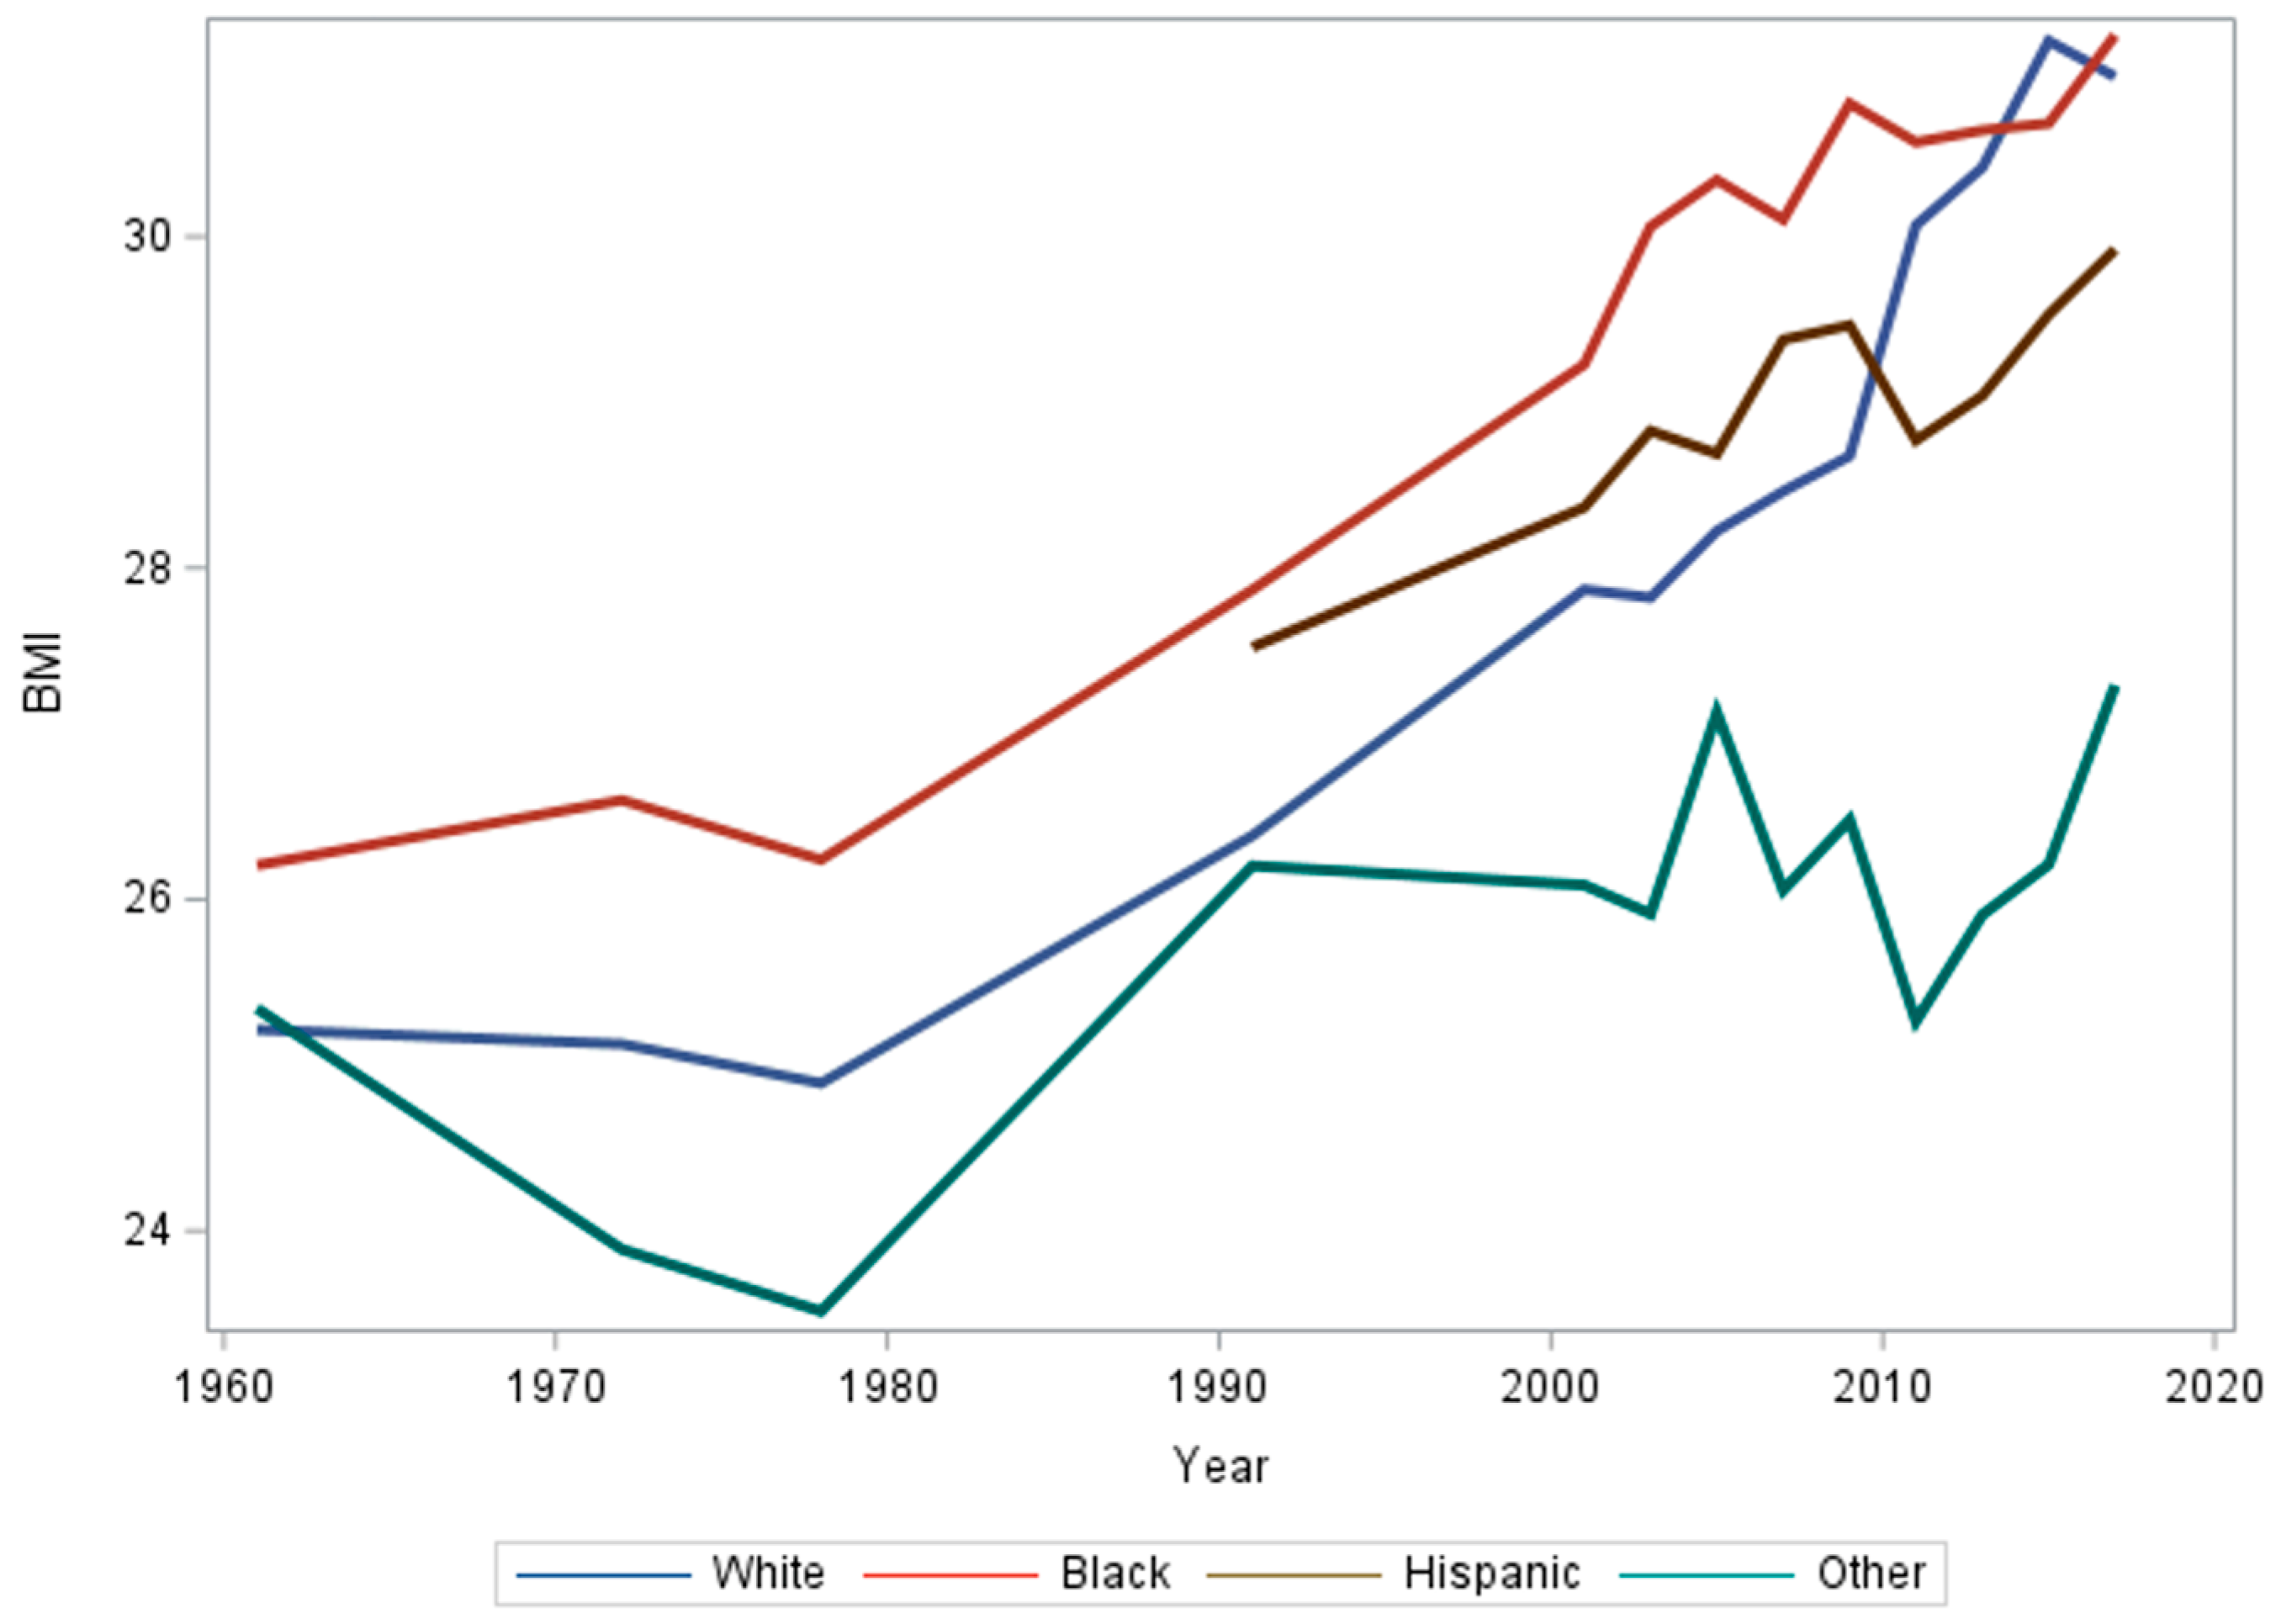
3.4. Race/Ethnicity
3.5. Interactions
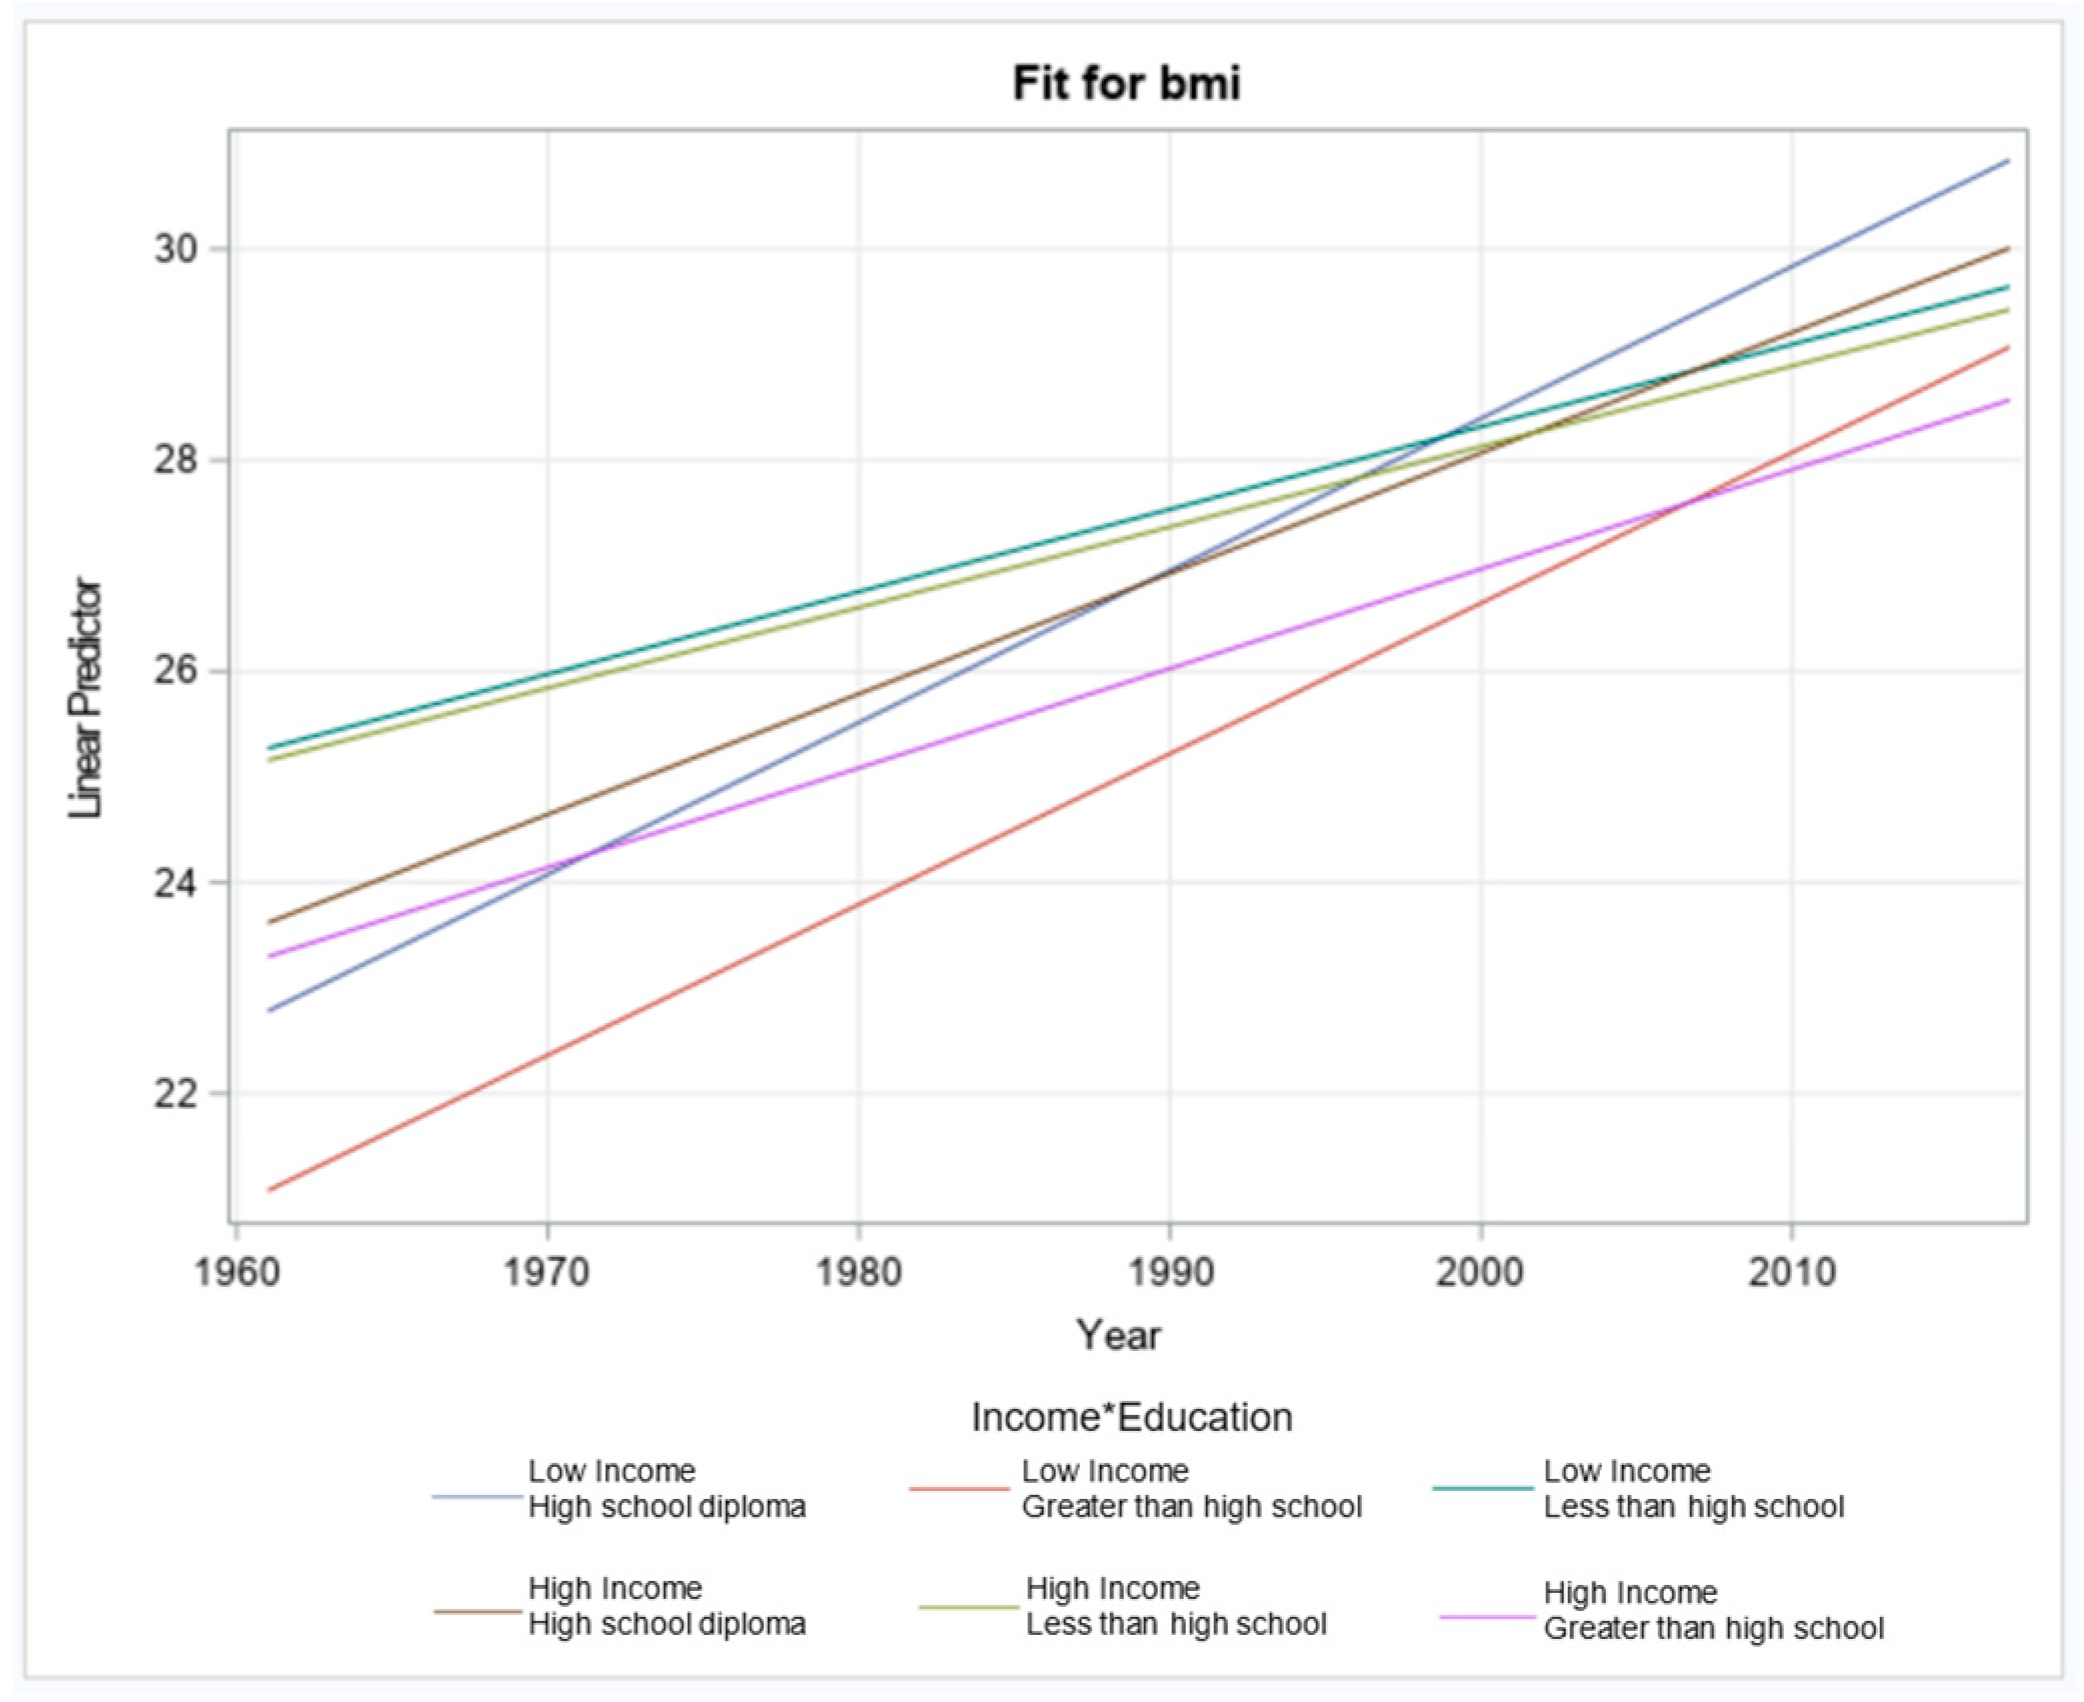
3.5.1. Income and Education
3.5.2. Income and Race/Ethnicity
3.5.3. Education and Race/Ethnicity
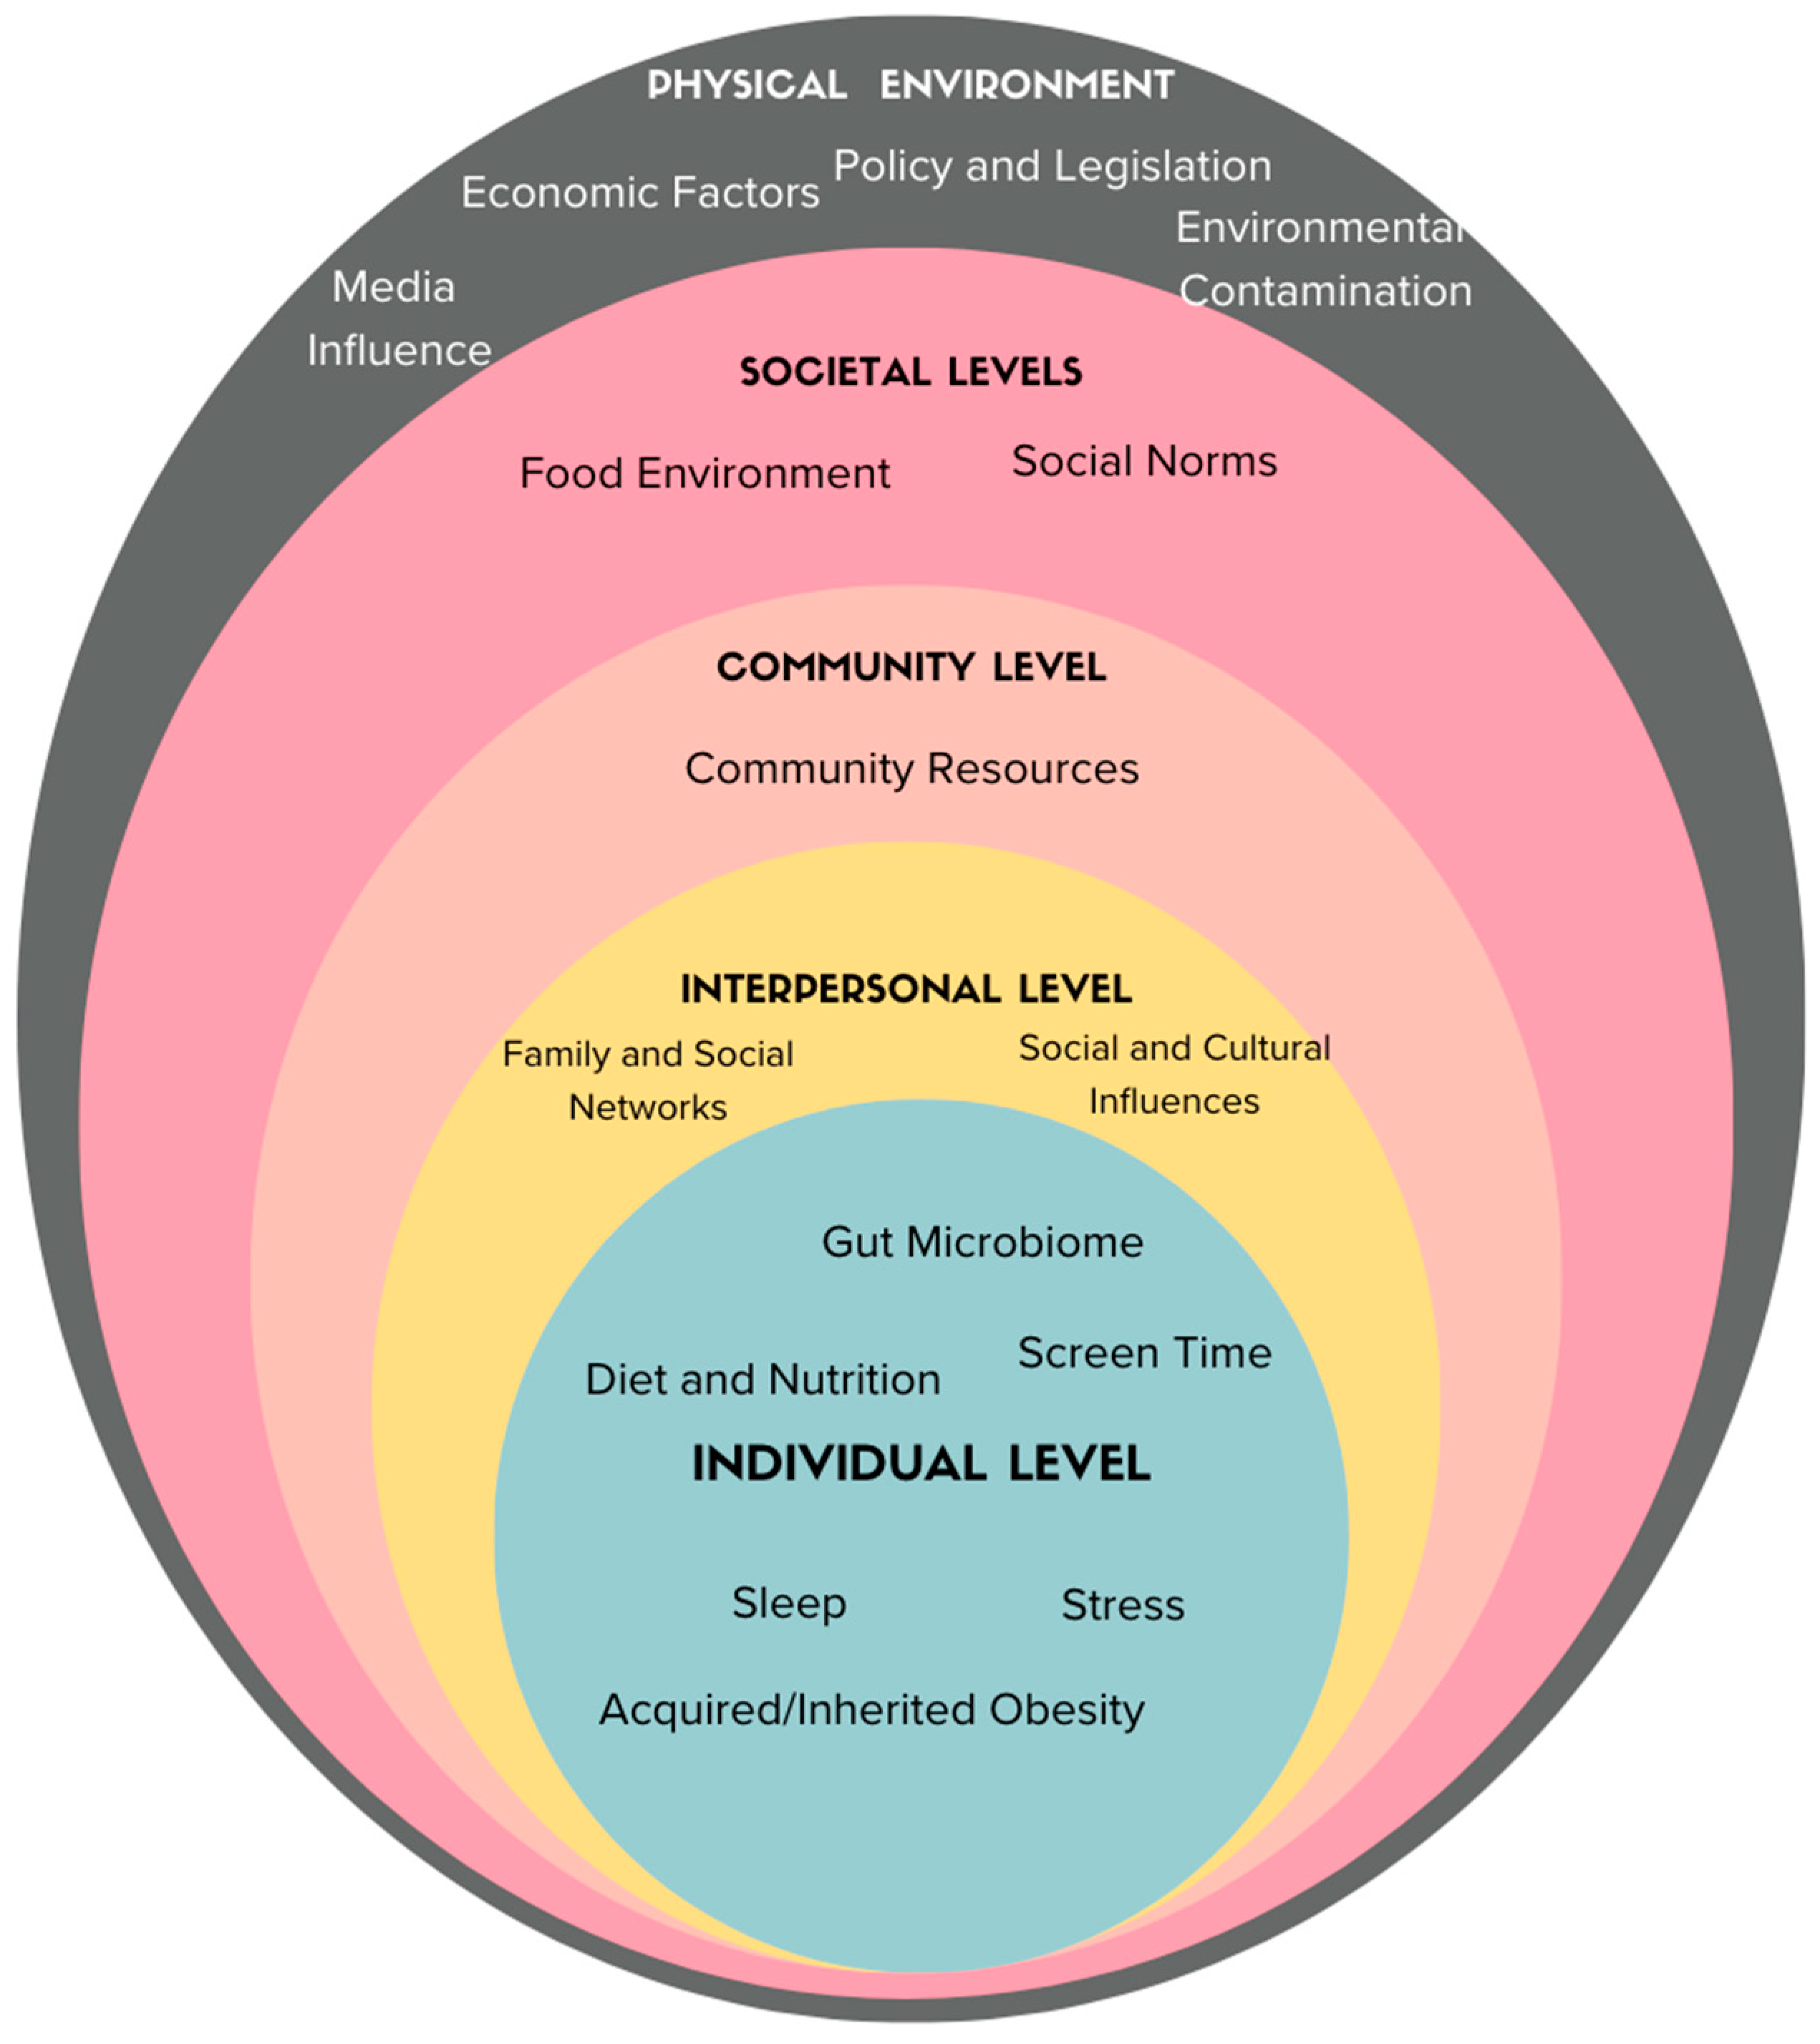
4. Discussion
Future Research Directions
5. Conclusions
Author Contributions
Funding
Institutional Review Board Statement
Informed Consent Statement
Data Availability Statement
Conflicts of Interest
Appendix A
| Survey | Income | Education | Race | ||||||
|---|---|---|---|---|---|---|---|---|---|
| Lowest Income Decile | Highest Income Decile | Less Than High School Education | High School Education | Greater Than High School Education | White | Black | Hispanic | Other Race | |
| NHES | 25.458 | 24.979 | 26.185 | 24.987 | 24.521 | 25.215 | 26.206 | 25.343 | |
| NHANES I | 25.887 | 24.537 | 26.145 | 25.141 | 24.050 | 25.127 | 26.599 | 23.888 | |
| NHANES II | 25.221 | 24.588 | 25.855 | 24.926 | 24.075 | 24.891 | 26.240 | 23.515 | |
| NHANES III | 27.151 | 26.594 | 27.392 | 27.272 | 26.459 | 26.385 | 27.868 | 27.522 | 26.202 |
| 1999–2000 | 27.921 | 27.545 | 28.729 | 28.545 | 27.945 | 27.683 | 29.729 | 28.567 | 28.028 |
| 2001–2002 | 27.971 | 27.596 | 28.432 | 28.347 | 27.982 | 27.869 | 29.229 | 28.366 | 26.087 |
| 2003–2004 | 28.608 | 28.351 | 28.564 | 28.728 | 28.147 | 27.822 | 30.060 | 28.827 | 25.914 |
| 2005–2006 | 28.766 | 28.263 | 28.933 | 29.097 | 28.529 | 28.224 | 30.341 | 28.690 | 27.126 |
| 2007–2008 | 28.963 | 28.500 | 29.151 | 29.120 | 28.749 | 28.463 | 30.103 | 29.378 | 26.057 |
| 2009–2010 | 28.255 | 27.917 | 29.653 | 29.240 | 28.851 | 28.677 | 30.803 | 29.465 | 26.480 |
| 2011–2012 | 28.737 | 27.555 | 29.164 | 29.558 | 28.321 | 30.068 | 30.569 | 28.771 | 25.266 |
| 2013–2014 | 29.163 | 27.539 | 29.171 | 29.638 | 28.866 | 30.417 | 30.641 | 29.040 | 25.907 |
| 2015–2016 | 29.911 | 28.542 | 29.661 | 29.964 | 29.324 | 31.180 | 30.683 | 29.529 | 26.211 |
| 2017–2018 | 30.176 | 28.823 | 29.561 | 30.132 | 29.831 | 30.965 | 31.216 | 29.922 | 27.292 |
| Variable | Estimate | Standard Error | p-Value |
|---|---|---|---|
| Year | 0.07627 | 0.008369 | <0.0001 |
| Low income × high school diploma | −135.22 | 25.8724 | <0.0001 |
| Low income × greater than high school | −134.45 | 25.0624 | <0.0001 |
| Low income × less than high school | −3.5084 | 19.4898 | 0.8571 |
| High income × high school diploma | −75.8319 | 23.0026 | <0.001 |
| High income × greater than high school | −37.0351 | 18.7670 | 0.0485 |
| High income × less than high school (reference) | |||
| Low income × high school diploma × year | 0.06774 | 0.01299 | <0.0001 |
| Low income × greater than high school × year | 0.06648 | 0.01258 | <0.0001 |
| Low income × less than high school × year | 0.00185 | 0.00982 | 0.8507 |
| High income × high school diploma × year | 0.03789 | 0.01157 | 0.0011 |
| High income × greater than high school × year | 0.01794 | 0.00944 | 0.0575 |
| High income × less than high school × year |
| Variable | Estimate | Standard Error | p-Value |
|---|---|---|---|
| Year | 0.08781 | 0.00444 | <0.0001 |
| Low income × Black | −1.6533 | 15.9272 | 0.9173 |
| Low income × Hispanic | 12.1333 | 31.4705 | 0.6998 |
| Low income × other | 88.6894 | 34.6605 | 0.0105 |
| Low income × White | −6.9394 | 15.5021 | 0.6544 |
| High income × Black | −80.9821 | 26.4167 | 0.0022 |
| High income × Hispanic | 88.3164 | 31.0020 | 0.0044 |
| High income × other | 129.81 | 35.2169 | 0.0002 |
| High income × White (reference) | |||
| Low income × Black × year | 0.00173 | 0.00800 | 0.8288 |
| Low income × Hispanic × year | −0.00559 | 0.01571 | 0.7219 |
| Low income × other × year | −0.04492 | 0.01722 | 0.0095 |
| Low income × White × year | 0.00362 | 0.00780 | 0.6428 |
| High income × Black × year | 0.04156 | 0.01320 | 0.0016 |
| High income × Hispanic × year | −0.04373 | 0.01544 | 0.0046 |
| High income × other × year | −0.06590 | 0.01754 | 0.0002 |
| High income × White × year (reference) |
| Variable | Estimate | Standard Error | p-Value |
|---|---|---|---|
| Year | 0.08312 | 0.00260 | <0.0001 |
| High school diploma × Black | −66.7831 | 13.1696 | <0.0001 |
| High school diploma × Hispanic | −26.8756 | 19.8288 | 0.1753 |
| High school diploma × other | 74.1624 | 31.6650 | 0.0192 |
| High school diploma × White | −80.9696 | 8.6417 | <0.0001 |
| Greater than high school × Black | −138.61 | 13.4893 | <0.0001 |
| Greater than high school × Hispanic | −4.2760 | 18.7219 | 0.8193 |
| Greater than high school × other | 2.5598 | 21.1498 | 0.9037 |
| Greater than high school × White | −87.7894 | 7.8285 | <0.0001 |
| Less than high school × Black | 7.0999 | 9.7619 | 0.4670 |
| Less than high school × Hispanic | −0.6564 | 15.4533 | 0.9661 |
| Less than high school × other | 144.35 | 20.2504 | <0.0001 |
| Less than high school × White (reference) | |||
| High school diploma × Black × year | 0.03386 | 0.00660 | <0.0001 |
| High school diploma × Hispanic × year | 0.01361 | 0.00989 | 0.1688 |
| High school diploma × other × year | −0.03799 | 0.01579 | 0.0162 |
| High school diploma × White × year | 0.04044 | 0.00435 | <0.0001 |
| Greater than high school × Black × year | 0.06987 | 0.00674 | <0.0001 |
| Greater than high school × Hispanic × year | 0.00208 | 0.00933 | 0.8238 |
| Greater than high school × other × year | −0.00273 | 0.01054 | 0.7952 |
| Greater than high school × White × year | 0.04352 | 0.00394 | <0.0001 |
| Less than high school × Black × year | −0.00309 | 0.00491 | 0.5299 |
| Less than high school × Hispanic × year | 0.00049 | 0.00773 | 0.9500 |
| Less than high school × Other × year | −0.07319 | 0.01014 | <0.0001 |
| Less than high school × White × year (reference) |



References
- Panuganti, K.K.; Nguyen, M.; Kshirsagar, R.K. Obesity. In StatPearls; StatPearls Publishing: Treasure Island, FL, USA, 2023. Available online: http://www.ncbi.nlm.nih.gov/books/NBK459357/ (accessed on 27 November 2023).
- Wang, Y.; Beydoun, M.A.; Min, J.; Xue, H.; Kaminsky, L.A.; Cheskin, L.J. Has the prevalence of overweight, obesity and central obesity levelled off in the United States? Trends, patterns, disparities, and future projections for the obesity epidemic. Int. J. Epidemiol. 2020, 49, 810–823. [Google Scholar] [CrossRef]
- Hales, C.M.; Fryar, C.D.; Carroll, M.D.; Freedman, D.S.; Aoki, Y.; Ogden, C.L. Differences in Obesity Prevalence by Demographic Characteristics and Urbanization Level among Adults in the United States, 2013–2016. JAMA 2018, 319, 2419. [Google Scholar] [CrossRef]
- Sarma, S.; Sockalingam, S.; Dash, S. Obesity as a Mulitsystemdisease: Trends in obesity rates and Obesity-Related complications. Diabetes Obes. Metab. 2021, 23, 3–16. [Google Scholar] [CrossRef] [PubMed]
- Malnick, S.D.H. The medical complications of obesity. J. Assoc. Physicians 2006, 99, 565–579. [Google Scholar] [CrossRef]
- Weir, C.B.; Jan, A. BMI Classification Percentile and Cut off Points. In StatPearls; StatPearls Publishing: Treasure Island, FL, USA, 2023. [Google Scholar]
- Patel, S.R.; Hu, F.B. Short Sleep Duration and Weight Gain: A Systematic Review. Obesity 2008, 16, 643–653. [Google Scholar] [CrossRef]
- Zimmerman, F.J. Using Marketing Muscle to Sell Fat: The Rise of Obesity in the Modern Economy. Annu. Rev. Public Health 2011, 32, 285–306. [Google Scholar] [CrossRef]
- Safaei, M.; Sundararajan, E.A.; Driss, M.; Boulila, W.; Shapi’i, A. A systematic literature review on obesity: Understanding the causes & consequences of obesity and reviewing various machine learning approaches used to predict obesity. Comput. Biol. Med. 2021, 136, 104754. [Google Scholar] [CrossRef]
- Chiang, J.; Arons, A.; Pomeranz, J.L.; Siddiqi, A.; Hamad, R. Geographic and Longitudinal Trends in Media Framing of Obesity in the United States. Obesity 2020, 28, 1351–1357. [Google Scholar] [CrossRef]
- Ryan-Ibarra, S.; Sanchez-Vaznaugh, E.V.; Leung, C.; Induni, M. The relationship between food insecurity and overweight/obesity differs by birthplace and length of US residence. Public Health Nutr. 2017, 20, 671–677. [Google Scholar] [CrossRef]
- Fruh, S.M. Obesity: Risk factors, complications, and strategies for sustainable long-term weight management. J. Am. Assoc. Nurse Pract. 2017, 29, S3–S14. [Google Scholar] [CrossRef]
- Cofie, L.E.; Cuevas, A.G. Length of Residency in the United States and Obesity Across Race/Ethnicity. J. Immigr. Minor. Health 2023, 25, 241–245. [Google Scholar] [CrossRef]
- Lee, J.M.; Pilli, S.; Gebremariam, A.; Keirns, C.C.; Davis, M.M.; Vijan, S.; Freed, G.L.; Herman, W.H.; Gurney, J.G. Getting heavier, younger: Trajectories of obesity over the life course. Int. J. Obes. 2010, 34, 614–623. [Google Scholar] [CrossRef]
- Cunningham, S.A.; Hardy, S.T.; Jones, R.; Ng, C.; Kramer, M.R.; Narayan, K.M.V. Changes in the Incidence of Childhood Obesity. Pediatrics 2022, 150, e2021053708. [Google Scholar] [CrossRef]
- Hinkle, S.N.; Sharma, A.J.; Kim, S.Y.; Park, S.; Dalenius, K.; Brindley, P.L.; Grummer-Strawn, L.M. Prepregnancy Obesity Trends among Low-Income Women, United States, 1999–2008. Matern. Child Health J. 2012, 16, 1339–1348. [Google Scholar] [CrossRef]
- Kelley, E.A.; Bowie, J.V.; Griffith, D.M.; Bruce, M.; Hill, S.; Thorpe, R.J. Geography, Race/Ethnicity, and Obesity among Men in the United States. Am. J. Mens Health 2016, 10, 228–236. [Google Scholar] [CrossRef]
- Ogden, C.L.; Fakhouri, T.H.; Carroll, M.D.; Hales, C.M.; Fryar, C.D.; Li, X.; Freedman, D.S. Prevalence of Obesity among Adults, by Household Income and Education—United States, 2011–2014. MMWR Morb. Mortal. Wkly. Rep. 2017, 66, 1369–1373. [Google Scholar] [CrossRef]
- Heo, J.; Beck, A.N.; Lin, S.; Marcelli, E.; Lindsay, S.; Karl Finch, B. Cohort-based income gradients in obesity among U.S. adults. Am. J. Hum. Biol. 2018, 30, e23084. [Google Scholar] [CrossRef]
- Min, J.; Goodale, H.; Xue, H.; Brey, R.; Wang, Y. Racial-Ethnic Disparities in Obesity and Biological, Behavioral, and Sociocultural Influences in the United States: A Systematic Review. Adv. Nutr. 2021, 12, 1137–1148. [Google Scholar] [CrossRef]
- Yang, L.; Colditz, G.A. Prevalence of Overweight and Obesity in the United States, 2007–2012. JAMA Intern. Med. 2015, 175, 1412. [Google Scholar] [CrossRef] [PubMed]
- Wang, L.; Southerland, J.; Wang, K.; Bailey, B.A.; Alamian, A.; Stevens, M.A.; Wang, Y. Ethnic Differences in Risk Factors for Obesity among Adults in California, the United States. J. Obes. 2017, 2017, 2427483. [Google Scholar] [CrossRef] [PubMed]
- Krieger, N.; Chen, J.T.; Waterman, P.D.; Kosheleva, A.; Beckfield, J. History, haldanes and health inequities: Exploring phenotypic changes in body size by generation and income level in the US-born White and Black non-Hispanic populations 1959–1962 to 2005–2008. Int. J. Epidemiol. 2013, 42, 281–295. [Google Scholar] [CrossRef]
- Hales, C.M.; Carroll, M.D.; Fryar, C.D.; Ogden, C.L. Prevalence of Obesity and Severe Obesity among Adults: United States, 2017–2018. NCHS Data Brief. 2020. Available online: https://www.cdc.gov/nchs/data/databriefs/db360-h.pdf (accessed on 27 November 2023).
- Ljungvall, Å.; Zimmerman, F.J. Bigger bodies: Long-term trends and disparities in obesity and body-mass index among U.S. adults, 1960–2008. Soc. Sci. Med. 2012, 75, 109–119. [Google Scholar] [CrossRef]
- Sato, M.; Inoue, Y.; Du, J.; Funk, D.C. Access to parks and recreational facilities, physical activity, and health care costs for older adults: Evidence from U.S. counties. J. Leis. Res. 2019, 50, 220–238. [Google Scholar] [CrossRef]
- Rippin, H.L.; Hutchinson, J.; Greenwood, D.C.; Jewell, J.; Breda, J.J.; Martin, A.; Rippin, D.M.; Schindler, K.; Rust, P.; Fagt, S.; et al. Inequalities in education and national income are associated with poorer diet: Pooled analysis of individual participant data across 12 European countries. PLoS ONE 2020, 15, e0232447. [Google Scholar] [CrossRef]
- Maruvada, P.; Leone, V.; Kaplan, L.M.; Chang, E.B. The Human Microbiome and Obesity: Moving beyond Associations. Cell Host Microbe 2017, 22, 589–599. [Google Scholar] [CrossRef]
- St-Onge, M.-P.; Mikic, A.; Pietrolungo, C.E. Effects of Diet on Sleep Quality. Adv. Nutr. 2016, 7, 938–949. [Google Scholar] [CrossRef]
- Hewagalamulage, S.D.; Lee, T.K.; Clarke, I.J.; Henry, B.A. Stress, cortisol, and obesity: A role for cortisol responsiveness in identifying individuals prone to obesity. Domest. Anim. Endocrinol. 2016, 56, S112–S120. [Google Scholar] [CrossRef]
- Tomiyama, A.J. Stress and Obesity. Annu. Rev. Psychol. 2019, 70, 703–718. [Google Scholar] [CrossRef]
- Conrad, Z.; Reinhardt, S.; Boehm, R.; McDowell, A. Higher-diet quality is associated with higher diet costs when eating at home and away from home: National Health and Nutrition Examination Survey, 2005–2016. Public Health Nutr. 2021, 24, 5047–5057. [Google Scholar] [CrossRef]
- Di Angelantonio, E.; Bhupathiraju, S.N.; Wormser, D.; Gao, P.; Kaptoge, S.; De Gonzalez, A.B.; Cairns, B.J.; Huxley, R.; Jackson, C.L.; Joshy, G.; et al. Body-mass index and all-cause mortality: Individual-participant-data meta-analysis of 239 prospective studies in four continents. Lancet 2016, 388, 776–786. [Google Scholar] [CrossRef]
- Leong, K.S.W.; Derraik, J.G.B.; Hofman, P.L.; Cutfield, W.S. Antibiotics, gut microbiome and obesity. Clin. Endocrinol. 2018, 88, 185–200. [Google Scholar] [CrossRef]
- Wright, S.M.; Aronne, L.J. Causes of obesity. Abdom. Radiol. 2012, 37, 730–732. [Google Scholar] [CrossRef]
- Archer, E.; Lavie, C.J. Obesity Subtyping: The Etiology, Prevention, and Management of Acquired versus Inherited Obese Phenotypes. Nutrients 2022, 14, 2286. [Google Scholar] [CrossRef] [PubMed]
- Foubister, C.; Jago, R.; Sharp, S.J.; Van Sluijs, E.M.F. Time spent on social media use and BMI z-score: A cross-sectional explanatory pathway analysis of 10798 14-year-old boys and girls. Pediatr. Obes. 2023, 18, e13017. [Google Scholar] [CrossRef] [PubMed]
| Variable | Estimate | Standard Error | p-Value |
|---|---|---|---|
| Income | |||
| Year (changes over time) | 0.089 | 0.004 | <0.001 |
| Low income (reference) | |||
| High income | 10.938 | 10.200 | 0.284 |
| Interaction | −0.006 | 0.005 | 0.253 |
| Education | |||
| Year | 0.124 | 0.002 | <0.001 |
| Less than high school | 84.951 | 5.521 | <0.001 |
| High school diploma | 7.146 | 6.486 | 0.271 |
| Greater than high school (reference) | |||
| Interaction (less than high school) | −0.042 | 0.003 | <0.001 |
| Interaction (high school diploma) | −0.003 | 0.003 | 0.318 |
| Race/ethnicity | |||
| Year | 0.0956 | 0.002 | <0.001 |
| White (reference) | |||
| Black | −19.424 | 6.342 | 0.002 |
| Hispanic | 33.439 | 9.538 | 0.001 |
| Other | 114.610 | 12.528 | <0.001 |
| Interaction (BBlack) | 0.010 | 0.003 | 0.001 |
| Interaction (Hispanic) | −0.016 | 0.005 | 0.006 |
| Interaction (other) | −0.058 | 0.006 | <0.001 |
Disclaimer/Publisher’s Note: The statements, opinions and data contained in all publications are solely those of the individual author(s) and contributor(s) and not of MDPI and/or the editor(s). MDPI and/or the editor(s) disclaim responsibility for any injury to people or property resulting from any ideas, methods, instructions or products referred to in the content. |
© 2024 by the authors. Licensee MDPI, Basel, Switzerland. This article is an open access article distributed under the terms and conditions of the Creative Commons Attribution (CC BY) license (https://creativecommons.org/licenses/by/4.0/).
Share and Cite
Banas, J.; McDowell Cook, A.; Raygoza-Cortez, K.; Davila, D.; Irwin, M.L.; Ferrucci, L.M.; Humphries, D.L. United States Long-Term Trends in Adult BMI (1959–2018): Unraveling the Roots of the Obesity Epidemic. Int. J. Environ. Res. Public Health 2024, 21, 73. https://doi.org/10.3390/ijerph21010073
Banas J, McDowell Cook A, Raygoza-Cortez K, Davila D, Irwin ML, Ferrucci LM, Humphries DL. United States Long-Term Trends in Adult BMI (1959–2018): Unraveling the Roots of the Obesity Epidemic. International Journal of Environmental Research and Public Health. 2024; 21(1):73. https://doi.org/10.3390/ijerph21010073
Chicago/Turabian StyleBanas, Julia, Acree McDowell Cook, Karina Raygoza-Cortez, Daniel Davila, Melinda L. Irwin, Leah M. Ferrucci, and Debbie L. Humphries. 2024. "United States Long-Term Trends in Adult BMI (1959–2018): Unraveling the Roots of the Obesity Epidemic" International Journal of Environmental Research and Public Health 21, no. 1: 73. https://doi.org/10.3390/ijerph21010073
APA StyleBanas, J., McDowell Cook, A., Raygoza-Cortez, K., Davila, D., Irwin, M. L., Ferrucci, L. M., & Humphries, D. L. (2024). United States Long-Term Trends in Adult BMI (1959–2018): Unraveling the Roots of the Obesity Epidemic. International Journal of Environmental Research and Public Health, 21(1), 73. https://doi.org/10.3390/ijerph21010073


