
Revisiting Factors Influencing Under-Five Mortality in India: The Application of a Generalised Additive Cox Proportional Hazards Model

Abstract
1. Introduction
2. Materials and Methods
2.1. Data and Sample Design
2.2. Outcome Variable
2.3. Explanatory Variables
2.4. Statistical Analysis
3. Results
4. Discussion
5. Conclusions
Supplementary Materials
Author Contributions
Funding
Institutional Review Board Statement
Informed Consent Statement
Data Availability Statement
Conflicts of Interest
References
- World Health Organization Newborn Mortality. Available online: https://www.who.int/news-room/fact-sheets/detail/levels-and-trends-in-child-mortality-report-2021 (accessed on 10 April 2024).
- Dicker, D.; Nguyen, G.; Abate, D.; Abate, K.H.; Abay, S.M.; Abbafati, C.; Abbasi, N.; Abbastabar, H.; Abd-Allah, F.; Abdela, J.; et al. Global, Regional, and National Age-Sex-Specific Mortality and Life Expectancy, 1950–2017: A Systematic Analysis for the Global Burden of Disease Study 2017. Lancet 2018, 392, 1684–1735. [Google Scholar] [CrossRef] [PubMed]
- International Institute for Population Sciences (IIPS). National Family Health Survey (NFHS-5). Available online: https://dhsprogram.com/pubs/pdf/FR375/FR375.pdf (accessed on 27 August 2024).
- Chao, F.; You, D.; Pedersen, J.; Hug, L.; Alkema, L. National and Regional Under-5 Mortality Rate by Economic Status for Low-Income and Middle-Income Countries: A Systematic Assessment. Lancet Glob. Health 2018, 6, e535–e547. [Google Scholar] [CrossRef] [PubMed]
- Finlay, J.E.; Özaltin, E.; Canning, D. The Association of Maternal Age with Infant Mortality, Child Anthropometric Failure, Diarrhoea and Anaemia for First Births: Evidence from 55 Low- and Middle-Income Countries. BMJ Open 2011, 1, e000226. [Google Scholar] [CrossRef] [PubMed]
- Meitei, W.B.; Singh, A.; Ladusingh, L. The Effects of Community Clustering on Under-Five Mortality in India: A Parametric Shared Frailty Modelling Approach. Genus 2022, 78, 18. [Google Scholar] [CrossRef]
- Mandal, S.; Paul, P.; Chouhan, P. Impact of Maternal Education on Under-Five Mortality of Children in India: Insights from the National Family Health Survey, 2005–2006 and 2015–2016. Death Stud. 2021, 45, 788–794. [Google Scholar] [CrossRef]
- Moradhvaj; Samir, K.C. Differential Impact of Maternal Education on Under-Five Mortality in Rural and Urban India. Health Place 2023, 80, 102987. [Google Scholar] [CrossRef]
- Ganguly, D.; Goli, S.; Rammohan, A. Explaining the Diminishing of Muslim Advantage in Child Survival in India. Genus 2022, 78, 29. [Google Scholar] [CrossRef]
- Houle, B.; Kabudula, C.; Gareta, D.; Herbst, K.; Clark, S.J. Household Structure, Composition and Child Mortality in the Unfolding Antiretroviral Therapy Era in Rural South Africa: Comparative Evidence from Population Surveillance, 2000–2015. BMJ Open 2023, 13, e070388. [Google Scholar] [CrossRef]
- Naz, S.; Page, A.; Agho, K.E. Household Air Pollution and Under-Five Mortality in India (1992–2006). Environ. Health 2016, 15, 54. [Google Scholar] [CrossRef]
- Kumar, S.; Sahu, D.; Chauhan, N. Factors Associated with Under-Five Mortality: A Comparison between Empowered Action Group (EAG) and Non-EAG States of India. Health 2021, 13, 1190–1205. [Google Scholar] [CrossRef]
- Kumar, C.; Piyasa; Saikia, N. An Update on Explaining the Rural-Urban Gap in under-Five Mortality in India. BMC Public Health 2022, 22, 2093. [Google Scholar] [CrossRef] [PubMed]
- Alam, M.Z.; Islam, M.S. Is There Any Association between Undesired Children and Health Status of Under-Five Children? Analysis of a Nationally Representative Sample from Bangladesh. BMC Pediatr. 2022, 22, 445. [Google Scholar] [CrossRef] [PubMed]
- Lee, H.Y.; Leslie, H.H.; Oh, J.; Kim, R.; Kumar, A.; Subramanian, S.V.; Kruk, M.E. The Association between Institutional Delivery and Neonatal Mortality Based on the Quality of Maternal and Newborn Health System in India. Sci. Rep. 2022, 12, 6220. [Google Scholar] [CrossRef]
- Andriani, H.; Putri, S.; Kosasih, R.I.; Kuo, H.W. Parental Smoking and Under-Five Child Mortality in Southeast Asia: Evidence from Demographic and Health Surveys. Int. J. Environ. Res. Public Health 2019, 16, 4756. [Google Scholar] [CrossRef]
- Patel, P.; Kumar, K.; Singh, M.; Kumar Yadav, A. Sex Differentials in under Five Mortality in India in Last Two Decades: Evidence from Pooled NFHS Data. Child Youth Serv. Rev. 2020, 118, 105286. [Google Scholar] [CrossRef]
- Patel, N.; Olickal, J.J. Maternal and Child Factors of Under-Five Mortality in India. Findings from NFHS-4. Clin. Epidemiol. Glob. Health 2021, 12, 100866. [Google Scholar] [CrossRef]
- Rahman, M.A.; Khan, M.N.; Rahman, M.M. Maternal Anaemia and Risk of Adverse Obstetric and Neonatal Outcomes in South Asian Countries: A Systematic Review and Meta-Analysis. Public Health Pract. 2020, 1, 100021. [Google Scholar] [CrossRef]
- Perin, J.; Mulick, A.; Yeung, D.; Villavicencio, F.; Lopez, G.; Strong, K.L.; Prieto-Merino, D.; Cousens, S.; Black, R.E.; Liu, L. Global, Regional, and National Causes of under-5 Mortality in 2000–2019: An Updated Systematic Analysis with Implications for the Sustainable Development Goals. Lancet Child Adolesc. Health 2022, 6, 106–115. [Google Scholar] [CrossRef]
- Bender, A.; Groll, A.; Scheipl, F. A Generalized Additive Model Approach to Time-to-Event Analysis. Stat. Model. 2018, 18, 299–321. [Google Scholar] [CrossRef]
- Data Quality Assurance and Quality Control Mechanism 2019-20. National Family Health Survey (NFHS-5). Available online: https://nfhs.in/nfhsuser/assets/pdf/NFHS%20data%20quality%20assurance.pdf (accessed on 27 August 2024).
- Collett, D. Modelling Survival Data in Medical Research; Chapman and Hall/CRC: New York, NY, USA, 2023; ISBN 1003282520. [Google Scholar]
- Hastie, T.; Tibshirani, R. Generalized Additive Models. Stat. Sci. 1986, 1, 297–310. [Google Scholar] [CrossRef]
- Marx, B.D.; Eilers, P.H.C. Direct Generalized Additive Modeling with Penalized Likelihood. Comput. Stat. Data Anal. 1998, 28, 193–209. [Google Scholar] [CrossRef]
- Wood, S.N. Generalized Additive Models: An Introduction with R; Chapman and Hall/CRC: Boca Raton, FL, USA, 2006. [Google Scholar]
- Wood, S.N.; Pya, N.; Säfken, B. Smoothing Parameter and Model Selection for General Smooth Models. J. Am. Stat. Assoc. 2016, 111, 1548–1563. [Google Scholar] [CrossRef]
- Ohuma, E.O.; Moller, A.-B.; Bradley, E.; Chakwera, S.; Hussain-Alkhateeb, L.; Lewin, A.; Okwaraji, Y.B.; Mahanani, W.R.; Johansson, E.W.; Lavin, T. National, Regional, and Global Estimates of Preterm Birth in 2020, with Trends from 2010: A Systematic Analysis. Lancet 2023, 402, 1261–1271. [Google Scholar] [CrossRef]
- Davies, E.L.; Bell, J.S.; Bhattacharya, S. Preeclampsia and Preterm Delivery: A Population-Based Case–Control Study. Hypertens Pregnancy 2016, 35, 510–519. [Google Scholar] [CrossRef] [PubMed]
- Pillai, A.A.; Fazal, S.; Mukkamalla, S.K.R.; Babiker, H.M. Polycythemia. In StatPearls [Internet]; StatPearls Publishing: Treasure Island, FL, USA, 2024. Available online: https://www.ncbi.nlm.nih.gov/books/NBK526081/ (accessed on 27 August 2024).
- Jaiswal, A.K.; Alagarajan, M.; Meitei, W.B. Survival among Children Under-Five in India: A Parametric Multilevel Survival Approach. BMC Public Health 2024, 24, 991. [Google Scholar] [CrossRef]
- Saroj, R.K.; Yadav, P.K.; Singh, R.; Chilyabanyama, O.N. Machine Learning Algorithms for Understanding the Determinants of Under-Five Mortality. BioData Min. 2022, 15, 20. [Google Scholar] [CrossRef]
- Srivastava, S.; Fledderjohann, J.; Upadhyay, A.K. Explaining Socioeconomic Inequalities in Immunisation Coverage in India: New Insights from the Fourth National Family Health Survey (2015–2016). BMC Pediatr. 2020, 20, 295. [Google Scholar] [CrossRef]
- Sinha, S.; Sc, M.; Indian, F. Europe PMC Funders Group Association between Maternal Age at Childbirth and Perinatal and Under-Five Mortality in a Prospective Birth Cohort from Delhi. Eur. PMC Author Manuscrips 2017, 53, 871–877. [Google Scholar]
- Mishra, S.K.; Ram, B.; Singh, A.; Yadav, A. Birth order, stage of infancy and infant mortality in India. J. Biosoc. Sci. 2018, 50, 604–625. [Google Scholar] [CrossRef]
- Alexander, M.; Alkema, L. Global Estimation of Neonatal Mortality Using a Bayesian Hierarchical Splines Regression Model. Demogr. Res. 2018, 38, 335–372. [Google Scholar] [CrossRef]


| Variables | Frequency | Weighted Percentage |
|---|---|---|
| Child survival status | ||
| Alive | 205,657 | 96.26 |
| Death | 7955 | 3.74 |
| Place of residence | ||
| Urban | 42,761 | 26.25 |
| Rural | 170,851 | 73.75 |
| Wealth score $ | −156,481 (−924,340, 651,000) | |
| Religion | ||
| Hindu | 156,265 | 79.59 |
| Others | 57,347 | 20.41 |
| Type of household | ||
| Nuclear | 83,135 | 37.21 |
| Non-Nuclear | 130,477 | 62.79 |
| Type of cooking fuel | ||
| No Smoke | 95,933 | 50.05 |
| Smoke | 117,679 | 49.95 |
| Mother’s age (in years) $ | 27 (24, 30) | |
| Mother’s education (in years) $ | 8 (3, 11) | |
| Haemoglobin level (gm/dL) $ | 11.5 (10.5, 12.5) | |
| Birth order | ||
| One | 70,460 | 33.81 |
| Two | 79,801 | 38.04 |
| Three or more | 63,351 | 28.15 |
| Caesarean section | ||
| No | 173,413 | 78.87 |
| Yes | 40,199 | 21.13 |
| Length of pregnancy (in months) | ||
| More than 9 months | 187,147 | 87.21 |
| Less than 9 months | 26,465 | 12.79 |
| Wanted pregnancy | ||
| Yes | 199,110 | 92.77 |
| Later/No | 14,502 | 7.23 |
| Place of delivery | ||
| Institution | 184,044 | 88.64 |
| Home | 29,568 | 11.36 |
| Mother consumes tobacco? | ||
| No | 199,280 | 96.56 |
| Yes | 14,332 | 3.44 |
| Sex of child | ||
| Male | 110,603 | 51.87 |
| Female | 103,009 | 48.13 |
| Total | 213,612 | 100 |
| Variables | Frequency | Weighted Percentage | Frequency | Weighted Percentage |
|---|---|---|---|---|
| Survival | Deceased | |||
| Place of Residence | ||||
| Urban | 41,554 | 96.01 | 1207 | 3.99 |
| Rural | 164,103 | 96.53 | 6748 | 3.47 |
| Wealth Score $ | −142,360 (−912,320, 663,199) | −509,630 (−1,146,890, 278,940) | ||
| Religion | ||||
| Hindu | 150,120 | 96.18 | 6145 | 3.82 |
| Others | 55,537 | 96.58 | 1810 | 3.42 |
| Type of Household | ||||
| Nuclear | 79,861 | 95.89 | 3274 | 4.11 |
| Non-Nuclear | 125,796 | 96.48 | 4681 | 3.52 |
| Type of cooking fuel | ||||
| No Smoke | 93,165 | 97.09 | 2768 | 2.91 |
| Smoke | 112,492 | 95.43 | 5187 | 4.57 |
| Mother’s age (in years) $ | 27 (24, 30) | 26 (23, 30) | ||
| Mother’s education (in years) $ | 8 (3, 11) | 7 (0, 10) | ||
| Haemoglobin level (gm/dL) $ | 11.5 (10.5, 12.5) | 11.3 (10.3, 12.3) | ||
| Birth order | ||||
| One | 76,860 | 96.35 | 2941 | 3.65 |
| Two | 68,302 | 97.03 | 2158 | 2.97 |
| Three or more | 60,495 | 95.22 | 2856 | 4.78 |
| Caesarean Section | ||||
| No | 166,578 | 95.98 | 6835 | 4.02 |
| Yes | 39,079 | 97.29 | 1120 | 2.71 |
| Length of pregnancy (in months) | ||||
| More than 9 months | 181,311 | 96.87 | 5836 | 3.13 |
| Less than 9 months | 24,346 | 92.08 | 2119 | 7.92 |
| Wanted Pregnancy | ||||
| Yes | 191,877 | 96.34 | 7233 | 3.66 |
| Later/No | 13,780 | 95.19 | 722 | 4.81 |
| Place of delivery | ||||
| Institution | 177,644 | 96.51 | 6400 | 3.49 |
| Home | 28,013 | 94.28 | 1555 | 5.72 |
| Mother consumes tobacco? | ||||
| No | 191,973 | 96.31 | 7307 | 3.69 |
| Yes | 13,684 | 94.83 | 648 | 5.17 |
| Sex of child | ||||
| Male | 106,191 | 96.01 | 4412 | 3.99 |
| Female | 99,466 | 96.53 | 3543 | 3.47 |
| Total | 205,657 | 7955 | ||
| Variables | Unadjusted HR (95% CI) | p-Value | Adjusted HR (95% CI) | p-Value |
|---|---|---|---|---|
| Place of Residence | ||||
| Urban | Ref. | Ref. | ||
| Rural | 1.41 (1.326, 1.499) | <0.001 | 0.974 (0.909, 1.044) | 0.4565 |
| Religion | ||||
| Hindu | Ref. | Ref. | ||
| Others | 0.799 (0.759, 0.842) | <0.001 | 0.778 (0.737, 0.821) | <0.001 |
| Type of Household | ||||
| Nuclear | Ref. | Ref. | ||
| Non-Nuclear | 0.928 (0.888, 0.971) | 0.0011 | 1.049 (0.999, 1.101) | 0.0565 |
| Type of cooking fuel | ||||
| No Smoke | Ref. | Ref. | ||
| Smoke | 1.538 (1.469, 1.611) | <0.001 | 1.075 (1.013, 1.141) | 0.0165 |
| Birth order | ||||
| One | Ref. | Ref. | ||
| Two | 0.828 (0.783, 0.875) | <0.001 | 0.817 (0.77, 0.867) | <0.001 |
| Three or more | 1.222 (1.161, 1.287) | <0.001 | 1.015 (0.948, 1.086) | 0.6738 |
| Caesarean Section | ||||
| No | Ref. | Ref. | ||
| Yes | 0.71 (0.666, 0.756) | <0.001 | 0.976 (0.912, 1.044) | 0.4771 |
| Length of pregnancy (in months) | ||||
| More than 9 months | Ref. | Ref. | ||
| Less than 9 months | 2.614 (2.487, 2.747) | <0.001 | 2.621 (2.494, 2.755) | <0.001 |
| Wanted Pregnancy | ||||
| Yes | Ref. | Ref. | ||
| Later/No | 1.393 (1.29, 1.503) | <0.001 | 1.274 (1.179, 1.376) | <0.001 |
| Place pf delivery | ||||
| Institution | Ref. | Ref. | ||
| Home | 1.502 (1.421, 1.588) | <0.001 | 1.216 (1.146, 1.291) | <0.001 |
| Mother consumes tobacco? | ||||
| No | Ref. | Ref. | ||
| Yes | 1.224 (1.13, 1.326) | <0.001 | 1.108 (1.02, 1.204) | 0.0156 |
| Sex of child | ||||
| Male | Ref. | Ref. | ||
| Female | 0.861 (0.824, 0.9) | <0.001 | 0.855 (0.818, 0.893) | <0.001 |
| Smooth Terms | Wealth Score | Mother’s Age | Mother’s Education | Mother’s Haemoglobin | |
|---|---|---|---|---|---|
| Unadjusted | EDF ^ | 3.044 | 4.435 | 5.452 | 3.915 |
| RDF $ | 3.83 | 5.424 | 6.466 | 4.836 | |
| -values | 629.5 | 126.2 | 639.6 | 121.6 | |
| -values | <0.001 | <0.001 | <0.001 | <0.001 | |
| Deviance Explained | 1.16% | 0.15% | 1.24% | 0.20% | |
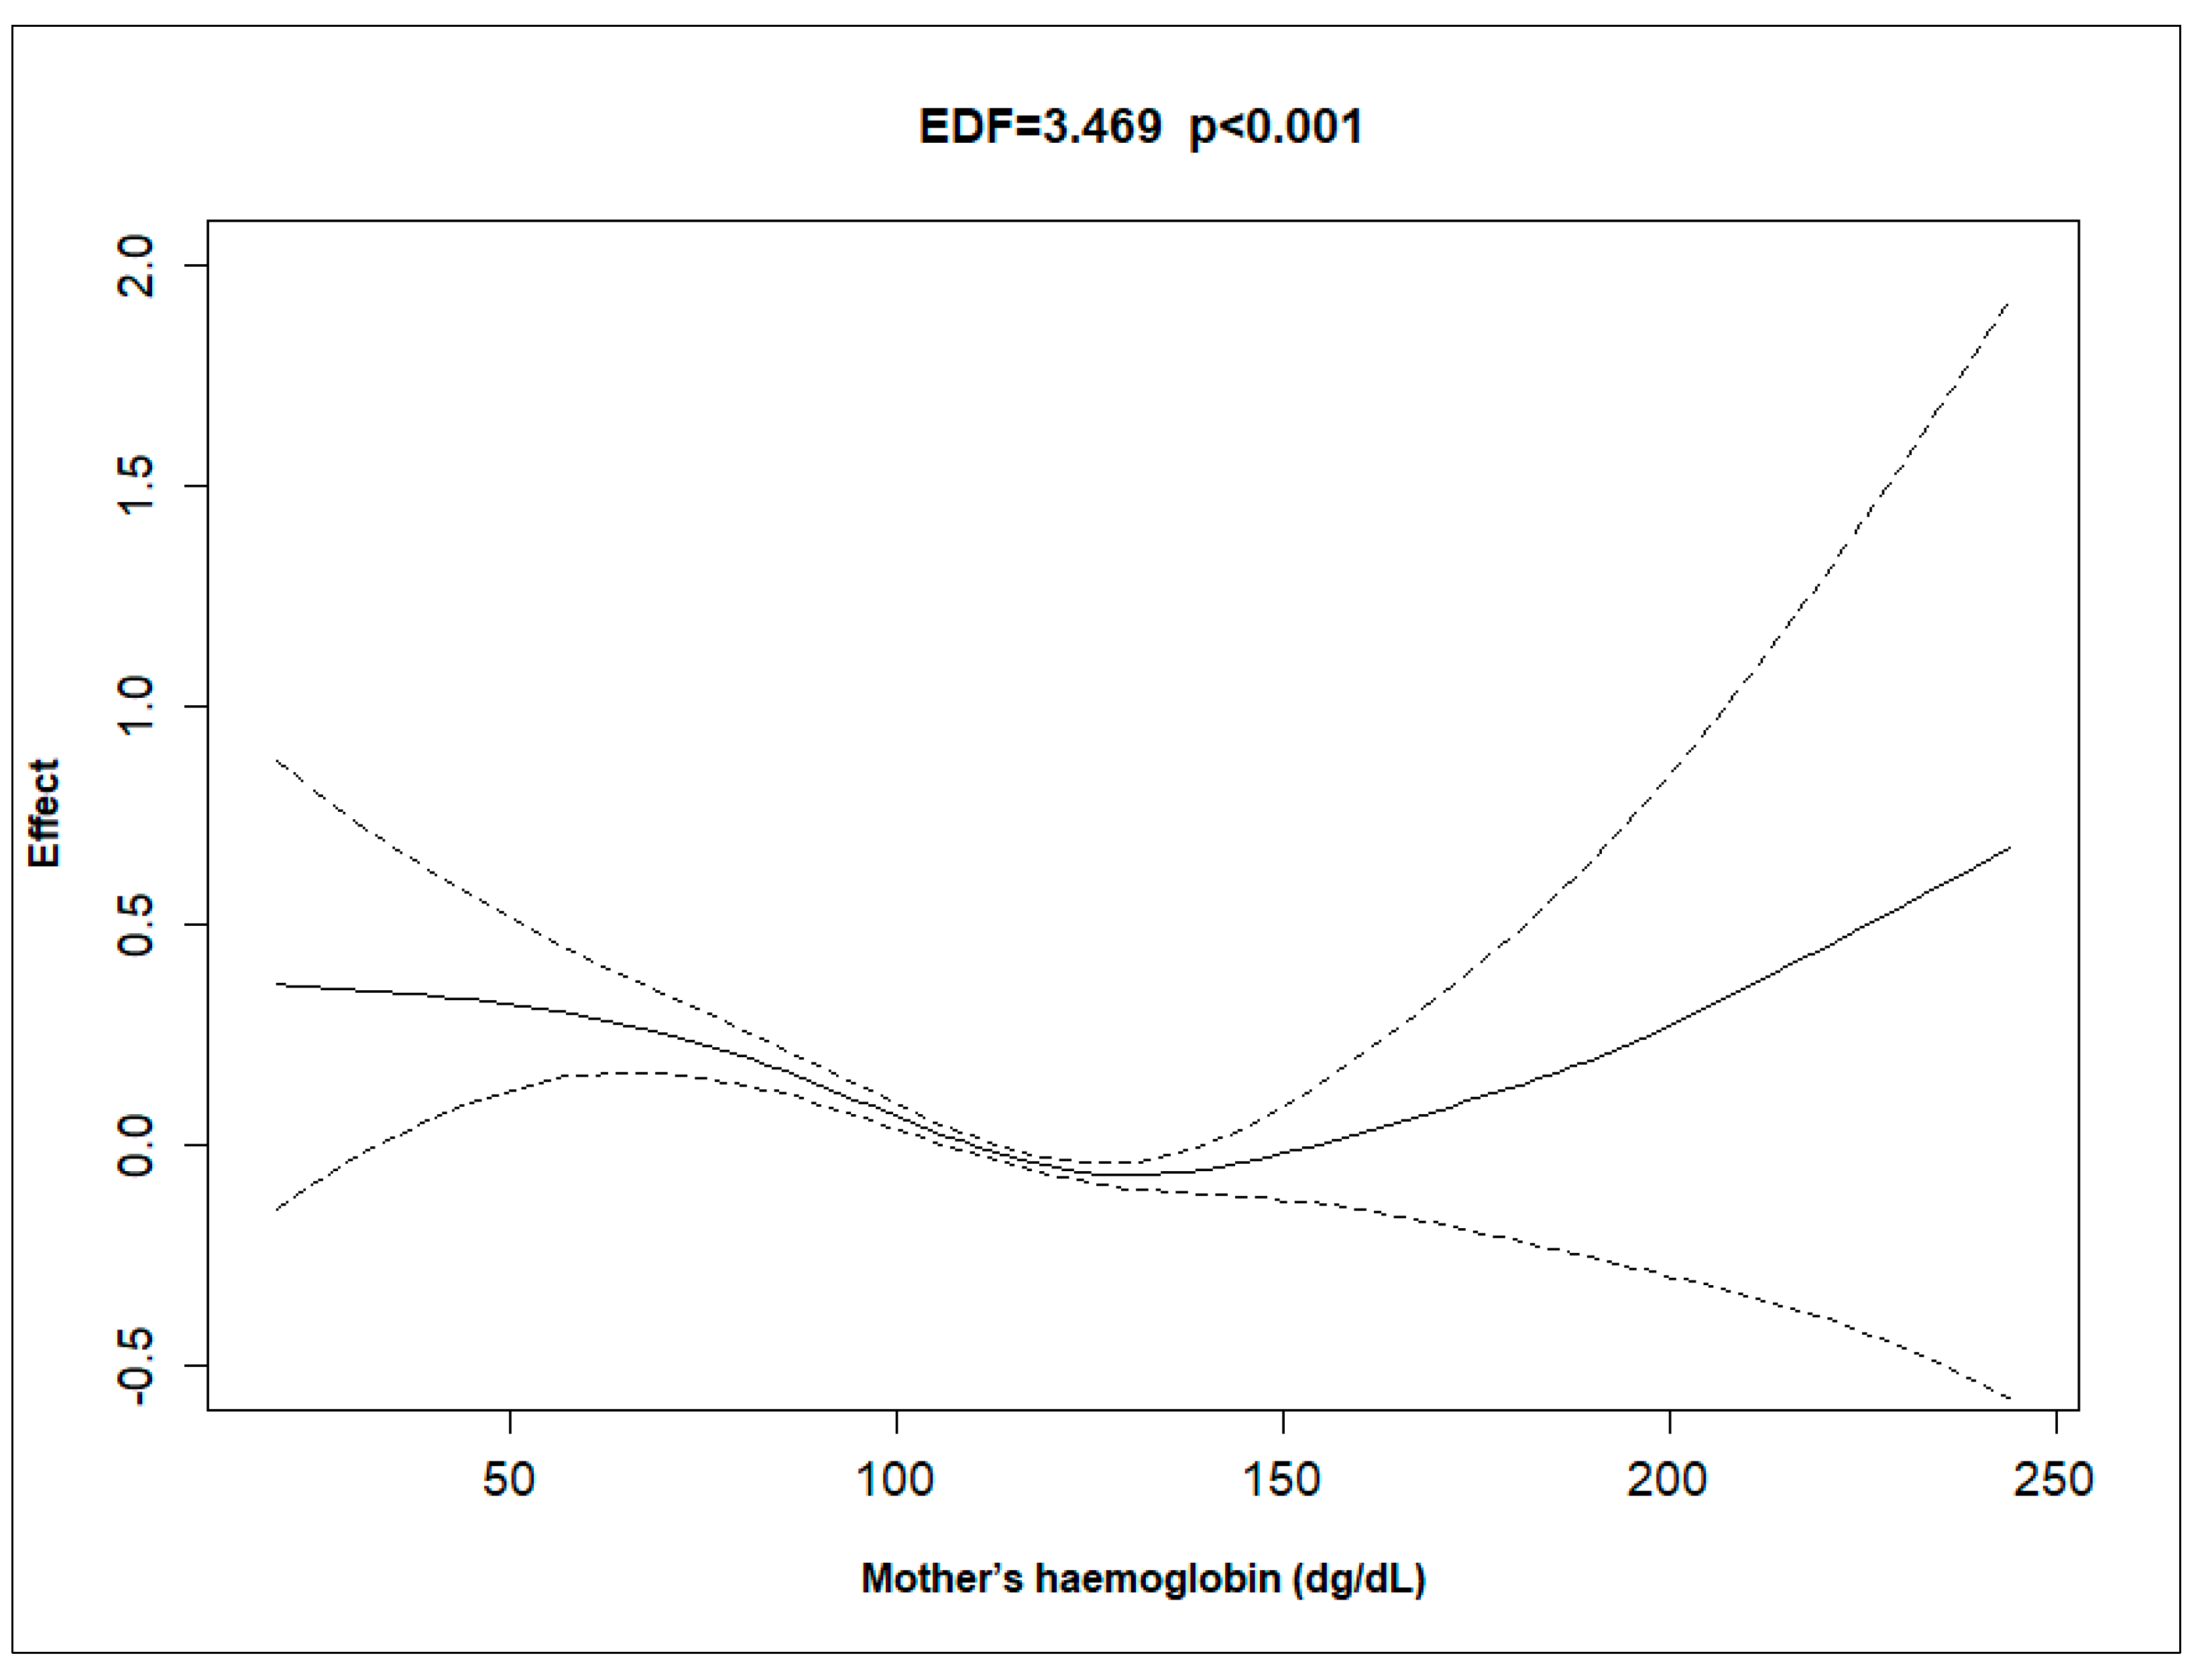
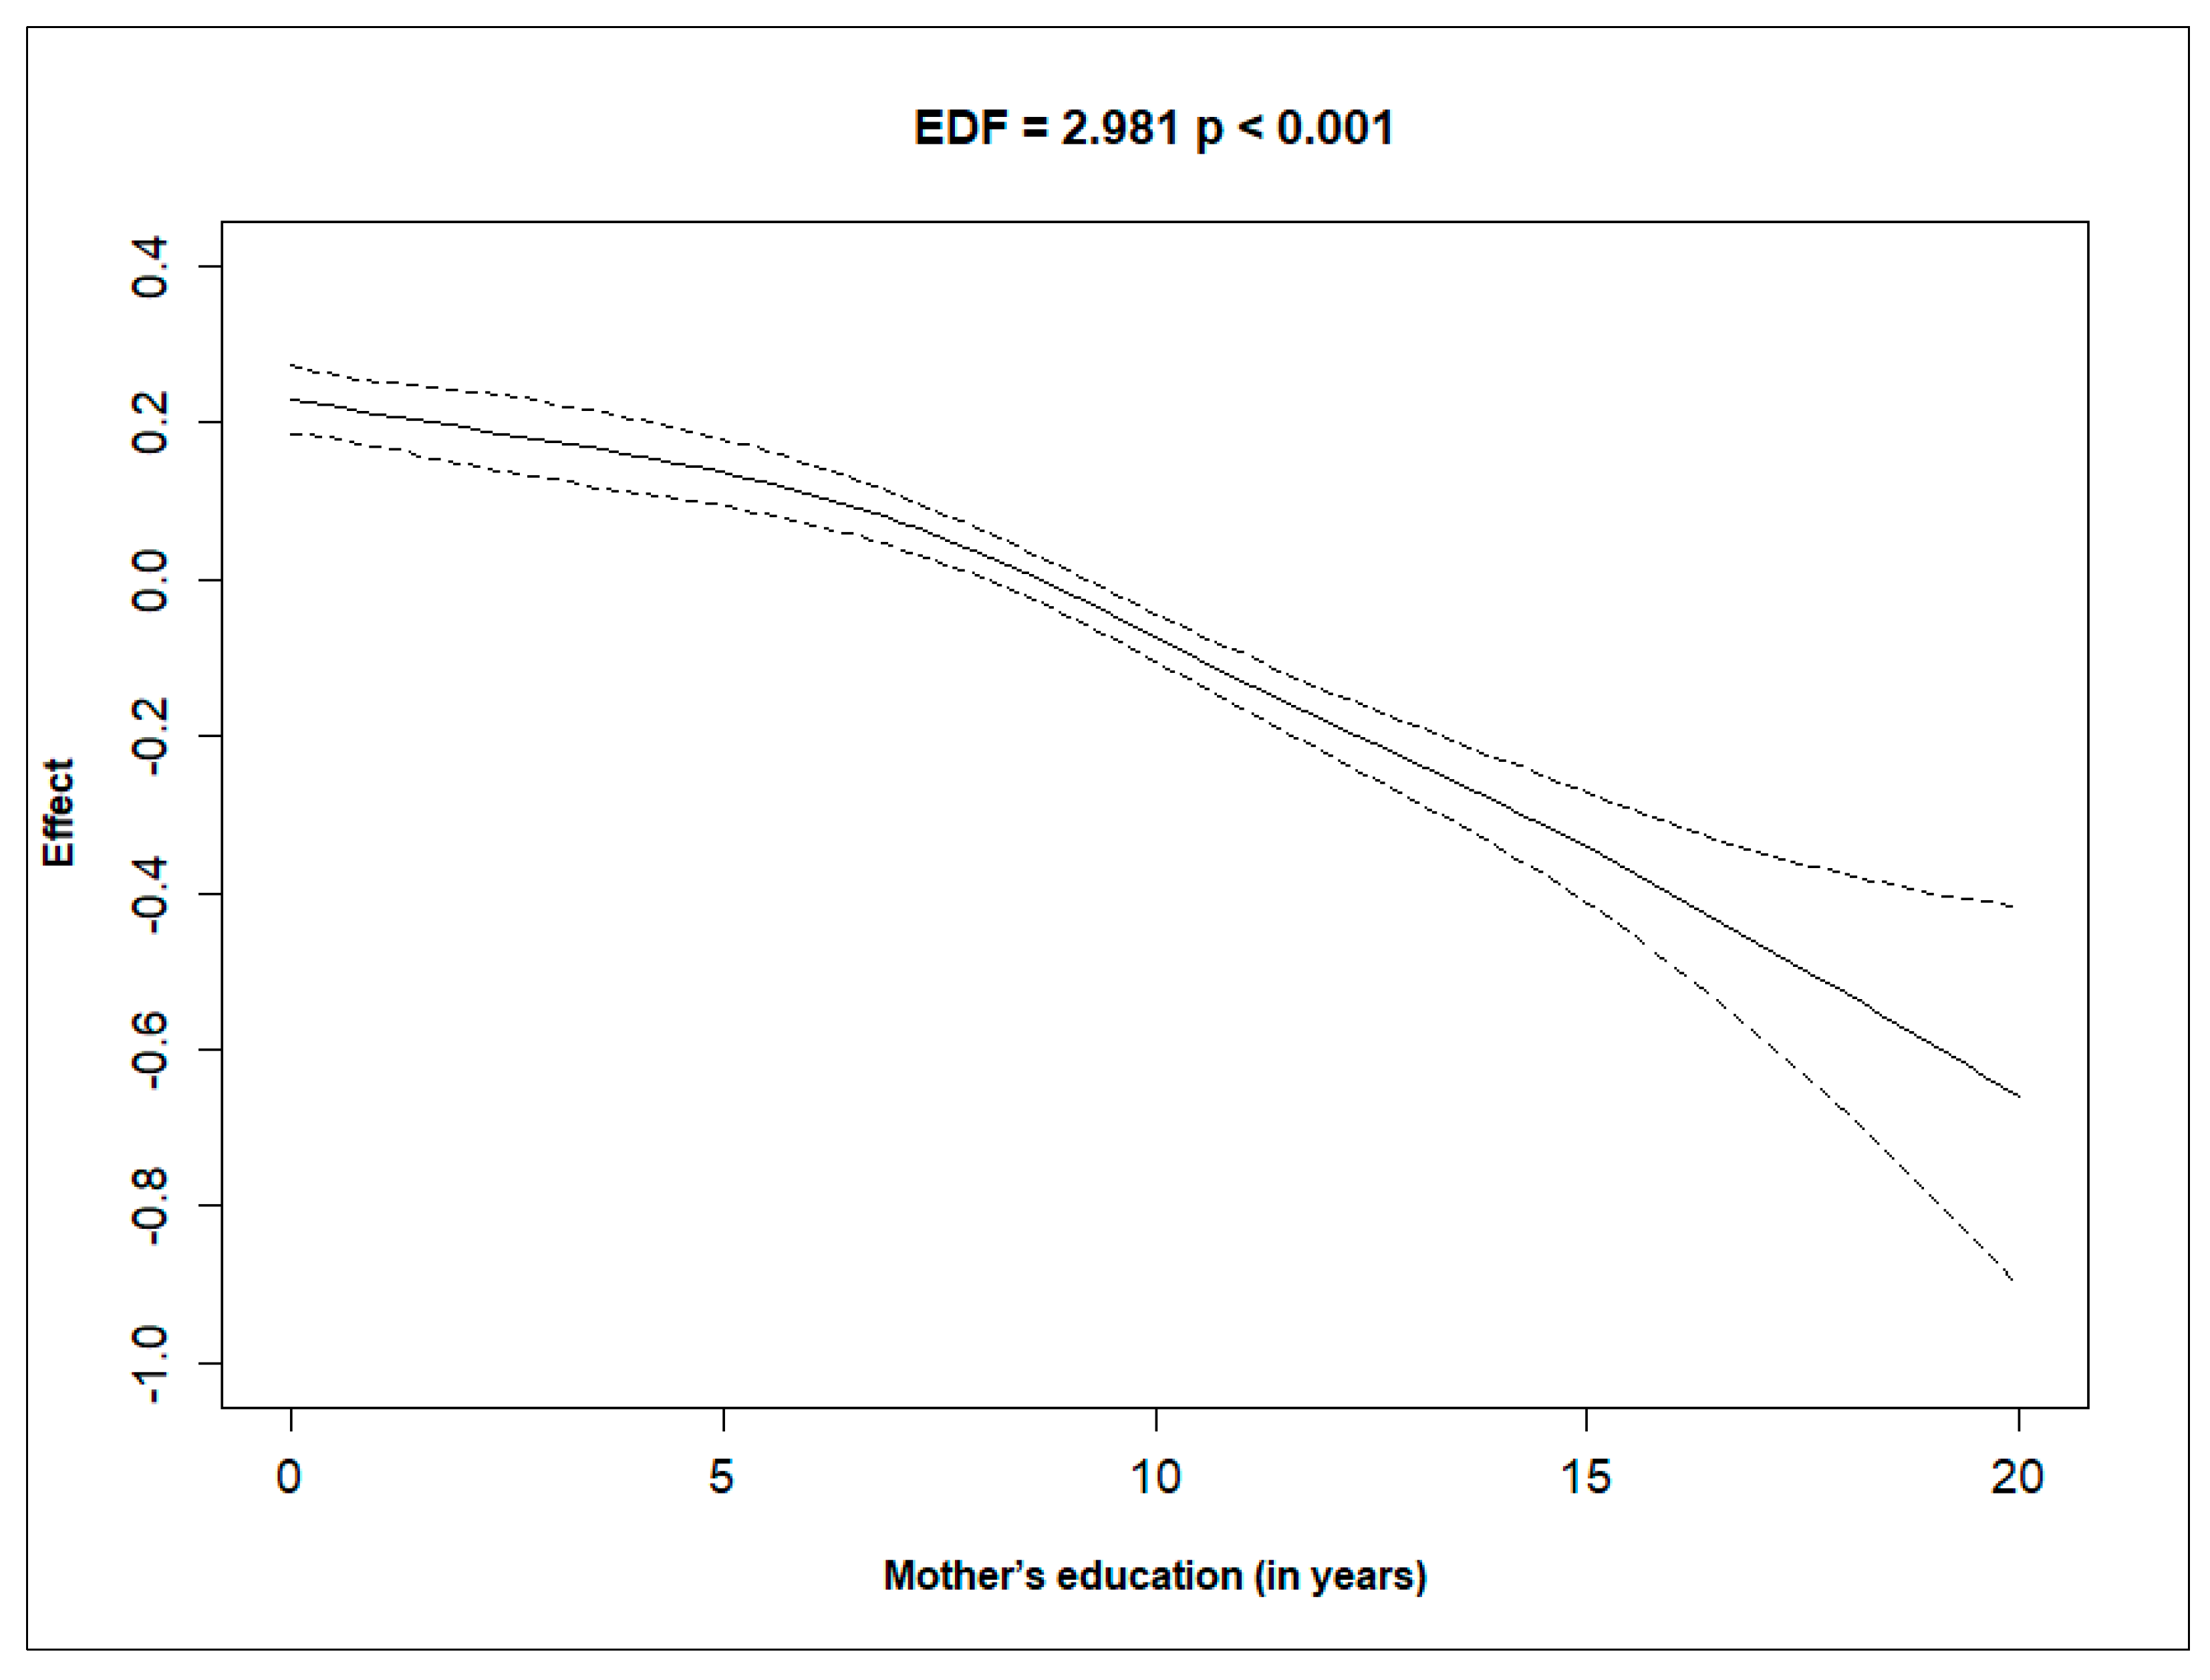
| Adjusted | EDF ^ | 2.503 | 3.68 | 2.981 | 3.469 |
| RDF $ | 3.173 | 4.581 | 3.662 | 4.352 | |
| -values | 61.36 | 44.6 | 159.47 | 55.36 | |
| -values | <0.001 | <0.001 | <0.001 | <0.001 | |
| Deviance Explained | 4.29% | ||||
Disclaimer/Publisher’s Note: The statements, opinions and data contained in all publications are solely those of the individual author(s) and contributor(s) and not of MDPI and/or the editor(s). MDPI and/or the editor(s) disclaim responsibility for any injury to people or property resulting from any ideas, methods, instructions or products referred to in the content. |
© 2024 by the authors. Licensee MDPI, Basel, Switzerland. This article is an open access article distributed under the terms and conditions of the Creative Commons Attribution (CC BY) license (https://creativecommons.org/licenses/by/4.0/).
Share and Cite
Khan, M.A.; Das, S.K. Revisiting Factors Influencing Under-Five Mortality in India: The Application of a Generalised Additive Cox Proportional Hazards Model. Int. J. Environ. Res. Public Health 2024, 21, 1303. https://doi.org/10.3390/ijerph21101303
Khan MA, Das SK. Revisiting Factors Influencing Under-Five Mortality in India: The Application of a Generalised Additive Cox Proportional Hazards Model. International Journal of Environmental Research and Public Health. 2024; 21(10):1303. https://doi.org/10.3390/ijerph21101303
Chicago/Turabian StyleKhan, Maroof Ahmad, and Sumit Kumar Das. 2024. "Revisiting Factors Influencing Under-Five Mortality in India: The Application of a Generalised Additive Cox Proportional Hazards Model" International Journal of Environmental Research and Public Health 21, no. 10: 1303. https://doi.org/10.3390/ijerph21101303
APA StyleKhan, M. A., & Das, S. K. (2024). Revisiting Factors Influencing Under-Five Mortality in India: The Application of a Generalised Additive Cox Proportional Hazards Model. International Journal of Environmental Research and Public Health, 21(10), 1303. https://doi.org/10.3390/ijerph21101303