Abstract
With the increase in insured patients and an aging population, managing the length of stay (LOS) for inpatients has become crucial for controlling medical costs. Analyzing the factors influencing LOS is necessary for effective management. Previous studies often used multiple or logistic regression analyses, which have limitations such as unmet assumptions and the inability to handle time-dependent variables. To address these issues, this study applied survival analysis to examine the factors affecting LOS using the National Health Insurance Service (NHIS) sample cohort data from 2016 to 2019, covering over 4 million records. We used Kaplan–Meier survival estimation to assess LOS probabilities based on sociodemographic, patient, health checkup, and institutional characteristics. Additionally, the Cox proportional hazards model controlled for confounding factors, providing more robust validation. Key findings include the influence of age, gender, type of insurance, and hospital type on LOS. For instance, older patients and medical aid recipients had longer LOS, while general hospitals showed shorter stays. This study is the first in Korea to use survival analysis with a large cohort database to identify LOS determinants. The results provide valuable insights for shaping healthcare policies aimed at optimizing inpatient care and managing hospital resources more efficiently.
1. Introduction
With the surge in insured patients and an aging population, the sustainability of expanding medical coverage has become a pressing concern. Vulnerable groups, including medically insured patients, the homeless, and refugees, often experience extended hospital stays due to the lack of family support, limited access to medical services, and financial constraints. These factors impact the length of stay (LOS) in hospitals, making its rational management beneficial for both patients and healthcare institutions.
From an institutional perspective, reducing the LOS can improve the turnover rate of hospital beds, allowing for a greater influx of new patients and increasing revenue. From a patient perspective, timely discharge following acute treatment promotes recovery through outpatient care, helping to reduce medical expenses. Therefore, effectively managing the LOS through a careful analysis of the factors influencing it is essential for optimizing healthcare delivery.
Previous studies have applied various methodologies, such as multiple regression, logistic regression, and machine learning, to identify determinants affecting the LOS [1,2,3,4], and to predict LOS [5,6,7,8,9,10,11]. However, these approaches often fail to account for censored data or the survival period of inpatients. For instance, multiple regression models do not consider the censored nature of the data despite time being a dependent variable, and logistic regression models overlook the survival period, despite survival being directly linked to the outcome. To address these limitations, it is crucial to consider both the censored data and the survival period of inpatients when analyzing the determinants of LOS.
The aim of this study is to identify key factors influencing the LOS for inpatients, taking into account the censored nature of the data and the survival period. We employ survival analysis techniques to achieve this goal. Specifically, we use Kaplan–Meier survival estimation to analyze the trend of rehospitalization probability over time, and the Cox proportional hazards model to compare factors affecting the probability of discharge.
Referring to variables used in existing studies, we selected factors from the cohort database provided by the National Health Insurance Service (NHIS) of Korea. Data analysis was performed using the R statistical program (version 3.7.6) in the NHIS virtual environment. Based on the findings, healthcare institutions can improve resource management and reduce unnecessary expenses by optimizing LOS management.
2. Research Background
2.1. Length of Stay (LOS) Analysis
Length of stay (LOS), the period during which inpatients are hospitalized, is a key indicator for the efficient management of medical institutions and the reduction in patients’ medical expenses. In Korea, the average LOS decreased from 19.1 days in 2018 to 17.9 days in 2019, but increased back to 19.1 days in 2020. Notably, as of 2020, the average LOS in Korea is 10.8 days longer than the OECD average of 8.3 days.
Previous studies have investigated the determinants of LOS, as summarized in Table 1. Most of these studies utilized multiple regression analysis, considering socio-demographic, disease, and institutional characteristics as independent variables to examine LOS.

Table 1.
Previous literature on determinants of LOS.
As such, most prior studies analyzing the determinants of LOS have focused on subjects from specific groups or disease categories. However, although data regarding LOS are considered count data, these studies have limitations as they do not account for this aspect. Therefore, this study aims to scrutinize the determinants affecting inpatients’ LOS using survival analysis for count data.
2.2. Survival Analysis
Survival analysis is a method widely used in biology and medicine, which utilizes censored data containing information such as patients’ survival and death and assesses differences in the elapsed time to an event of interest [14,15,16]. Here, censored data refer to data where the occurrence of an event is unknown from the beginning of the study to its end. Since survival analysis is a statistical approach that estimates the time between two events of interest, it differs explicitly from other approaches such as regression and logistic regression, as demonstrated in Table 2. While regression considers time as a dependent variable, it is limited by its inability to account for censored data. On the other hand, logistic regression can only include an event, such as whether one has died or been hospitalized, as a dependent variable, but it cannot consider time in its analysis.
Table 2.
Comparison of methodologies used in survival analysis.
In fact, survival analysis can be conducted using three types of methods: non-parametric, semi-parametric, and parametric methods. First, a non-parametric method does not require an assumption that the data follow a specific probability distribution. Second, a semi-parametric method also does not require an assumption regarding data distribution but estimates regression coefficients. Lastly, a parametric method assumes that the data follow a particular distribution, such as the Weibull distribution, with respect to survival time t.
In this study, we decided to use the Kaplan–Meier estimation, a non-parametric method, along with the log rank test, as our health checkup cohort DB does not conform to any specific type of distribution, including the Weibull distribution.
The Kaplan–Meier estimation assumes that events occur independently of one another and calculates survival probabilities from one interval to the next, under the assumption that censoring is independent of the survival time [17]. These probabilities can be illustrated in a survival plot [17].
The log rank test compares time-to-event distributions across two or more independent groups using a Chi-square test of the time occurrence between observed and expected counts. This test is particularly used to validate the null hypothesis that no significant difference exists in the survival curves between the groups being compared.
Additionally, our study incorporates the Cox proportional hazards model, a multivariate regression method that tests the significance of various time-relevant predictors, assuming a log-linear relationship between the survival function and the variables [18].
3. Methodology
3.1. Comprehensive Framework
The purpose of this study was to examine the determinants affecting the length of stay (LOS) of inpatients. We present the comprehensive framework of our research in Figure 1, which can be categorized into three main phases: (1) data collection, (2) data preprocessing, and (3) survival analysis.
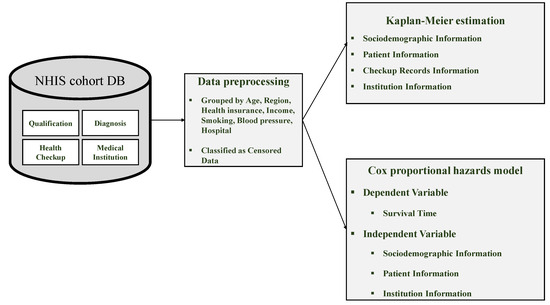
Figure 1.
Comprehensive framework for analyzing determinants of LOS.
During the data collection phase, we gathered the health checkup cohort DB. In the data preprocessing phase, we grouped and classified the censored data. Finally, for the survival analysis phase, we investigated the main determinants of LOS using both Kaplan–Meier estimation and the Cox proportional hazards model.
3.2. Data
To identify the variables affecting inpatients’ LOS, this study used the four-year health checkup cohort DB from 2016 to 2019, provided by the Korean National Health Insurance Services. This health checkup cohort DB is a sample study database composed of medical records for examinees aged 40 to 79, which are used for various medical analyses. The data are categorized into four tables, which are explained in Table 3.
Table 3.
Health checkup cohort DB.
3.3. Data Preprecessing
Based on previous studies investigating LOS determinants, we classified the variables from the health checkup cohort DB into four categories, as shown in Table 3. Of the 22 variables used for preprocessing, 15 were grouped into sociodemographic, patient, health checkup, and institutional categories for LOS analysis.
First, we used the ‘Qualification and Income Range’ table to select variables related to sociodemographic characteristics, such as gender, age, and residing area, and patient features like insurance type, income quantile, and severity of disability. The date of death was treated as censored data. Second, from the ‘Diagnosis’ table, we extracted inpatient records and used LOS as the dependent variable, focusing only on main diagnoses. Third, from the ‘Health Checkup’ table, we selected variables like smoking status, BMI, systolic, and diastolic blood pressure. Lastly, from the ‘Medical Institution’ table, we used variables related to the institution type, number of beds, and whether CT, MRI, or PET scanners were available.
As shown in Table 4, data preprocessing for survival analysis involved handling missing values, merging tables, extracting feature values, and identifying censored data. The key steps are as follows.
Table 4.
Features in health checkup cohort DB *.
First, missing values were addressed using features like health insurance type, disability severity, diagnostic results, and date of death. Missing insurance data were excluded, and missing disability values were marked as ‘no disability’. Missing death dates were treated as censored data, indicating survival or unknown status.
Second, feature preprocessing involved grouping variables before analysis. Age was converted to numeric values and grouped in 10-year increments. Subjects under 50 were excluded, and regions were grouped into Seoul, Gyeonggi-do, and others. Insurance types were reduced to three categories: medical, region, and workplace insurees. Income quantiles were grouped into three (1–3, 4–6, 8–10). Smoking status was simplified into two groups, smoker and non-smoker, while BMI was categorized into four groups, underweight, normal, overweight, and obese, based on KDCA standards. Blood pressure was also grouped into hypotension, normal, and hypertension. The ‘Medical Institution’ table grouped institutions by type, including general hospitals, clinics, and care hospitals, and classified bed numbers.
Third, feature extraction was limited to inpatient records and only main diagnoses were used. Finally, the ‘date of death’ feature classified those alive at discharge as censored data.
In total, 15 variables were used to analyze LOS determinants across 228,670 preprocessed cases, consisting of 227,644 discharge records and 1026 censored cases. The details of data preprocessing are presented in Table 5.
Table 5.
Preprocessed results by feature (LOS determinant analysis).
4. Results
This study used survival analysis to investigate the determinants of inpatients’ length of stay (LOS). A total of 3,228,933 records were analyzed to examine how twelve different features affect the death rate.
4.1. General Characteristics of Study Subjects
The general characteristics of the study subjects are presented in Table 6.
Table 6.
General characteristics of hospitalized inpatients.
4.2. Kaplan–Meier Estimation
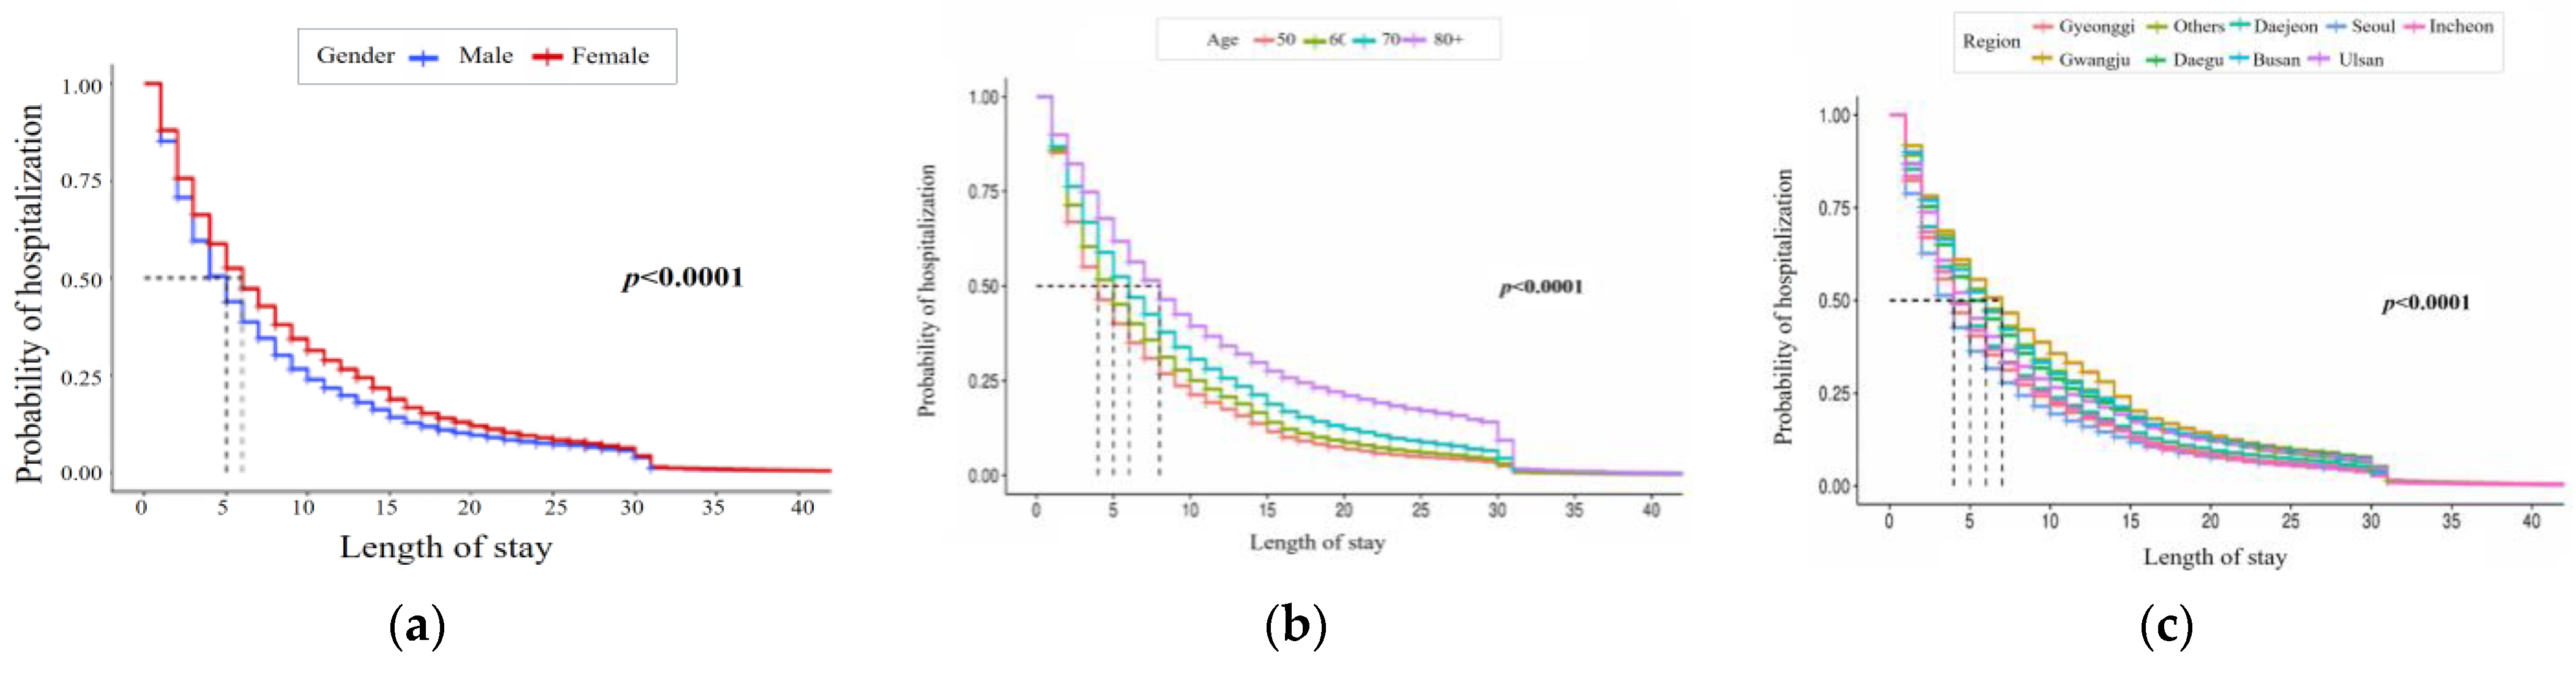
This study uses Kaplan–Meier estimation to analyze how sociodemographic, patient, health checkup, and institutional features affect LOS over time. First, Figure 2 shows estimates for sociodemographic features, including gender, age, and city/province. Females have a higher probability of being hospitalized than males, indicating a lower discharge probability. Hospitalization probability also varies by age and region, with Seoul having the lowest and Gwangju the highest rates.
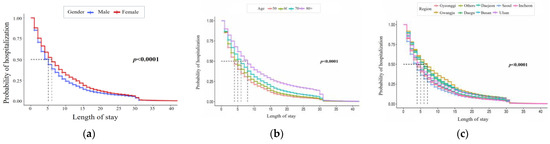
Figure 2.
Kaplan–Meier curve of LOS by sociodemographic feature. The three charts represent (a) gender, (b) age, and (c) region (from left to right).
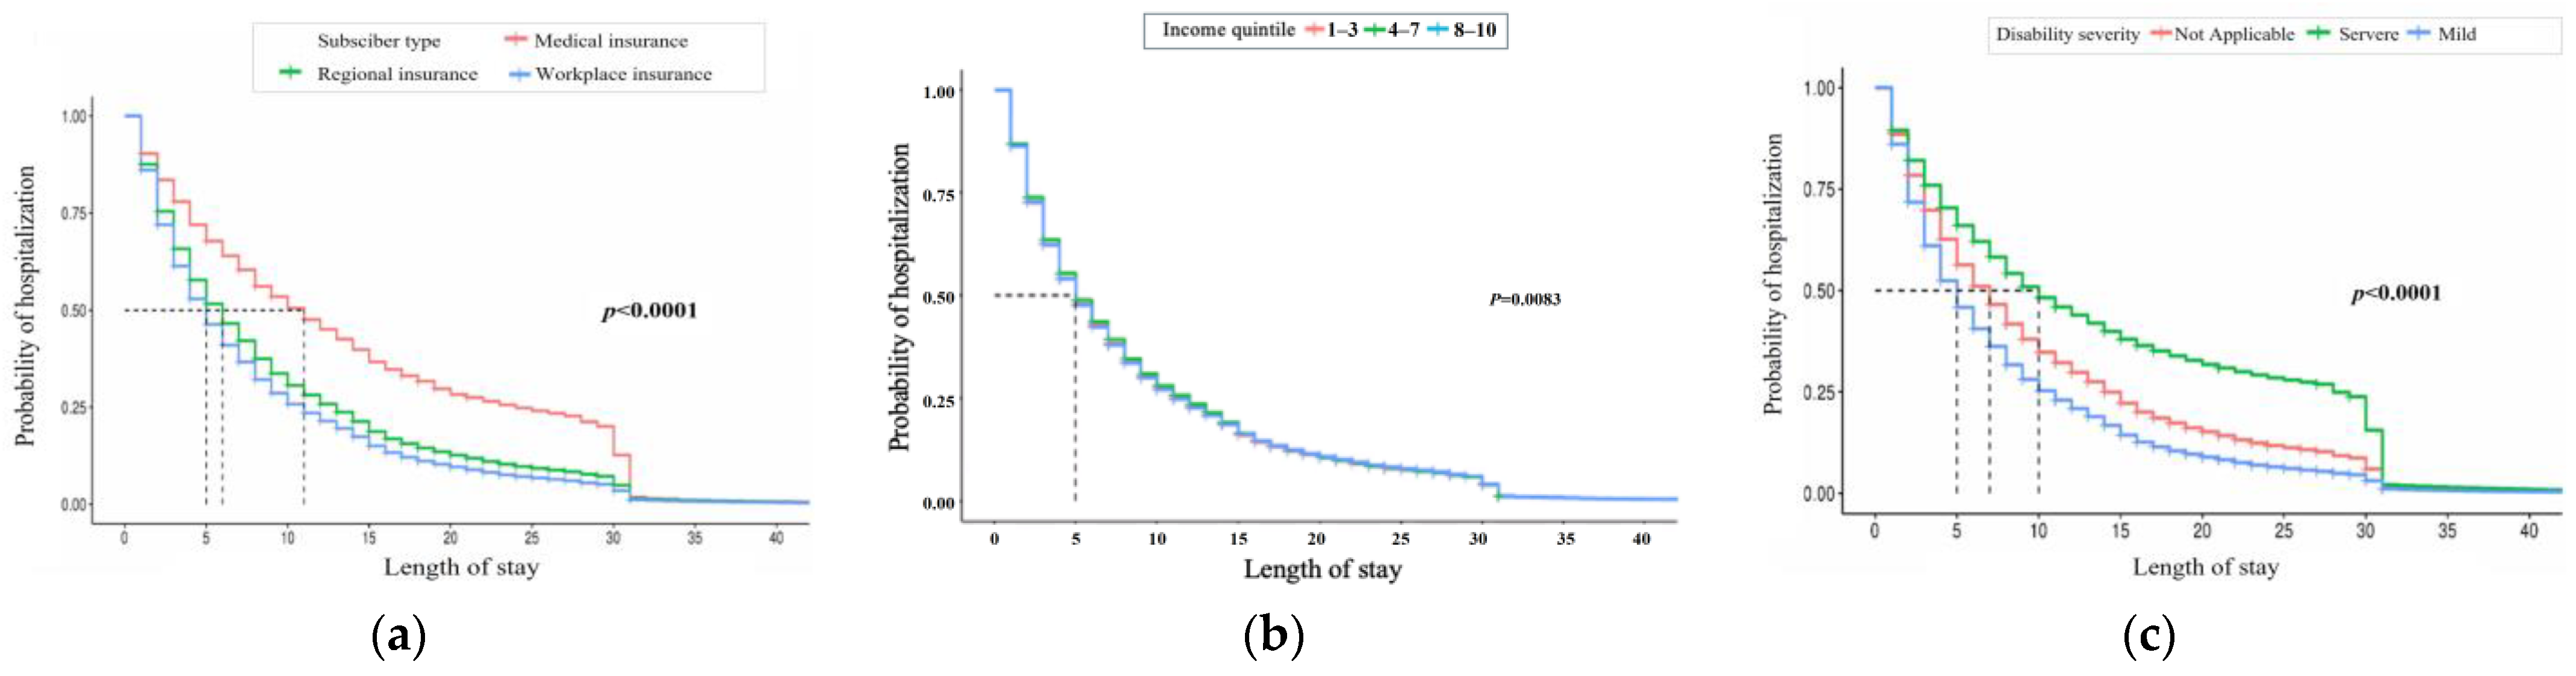
Figure 3 presents Kaplan–Meier curves for patient features like health insurance type, income quantile, and disability severity. Medical insurees show a higher probability of admission than regional and workplace insurees. Admission probabilities also differ across income quantiles, and individuals with severe disabilities have a higher likelihood of hospitalization compared to those with mild symptoms.

Figure 3.
Kaplan–Meier curve of LOS by patient feature. The three charts represent (a) insurance status, (b) income quantile, and (c) disability (from left to right).
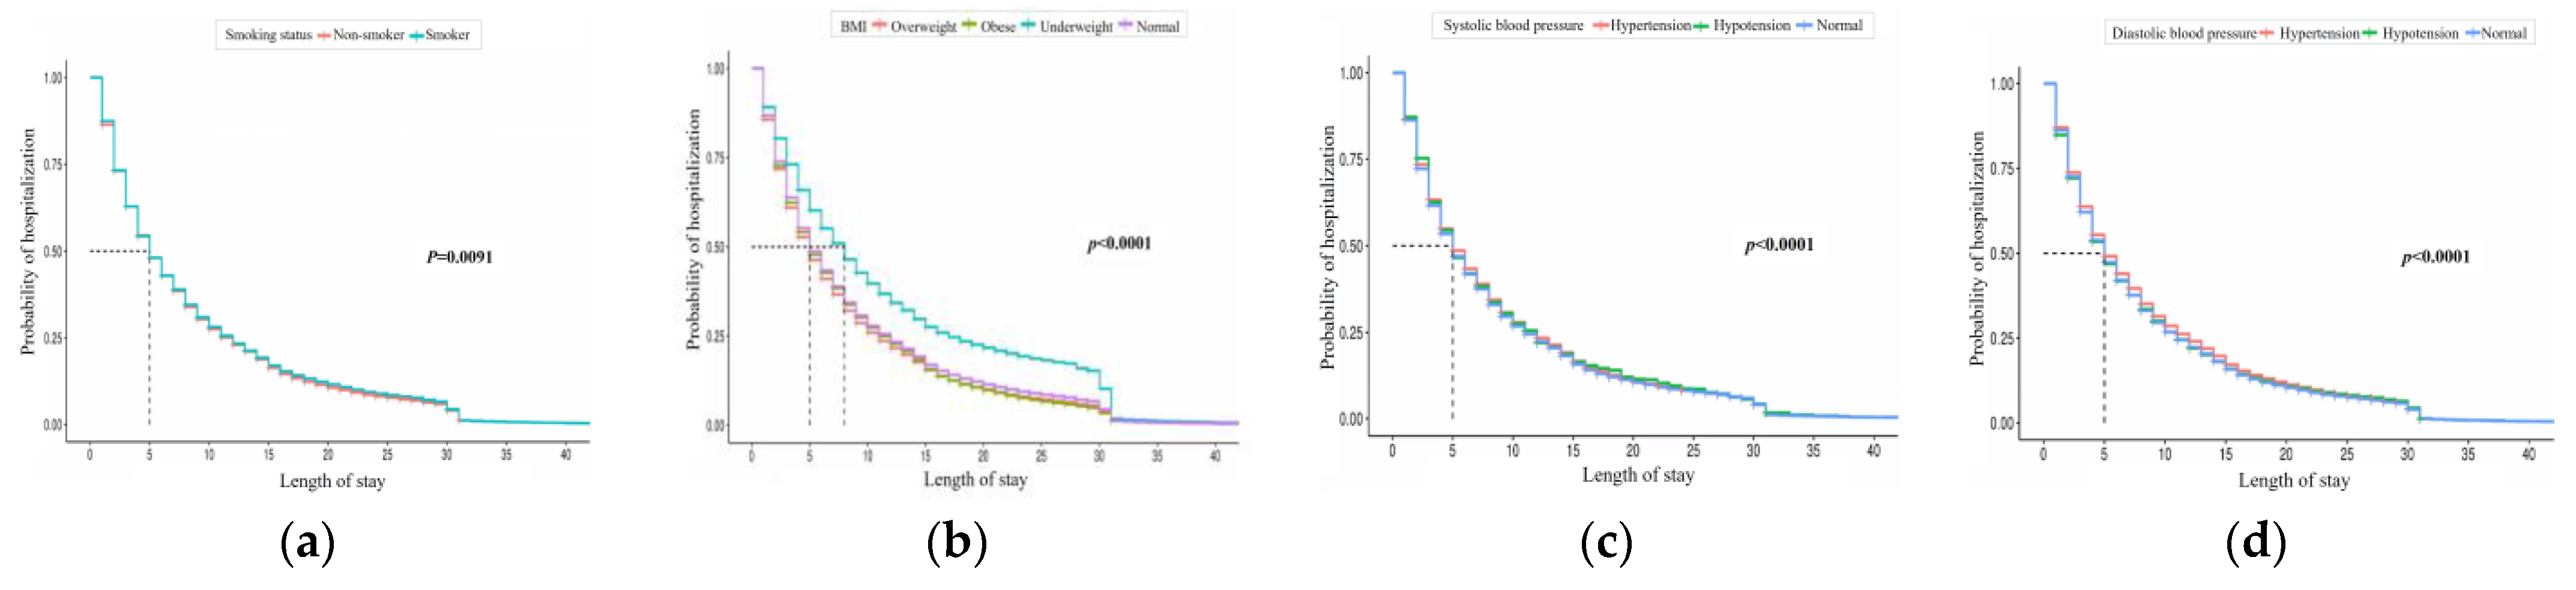
Figure 4 shows the results for health checkup features, where non-smokers and smokers differ in hospitalization probabilities. Underweight patients have the highest hospitalization rates for BMI, and hospitalization probabilities vary by systolic and diastolic blood pressure levels.
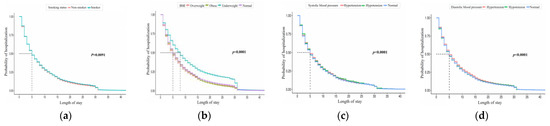
Figure 4.
Kaplan–Meier curve of LOS by checkup record feature. The four charts represent (a) smoking status, (b) BMI, (c) systolic blood pressure, and (d) diastolic blood pressure (from left to right).
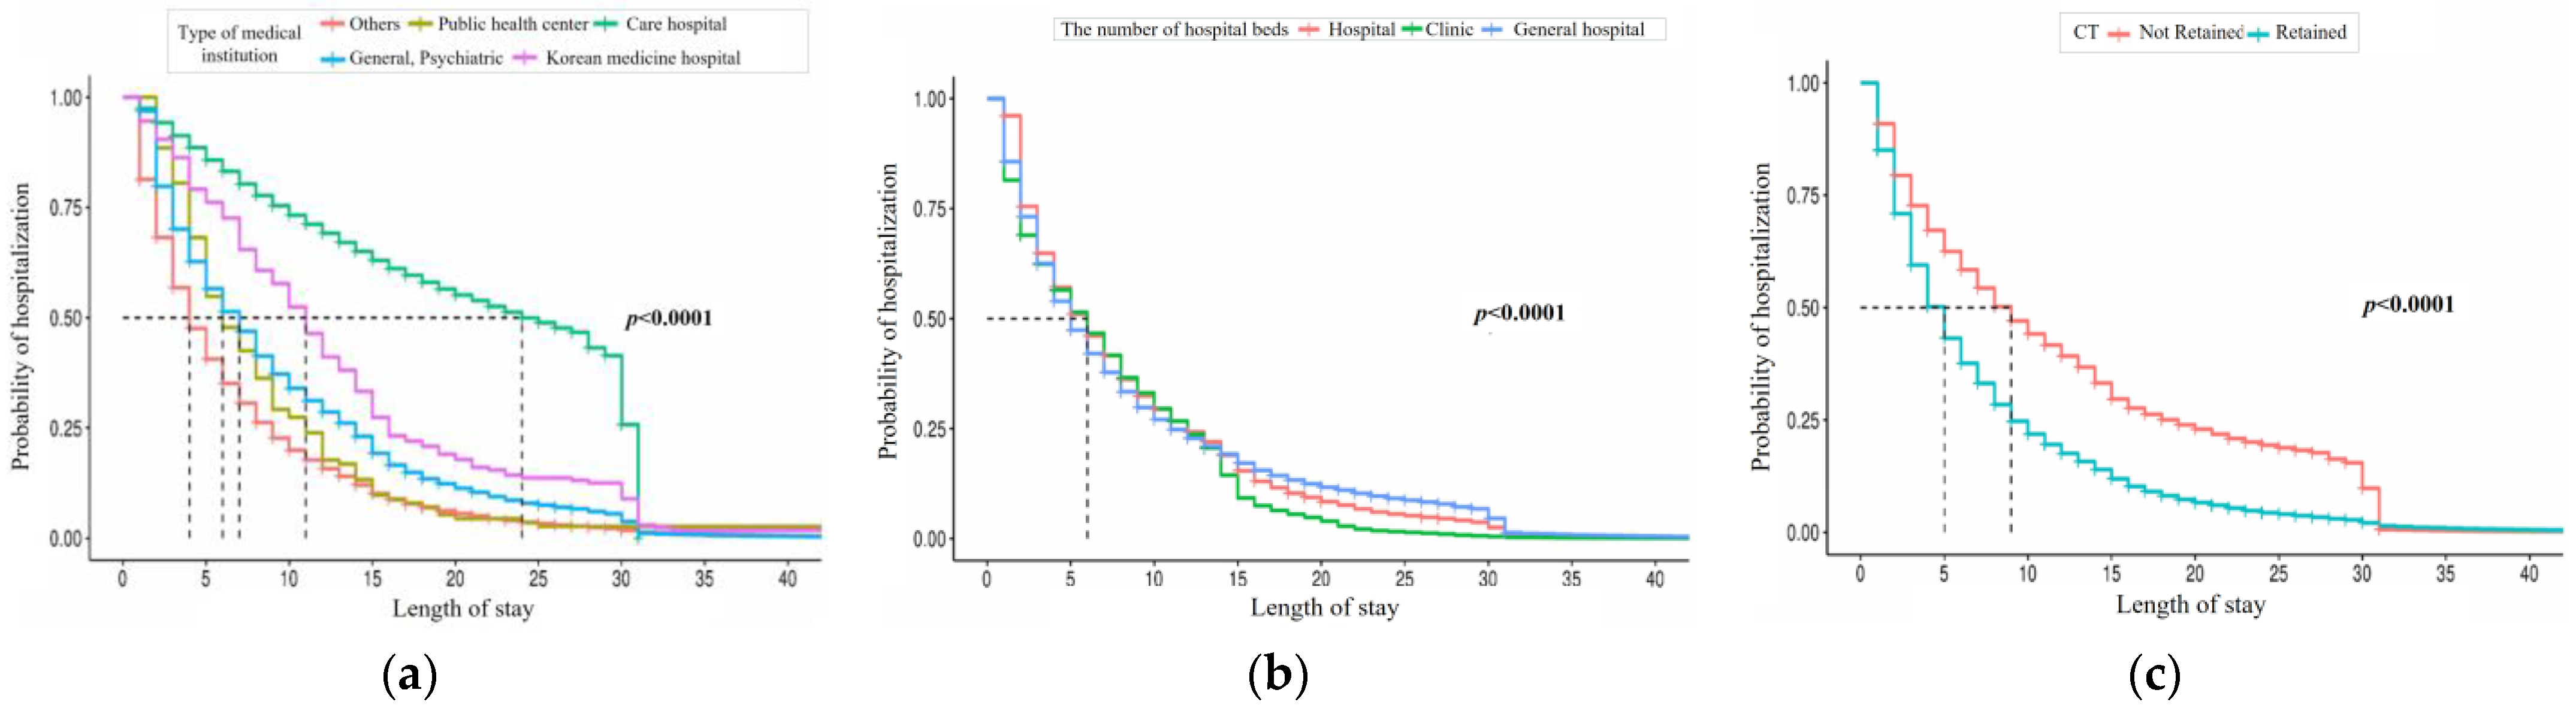
Finally, Figure 5 shows estimates obtained by institutional features. Care hospitals have the highest hospitalization probability, and differences are observed in the number of hospital beds. Institutions lacking CT, MRI, or PET scanners show a higher probability of hospitalization.
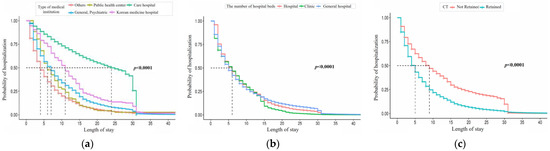
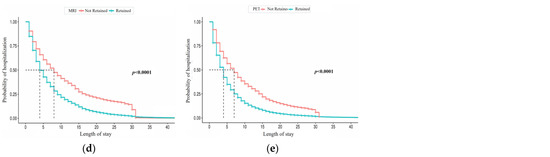
Figure 5.
Kaplan–Meier curve of LOS by institution feature. The five charts represent (a) type of medical institution, (b) number of hospital beds, (c) CT, (d) MRI, and (e) PET (from left to right).
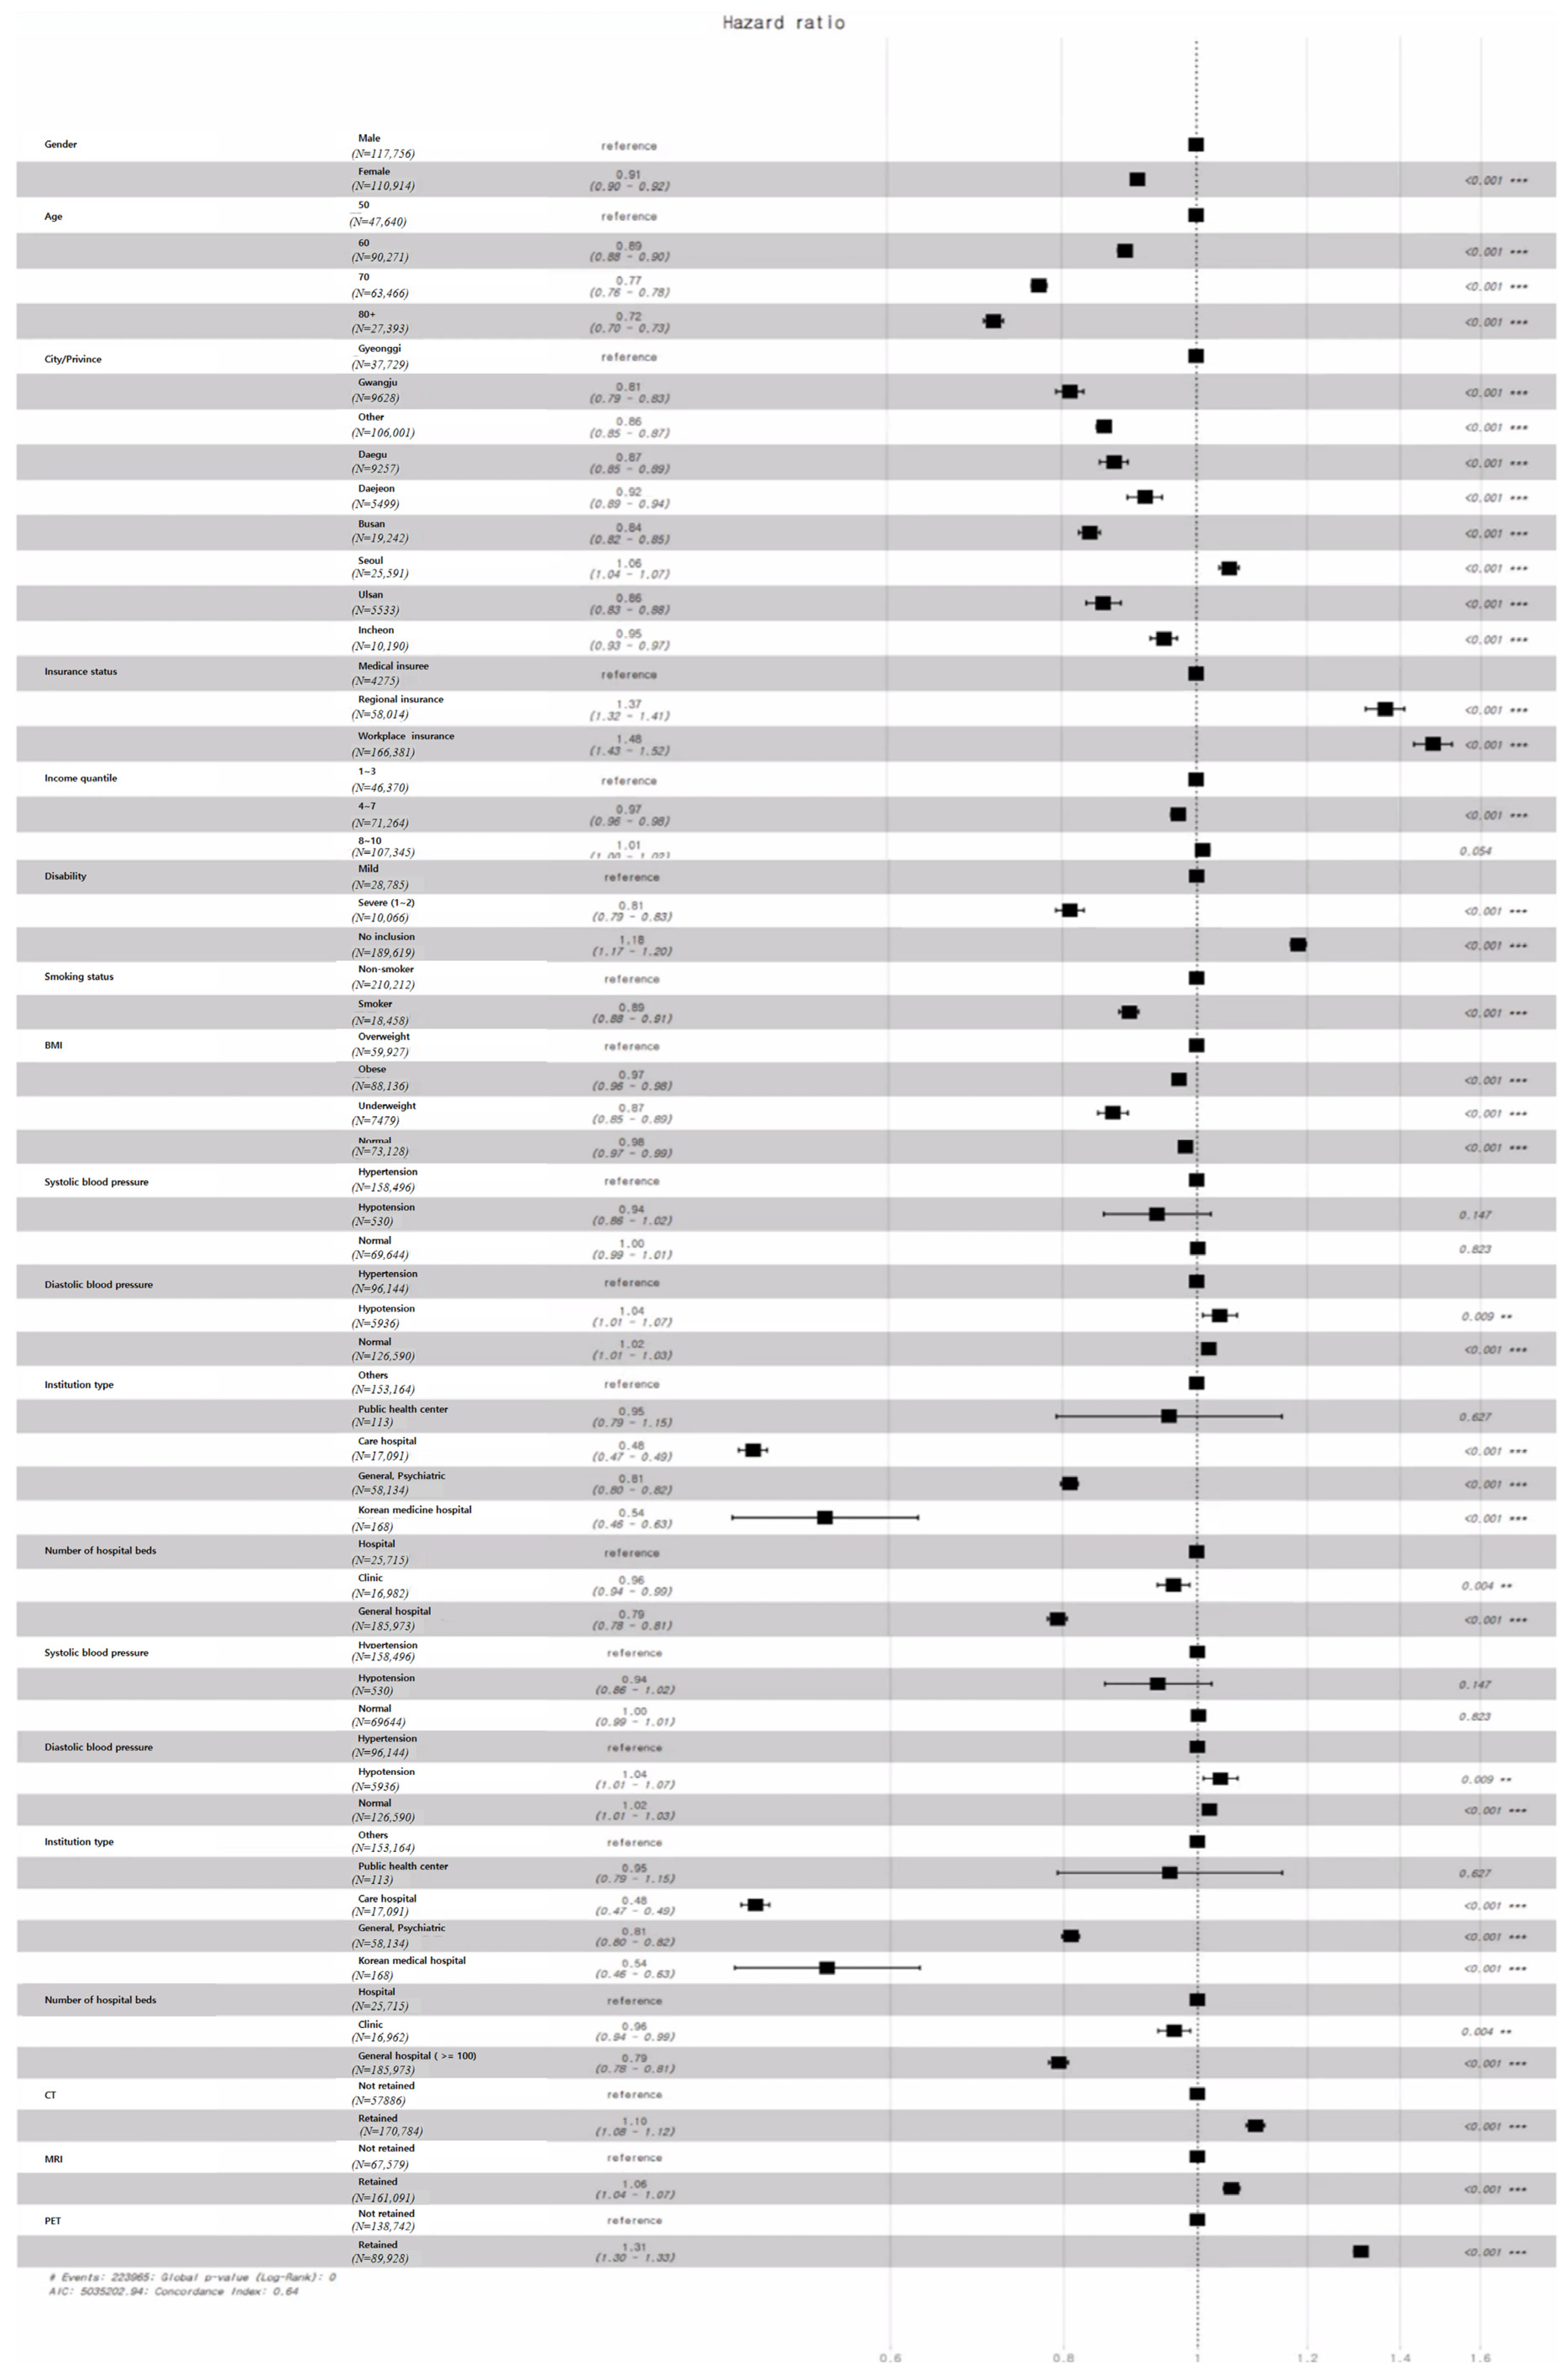
4.3. Cox Proportional Hazards Model
The variables affecting the probability of discharge were identified using the Cox proportional hazards model, as summarized in Figure 6.
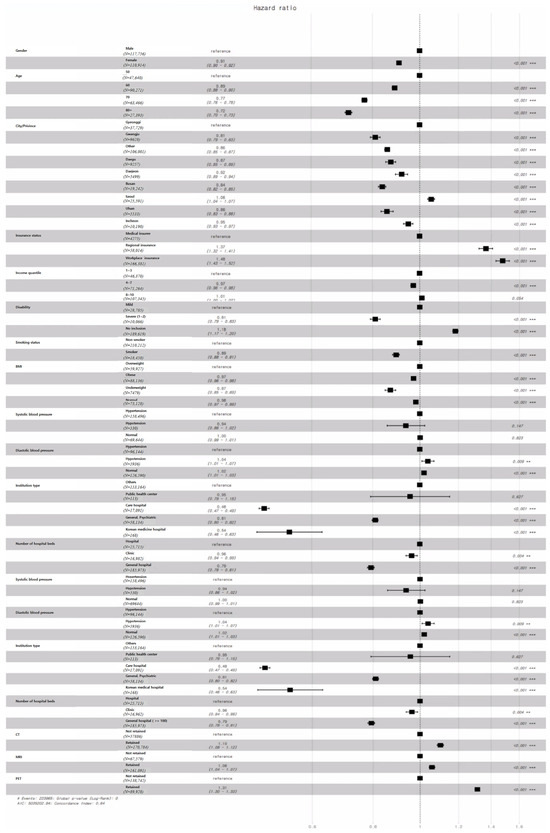
Figure 6.
Results of the Cox proportional hazards model for LOS.
In terms of gender, the probability of discharge for males is 0.91 times lower than for females. For age, the probability of discharge decreases for those in their 50s to 80s. Compared to those in their 50s, the discharge probability is 0.89, 0.77, and 0.72 times for inpatients in their 60s, 70s, and 80s, respectively, with those aged 80 and above having the highest probability of hospitalization.
Looking at regional features, the discharge probabilities for Gwangju, Daegu, Daejeon, Busan, Seoul, Incheon, and other regions range from 0.81 to 1.06 times that of Gyeonggi, with Gwangju showing the most significant positive impact on LOS, and Seoul having a negative impact.
Regarding insurance type, the probability of discharge for patients with workplace insurance and regional insurance is 1.48 and 1.37 times higher than that for medical insurees, respectively. Patients in the 4–7 income quantiles have a discharge probability 0.97 times that of the 1–3 quantile group, while no significant difference was observed between the 8–10 and 1–3 quantiles. Patients without disabilities have a discharge probability 1.18 times higher than those with mild symptoms, while those with severe symptoms have a lower probability of 0.81 times, indicating a positive impact of severe symptoms on LOS.
For health checkup records, smokers have a discharge probability 0.89 times that of non-smokers. In terms of BMI, underweight, obese, and normal patients have discharge probabilities of 0.87, 0.97, and 0.98 times that of overweight patients, showing the influence of BMI on LOS. Systolic blood pressure showed no significant difference, but for diastolic blood pressure, patients with hypotension and normal levels had discharge probabilities of 1.04 and 1.02 times that of those with hypertension.
Lastly, the probability of discharge for care hospitals, Korean medicine hospitals, and psychiatric hospitals is 0.48, 0.54, and 0.81 times that of other institutions. However, no significant difference was found between public healthcare centers and other institutions. Hospitals with more beds and those possessing medical devices such as CT, MRI, and PET scanners had higher discharge probabilities, indicating their influence on LOS.
The results derived from the Cox proportional hazards model largely align with previous studies. However, as shown in Table 7, discrepancies were observed in the number of hospital beds. Specifically, the probability of discharge in hospitals was found to be higher than that in clinics and general hospitals.
Table 7.
Hazard ratio by number of hospital beds.
5. Discussion
This study explored key determinants influencing inpatients’ length of stay (LOS) using Kaplan–Meier estimation and Cox proportional hazards models. These methods complement each other, with Kaplan–Meier capturing univariate trends and Cox models providing multivariate insights. Some findings align with previous research, while others offer new perspectives.
Sociodemographic Characteristics: Male patients showed higher discharge probabilities than females, consistent with studies suggesting women experience more complex health conditions [10,19]. Older patients demonstrated longer stays, in line with the findings reported by [20]. Patients in Seoul had shorter stays, likely due to stricter discharge policies [10].
Patient Characteristics: Insurance type significantly impacted LOS, with medical insurees showing the longest stays, as reported by [21].
However, contrary to earlier studies [22], middle-income patients (quantiles 4–7) had longer stays. Severe disabilities were linked with longer stays, reinforcing findings that complex cases require prolonged care [23].
Health Checkup Records: Smoking status was a strong predictor of LOS, with smokers experiencing longer stays, supporting findings on the impact of smoking-related illnesses [24]. Underweight patients had the most prolonged stays, possibly due to heightened infection risks [25,26]. Diastolic hypertension, rather than systolic pressure, was associated with longer stays, echoing the trends identified by [27].
Institutional Characteristics: Care hospitals had the most significant effect on LOS, consistent with their role in long-term care [28]. However, contrary to earlier studies [10], we found that general hospitals did not retain patients longer than smaller institutions. Furthermore, the absence of advanced diagnostic equipment, such as CT, MRI, and PET scanners, was associated with longer stays, likely due to delayed diagnosis [29].
Implications for Practice: Our findings highlight the importance of addressing diverse factors affecting LOS to improve hospital resource management. For efficient care delivery, healthcare providers should consider tailored strategies for older adults, smokers, and patients with chronic illnesses or disabilities. Policymakers could also explore interventions to optimize discharge processes and enhance the availability of diagnostic equipment in smaller institutions.
6. Conclusions
This study identified key determinants influencing inpatients’ LOS using survival analysis methods. By leveraging Kaplan–Meier and Cox proportional hazards models, this research offers insights into how various sociodemographic, patient, health checkup records, and institutional factors shape LOS. The findings indicate that male gender, younger age, medical insurance type, and institutional features like equipment availability play significant roles in determining LOS. These findings have practical implications for healthcare policy and management. Specifically, they underscore the need for clear guidelines regarding patient admission to care hospitals and the potential benefits of targeted rehabilitation services for vulnerable groups. Reducing LOS can enhance hospital revenue while lowering patient costs, thereby contributing to the sustainability of health insurance systems.
The study also suggests future research directions, such as deeper exploration of regional differences in LOS and expanding analyses to include other patient demographics. Further investigations should continue to refine our understanding of LOS determinants, incorporating newer methods and data sources to inform hospital policies and improve patient care outcomes.
Author Contributions
Conceptualization, J.K. and H.J.; data curation, H.C. and A.E.K.; formal analysis, S.R.; methodology, I.C.; Visualization, S.R.; writing—original draft, J.K.; writing—review and editing, H.J. All authors have read and agreed to the published version of the manuscript.
Funding
This research received no external funding.
Institutional Review Board Statement
The study was conducted in accordance with the Helsinki Declaration and approved by the institutional review board, Kyung Hee University, Seoul, Korea (Protocol No. KHSIRB-22-344), for research involving human subjects.
Informed Consent Statement
Informed consent was obtained from all subjects involved in this study.
Data Availability Statement
Data sharing is not applicable to this article.
Conflicts of Interest
The authors declare no conflicts of interest.
References
- Kim, C.; Kang, S. Convergence study to predict length of stay in premature infants using machine learning. J. Digit. Converg. 2021, 19, 271–282. [Google Scholar]
- Chrusciel, J.; Girardon, F.; Roquette, L.; Laplanche, D.; Duclos, A.; Sanchez, S. The prediction of hospital length of stay using unstructured data. BMC Med. Inform. Decis. Mak. 2021, 21, 351. [Google Scholar] [CrossRef] [PubMed]
- Jo, Y.Y.; Han, J.; Park, H.W.; Jung, H.; Lee, J.D.; Jung, J.; Cha, H.S.; Sohn, D.K.; Hwangbo, Y. Prediction of Prolonged Length of Hospital Stay After Cancer Surgery Using Machine Learning on Electronic Health Records: Retrospective Cross-sectional Study. JMIR Med. Inform. 2021, 9, e23147. [Google Scholar] [CrossRef] [PubMed]
- Wen, Y.; Rahman, M.F.; Zhuang, Y.; Pokojovy, M.; Xu, H.; McCaffrey, P.; Vo, A.; Walser, E.; Moen, S.; Tseng, T.L.B. Time-to-event modeling for hospital length of stay prediction for COVID-19 patients. Mach. Learn. Appl. 2022, 9, 100365. [Google Scholar] [CrossRef] [PubMed]
- Yoon, E.J.; Lee, J.; Hong, M.Y.; Park, M.S. Factors affecting the length of stay of long-stay medical aid inpatients in Korea: Focused on hospitalization types in long-term care hospitals. Health Policy Manag. 2021, 31, 173–179. [Google Scholar]
- Lee, J.B.; Woo, H. Determinants of length of stay in ischemic heart disease patients. J. Health Inform. 2020, 45, 52–59. [Google Scholar] [CrossRef]
- Lim, D.S.; Hwang, S.K.; An, K.M.; Cho, H.A. Effect of cause of disease in patients with liver cirrhosis on length of stay. Health Welf. 2020, 22, 249–267. [Google Scholar] [CrossRef]
- Burn, E.; Edwards, C.J.; Murray, D.W.; Silman, A.; Cooper, C.; Arden, N.K.; Pinedo-Villanueva, R.; Prieto-Alhambra, D. Trends and determinants of length of stay and hospital reimbursement following knee and hip replacement: Evidence from linked primary care and NHS hospital records from 1997 to 2014. BMJ Open 2018, 8, e019146. [Google Scholar] [CrossRef]
- Erickson, L.A.; Ricketts, A.; Swanson, T.; Weiner, J.; Hasnie, U.A.; Bonessa, K.; Noel-Macdonnell, J.; Russell, C.L. Determinants of Length of Stay after Neonatal Cardiac Surgery Using Path Analysis. West. J. Nurs. Res. 2022, 45, 306–315. [Google Scholar] [CrossRef]
- Lee, H.-S.; Kim, H.H. Factors affecting the length of stay in patients with total knee arthroplasty. J. Korea Entertain. Ind. Assoc. 2020, 14, 201–208. [Google Scholar] [CrossRef]
- van der Veen, D.; Remeijer, C.; Fogteloo, A.J.; Heringhaus, C.; de Groot, B. Independent determinants of prolonged emergency department length of stay in a tertiary care centre: A prospective cohort study. Scand. J. Trauma Resusc. Emerg. Med. 2018, 26, 81. [Google Scholar] [CrossRef] [PubMed]
- Kim, S.M.; Lee, H.S. Factors affecting In-hospital Complication and Length of Stay in Elderly Patients with Total Knee Arthroplasty. Korean J. Hosp. Manag. 2018, 23, 52–62. [Google Scholar]
- Suhn, M.O. The Determinant of the Length of Stay of Young-Old and Old-Old Patients Hospitalized Owing to Cancer. J. Learn. -Centered Curric. Instr. 2020, 20, 287–304. [Google Scholar] [CrossRef]
- Lee, J.R.; Do, N.Y. Effect of brand on survival and closing of stores—Focusing on F&B stores in major retail areas of Seoul. J. Korea Real Estate Anal. Assoc. 2019, 25, 49–62. [Google Scholar]
- Jing, B.; Zhang, T.; Wang, Z.; Jin, Y.; Liu, K.; Qiu, W.; Ke, L.; Sun, Y.; He, C.; Hou, D.; et al. A deep survival analysis method based on ranking. Artif. Intell. Med. 2019, 98, 1–9. [Google Scholar] [CrossRef]
- Schober, P.; Vetter, T.R. Survival analysis and interpretation of time-to-event data: The tortoise and the hare. Anesth. Analg. 2018, 127, 792. [Google Scholar] [CrossRef] [PubMed]
- In, J.; Lee, D.K. Survival analysis: Part I-analysis of time-to-event. Korean J. Anesthesiol. 2018, 71, 182–191. [Google Scholar] [CrossRef]
- Ha, S.H.; Yang, J.W.; Min, J. Credit prediction based on Kohonen network and survival analysis. J. Korean Oper. Res. Manag. Sci. Soc. 2009, 34, 35–54. [Google Scholar]
- Kang, E.S.; Tark, K.-C.; Lee, T.; Kim, I.S. Relationship between characteristics of lengthy hospital stay patients, knowledge of transfer needs and their willingness to transfer—Strategies for the effective transfer of lengthy hospital stay patients. J. Korean Soc. Qual. Assur. Health Care 2002, 2, 116–133. [Google Scholar]
- Cha, S.; Kim, S. The Determinant of the Length of stay in hospital for schizophrenic patients: Using data from the in-depth injury patient surveillance system. J. Digit. Converg. 2013, 11, 351–359. [Google Scholar]
- Kim, Y.H.; Moon, J.W.; Kim, K.H. Determinant factors and medical charges pattern by length of stay in hospital. Korean J. Hosp. Manag. 2010, 15, 15–26. [Google Scholar]
- Lim, N.G. Differences in Medical Care Utilization by Regional Economic Status. J. Digit. Converg. 2013, 11, 459–467. [Google Scholar]
- Kim, S.-S.; Kim, W.-J.; Kang, S.-H. A study on the variation of severity adjusted LOS on Injry inpatient in Korea. J. Korea Acad. Ind. Coop. Soc. 2011, 12, 2668–2676. [Google Scholar]
- Lee, J.S. Inequalities in smoking and anti-smoking program. J. Korean Assoc. Cancer Prev. 2005, 10, 159–165. [Google Scholar]
- Dorner, T.E.; Schwarz, F.; Kranz, A.; Freidl, W.; Rieder, A.; Gisinger, C. Body mass index and the risk of infections in institutionalised geriatric patients. Br. J. Nutr. 2010, 103, 1830–1835. [Google Scholar] [CrossRef]
- Lee, Y.-S.; Lee, Y. Comparison of the nutrient intake and health status of elderly Koreans according to their BMI status: Focus on the underweight elderly population. Korean J. Community Nutr. 2022, 27, 422–434. [Google Scholar] [CrossRef]
- Suh, H.S.; Lee, K.H.; Kim, H.C.; Yu, C.S.; Kim, J.C. The Postoperative Impact of Co-morbidity in Colorectal Cancer Surgery. J. Korean Soc. Coloproctol. 2003, 19, 299–306. [Google Scholar]
- Song, H. Long-term Care Hospital Systems in Developed Countries and the Implications for Korea. J. Korean Geriatr. Soc. 2012, 16, 114–120. [Google Scholar]
- Nam, G.C.; Kim, H.C.; Gwon, B.S. ICT convergence medical devices. Inf. Commun. Mag. 2014, 31, 44–50. [Google Scholar]

Disclaimer/Publisher’s Note: The statements, opinions and data contained in all publications are solely those of the individual author(s) and contributor(s) and not of MDPI and/or the editor(s). MDPI and/or the editor(s) disclaim responsibility for any injury to people or property resulting from any ideas, methods, instructions or products referred to in the content. |
© 2024 by the authors. Licensee MDPI, Basel, Switzerland. This article is an open access article distributed under the terms and conditions of the Creative Commons Attribution (CC BY) license (https://creativecommons.org/licenses/by/4.0/).