

Analyzing Multiple Social Determinants of Health Using Different Clustering Methods


Abstract
1. Introduction
2. Materials and Methods
2.1. Study Design
2.2. Statistical Analysis
2.2.1. Exploratory Factor Analysis
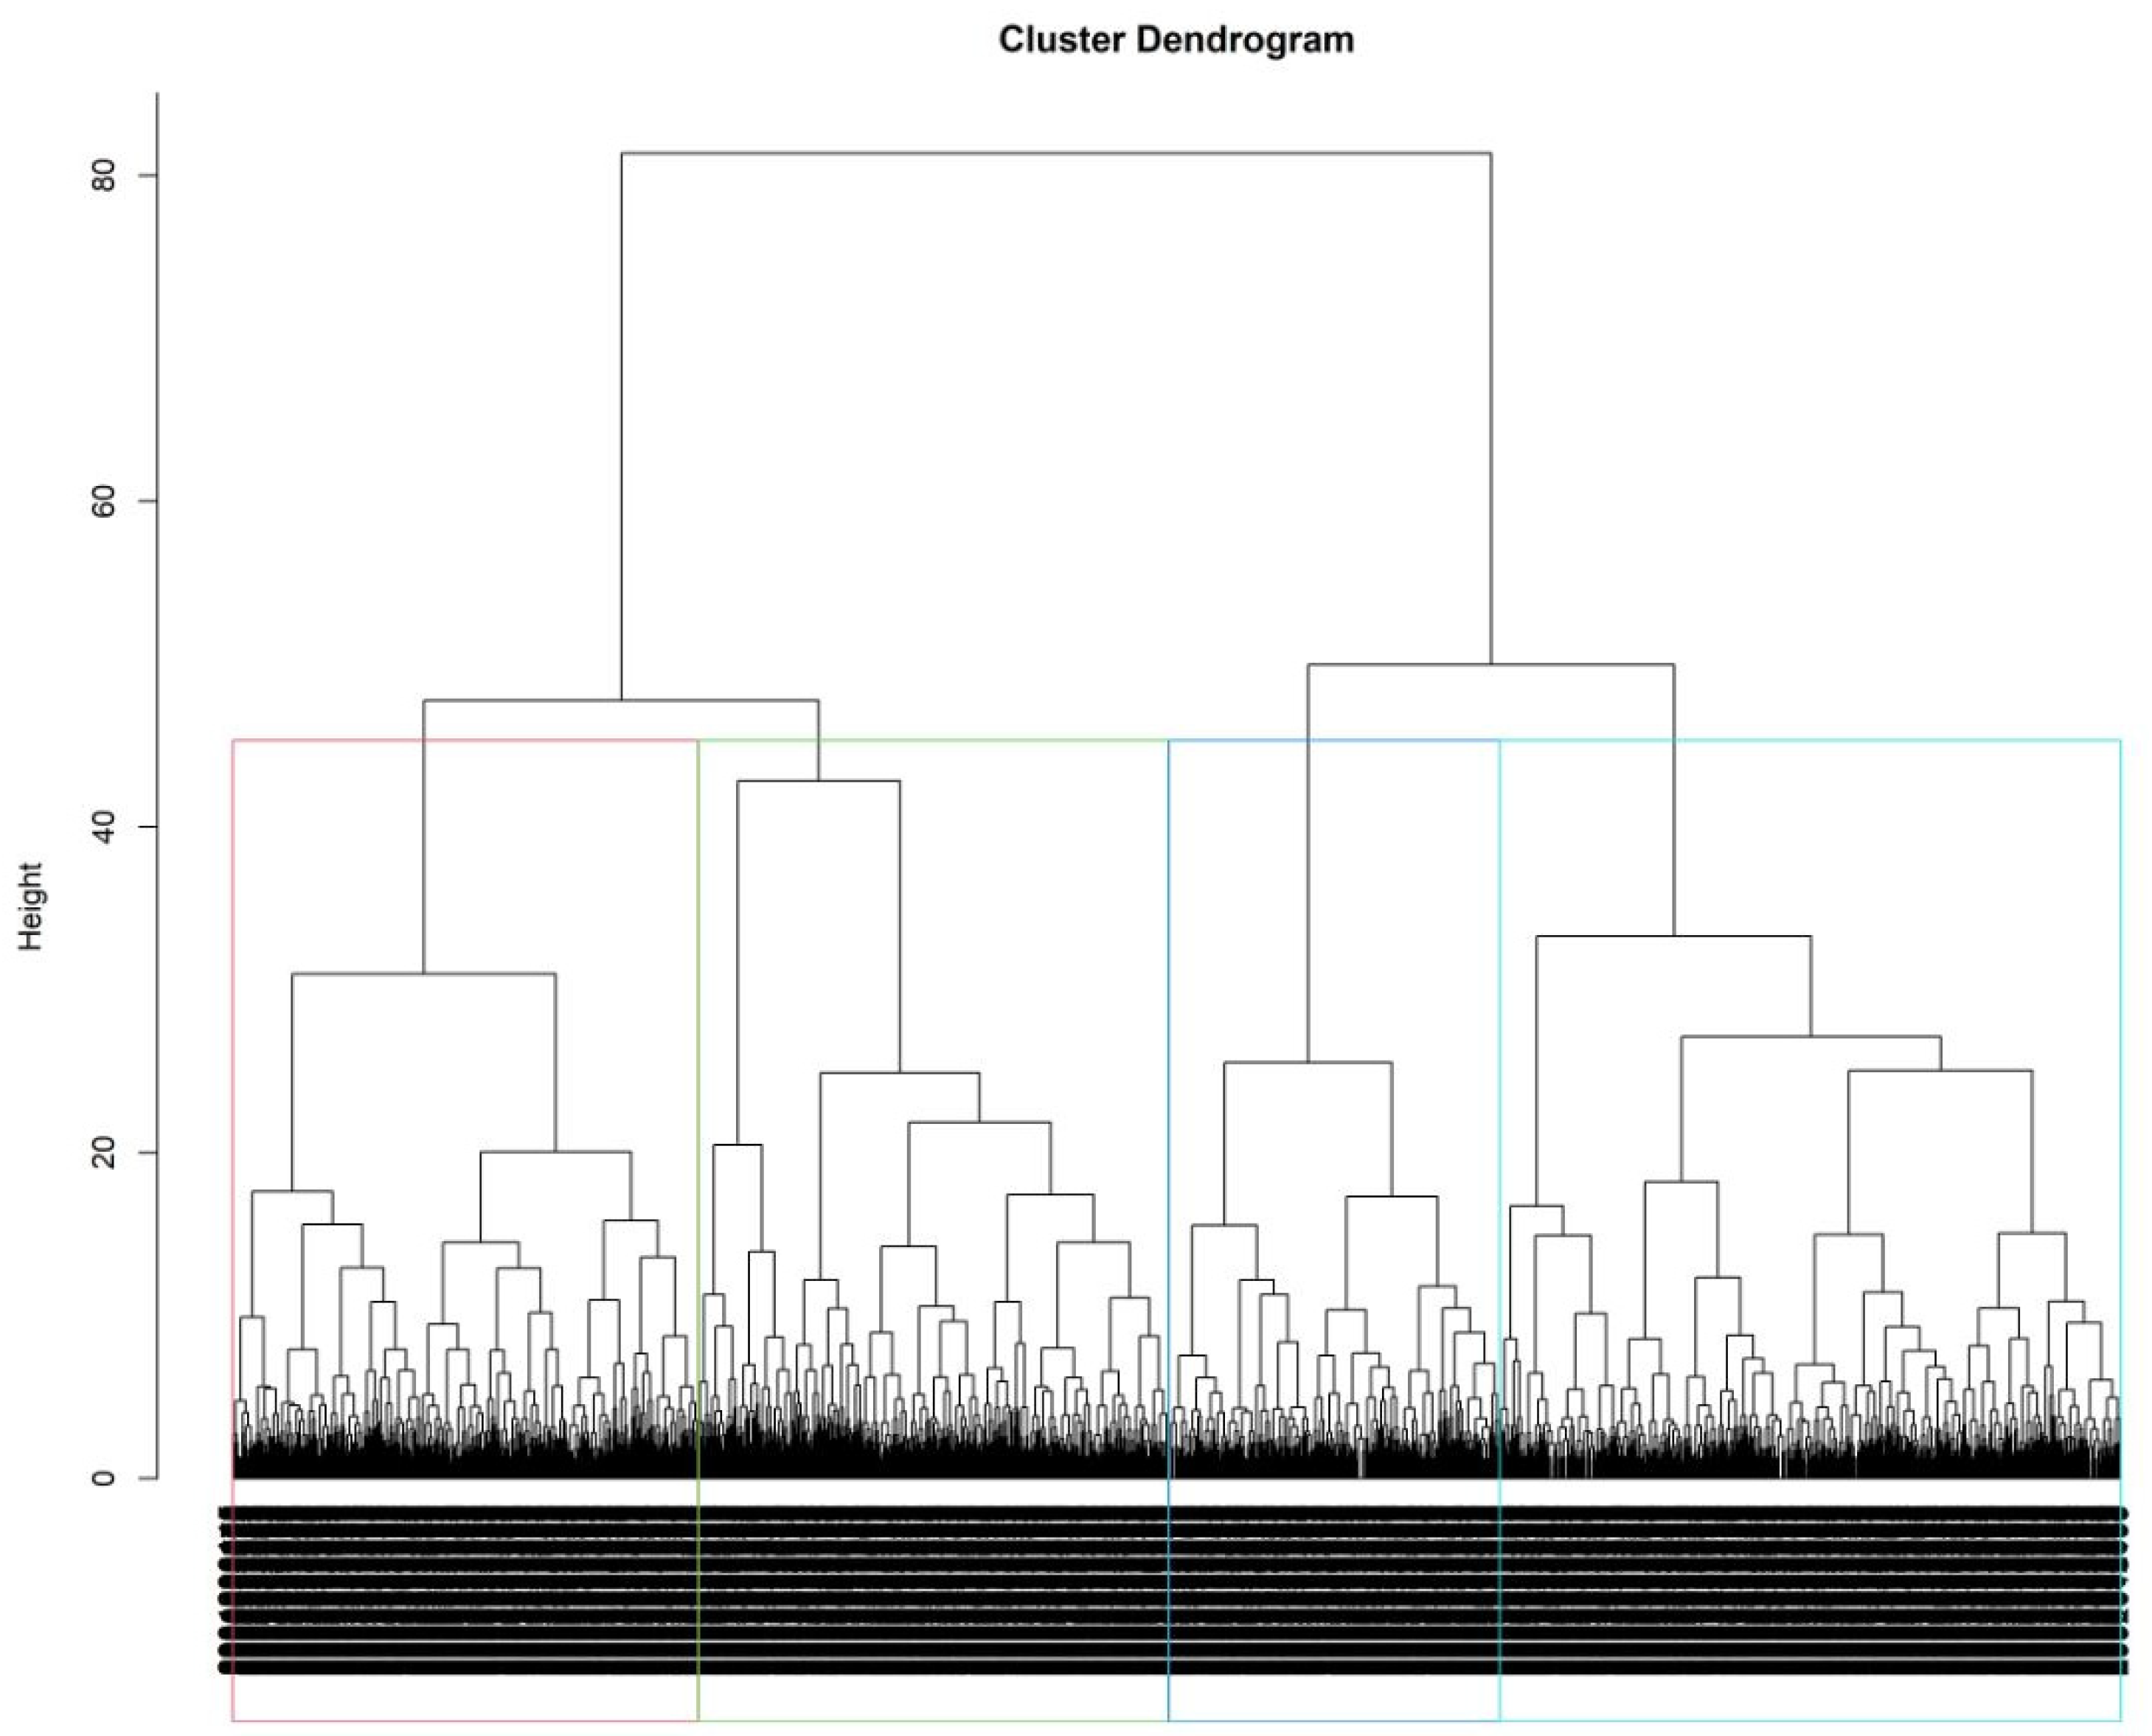
2.2.2. Hierarchical Clustering
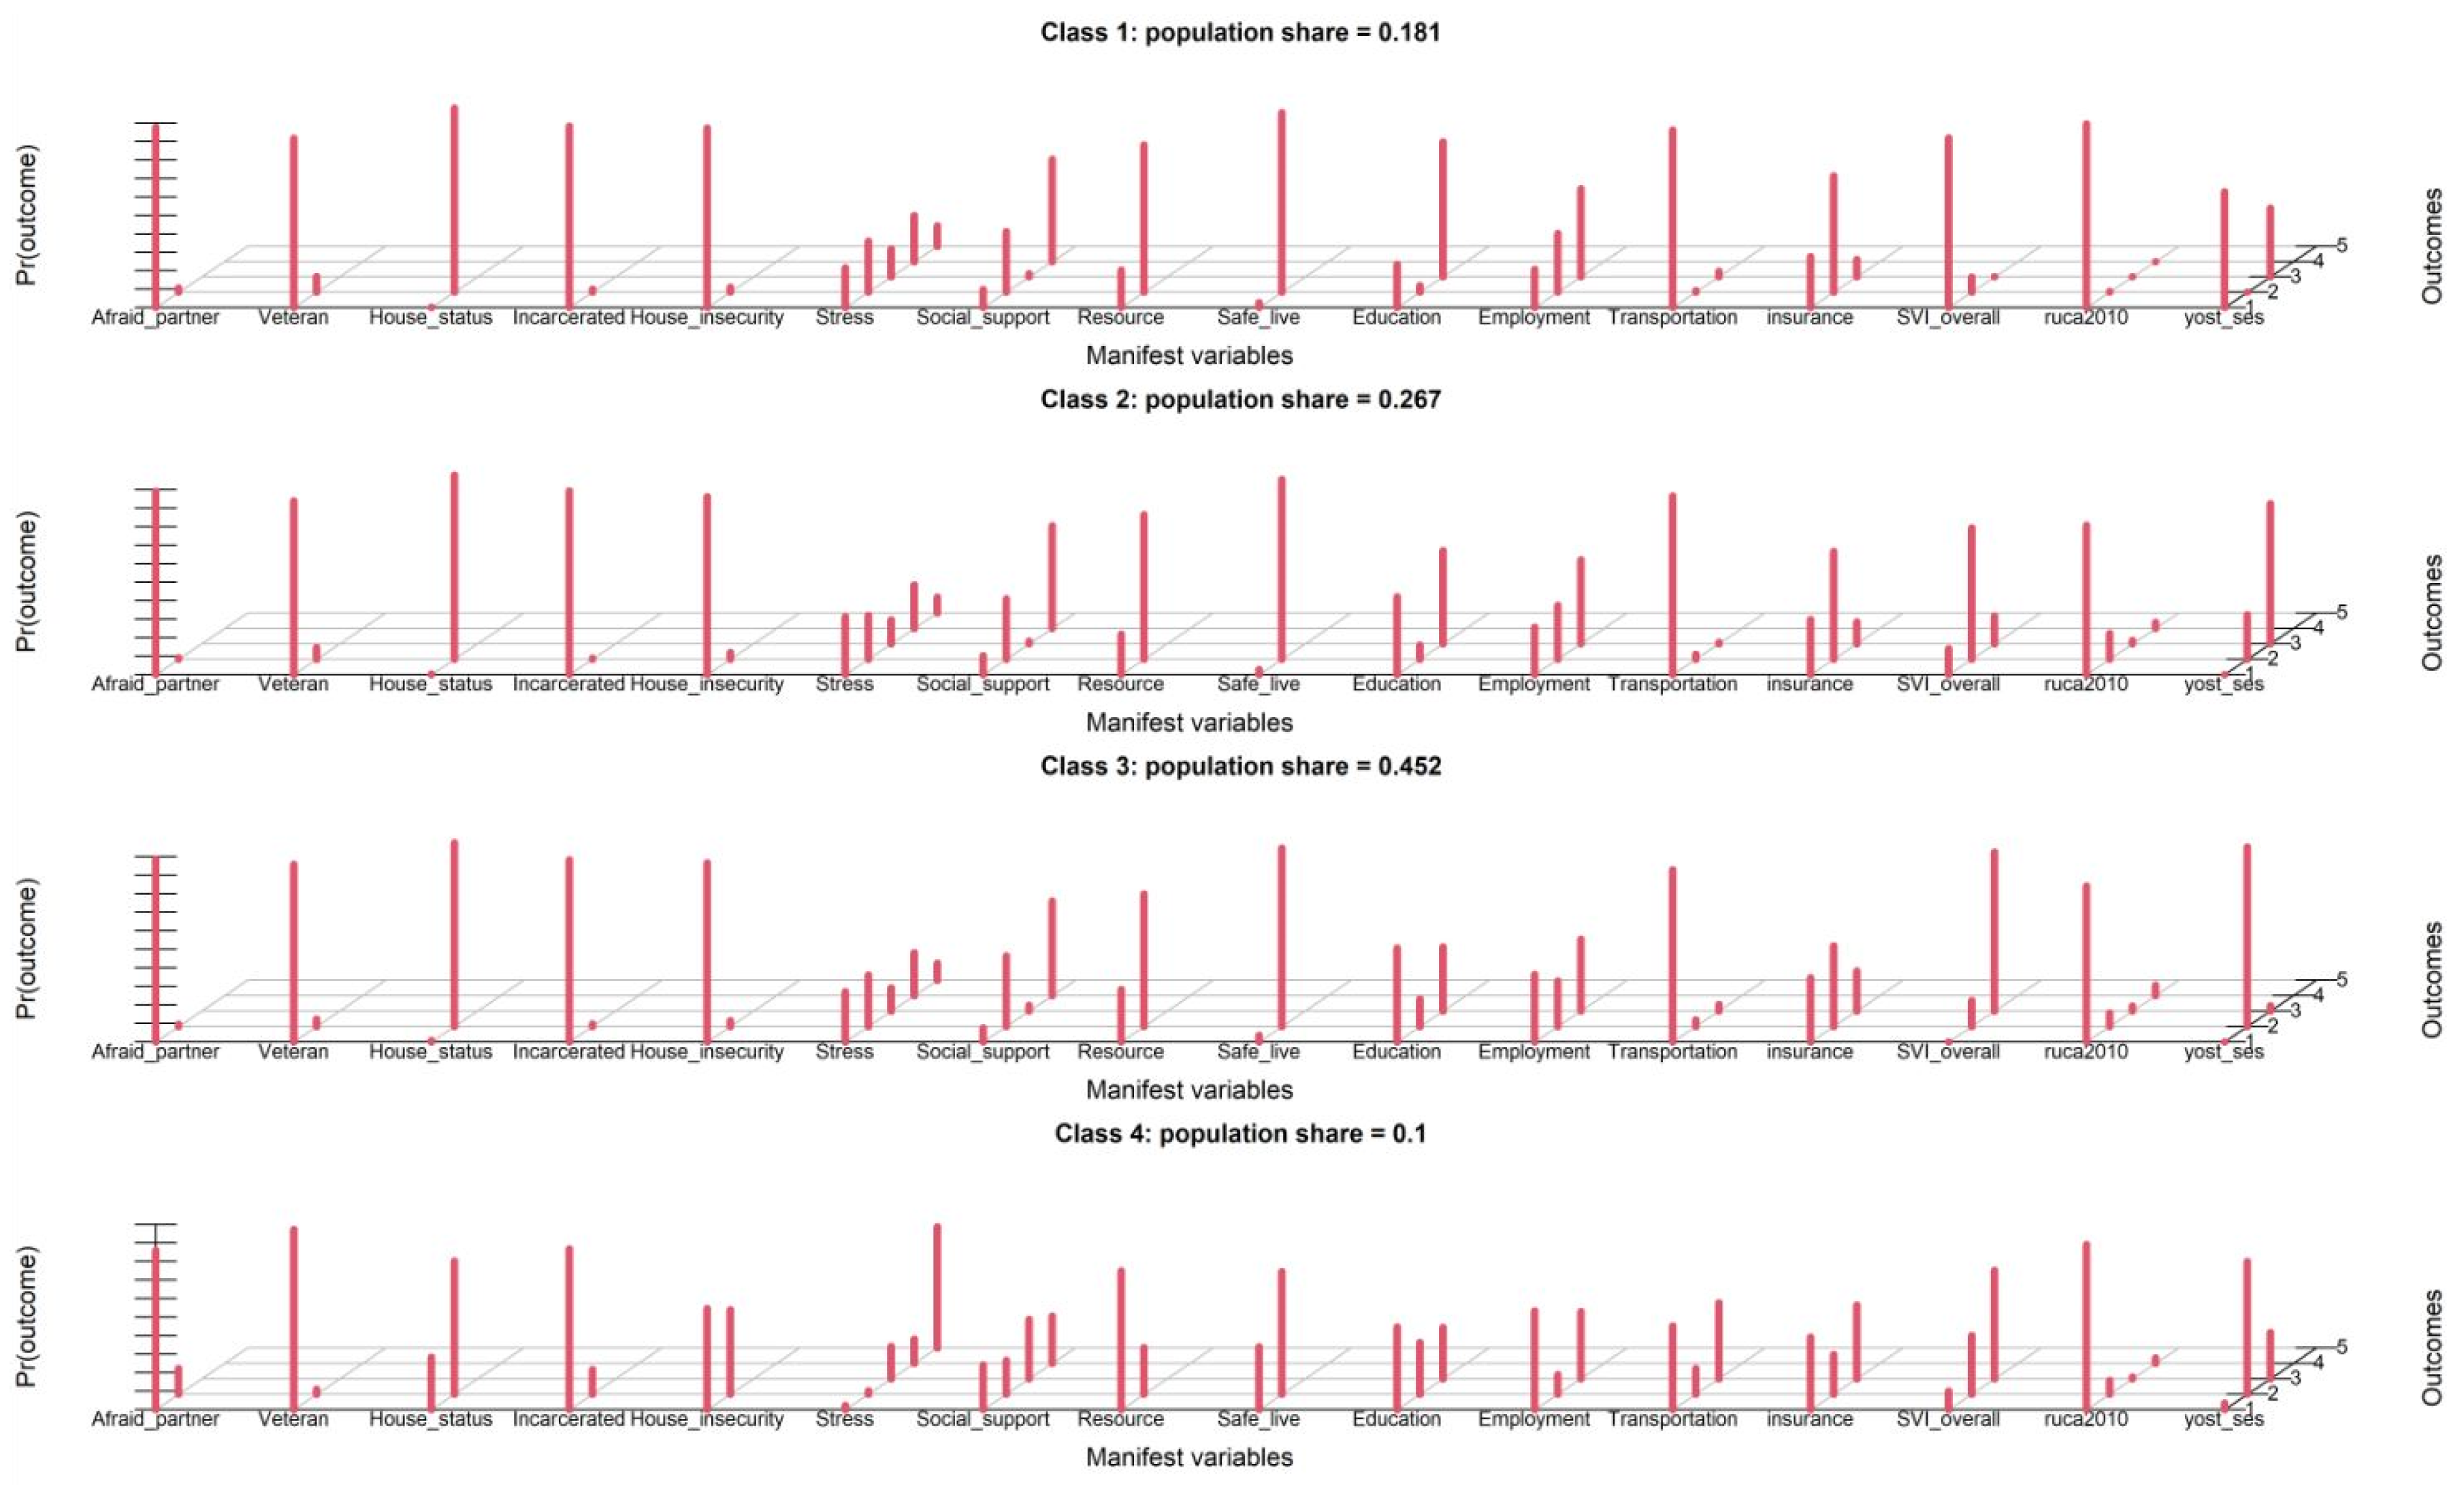
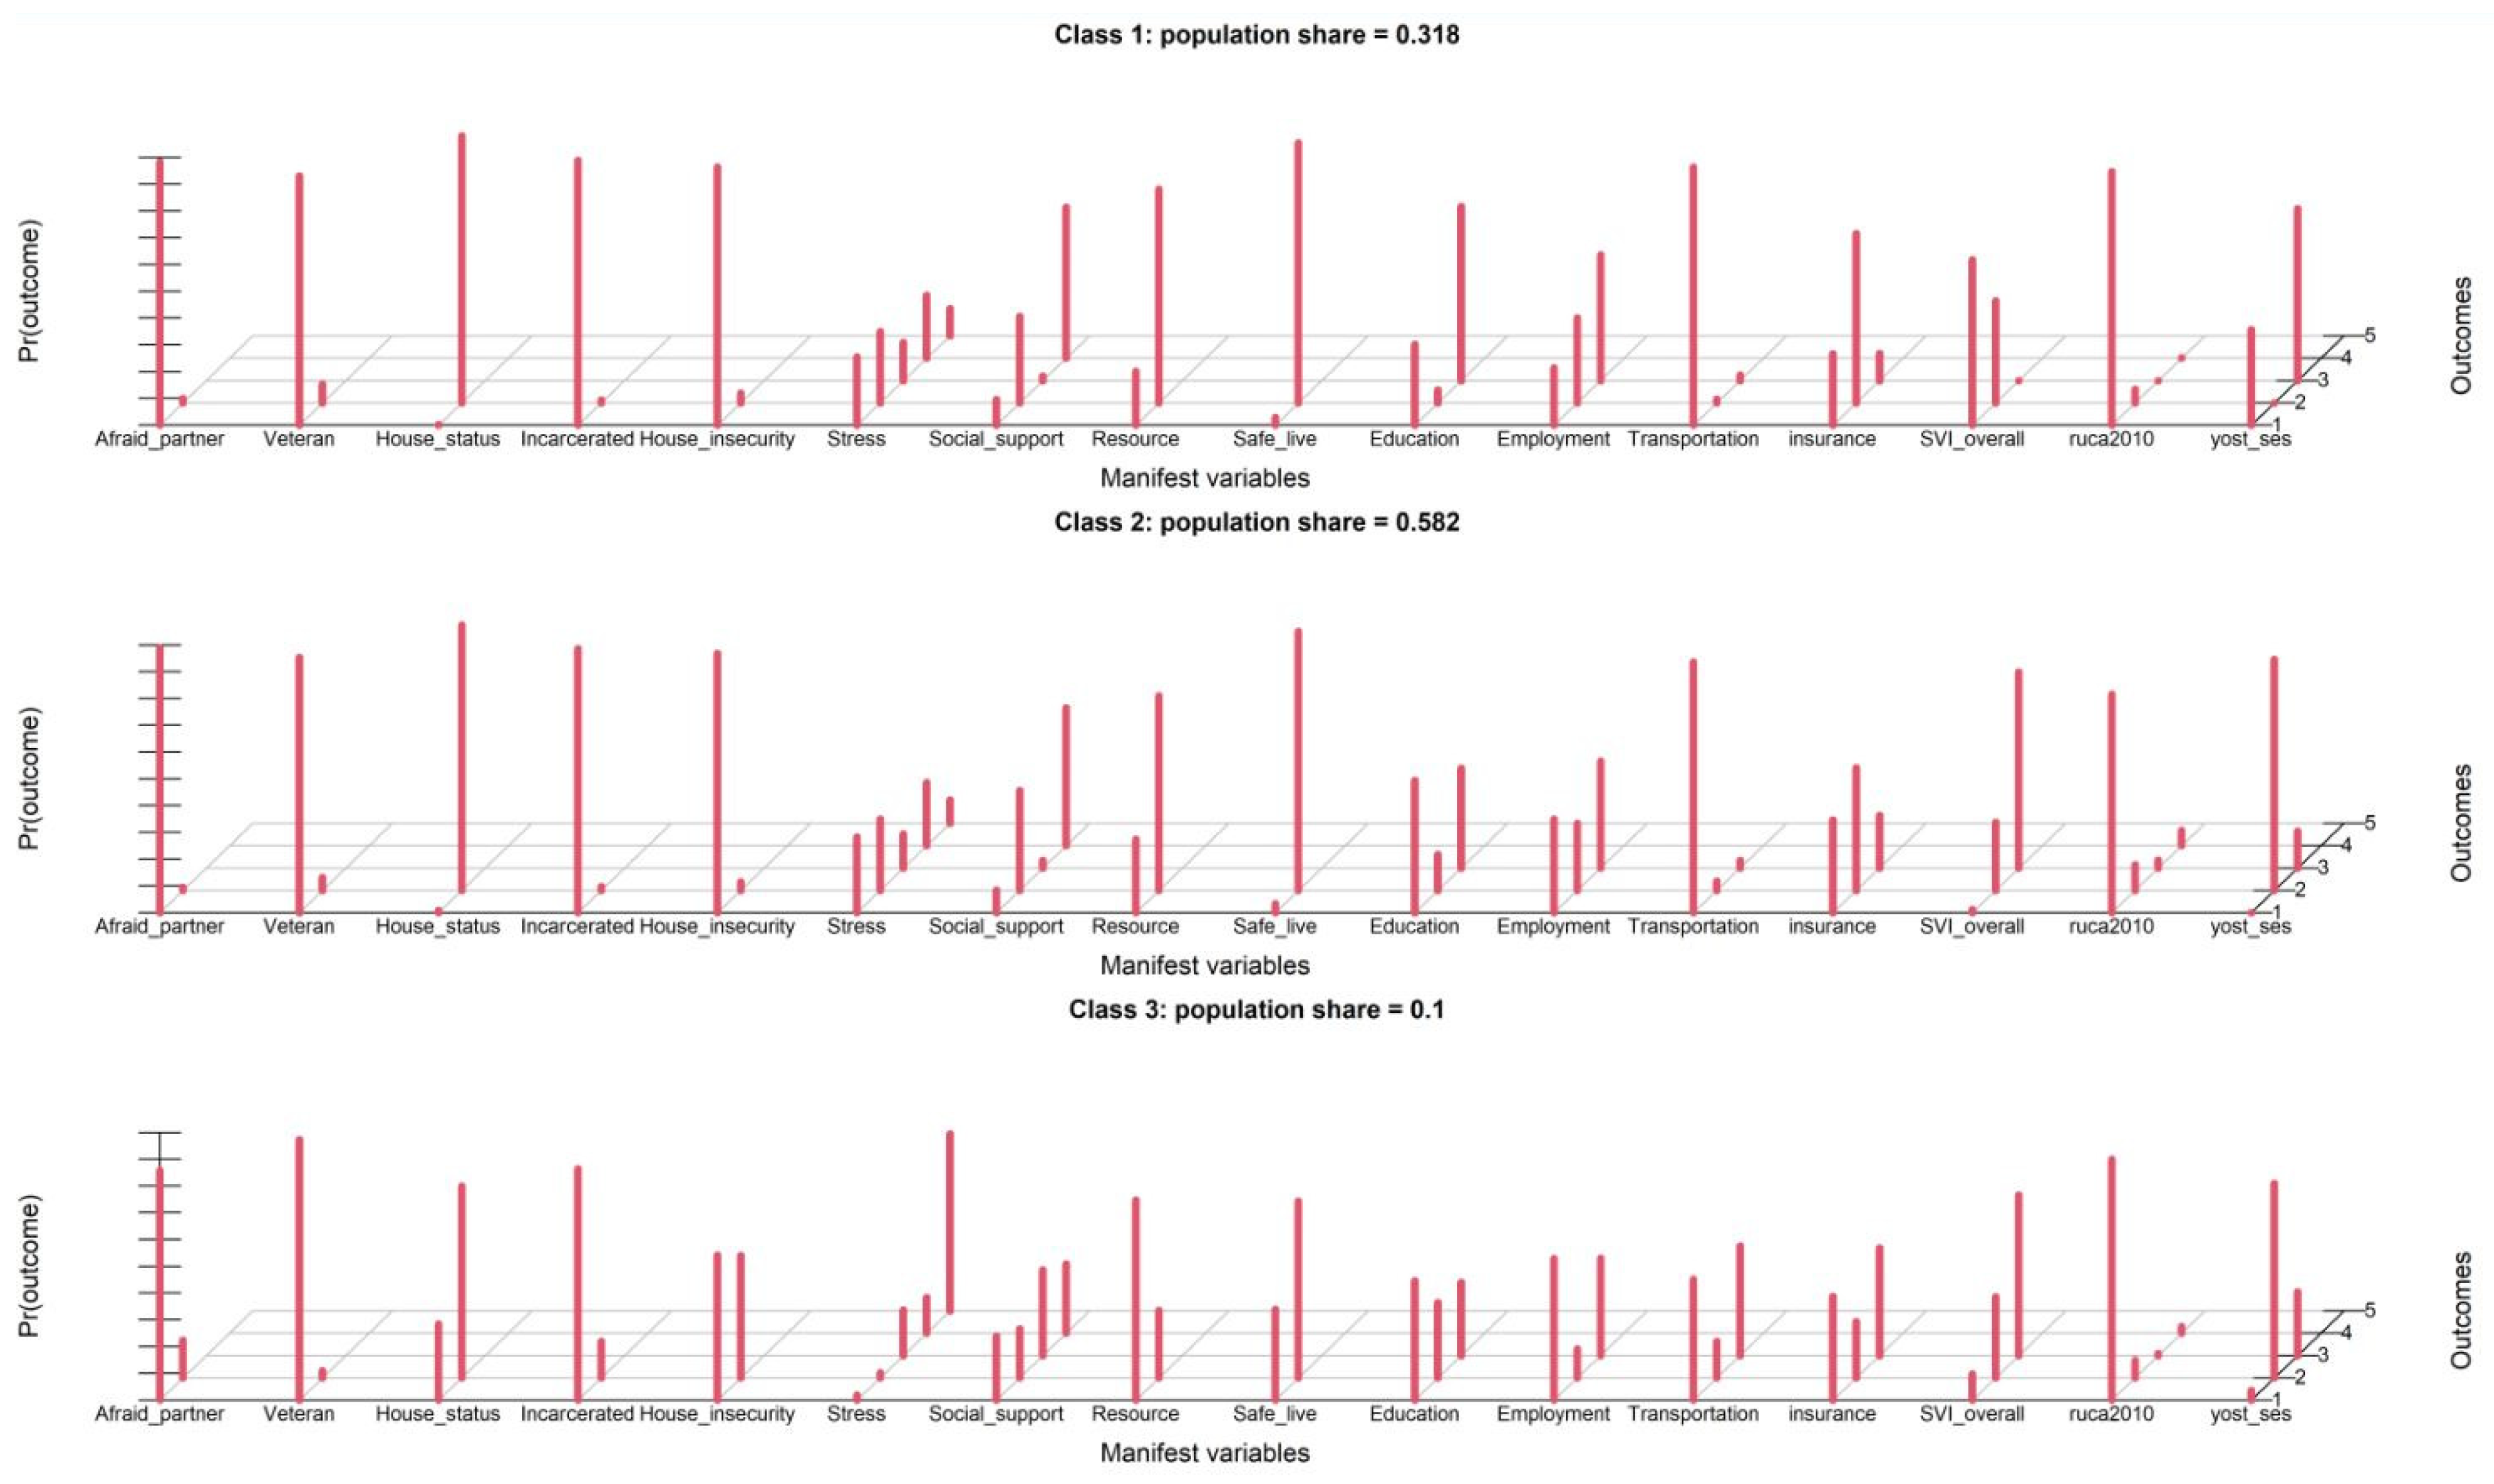
2.2.3. Latent Class Analysis (LCA)
3. Results
3.1. Exploratory Factor Analysis
3.2. Hierarchical Clustering
3.3. Latent Class Analysis
4. Discussion
5. Conclusions
Author Contributions
Funding
Institutional Review Board Statement
Informed Consent Statement
Data Availability Statement
Conflicts of Interest
References
- Williams, D.R.; Costa, M.V.; Odunlami, A.O.; Mohammed, S.A. Moving upstream: How interventions that address the social determinants of health can improve health and reduce disparities. J. Public Health Manag. Pract. 2008, 14, S8–S17. [Google Scholar] [CrossRef]
- Clay, O.J.; Ball, K.K.; Wheeler, K.M.; Crowe, M.; Marsiske, M.; Dean, L.T.; Thorpe, R.J.; Jones, R.; Owens, J.H.; Rebok, G.W. Evaluating social determinants of health domains and their predictive validity within Black/African American and white older adults from the active trial. J. Aging Health 2022, 35, 11S–18S. [Google Scholar] [CrossRef]
- Hill-Briggs, F.; Adler, N.E.; Berkowitz, S.A.; Chin, M.H.; Gary-Webb, T.L.; Navas-Acien, A.; Thornton, P.L.; Haire-Joshu, D. Social determinants of health and diabetes: A scientific review. Diabetes Care 2021, 44, 258–279. [Google Scholar] [CrossRef]
- Reshetnyak, E.; Ntamatungiro, M.; Pinheiro, L.C.; Howard, V.J.; Carson, A.P.; Martin, K.D.; Safford, M.M. Impact of multiple social determinants of health on incident stroke. Stroke 2020, 51, 2445–2453. [Google Scholar] [CrossRef]
- Magnan, S. Social determinants of health 101 for health care: Five plus five. NAM Perspect. 2017, 7. [Google Scholar] [CrossRef]
- Gottlieb, L.; Tobey, R.; Cantor, J.; Hessler, D.; Adler, N.E. Integrating social and medical data to improve population health: Opportunities and barriers. Health Aff. 2016, 35, 2116–2123. [Google Scholar] [CrossRef]
- Weir, R.C.; Proser, M.; Jester, M.; Li, V.; Hood-Ronick, C.M.; Gurewich, D. Collecting social determinants of health data in the clinical setting: Findings from national PRAPARE implementation. J. Health Care Poor Underserved 2020, 31, 1018–1035. [Google Scholar] [CrossRef]
- Howell, C.R.; Bradley, H.; Zhang, L.; Cleveland, J.D.; Long, D.; Horton, T.; Krantz, O.; Mugavero, M.J.; Williams, W.L.; Amerson, A. Real-world integration of the protocol for responding to and assessing patients’ assets, risks, and experiences tool to assess social determinants of health in the electronic medical record at an academic medical center. Digit. Health 2023, 9, 20552076231176652. [Google Scholar] [CrossRef]
- Wan, W.; Li, V.; Chin, M.H.; Faldmo, D.N.; Hoefling, E.; Proser, M.; Weir, R.C. Development of PRAPARE social determinants of health clusters and correlation with diabetes and hypertension outcomes. J. Am. Board Fam. Med. 2022, 35, 668–679. [Google Scholar] [CrossRef]
- Luzius, A.; Merriweather, M.; Busch, S.; James, O.; Dobbs, P.D. Social Risk of Pregnant Women at a Community Health Center: An Application of the PRAPARE Assessment Tool. J. Immigr. Minor. Health 2023, 25, 1–7. [Google Scholar] [CrossRef]
- Harman, H.H. Modern Factor Analysis; University of Chicago Press: Chicago, IL, USA, 1976. [Google Scholar]
- Horn, J.L. A rationale and test for the number of factors in factor analysis. Psychometrika 1965, 30, 179–185. [Google Scholar] [CrossRef] [PubMed]
- Cattell, R.B. Factor Analysis: An Introduction and Manual for the Psychologist and Social Scientist; Harper: New York, NY, USA, 1952. [Google Scholar]
- Driver, H.E.; Kroeber, A.L. Quantitative Expression of Cultural Relationships; University of California Press: Berkeley, CA, USA, 1932; Volume 31. [Google Scholar]
- Zubin, J. A technique for measuring like-mindedness. J. Abnorm. Soc. Psychol. 1938, 33, 508. [Google Scholar] [CrossRef]
- Tryon, R.C. Cluster Analysis: Correlation Profile and Orthometric (Factor) Analysis for The Isolation of Unities in Mind and Personality; Edwards Brother, Inc.: Ann Arbor, MI, USA, 1939. [Google Scholar]
- Cattell, R.B. The description of personality: Basic traits resolved into clusters. J. Abnorm. Soc. Psychol. 1943, 38, 476. [Google Scholar] [CrossRef]
- Hagenaars, J.A.; McCutcheon, A.L. Applied Latent Class Analysis; Cambridge University Press: Cambridge, UK, 2002. [Google Scholar]
- McCutcheon, A.L. Latent Class Analysis; Sage: Thousand Oaks, CA, USA, 1987. [Google Scholar]
- People, H. US Department of Health and Human Services, Office of Disease Prevention and Health Promotion. Washington, DC (2010). 2020. Available online: http://www.cdc.gov/nchs/healthy_people/hp2020.htm (accessed on 22 August 2012).
- Flanagan, B.E.; Hallisey, E.J.; Adams, E.; Lavery, A. Measuring community vulnerability to natural and anthropogenic hazards: The Centers for Disease Control and Prevention’s Social Vulnerability Index. J. Environ. Health 2018, 80, 34. [Google Scholar]
- Fabrigar, L.R.; Wegener, D.T. Exploratory Factor Analysis; Oxford University Press: Oxford, UK, 2011. [Google Scholar]
- Hoyle, R.H.; Duvall, J.L. Determining the number of factors in exploratory and confirmatory factor analysis. Handb. Quant. Methodol. Soc. Sci. 2004, 301–315. [Google Scholar]
- Hooper, D.; Coughlan, J.; Mullen, M. Structural Equation Modelling: Guidelines for Determining Model Fit. Electron. J. Bus. Res. Methods 2008, 6, 53–60. [Google Scholar]
- Shi, D.; Maydeu-Olivares, A.; DiStefano, C. The relationship between the standardized root mean square residual and model misspecification in factor analysis models. Multivar. Behav. Res. 2018, 53, 676–694. [Google Scholar] [CrossRef]
- Charrad, M.; Ghazzali, N.; Boiteau, V.; Niknafs, A. NbClust: An R package for determining the relevant number of clusters in a data set. J. Stat. Softw. 2014, 61, 1–36. [Google Scholar] [CrossRef]
- Murtagh, F.; Legendre, P. Ward’s hierarchical agglomerative clustering method: Which algorithms implement Ward’s criterion? J. Classif. 2014, 31, 274–295. [Google Scholar] [CrossRef]
- Friedman, H.P.; Rubin, J. On some invariant criteria for grouping data. J. Am. Stat. Assoc. 1967, 62, 1159–1178. [Google Scholar] [CrossRef]
- Weller, B.E.; Bowen, N.K.; Faubert, S.J. Latent class analysis: A guide to best practice. J. Black Psychol. 2020, 46, 287–311. [Google Scholar] [CrossRef]
- Schwarz, G. Estimating the dimension of a model. Ann. Stat. 1978, 6, 461–464. [Google Scholar] [CrossRef]
- Wang, M.-C.; Deng, Q.; Bi, X.; Ye, H.; Yang, W. Performance of the entropy as an index of classification accuracy in latent profile analysis: A monte carlo simulation study. Acta Psychol. Sin. 2017, 49. [Google Scholar] [CrossRef]
- Browne, M.W.; Cudeck, R. Alternative ways of assessing model fit. Sociol. Methods Res. 1992, 21, 230–258. [Google Scholar] [CrossRef]
- Javed, Z.; Kundi, H.; Chang, R.; Titus, A.; Arshad, H. Polysocial Risk Scores: Implications for Cardiovascular Disease Risk Assessment and Management. Curr. Atheroscler. Rep. 2023, 25, 1059–1068. [Google Scholar] [CrossRef]
- Kolak, M.; Bhatt, J.; Park, Y.H.; Padrón, N.A.; Molefe, A. Quantification of neighborhood-level social determinants of health in the continental United States. JAMA Netw. Open 2020, 3, e1919928. [Google Scholar] [CrossRef]
- Rethorn, Z.D.; Garcia, A.N.; Cook, C.E.; Gottfried, O.N. Quantifying the collective influence of social determinants of health using conditional and cluster modeling. PLoS ONE 2020, 15, e0241868. [Google Scholar] [CrossRef]


| Total (N = 2380) | Coded | |
|---|---|---|
| Race | ||
| White | 1182 (49.7%) | 1 |
| Black or Other | 1198 (50.3%) | 2 |
| Gender | ||
| Male | 975 (41.0%) | 1 |
| Female | 1405 (59.0%) | 2 |
| Age in year | ||
| Mean (SD) | 53.1 (16.3) | |
| Afraid of partner | ||
| No | 2318 (97.4%) | 1 |
| Yes | 62 (2.6%) | 2 |
| Migrant | ||
| No | 2366 (99.4%) | 1 |
| Yes | 14 (0.6%) | 2 |
| Refugee | ||
| No | 2371 (99.6%) | 1 |
| Yes | 9 (0.4%) | 2 |
| Veteran | ||
| No | 2255 (94.7%) | 1 |
| Yes | 125 (5.3%) | 2 |
| House status | ||
| I have housing | 2299 (96.6%) | 1 |
| I do not have housing | 81 (3.4%) | 2 |
| Incarcerated | ||
| No | 2320 (97.5%) | 1 |
| Yes | 60 (2.5%) | 2 |
| House insecurity | ||
| Not Worried About Losing Housing | 2201 (92.5%) | 1 |
| Worried About Losing Housing | 179 (7.5%) | 2 |
| Stress | ||
| Not at all | 574 (24.1%) | 1 |
| A little bit | 589 (24.7%) | 2 |
| Quite a bit | 324 (13.6%) | 3 |
| Somewhat | 537 (22.6%) | 4 |
| Very much | 356 (15.0%) | 5 |
| Social support | ||
| More than 5 times a week | 1202 (50.5%) | 1 |
| 3 to 5 times a week | 804 (33.8%) | 2 |
| 1 or 2 times a week | 246 (10.3%) | 3 |
| Less than once a week | 128 (5.4%) | 4 |
| Resource | ||
| None reported | 1670 (70.2%) | 1 |
| Needed | 710 (29.8%) | 2 |
| Language | ||
| English | 2329 (97.9%) | 1 |
| Other | 51 (2.1%) | 2 |
| Safe live | ||
| Yes | 2231 (93.7%) | 1 |
| No | 149 (6.3%) | 2 |
| Education | ||
| More than high school | 1073 (45.1%) | 1 |
| High school diploma or GED | 1018 (42.8%) | 2 |
| Less than a high school degree | 289 (12.1%) | 3 |
| Employment | ||
| Employed | 612 (25.7%) | 1 |
| Retired | 997 (41.9%) | 2 |
| Unemployed | 771 (32.4%) | 3 |
| Transportation | ||
| No need | 2135 (89.7%) | 1 |
| Non-medical need | 154 (6.5%) | 2 |
| Medical need | 91 (3.8%) | 3 |
| Insurance | ||
| Private | 1162 (48.8%) | 1 |
| Public | 774 (32.5%) | 2 |
| Self-pay | 444 (18.7%) | 3 |
| Overall SVI | ||
| Low | 508 (21.3%) | 1 |
| Moderate | 714 (30.0%) | 2 |
| High | 1158 (48.7%) | 3 |
| Urbanicity | ||
| Metropolitan | 2060 (86.6%) | 1 |
| Micropolitan | 188 (7.9%) | 2 |
| Small Town | 88 (3.7%) | 3 |
| Rural | 44 (1.8%) | 4 |
| Yost Index | ||
| High | 279 (11.7%) | 1 |
| Moderate | 734 (30.8%) | 2 |
| Low | 1367 (57.4%) | 3 |
| Total (N = 2380) | Cluster 1 (N = 783) | Cluster 2 (N = 587) | Cluster 3 (N = 593) | Cluster 4 (N = 417) | |
|---|---|---|---|---|---|
| Cluster Description | Older, mostly optimal SDoH | Housing and resources need, high stress, unemployed suboptimal SDoH | Predominantly male, most suboptimal SDoH reported | Predominantly middle aged, optimal SDoH | |
| Race | |||||
| White | 1182 (49.7%) | 398 (50.8%) | 287 (48.9%) | 335 (56.5%) | 162 (38.8%) |
| Black or Other | 1198 (50.3%) | 385 (49.2%) | 300 (51.1%) | 258 (43.5%) | 255 (61.2%) |
| Afraid of partner | |||||
| No | 2318 (97.4%) | 775 (99.0%) | 564 (96.1%) | 567 (95.6%) | 412 (98.8%) |
| Yes | 62 (2.6%) | 8 (1.0%) | 23 (3.9%) | 26 (4.4%) | 5 (1.2%) |
| Migrant | |||||
| No | 2366 (99.4%) | 778 (99.4%) | 584 (99.5%) | 588 (99.2%) | 416 (99.8%) |
| Yes | 14 (0.6%) | 5 (0.6%) | 3 (0.5%) | 5 (0.8%) | 1 (0.2%) |
| Refugee | |||||
| No | 2371 (99.6%) | 780 (99.6%) | 583 (99.3%) | 593 (100%) | 415 (99.5%) |
| Yes | 9 (0.4%) | 3 (0.4%) | 4 (0.7%) | 0 (0%) | 2 (0.5%) |
| Veteran | |||||
| No | 2255 (94.7%) | 729 (93.1%) | 560 (95.4%) | 565 (95.3%) | 401 (96.2%) |
| Yes | 125 (5.3%) | 54 (6.9%) | 27 (4.6%) | 28 (4.7%) | 16 (3.8%) |
| House status | |||||
| I have housing | 2299 (96.6%) | 773 (98.7%) | 568 (96.8%) | 547 (92.2%) | 411 (98.6%) |
| I do not have housing | 81 (3.4%) | 10 (1.3%) | 19 (3.2%) | 46 (7.8%) | 6 (1.4%) |
| Incarcerated | |||||
| No | 2320 (97.5%) | 773 (98.7%) | 574 (97.8%) | 562 (94.8%) | 411 (98.6%) |
| Yes | 60 (2.5%) | 10 (1.3%) | 13 (2.2%) | 31 (5.2%) | 6 (1.4%) |
| House insecurity | |||||
| Not Worried About Losing Housing | 2201 (92.5%) | 761 (97.2%) | 534 (91.0%) | 502 (84.7%) | 404 (96.9%) |
| Worried About Losing Housing | 179 (7.5%) | 22 (2.8%) | 53 (9.0%) | 91 (15.3%) | 13 (3.1%) |
| Gender | |||||
| Male | 975 (41.0%) | 302 (38.6%) | 227 (38.7%) | 281 (47.4%) | 165 (39.6%) |
| Female | 1405 (59.0%) | 481 (61.4%) | 360 (61.3%) | 312 (52.6%) | 252 (60.4%) |
| Stress | |||||
| Not at all | 574 (24.1%) | 373 (47.6%) | 37 (6.3%) | 11 (1.9%) | 153 (36.7%) |
| A little bit | 589 (24.7%) | 306 (39.1%) | 0 (0%) | 36 (6.1%) | 247 (59.2%) |
| Quite a bit | 324 (13.6%) | 75 (9.6%) | 150 (25.6%) | 84 (14.2%) | 15 (3.6%) |
| Somewhat | 537 (22.6%) | 26 (3.3%) | 270 (46.0%) | 239 (40.3%) | 2 (0.5%) |
| Very much | 356 (15.0%) | 3 (0.4%) | 130 (22.1%) | 223 (37.6%) | 0 (0%) |
| Social support | |||||
| More than 5 times a week | 1202 (50.5%) | 742 (94.8%) | 0 (0%) | 459 (77.4%) | 1 (0.2%) |
| 3 to 5 times a week | 804 (33.8%) | 13 (1.7%) | 417 (71.0%) | 46 (7.8%) | 328 (78.7%) |
| 1 or 2 times a week | 246 (10.3%) | 4 (0.5%) | 150 (25.6%) | 16 (2.7%) | 76 (18.2%) |
| Less than once a week | 128 (5.4%) | 24 (3.1%) | 20 (3.4%) | 72 (12.1%) | 12 (2.9%) |
| Resource | |||||
| None reported | 1670 (70.2%) | 634 (81.0%) | 330 (56.2%) | 368 (62.1%) | 338 (81.1%) |
| Needed | 710 (29.8%) | 149 (19.0%) | 257 (43.8%) | 225 (37.9%) | 79 (18.9%) |
| Language | |||||
| English | 2329 (97.9%) | 765 (97.7%) | 578 (98.5%) | 579 (97.6%) | 407 (97.6%) |
| Other | 51 (2.1%) | 18 (2.3%) | 9 (1.5%) | 14 (2.4%) | 10 (2.4%) |
| Safe live | |||||
| Yes | 2231 (93.7%) | 757 (96.7%) | 543 (92.5%) | 530 (89.4%) | 401 (96.2%) |
| No | 149 (6.3%) | 26 (3.3%) | 44 (7.5%) | 63 (10.6%) | 16 (3.8%) |
| Education | |||||
| More than high school | 1073 (45.1%) | 397 (50.7%) | 234 (39.9%) | 268 (45.2%) | 174 (41.7%) |
| High school diploma or GED | 1018 (42.8%) | 296 (37.8%) | 293 (49.9%) | 229 (38.6%) | 200 (48.0%) |
| Less than a high school degree | 289 (12.1%) | 90 (11.5%) | 60 (10.2%) | 96 (16.2%) | 43 (10.3%) |
| Employment | |||||
| Employed | 612 (25.7%) | 219 (28.0%) | 119 (20.3%) | 148 (25.0%) | 126 (30.2%) |
| Retired | 997 (41.9%) | 359 (45.8%) | 235 (40.0%) | 248 (41.8%) | 155 (37.2%) |
| Unemployed | 771 (32.4%) | 205 (26.2%) | 233 (39.7%) | 197 (33.2%) | 136 (32.6%) |
| Transportation | |||||
| No need | 2135 (89.7%) | 744 (95.0%) | 517 (88.1%) | 479 (80.8%) | 395 (94.7%) |
| Non-medical need | 154 (6.5%) | 20 (2.6%) | 37 (6.3%) | 83 (14.0%) | 14 (3.4%) |
| Medical need | 91 (3.8%) | 19 (2.4%) | 33 (5.6%) | 31 (5.2%) | 8 (1.9%) |
| AGE | |||||
| <=39 | 537 (22.6%) | 158 (20.2%) | 133 (22.7%) | 167 (28.2%) | 79 (18.9%) |
| ~<=59 | 973 (40.9%) | 291 (37.2%) | 245 (41.7%) | 241 (40.6%) | 196 (47.0%) |
| >=60 | 870 (36.6%) | 334 (42.7%) | 209 (35.6%) | 185 (31.2%) | 142 (34.1%) |
| Insurance | |||||
| Private | 1162 (48.8%) | 414 (52.9%) | 301 (51.3%) | 250 (42.2%) | 197 (47.2%) |
| Public | 774 (32.5%) | 247 (31.5%) | 179 (30.5%) | 205 (34.6%) | 143 (34.3%) |
| Self-pay | 444 (18.7%) | 122 (15.6%) | 107 (18.2%) | 138 (23.3%) | 77 (18.5%) |
| Overall SVI | |||||
| Low | 508 (21.3%) | 225 (28.7%) | 139 (23.7%) | 84 (14.2%) | 60 (14.4%) |
| Moderate | 714 (30.0%) | 236 (30.1%) | 181 (30.8%) | 181 (30.5%) | 116 (27.8%) |
| High | 1158 (48.7%) | 322 (41.1%) | 267 (45.5%) | 328 (55.3%) | 241 (57.8%) |
| Urbanicity | |||||
| Metropolitan | 2060 (86.6%) | 719 (91.8%) | 522 (88.9%) | 438 (73.9%) | 381 (91.4%) |
| Micropolitan | 188 (7.9%) | 62 (7.9%) | 58 (9.9%) | 38 (6.4%) | 30 (7.2%) |
| Small Town | 88 (3.7%) | 0 (0%) | 2 (0.3%) | 86 (14.5%) | 0 (0%) |
| Rural | 44 (1.8%) | 2 (0.3%) | 5 (0.9%) | 31 (5.2%) | 6 (1.4%) |
| Yost index | |||||
| High | 279 (11.7%) | 153 (19.5%) | 78 (13.3%) | 21 (3.5%) | 27 (6.5%) |
| Moderate | 734 (30.8%) | 241 (30.8%) | 188 (32.0%) | 180 (30.4%) | 125 (30.0%) |
| Low | 1367 (57.4%) | 389 (49.7%) | 321 (54.7%) | 392 (66.1%) | 265 (63.5%) |
| Model | BIC | aBIC | cAIC | Likelihood-Ratio | Entropy | Smallest Class Size |
|---|---|---|---|---|---|---|
| Model 1 | 49,573.21 | 49,481.07 | 49,602.21 | 14,692.14 | -- | (%) |
| Model 2 | 47,852.33 | 47,664.87 | 47,911.33 | 12,738.02 | 0.879 | 34 |
| Model 3 | 46,913.15 | 46,630.38 | 47,002.15 | 11,565.59 | 0.841 | 10 |
| Model 4 | 46,822.80 | 46,444.72 | 46,941.80 | 11,242.00 | 0.745 | 10 |
| Model 5 | 46,834.79 | 46,361.38 | 46,983.79 | 11,020.74 | 0.715 | 7 |
| Model 6 | 46,870.66 | 46,301.93 | 47,049.66 | 10,823.36 | 0.689 | 6 |
Disclaimer/Publisher’s Note: The statements, opinions and data contained in all publications are solely those of the individual author(s) and contributor(s) and not of MDPI and/or the editor(s). MDPI and/or the editor(s) disclaim responsibility for any injury to people or property resulting from any ideas, methods, instructions or products referred to in the content. |
© 2024 by the authors. Licensee MDPI, Basel, Switzerland. This article is an open access article distributed under the terms and conditions of the Creative Commons Attribution (CC BY) license (https://creativecommons.org/licenses/by/4.0/).
Share and Cite
Zhang, L.; Clay, O.J.; Lee, S.-Y.; Howell, C.R. Analyzing Multiple Social Determinants of Health Using Different Clustering Methods. Int. J. Environ. Res. Public Health 2024, 21, 145. https://doi.org/10.3390/ijerph21020145
Zhang L, Clay OJ, Lee S-Y, Howell CR. Analyzing Multiple Social Determinants of Health Using Different Clustering Methods. International Journal of Environmental Research and Public Health. 2024; 21(2):145. https://doi.org/10.3390/ijerph21020145
Chicago/Turabian StyleZhang, Li, Olivio J. Clay, Seung-Yup Lee, and Carrie R. Howell. 2024. "Analyzing Multiple Social Determinants of Health Using Different Clustering Methods" International Journal of Environmental Research and Public Health 21, no. 2: 145. https://doi.org/10.3390/ijerph21020145
APA StyleZhang, L., Clay, O. J., Lee, S.-Y., & Howell, C. R. (2024). Analyzing Multiple Social Determinants of Health Using Different Clustering Methods. International Journal of Environmental Research and Public Health, 21(2), 145. https://doi.org/10.3390/ijerph21020145