
Biological Sex Disparities in the Economic Burden of Tobacco Use: A Comparative Analysis between Men and Women in China

Abstract
1. Introduction
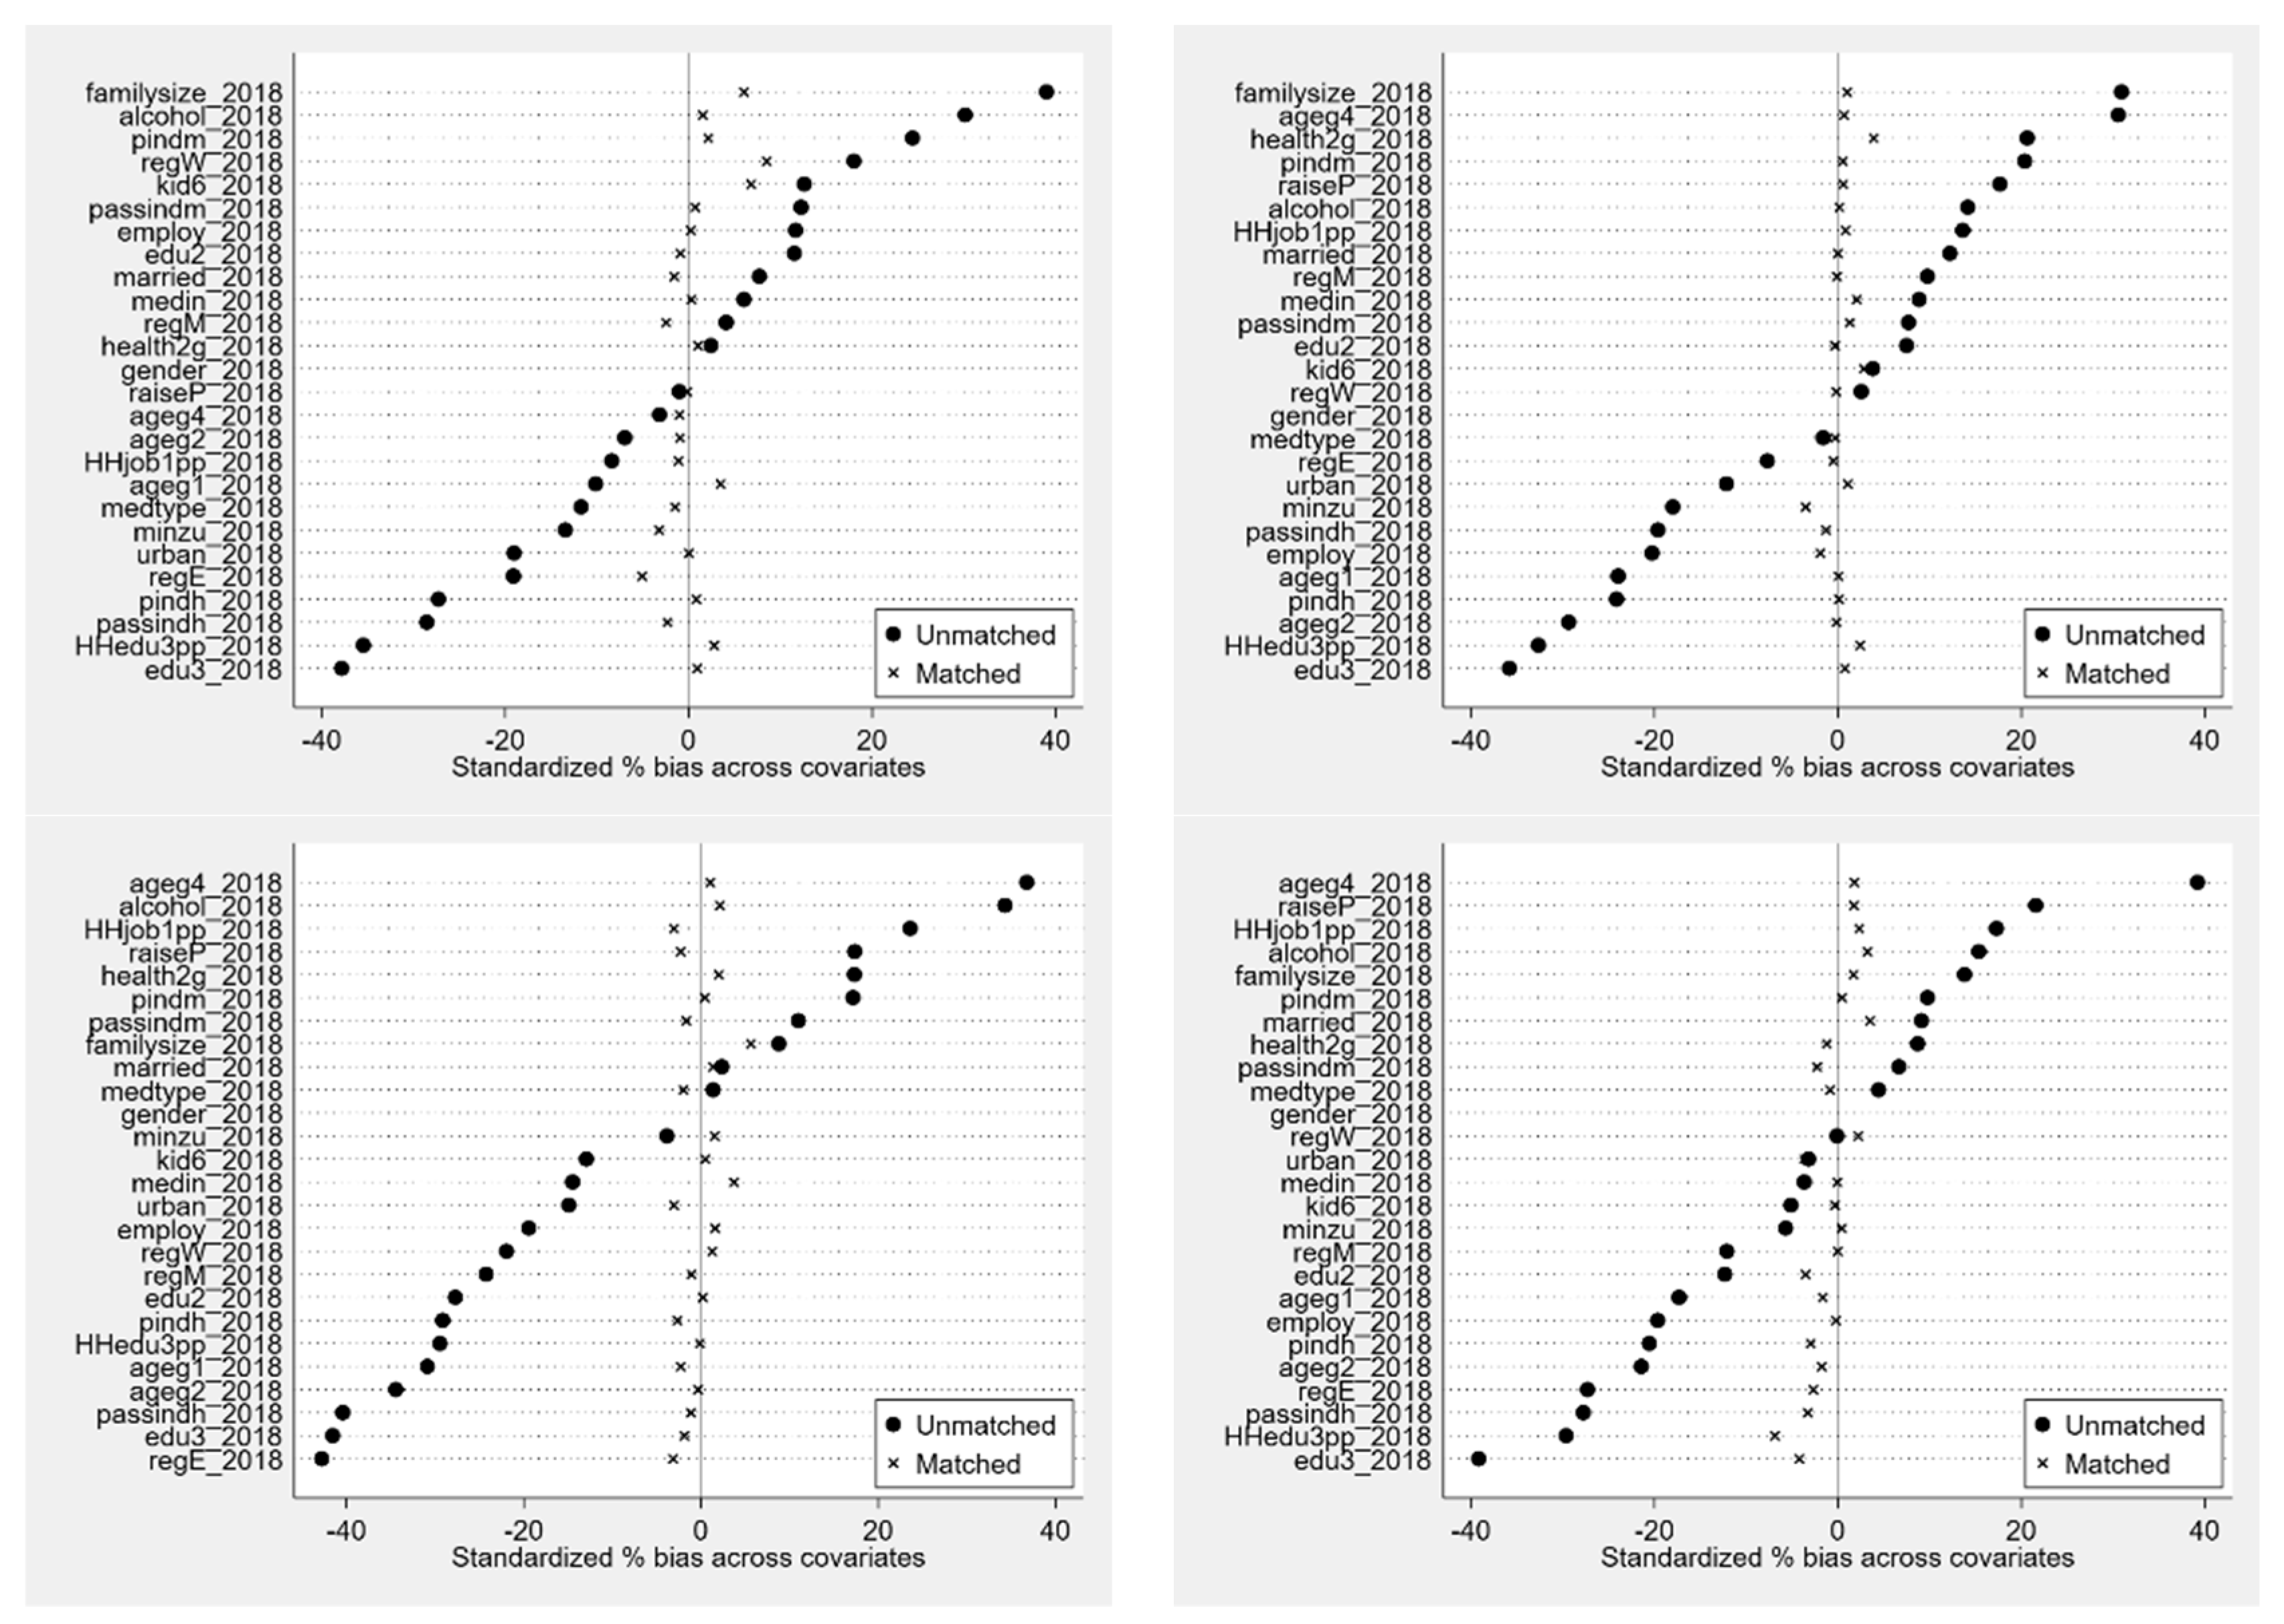
2. Data and Methods
3. Results
3.1. Direct Economic Cost
3.2. Indirect Economic Cost
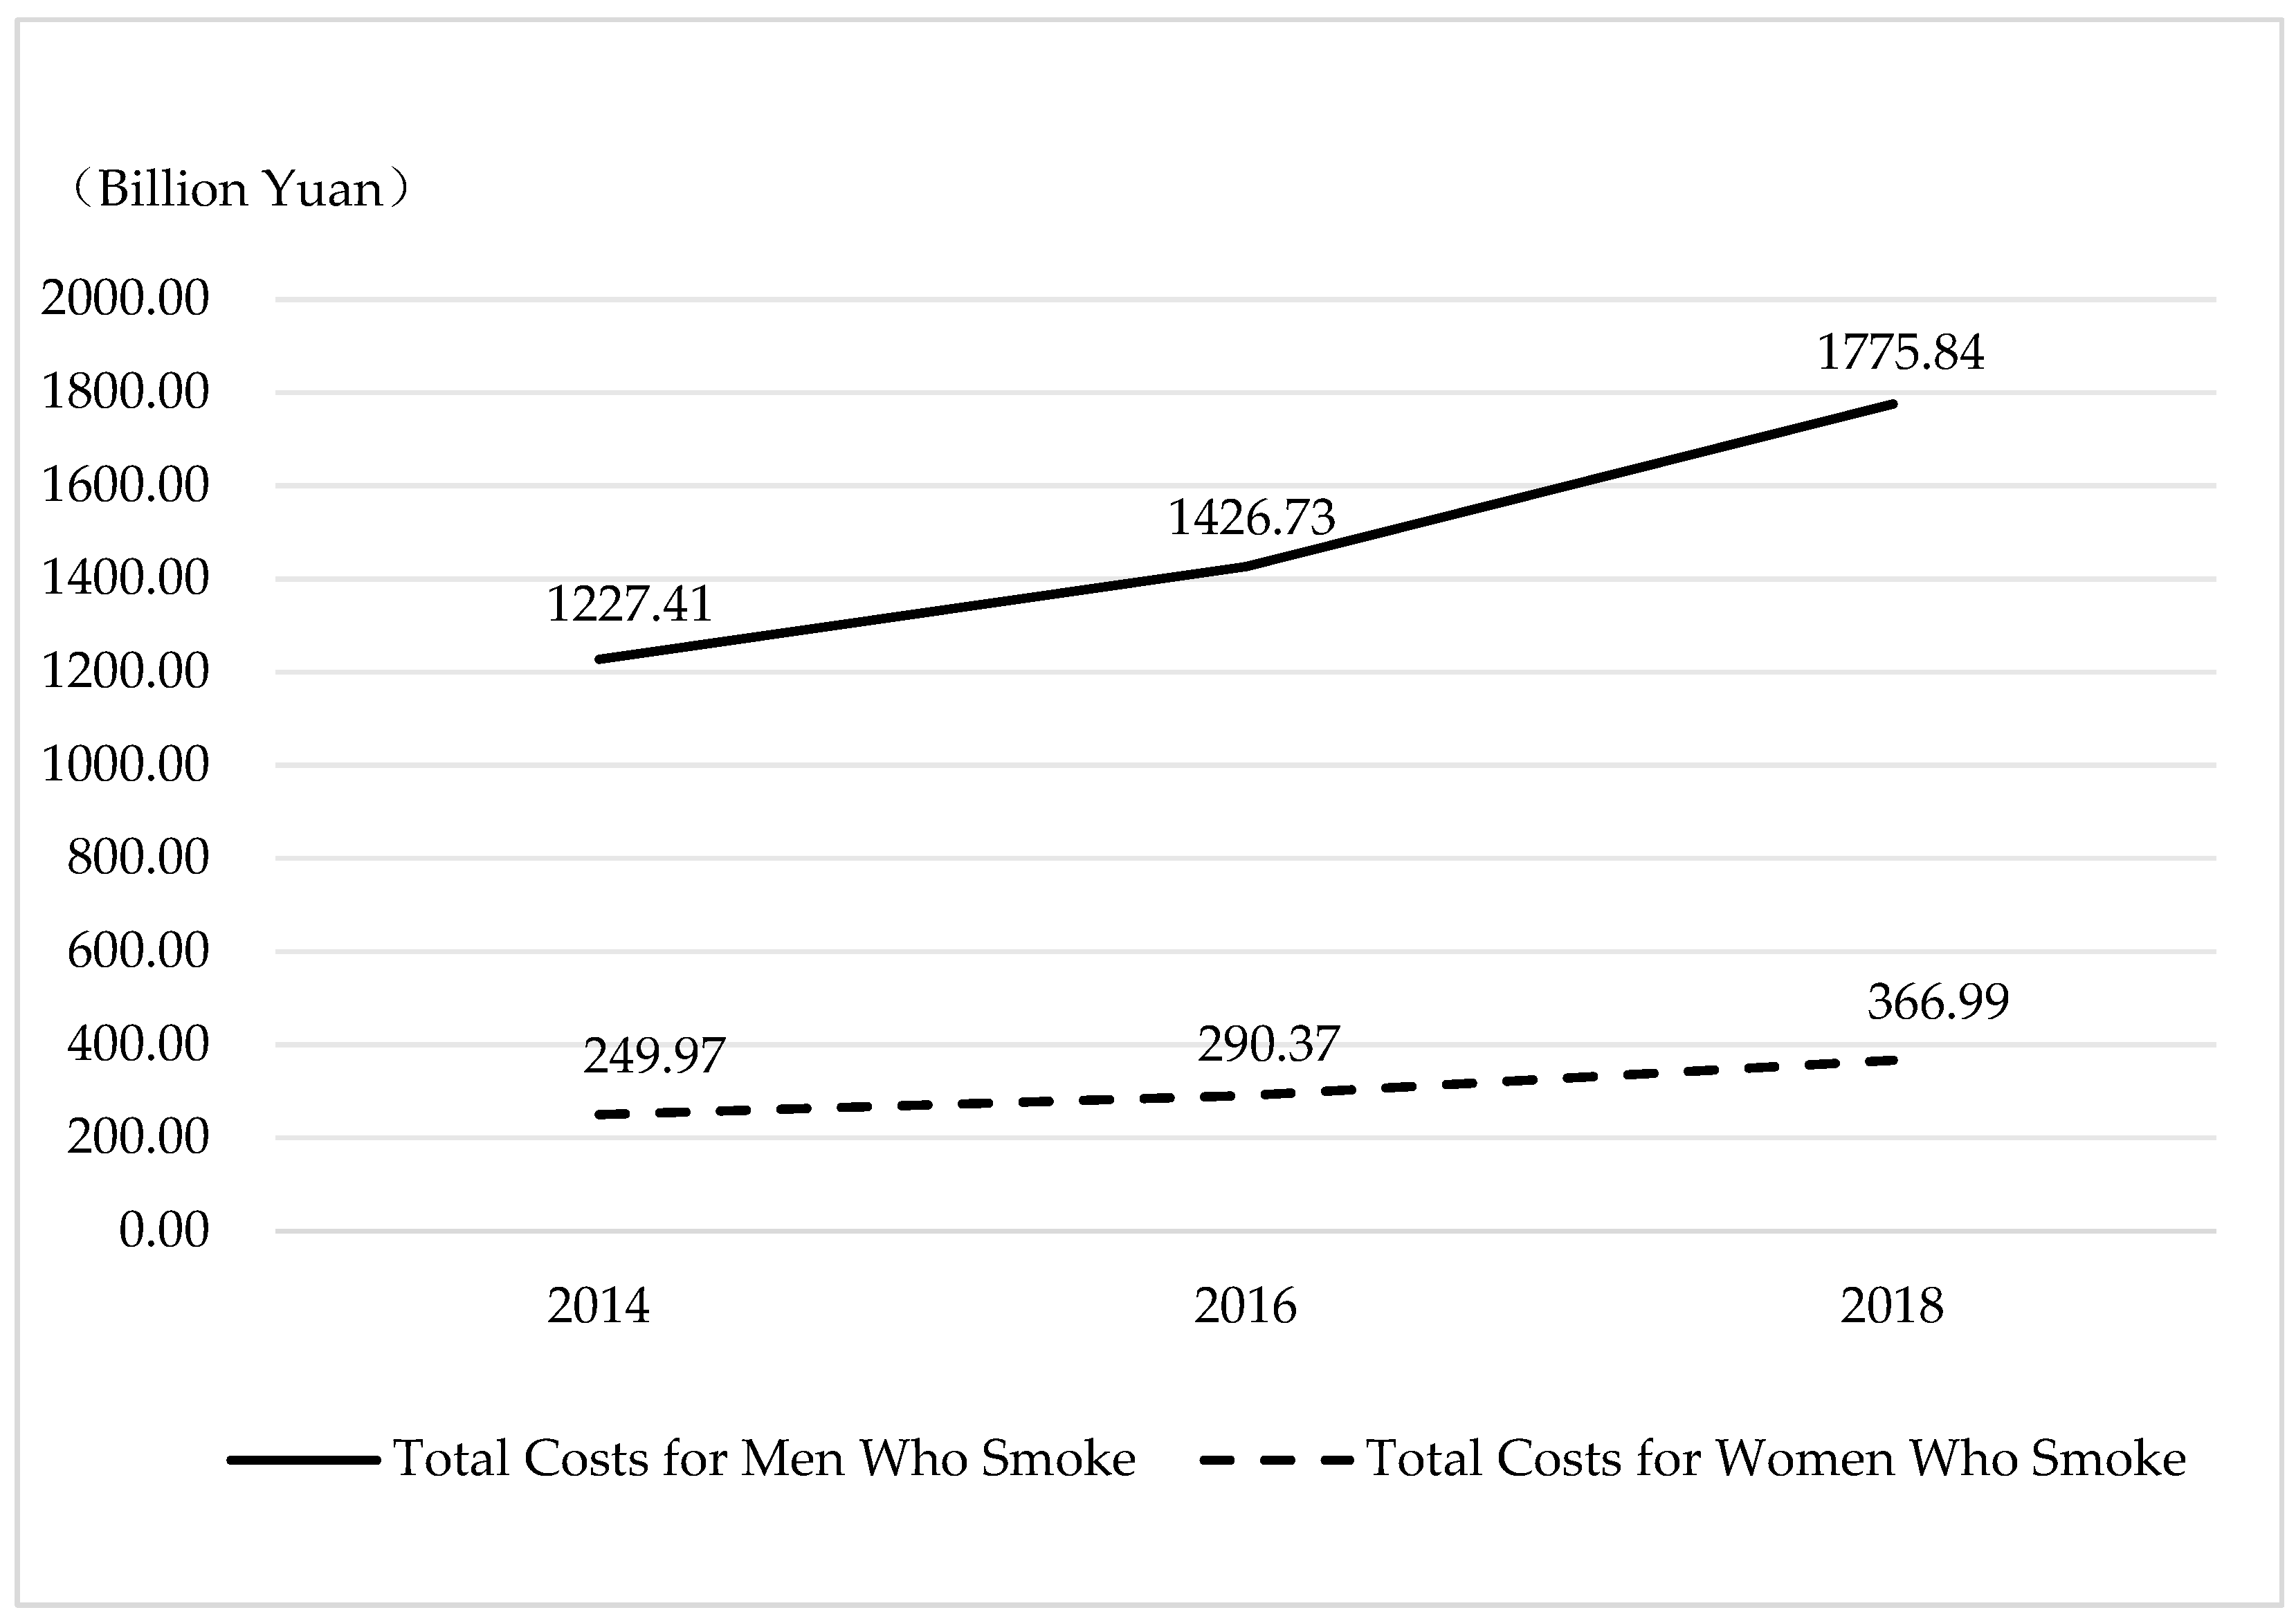
3.3. Total Economic Cost
4. Limitations
5. Conclusions
Supplementary Materials
Author Contributions
Funding
Institutional Review Board Statement
Informed Consent Statement
Data Availability Statement
Conflicts of Interest
References
- World Health Organization. WHO Global Report on Trends in Prevalence of Tobacco Use 2000–2025, 3rd ed.; World Health Organization: Geneva, Switzerland, 2019; Available online: https://www.who.int/publications-detail/who-global-report-on-trends-in-prevalence-of-tobacco-use-2000-2025-third-edition (accessed on 13 July 2024).
- Global Adults Tobacco Survey (GATS 2022) Conducted by China CDC in 2022. Available online: https://m.chinacdc.cn/xwzx/gwxx/202205/t20220526_259370.html (accessed on 13 July 2024).
- Hogg, J.C.; Wright, J.L.; Wiggs, B.R.; Coxson, H.O.; Saez, A.O.; Pare, P.D. Lung structure and function in cigarette smokers. Thorax 1994, 49, 473–478. [Google Scholar] [CrossRef] [PubMed]
- Ambrose, J.A.; Barua, R.S. The pathophysiology of cigarette smoking and cardiovascular disease: An update. J. Am. Coll. Cardiol. 2004, 43, 1731–1737. [Google Scholar] [CrossRef] [PubMed]
- Bernhard, D.; Moser, C.; Backovic, A.; Wick, G. Cigarette smoke–an aging accelerator? Exp. Gerontol. 2007, 42, 160–165. [Google Scholar] [CrossRef] [PubMed]
- Alberg, A.J.; Samet, J.M. Epidemiology of lung cancer. Chest 2003, 123, 21S–49S. [Google Scholar] [CrossRef] [PubMed]
- Murray, C.J.; Aravkin, A.Y.; Zheng, P.; Abbafati, C.; Abbas, K.M.; Abbasi-Kangevari, M.; Abd-Allah, F.; Abdelalim, A.; Abdollahi, M.; Abdollahpour, I.; et al. Global burden of 87 risk factors in 204 countries and territories, 1990–2019: A systematic analysis for the Global Burden of Disease Study 2019. Lancet 2019, 396, 1223–1249. [Google Scholar] [CrossRef] [PubMed]
- Chan, K.H.; Wright, N.; Xiao, D.; Guo, Y.; Chen, Y.; Du, H.; Yang, L.; Millwood, I.Y.; Pei, P.; Wang, J.; et al. Tobacco smoking and risks of more than 470 diseases in China: A prospective cohort study. Lancet Public Health 2022, 7, e1014–e1026. [Google Scholar] [CrossRef] [PubMed]
- Institute for Health Metrics and Evaluation. Available online: https://www.healthdata.org/research-analysis/diseases-injuries-risks/factsheets/2021-smoking-level-3-risk (accessed on 13 July 2024).
- World Health Organization. Economics of Tobacco Toolkit: Assessment of the Economic Costs of Smoking. 2011. Available online: https://apps.who.int/iris/handle/10665/44596 (accessed on 13 July 2024).
- Jiang, Y.; Elton-Marshall, T.; Fong, G.T.; Li, Q. Quitting smoking in China: Findings from the ITC China Survey. Tob. Control. 2010, 19 (Suppl. S2), i12–i17. [Google Scholar] [CrossRef] [PubMed]
- Sung, H.Y.; Wang, L.; Jin, S.; Hu, T.W.; Jiang, Y. Economic Burden of Smoking in China, 2000. Tob. Control. 2006, 15, i5–i11. [Google Scholar] [CrossRef] [PubMed]
- Long, Y.; Liu, X.D.; Duan, L.P.; Lu, J.; Yan, Y.P.; Zhang, L.; Hu, J.X.; Huang, J.Y.; Xu, D.Z. Evaluation on the indirect economic burden of stroke using combination of disability-adjusted life years and human capital method. Chin. J. Epidemiol. 2007, 28, 708–711. [Google Scholar] [PubMed]
- Barnum, H. Evaluating healthy days of life gained from health projects. Soc. Sci. Med. 1987, 24, 833–841. [Google Scholar] [CrossRef] [PubMed]
- Institute for Health Metrics and Evaluation. Available online: https://ghdx.healthdata.org/sites/default/files/images/gather_code_sharing/gbd2020/risk_factors_flowcharts/smoking_shs.png (accessed on 13 July 2024).
- Institute for Health Metrics and Evaluation. Available online: https://www.healthdata.org/research-analysis/diseases-injuries-risks/factsheets/2021-secondhand-smoke-level-3-risk (accessed on 13 July 2024).
- Vos, T.; Lim, S.S.; Abbafati, C.; Abbas, K.M.; Abbasi, M.; Abbasifard, M.; Abbasi-Kangevari, M.; Abbastabar, H.; Abd-Allah, F.; Abdelalim, A.; et al. Global burden of 369 diseases and injuries in 204 countries and territories, 1990–2019: A systematic analysis for the Global Burden of Disease Study 2019. Lancet 2020, 396, 1204–1222. [Google Scholar] [CrossRef] [PubMed]

| Year | People Who Have Previously Smoked | People Who Are Currently Smoking | ||||||
|---|---|---|---|---|---|---|---|---|
| Men | Women | Men | Women | |||||
| ATT | t-Value | ATT | t-Value | ATT | t-Value | ATT | t-Value | |
| 2014 | 709.68 *** | 4.38 | 297.12 | 0.87 | −77.90 | −0.63 | −221.13 | −0.99 |
| (161.89) | (343.45) | (122.86) | (223.97) | |||||
| 2016 | 711.95 *** | 3.67 | 721.24 | 1.84 | −168.41 | −1.07 | −112.13 | −0.36 |
| (194.14) | (392.63) | (157.52) | (314.57) | |||||
| 2018 | 864.50 *** | 3.68 | 597.11 | 1.46 | −92.50 | −0.50 | −201.99 | −0.55 |
| (234.94) | (408.71) | (185.84) | (367.04) | |||||
| Year | Biological Sex | Total Indirect Costs | Smoking | Passive Smoking |
|---|---|---|---|---|
| 2014 | Men | 1152.33 | 1104.28 | 96.72 |
| Women | 249.97 | 144.85 | 118.42 | |
| 2016 | Men | 1350.58 | 1294.55 | 112.95 |
| Women | 290.37 | 168.52 | 137.09 | |
| 2018 | Men | 1682.65 | 1615.52 | 137.81 |
| Women | 366.99 | 213.99 | 172.22 |
Disclaimer/Publisher’s Note: The statements, opinions and data contained in all publications are solely those of the individual author(s) and contributor(s) and not of MDPI and/or the editor(s). MDPI and/or the editor(s) disclaim responsibility for any injury to people or property resulting from any ideas, methods, instructions or products referred to in the content. |
© 2024 by the authors. Licensee MDPI, Basel, Switzerland. This article is an open access article distributed under the terms and conditions of the Creative Commons Attribution (CC BY) license (https://creativecommons.org/licenses/by/4.0/).
Share and Cite
Zheng, R.; Meng, L.; He, A. Biological Sex Disparities in the Economic Burden of Tobacco Use: A Comparative Analysis between Men and Women in China. Int. J. Environ. Res. Public Health 2024, 21, 980. https://doi.org/10.3390/ijerph21080980
Zheng R, Meng L, He A. Biological Sex Disparities in the Economic Burden of Tobacco Use: A Comparative Analysis between Men and Women in China. International Journal of Environmental Research and Public Health. 2024; 21(8):980. https://doi.org/10.3390/ijerph21080980
Chicago/Turabian StyleZheng, Rong, Lingyun Meng, and Aduqinfu He. 2024. "Biological Sex Disparities in the Economic Burden of Tobacco Use: A Comparative Analysis between Men and Women in China" International Journal of Environmental Research and Public Health 21, no. 8: 980. https://doi.org/10.3390/ijerph21080980
APA StyleZheng, R., Meng, L., & He, A. (2024). Biological Sex Disparities in the Economic Burden of Tobacco Use: A Comparative Analysis between Men and Women in China. International Journal of Environmental Research and Public Health, 21(8), 980. https://doi.org/10.3390/ijerph21080980