
The Childhood Opportunity Index 2.0: Factor Structure in 9–10 Year Olds in the Adolescent Brain Cognitive Development Study
 , , ,
, , ,
Abstract
1. Neighborhood Quality
2. Rationale to Investigate Aspects of the Built and Natural Environment over and Above Socioeconomic Status
3. Rationale to Investigate Psychopathology and Behavioral Endophenotypes
4. Links Between the COI and Psychopathology
5. Rationale for Factor Analysis of the COI 2.0 Among Youths in the ABCD Study
6. Materials and Methods
Participants
7. Measures
7.1. Neighborhood Quality
7.2. External Criteria
8. Statistical Analysis
9. Results
9.1. Aim 1
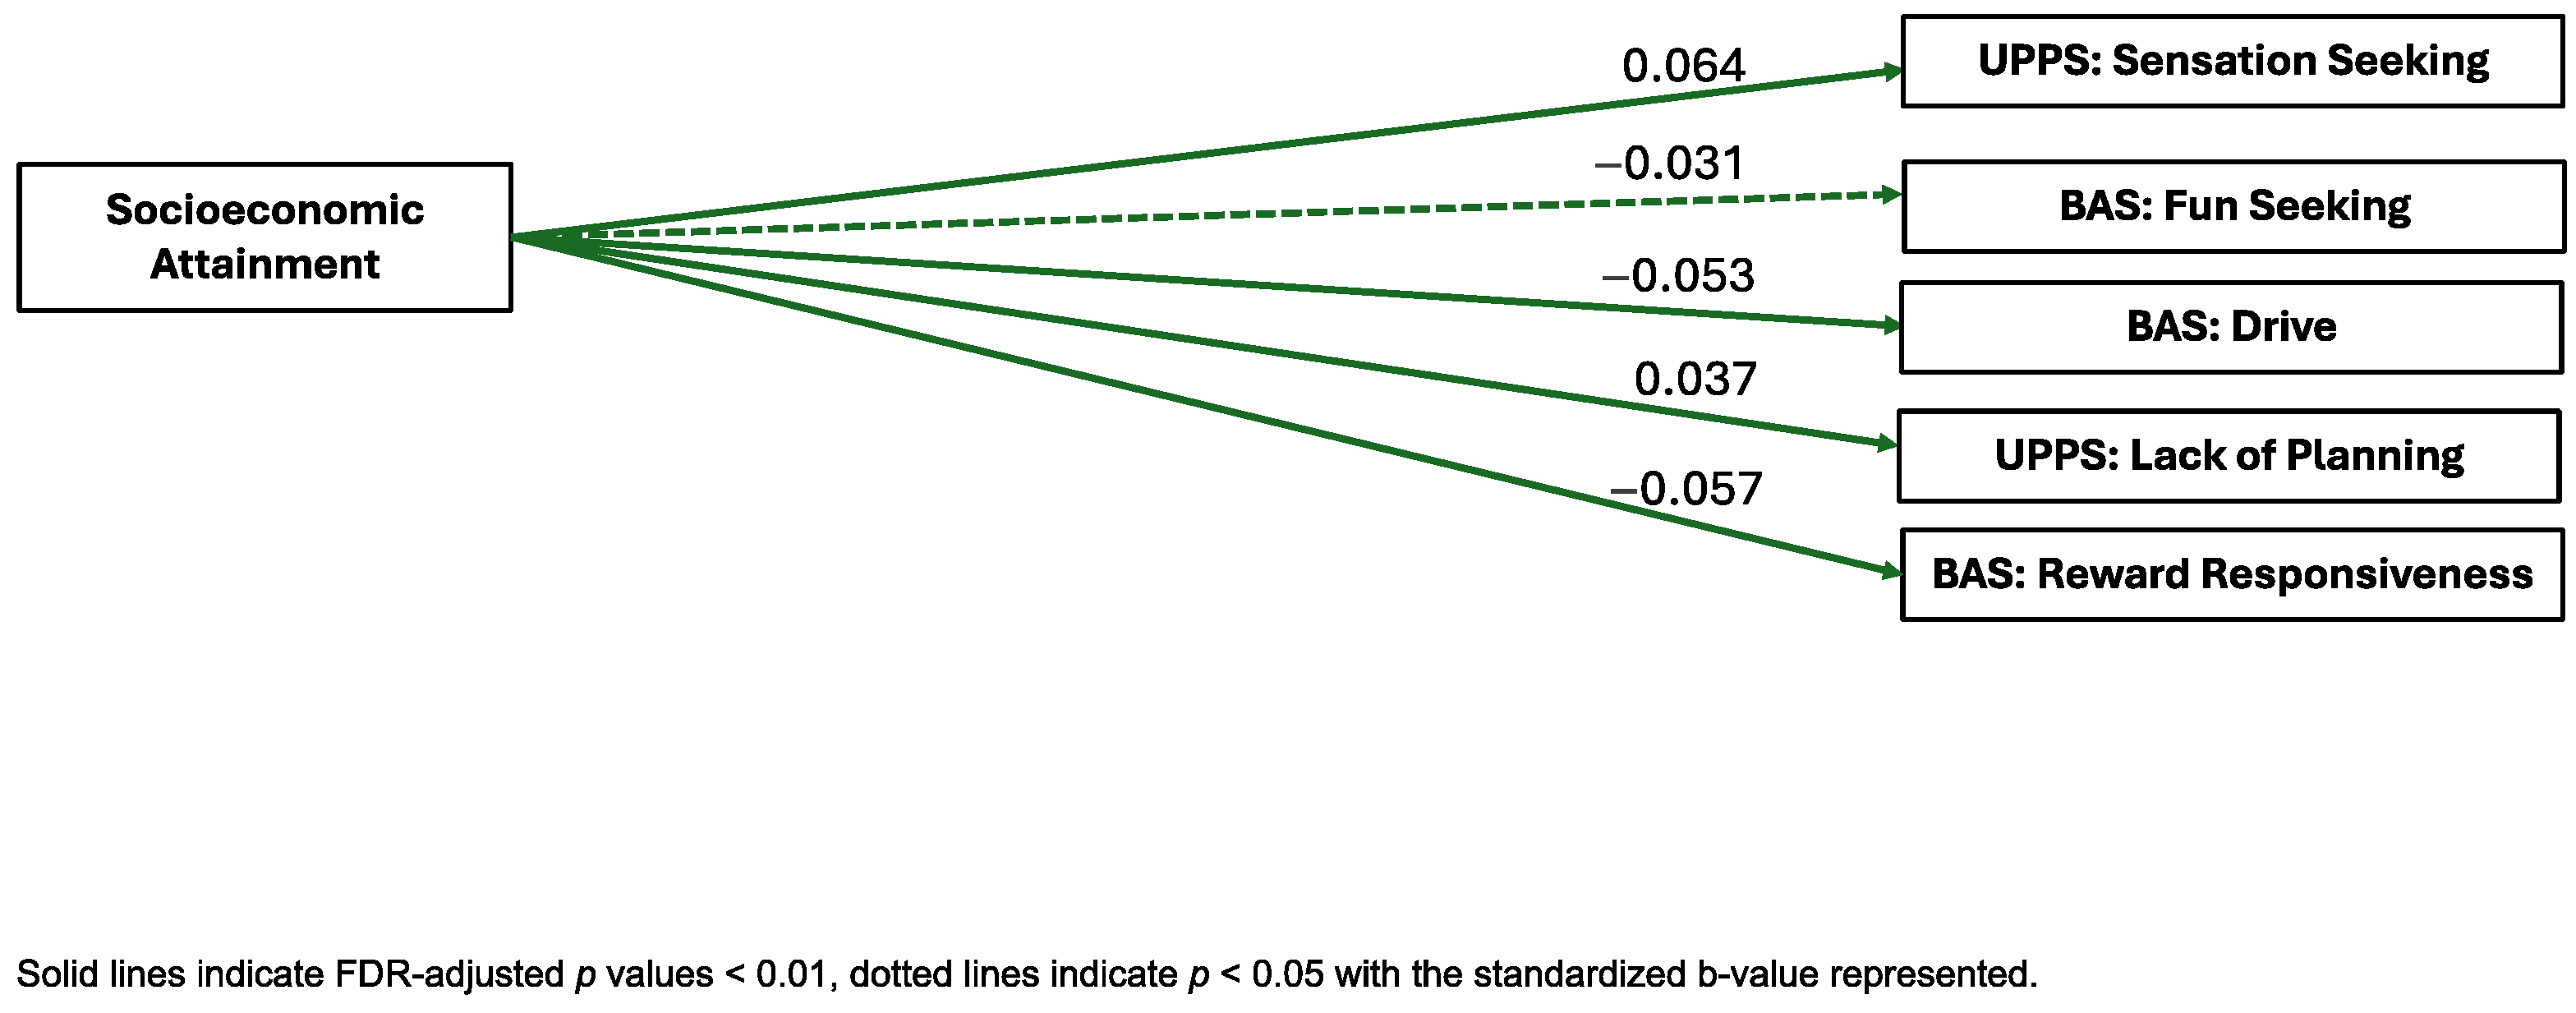
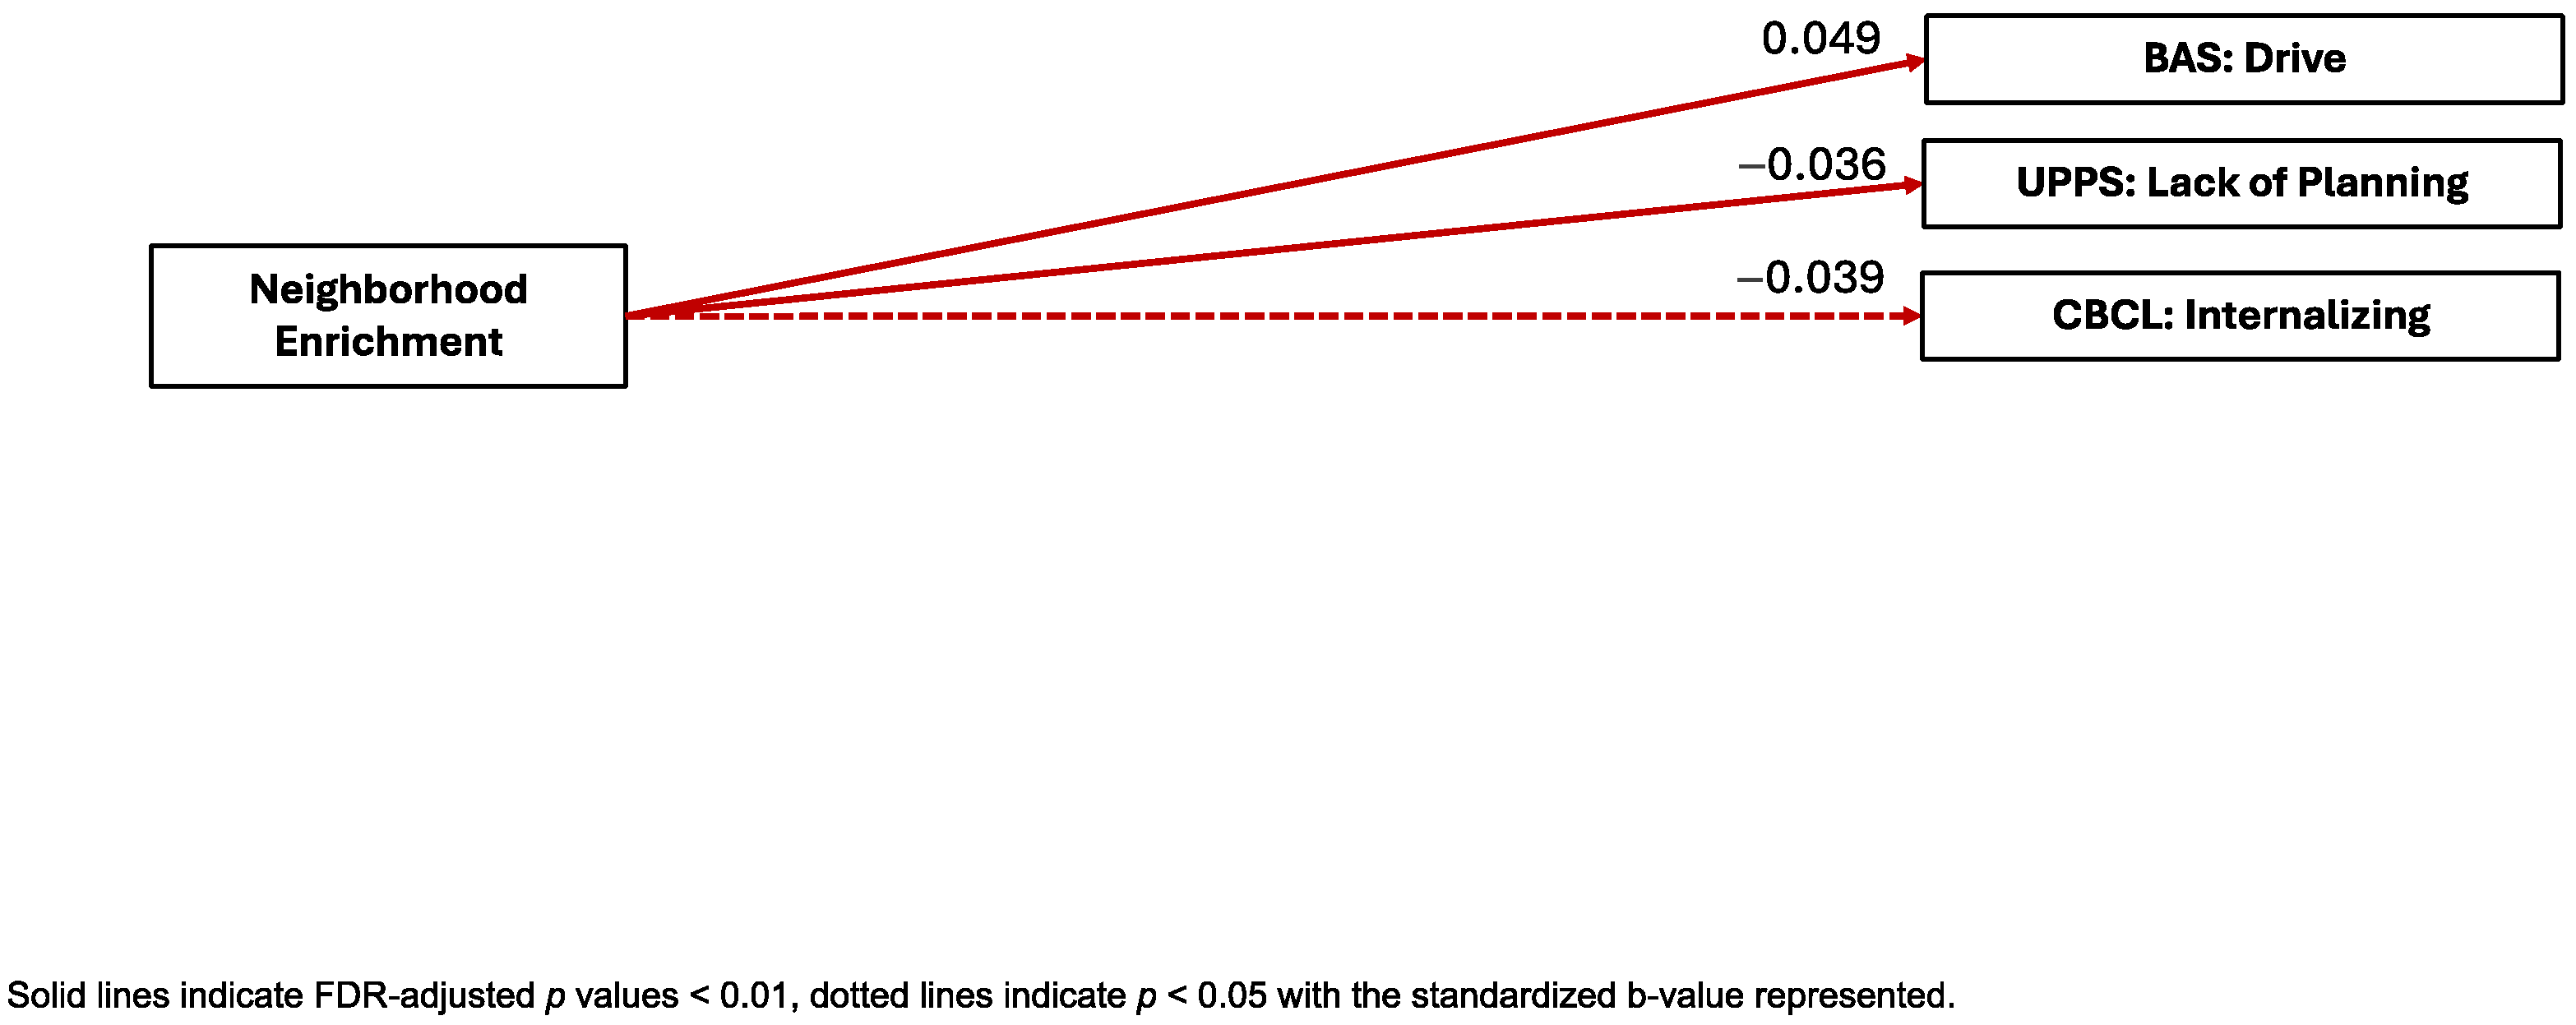
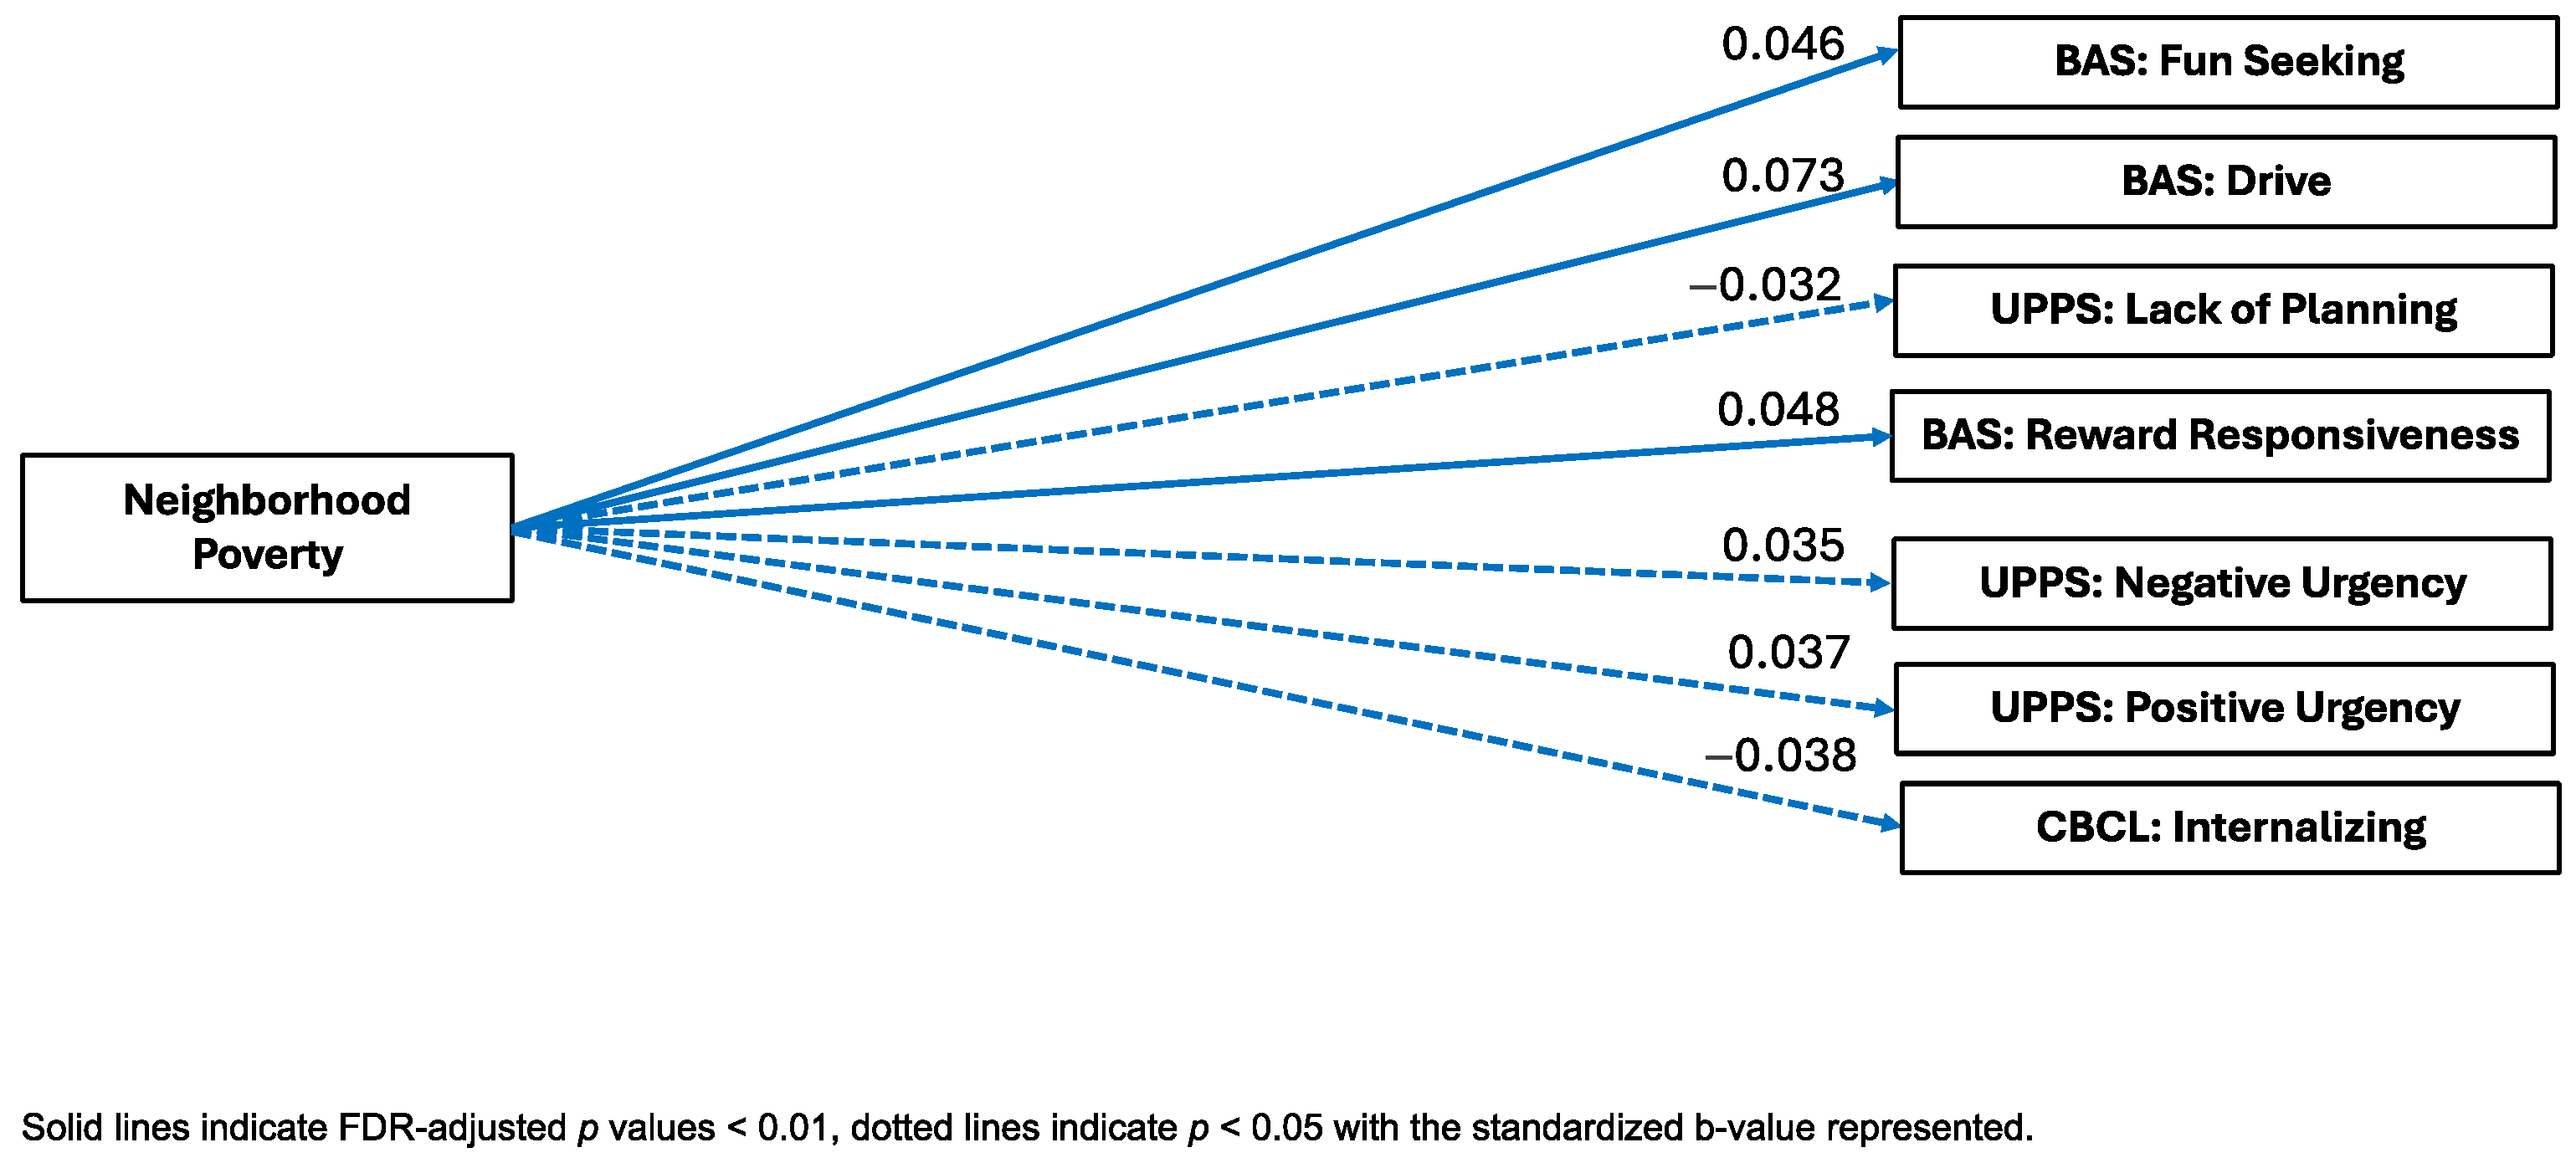
9.2. Aim 2
10. Discussion
11. Factor Structure
12. Cross-Sectional Links Between Neighborhood Opportunity and External Criterion
12.1. Behavioral Activation System
12.2. UPPS-P
12.3. Positive and Negative Urgency
12.4. Psychopathology
13. Limitations
14. Conclusions
Supplementary Materials
Author Contributions
Funding
Institutional Review Board Statement
Informed Consent Statement
Data Availability Statement
Conflicts of Interest
References
- Benson, C. Poverty in States and Metropolitan Areas: 2022. Available online: https://www.census.gov/content/dam/Census/library/publications/2023/acs/acsbr-016.pdf (accessed on 4 February 2025).
- Stafford, M.; Marmot, M. Neighbourhood deprivation and health: Does it affect us all equally? Int. J. Epidemiol. 2003, 32, 357–366. [Google Scholar] [CrossRef] [PubMed]
- Rakesh, D.; Zalesky, A.; Whittle, S. Assessment of Parent Income and Education, Neighborhood Disadvantage, and Child Brain Structure. JAMA Netw. Open 2022, 5, e2226208. [Google Scholar] [CrossRef] [PubMed]
- Acevedo-Garcia, D.; Noelke, C.; McArdle, N.; Sofer, N.; Hardy, E.F.; Weiner, M.; Baek, M.; Huntington, N.; Huber, R.; Reece, J. Racial and Ethnic Inequities in Children’s Neighborhoods: Evidence from the New Child Opportunity Index 2.0. Health Aff. Proj. Hope 2020, 39, 1693–1701. [Google Scholar] [CrossRef] [PubMed]
- Forns, J.; Torrent, M.; Garcia-Esteban, R.; Cáceres, A.; Pilar Gomila, M.; Martinez, D.; Morales, E.; Julvez, J.; Grimalt, J.O.; Sunyer, J. Longitudinal association between early life socio-environmental factors and attention function at the age 11 years. Environ. Res. 2012, 117, 54–59. [Google Scholar] [CrossRef]
- Packard, C.J.; Bezlyak, V.; McLean, J.S.; Batty, G.D.; Ford, I.; Burns, H.; Cavanagh, J.; Deans, K.A.; Henderson, M.; McGinty, A.; et al. Early life socioeconomic adversity is associated in adult life with chronic inflammation, carotid atherosclerosis, poorer lung function and decreased cognitive performance: A cross-sectional, population-based study. BMC Public Health 2011, 11, 42. [Google Scholar] [CrossRef]
- Hackman, D.A.; Cserbik, D.; Chen, J.-C.; Berhane, K.; Minaravesh, B.; McConnell, R.; Herting, M.M. Association of Local Variation in Neighborhood Disadvantage in Metropolitan Areas with Youth Neurocognition and Brain Structure. JAMA Pediatr. 2021, 175, e210426. [Google Scholar] [CrossRef]
- Browning, C.R.; Calder, C.A.; Boettner, B.; Tarrence, J.; Khan, K.; Soller, B.; Ford, J. Neighborhoods, Activity Spaces, and the Span of Adolescent Exposures. Am. Sociol. Rev. 2021, 86, 201–233. [Google Scholar] [CrossRef]
- Rakesh, D.; Cropley, V.; Zalesky, A.; Vijayakumar, N.; Allen, N.B.; Whittle, S. Neighborhood disadvantage and longitudinal brain-predicted-age trajectory during adolescence. Dev. Cogn. Neurosci. 2021, 51, 101002. [Google Scholar] [CrossRef]
- Brooks-Gunn, J.; Duncan, G.J. The Effects of Poverty on Children. Future Child. 1997, 7, 55–71. [Google Scholar] [CrossRef]
- Fan, C.C.; Marshall, A.; Smolker, H.; Gonzalez, M.R.; Tapert, S.F.; Barch, D.M.; Sowell, E.; Dowling, G.J.; Cardenas-Iniguez, C.; Ross, J.; et al. Adolescent Brain Cognitive Development (ABCD) study Linked External Data (LED): Protocol and practices for geocoding and assignment of environmental data. Dev. Cogn. Neurosci. 2021, 52, 101030. [Google Scholar] [CrossRef]
- Ha, S.; Yeung, E.; Bell, E.; Insaf, T.; Ghassabian, A.; Bell, G.; Muscatiello, N.; Mendola, P. Prenatal and early life exposures to ambient air pollution and development. Environ. Res. 2019, 174, 170–175. [Google Scholar] [CrossRef]
- Wang, P.; Tuvblad, C.; Younan, D.; Franklin, M.; Lurmann, F.; Wu, J.; Baker, L.A.; Chen, J.-C. Socioeconomic disparities and sexual dimorphism in neurotoxic effects of ambient fine particles on youth IQ: A longitudinal analysis. PLoS ONE 2017, 12, e0188731. [Google Scholar] [CrossRef]
- Herting, M.M.; Younan, D.; Campbell, C.E.; Chen, J.-C. Outdoor Air Pollution and Brain Structure and Function From Across Childhood to Young Adulthood: A Methodological Review of Brain MRI Studies. Front. Public Health 2019, 7, 332. [Google Scholar] [CrossRef]
- Lanphear, B.P.; Hornung, R.; Khoury, J.; Yolton, K.; Baghurst, P.; Bellinger, D.C.; Canfield, R.L.; Dietrich, K.N.; Bornschein, R.; Greene, T.; et al. Low-level environmental lead exposure and children’s intellectual function: An international pooled analysis. Environ. Health Perspect. 2005, 113, 894–899. [Google Scholar] [CrossRef]
- Bell, K.L.; Purcell, J.B.; Harnett, N.G.; Goodman, A.M.; Mrug, S.; Schuster, M.A.; Elliott, M.N.; Emery, S.T.; Knight, D.C. White Matter Microstructure in the Young Adult Brain Varies with Neighborhood Disadvantage in Adolescence. Neuroscience 2021, 466, 162–172. [Google Scholar] [CrossRef]
- Goodman, J.; Hurwitz, M.; Park, J.; Smith, J. Heat and Learning; NBER Working Paper No. w24639; National Bureau of Economic Research (NBER): Cambridge, MA, USA, 2018. [Google Scholar]
- Farah, M.J. Socioeconomic status and the brain: Prospects for neuroscience-informed policy. Nat. Rev. Neurosci. 2018, 19, 428–438. [Google Scholar] [CrossRef]
- Schulz, A.J.; Mentz, G.; Lachance, L.; Johnson, J.; Gaines, C.; Israel, B.A. Associations Between Socioeconomic Status and Allostatic Load: Effects of Neighborhood Poverty and Tests of Mediating Pathways. Am. J. Public Health 2012, 102, 1706–1714. [Google Scholar] [CrossRef]
- Merz, E.C.; Myers, B.; Hansen, M.; Simon, K.R.; Strack, J.; Noble, K.G. Socioeconomic Disparities in Hypothalamic-Pituitary-Adrenal Axis Regulation and Prefrontal Cortical Structure. Biol. Psychiatry Glob. Open Sci. 2023, 4, 83–96. [Google Scholar] [CrossRef]
- Selten, J.-P.; van der Ven, E.; Rutten, B.P.F.; Cantor-Graae, E. The Social Defeat Hypothesis of Schizophrenia: An Update. Schizophr. Bull. 2013, 39, 1180–1186. [Google Scholar] [CrossRef]
- Koss, K.J.; Gunnar, M.R. Annual Research Review: Early adversity, the HPA axis, and child psychopathology. J. Child. Psychol. Psychiatry 2018, 59, 327–346. [Google Scholar] [CrossRef]
- Lynam, D.R.; Caspi, A.; Moffit, T.E.; Wikström, P.-O.; Loeber, R.; Novak, S. The interaction between impulsivity and neighborhood context on offending: The effects of impulsivity are stronger in poorer neighborhoods. J. Abnorm. Psychol. 2000, 109, 563–574. [Google Scholar] [CrossRef]
- Mulckhuyse, M.; Theeuwes, J. Unconscious attentional orienting to exogenous cues: A review of the literature. Acta Psychol. 2010, 134, 299–309. [Google Scholar] [CrossRef] [PubMed]
- Berto, R. Exposure to restorative environments helps restore attentional capacity. J. Environ. Psychol. 2005, 25, 249–259. [Google Scholar] [CrossRef]
- Tomlinson, R.C.; Burt, S.A.; Waller, R.; Jonides, J.; Miller, A.L.; Gearhardt, A.N.; Peltier, S.J.; Klump, K.L.; Lumeng, J.C.; Hyde, L.W. Neighborhood poverty predicts altered neural and behavioral response inhibition. Neuroimage 2020, 209, 116536. [Google Scholar] [CrossRef]
- Hackman, D.A.; Gallop, R.; Evans, G.W.; Farah, M.J. Socioeconomic status and executive function: Developmental trajectories and mediation. Dev. Sci. 2015, 18, 686–702. [Google Scholar] [CrossRef]
- Kaplan, R. The Nature of the View from Home: Psychological Benefits. Environ. Behav. 2001, 33, 507–542. [Google Scholar] [CrossRef]
- Jimenez, M.P.; DeVille, N.V.; Elliott, E.G.; Schiff, J.E.; Wilt, G.E.; Hart, J.E.; James, P. Associations between Nature Exposure and Health: A Review of the Evidence. Int. J. Environ. Res. Public Health 2021, 18, 4790. [Google Scholar] [CrossRef]
- Bratman, G.N.; Olvera-Alvarez, H.A.; Gross, J.J. The affective benefits of nature exposure. Soc. Personal. Psychol. Compass 2021, 15, e12630. [Google Scholar] [CrossRef]
- Romeo, R.D. The Teenage Brain: The Stress Response and the Adolescent Brain. Curr. Dir. Psychol. Sci. 2013, 22, 140–145. [Google Scholar] [CrossRef]
- Heinze, K.; Lin, A.; Reniers, R.L.E.P.; Wood, S.J. Longer-term increased cortisol levels in young people with mental health problems. Psychiatry Res. 2016, 236, 98–104. [Google Scholar] [CrossRef]
- Beck, A.; Franz, C.E.; Xian, H.; Vuoksimaa, E.; Tu, X.; Reynolds, C.A.; Panizzon, M.S.; McKenzie, R.M.; Lyons, M.J.; Toomey, R.; et al. Mediators of the Effect of Childhood Socioeconomic Status on Late Midlife Cognitive Abilities: A Four Decade Longitudinal Study. Innov. Aging 2018, 2, igy003. [Google Scholar] [CrossRef]
- Aris, I.M.; Rifas-Shiman, S.L.; Jimenez, M.P.; Li, L.-J.; Hivert, M.-F.; Oken, E.; James, P. Neighborhood Child Opportunity Index and Adolescent Cardiometabolic Risk. Pediatrics 2021, 147, e2020018903. [Google Scholar] [CrossRef]
- Fritz, C.Q.; Fleegler, E.W.; DeSouza, H.; Richardson, T.; Kaiser, S.V.; Sills, M.R.; Cooper, J.N.; Parikh, K.; Puls, H.T.; DeLaroche, A.M.; et al. Child Opportunity Index and Changes in Pediatric Acute Care Utilization in the COVID-19 Pandemic. Pediatrics 2022, 149, e2021053706. [Google Scholar] [CrossRef]
- Roubinov, D.S.; Hagan, M.J.; Boyce, W.T.; Adler, N.E.; Bush, N.R. Family Socioeconomic Status, Cortisol, and Physical Health in Early Childhood: The Role of Advantageous Neighborhood Characteristics. Psychosom. Med. 2018, 80, 492–501. [Google Scholar] [CrossRef]
- Thorpe, D.; Mirhashem, R.; Shen, J.; Roulston, C.; Fox, K.; Schleider, J. Ecological-Systems Contributors to Internalizing Symptoms in a US Sample of Adolescents During the COVID-19 Pandemic. J. Clin. Child. Adolesc. Psychol. 2023, 1–16. [Google Scholar] [CrossRef]
- Beyer, L.; Keen, R.; Ertel, K.A.; Okuzono, S.S.; Pintro, K.; Delaney, S.; Slopen, N. Comparing two measures of neighborhood quality and internalizing and externalizing behaviors in the adolescent brain cognitive development study. Soc. Psychiatry Psychiatr. Epidemiol. 2024, 45, 1321–1334. [Google Scholar] [CrossRef]
- Xiao, Y.; Mann, J.J.; Hou, Y.; Chow, J.C.-C.; Brown, T.T.; Yip, P.S.-F.; Tsai, A.C.; Pathak, J.; Wang, F.; Su, C. Social Determinants of Health and Suicidal Behaviors among Children: U.S. Longitudinal Adolescent Brain Cognitive Development (ABCD) Study. medRxiv 2022. [Google Scholar] [CrossRef]
- Gornik, A.E.; Jacobson, L.A.; Kalb, L.G.; Pritchard, A.E. If Opportunity Knocks: Understanding Contextual Factors’ Influence on Cognitive Systems. Res. Child. Adolesc. Psychopathol. 2023, 52, 521–533. [Google Scholar] [CrossRef]
- Cubides-Mateus, D.M.; LoCasale-Crouch, J.; Turnbull, K.L.P. Do Neighborhood Resources Mitigate Family Risk to Preschool Children’s Executive Function Skills Growth? Prev. Sci. 2023, 24, 115–125. [Google Scholar] [CrossRef]
- Cardenas-Iniguez, C.; Gonzales, M.R. Recommendations for the responsible use and communication of race and ethnicity in neuroimaging research. Nat. Neurosci. 2024, 27, 615–628. [Google Scholar] [CrossRef]
- Spearman, C. “General Intelligence,” Objectively Determined and Measured. Am. J. Psychol. 1904, 15, 201–292. [Google Scholar] [CrossRef]
- Volkow, N.D.; Koob, G.F.; Croyle, R.T.; Bianchi, D.W.; Gordon, J.A.; Koroshetz, W.J.; Pérez-Stable, E.J.; Riley, W.T.; Bloch, M.H.; Conway, K.; et al. The conception of the ABCD study: From substance use to a broad NIH collaboration. Dev. Cogn. Neurosci. 2018, 32, 4–7. [Google Scholar] [CrossRef]
- Jernigan, T.L.; Brown, S.A.; Dowling, G.J. The Adolescent Brain Cognitive Development Study. J. Res. Adolesc. 2018, 28, 154–156. [Google Scholar] [CrossRef]
- Garavan, H.; Bartsch, H.; Conway, K.; Decastro, A.; Goldstein, R.Z.; Heeringa, S.; Jernigan, T.; Potter, A.; Thompson, W.; Zahs, D. Recruiting the ABCD sample: Design considerations and procedures. Dev. Cogn. Neurosci. 2018, 32, 16–22. [Google Scholar] [CrossRef]
- Barch, D.M.; Albaugh, M.D.; Avenevoli, S.; Chang, L.; Clark, D.B.; Glantz, M.D.; Hudziak, J.J.; Jernigan, T.L.; Tapert, S.F.; Yurgelun-Todd, D.; et al. Demographic, physical and mental health assessments in the adolescent brain and cognitive development study: Rationale and description. Dev. Cogn. Neurosci. 2018, 32, 55–66. [Google Scholar] [CrossRef]
- Lisdahl, K.M.; Tapert, S.; Sher, K.J.; Gonzalez, R.; Nixon, S.J.; Feldstein Ewing, S.W.; Conway, K.P.; Wallace, A.; Sullivan, R.; Hatcher, K.; et al. Substance use patterns in 9-10 year olds: Baseline findings from the adolescent brain cognitive development (ABCD) study. Drug Alcohol. Depend. 2021, 227, 108946. [Google Scholar] [CrossRef]
- Zucker, R.A.; Gonzalez, R.; Feldstein Ewing, S.W.; Paulus, M.P.; Arroyo, J.; Fuligni, A.; Morris, A.S.; Sanchez, M.; Wills, T. Assessment of culture and environment in the Adolescent Brain and Cognitive Development Study: Rationale, description of measures, and early data. Dev. Cogn. Neurosci. 2018, 32, 107–120. [Google Scholar] [CrossRef]
- Luciana, M.; Bjork, J.M.; Nagel, B.J.; Barch, D.M.; Gonzalez, R.; Nixon, S.J.; Banich, M.T. Adolescent neurocognitive development and impacts of substance use: Overview of the adolescent brain cognitive development (ABCD) baseline neurocognition battery. Dev. Cogn. Neurosci. 2018, 32, 67–79. [Google Scholar] [CrossRef]
- Casey, B.J.; Cannonier, T.; Conley, M.I.; Cohen, A.O.; Barch, D.M.; Heitzeg, M.M.; Soules, M.E.; Teslovich, T.; Dellarco, D.V.; Garavan, H.; et al. The Adolescent Brain Cognitive Development (ABCD) study: Imaging acquisition across 21 sites. Dev. Cogn. Neurosci. 2018, 32, 43–54. [Google Scholar] [CrossRef]
- Noelke, C.; McArdle, N.; Baek, M.; Huntington, N.; Huber, R.; Hardy, E.; Acevedo-Garcia, D. Child Opportunity Index 2.0 Technical Documentation; Brandeis University: Waltham, MA, USA, 2020. [Google Scholar]
- Abad, S.; Badilla, P.; Marshall, A.T.; Smith, C.; Tsui, B.; Cardenas-Iniguez, C.; Herting, M.M. Lifetime residential history collection and processing for environmental data linkages in the ABCD study. Health Place 2024, 87, 103238. [Google Scholar] [CrossRef]
- Census Tracts for the 2020 Census-Final Criteria. Available online: https://www.federalregister.gov/documents/2018/11/13/2018-24567/census-tracts-for-the-2020-census-final-criteria (accessed on 17 June 2024).
- Achenbach, T.M. Achenbach System of Empirically Based Assessment (ASEBA). In Encyclopedia of Clinical Neuropsychology; Kreutzer, J., DeLuca, J., Caplan, B., Eds.; Springer International Publishing: Cham, Switzerland, 2017; pp. 1–7. ISBN 978-3-319-56782-2. [Google Scholar]
- Achenbach, T.M. Achenbach System of Empirically Based Assessment (ASEBA): Development, Findings, Theory, and Applications; University of Vermont, Research Center of Children, Youth & Families: Burlington, VT, USA, 2009; ISBN 978-1-932975-13-0. [Google Scholar]
- Elliot, A.J.; Thrash, T.M. Approach-avoidance motivation in personality: Approach and avoidance temperaments and goals. J. Personal. Soc. Psychol. 2002, 82, 804–818. [Google Scholar] [CrossRef]
- Fowles, D.C. The Three Arousal Model: Implications of Gray’s Two-Factor Learning Theory for Heart Rate, Electrodermal Activity, and Psychopathy. Psychophysiology 1980, 17, 87–104. [Google Scholar] [CrossRef]
- Gray, J.A. Brain Systems that Mediate both Emotion and Cognition. Cogn. Emot. 1990, 4, 269–288. [Google Scholar] [CrossRef]
- Pagliaccio, D.; Luking, K.R.; Anokhin, A.P.; Gotlib, I.H.; Hayden, E.P.; Olino, T.M.; Peng, C.-Z.; Hajcak, G.; Barch, D.M. Revising the BIS/BAS Scale to study development: Measurement invariance and normative effects of age and sex from childhood through adulthood. Psychol. Assess. 2016, 28, 429–442. [Google Scholar] [CrossRef]
- Carver, C.S.; White, T.L. Behavioral inhibition, behavioral activation, and affective responses to impending reward and punishment: The BIS/BAS Scales. J. Personal. Soc. Psychol. 1994, 67, 319–333. [Google Scholar] [CrossRef]
- Cyders, M.A.; Smith, G.T.; Spillane, N.S.; Fischer, S.; Annus, A.M.; Peterson, C. Integration of impulsivity and positive mood to predict risky behavior: Development and validation of a measure of positive urgency. Psychol. Assess. 2007, 19, 107–118. [Google Scholar] [CrossRef]
- Whiteside, S.P.; Lynam, D.R.; Miller, J.D.; Reynolds, S.K. Validation of the UPPS impulsive behaviour scale: A four-factor model of impulsivity. Eur. J. Personal. 2005, 19, 559–574. [Google Scholar] [CrossRef]
- Cardenas-Iniguez, C.; Schachner, J.; Ip, K.I.; Schertz, K.; Gonzalez, M.R.; Abad, S.; Herting, M. Building Towards an Adolescent Neural Urbanome: Expanding Environmental Measures Using Linked External Data (LED) in the ABCD Study. Dev. Cogn. Neurosci. 2024, 65, 101338. [Google Scholar] [CrossRef]
- Leventhal, T.; Brooks-Gunn, J. The neighborhoods they live in: The effects of neighborhood residence on child and adolescent outcomes. Psychol. Bull. 2000, 126, 309–337. [Google Scholar] [CrossRef]
- Wilson, W.J. The Truly Disadvantaged: The Inner City, the Underclass, and Public Policy, 2nd ed.; University of Chicago Press: Chicago, IL, USA, 2012; ISBN 978-0-226-90126-8. [Google Scholar]
- Sampson, R.J.; Morenoff, J.D.; Gannon-Rowley, T. Assessing “Neighborhood Effects”: Social Processes and New Directions in Research. Annu. Rev. Sociol. 2002, 28, 443–478. [Google Scholar] [CrossRef]
- Wodtke, G.T.; Harding, D.J.; Elwert, F. Neighborhood effects in temporal perspective: The impact of long-term exposure to concentrated disadvantage on high school graduation. Am. Sociol. Rev. 2011, 76, 713–736. [Google Scholar] [CrossRef]
- Clarke, P.; Morenoff, J.; Debbink, M.; Golberstein, E.; Elliott, M.R.; Lantz, P.M. Cumulative Exposure to Neighborhood Context: Consequences for Health Transitions over the Adult Life Course. Res. Aging 2013, 36, 115–142. [Google Scholar] [CrossRef]
- Krieger, N.; Smith, K.; Naishadham, D.; Hartman, C.; Barbeau, E.M. Experiences of discrimination: Validity and reliability of a self-report measure for population health research on racism and health. Soc. Sci. Med. 2005, 61, 1576–1596. [Google Scholar] [CrossRef]
- Jenkins, L.M.; Chiang, J.J.; Vause, K.; Hoffer, L.; Alpert, K.; Parrish, T.B.; Wang, L.; Miller, G.E. Subcortical structural variations associated with low socioeconomic status in adolescents. Hum. Brain Mapp. 2020, 41, 162–171. [Google Scholar] [CrossRef]
- Mullins, T.S.; Campbell, E.M.; Hogeveen, J. Neighborhood Deprivation Shapes Motivational-Neurocircuit Recruitment in Children. Psychol. Sci. 2020, 31, 881–889. [Google Scholar] [CrossRef]
- Colder, C.R.; O’Connor, R.M. Gray’s Reinforcement Sensitivity Model and Child Psychopathology: Laboratory and Questionnaire Assessment of the BAS and BIS. J. Abnorm. Child. Psychol. 2004, 32, 435–451. [Google Scholar] [CrossRef]
- LaSpada, N.; Delker, E.; East, P.; Blanco, E.; Delva, J.; Burrows, R.; Lozoff, B.; Gahagan, S. Risk taking, sensation seeking and personality as related to changes in substance use from adolescence to young adulthood. J. Adolesc. 2020, 82, 23–31. [Google Scholar] [CrossRef]
- Ravert, R.D.; Kim, S.Y.; Schwartz, S.J.; Weisskirch, R.S.; Zamboanga, B.L.; Ham, L.S.; Donnellan, M.B.; Bersamin, M.M. The Association Between Sensation Seeking and Well-Being Among College-Attending Emerging Adults. J. Coll. Stud. Dev. 2013, 54, 17–28. [Google Scholar] [CrossRef]
- Roberti, J.W.; Storch, E.A.; Bravata, E.A. Sensation seeking, exposure to psychosocial stressors, and body modifications in a college population. Personal. Individ. Differ. 2004, 37, 1167–1177. [Google Scholar] [CrossRef]
- Schott, N.; Mündörfer, A.; Holfelder, B. Neighborhood Socio-Economic Status Influences Motor Performance and Inhibitory Control in Kindergarten Children—Findings from the Cross-Sectional Kitafit Study. Children 2023, 10, 1332. [Google Scholar] [CrossRef]
- Pratt, T.; Turner, M.; Piquero, A. Parental Socialization and Community Context: A Longitudinal Analysis of the Structural Sources of Low Self-Control. J. Res. Crime Delinq. 2004, 41, 219–243. [Google Scholar] [CrossRef]
- Meier, M.H.; Slutske, W.S.; Arndt, S.; Cadoret, R.J. Impulsive and callous traits are more strongly associated with delinquent behavior in higher risk neighborhoods among boys and girls. J. Abnorm. Psychol. 2008, 117, 377–385. [Google Scholar] [CrossRef]
- Fowler, P.J.; McGrath, L.M.; Henry, D.B.; Schoeny, M.; Chavira, D.; Taylor, J.J. Orin Day Housing mobility and cognitive development: Change in verbal and nonverbal abilities. Child. Abuse Neglect 2015, 48, 104–118. [Google Scholar] [CrossRef]
- Piccolo, L.R.; Merz, E.C.; Noble, K.G. School Climate is Associated with Cortical Thickness and Executive Function in Children and Adolescents. Dev. Sci. 2019, 22, e12719. [Google Scholar] [CrossRef]
- Novak, S.P.; Clayton, R.R. The influence of school environment and self-regulation on transitions between stages of cigarette smoking: A multilevel analysis. Health Psychol. 2001, 20, 196–207. [Google Scholar] [CrossRef]
- Nieuwenhuis, J.; van Ham, M.; Yu, R.; Branje, S.; Meeus, W.; Hooimeijer, P. Being Poorer Than the Rest of the Neighborhood: Relative Deprivation and Problem Behavior of Youth. J. Youth Adolesc. 2017, 46, 1891–1904. [Google Scholar] [CrossRef]
- Galster, G.C. The Mechanism(s) of Neighbourhood Effects: Theory, Evidence, and Policy Implications. In Neighbourhood Effects Research: New Perspectives; van Ham, M., Manley, D., Bailey, N., Simpson, L., Maclennan, D., Eds.; Springer: Dordrecht, The Netherlands, 2012; pp. 23–56. ISBN 978-94-007-2309-2. [Google Scholar]
- Michaelson, L.; de la Vega, A.; Chatham, C.H.; Munakata, Y. Delaying gratification depends on social trust. Front. Psychol. 2013, 4, 355. [Google Scholar] [CrossRef]
- Otto, A.R.; Markman, A.B.; Love, B.C. Taking More, Now: The Optimality of Impulsive Choice Hinges on Environment Structure. Soc. Psychol. Personal. Sci. 2012, 3, 131–138. [Google Scholar] [CrossRef]
- Sturge-Apple, M.L.; Suor, J.H.; Davies, P.T.; Cicchetti, D.; Skibo, M.A.; Rogosch, F.A. Vagal Tone and Children’s Delay of Gratification: Differential Sensitivity in Resource-Poor and Resource-Rich Environments. Psychol. Sci. 2016, 27, 885–893. [Google Scholar] [CrossRef]
- Kingsbury, M.; Clayborne, Z.; Colman, I.; Kirkbride, J.B. The protective effect of neighbourhood social cohesion on adolescent mental health following stressful life events. Psychol. Med. 2020, 50, 1292–1299. [Google Scholar] [CrossRef]
- Cyders, M.A.; Smith, G.T. Emotion-based Dispositions to Rash Action: Positive and Negative Urgency. Psychol. Bull. 2008, 134, 807–828. [Google Scholar] [CrossRef]
- Tunney, R.J.; Raybould, J.N. The relationship between subjective social status, impulsivity and addictive behaviours. Psychiatry Res. Commun. 2023, 3, 100130. [Google Scholar] [CrossRef]
- Eugene, D.R. Connectedness to Family, School, and Neighborhood and Adolescents’ Internalizing Symptoms. Int. J. Environ. Res. Public Health 2021, 18, 12602. [Google Scholar] [CrossRef]
- Smith, N.R.; Lewis, D.J.; Fahy, A.; Eldridge, S.; Taylor, S.J.; Moore, D.G.; Clark, C.; Stansfeld, S.A.; Cummins, S. Individual socio-demographic factors and perceptions of the environment as determinants of inequalities in adolescent physical and psychological health: The Olympic Regeneration in East London (ORiEL) study. BMC Public Health 2015, 15, 150. [Google Scholar] [CrossRef]
- Towe-Goodman, N.; McArthur, K.L.; Willoughby, M.; Swingler, M.M.; Wychgram, C.; Just, A.C.; Kloog, I.; Bennett, D.H.; Berry, D.; Hazlehurst, M.F.; et al. Green Space and Internalizing or Externalizing Symptoms Among Children. JAMA Netw. Open 2024, 7, e245742. [Google Scholar] [CrossRef]
- Rogers, M. “They are there for you”: The Importance of Neighbourhood Friends to Children’s Well-Being. Child. Ind. Res. 2012, 5, 483–502. [Google Scholar] [CrossRef]
- Ding, D.; Adams, M.A.; Sallis, J.F.; Norman, G.J.; Hovell, M.F.; Chambers, C.D.; Hofstetter, C.R.; Bowles, H.R.; Hagströmer, M.; Craig, C.L.; et al. Perceived neighborhood environment and physical activity in 11 countries: Do associations differ by country? Int. J. Behav. Nutr. Phys. Act. 2013, 10, 57. [Google Scholar] [CrossRef]
- Lubans, D.; Richards, J.; Hillman, C.; Faulkner, G.; Beauchamp, M.; Nilsson, M.; Kelly, P.; Smith, J.; Raine, L.; Biddle, S. Physical Activity for Cognitive and Mental Health in Youth: A Systematic Review of Mechanisms. Pediatrics 2016, 138, e20161642. [Google Scholar] [CrossRef]
- Hu, D.; Zhou, S.; Crowley-McHattan, Z.J.; Liu, Z. Factors That Influence Participation in Physical Activity in School-Aged Children and Adolescents: A Systematic Review from the Social Ecological Model Perspective. Int. J. Environ. Res. Public Health 2021, 18, 3147. [Google Scholar] [CrossRef]
- Eime, R.M.; Young, J.A.; Harvey, J.T.; Charity, M.J.; Payne, W.R. A systematic review of the psychological and social benefits of participation in sport for children and adolescents: Informing development of a conceptual model of health through sport. Int. J. Behav. Nutr. Phys. Act. 2013, 10, 98. [Google Scholar] [CrossRef]
- Jose, P.E.; Ryan, N.; Pryor, J. Does social connectedness promote a greater sense of well-being in adolescence over time? J. Res. Adolesc. 2012, 22, 235–251. [Google Scholar] [CrossRef]
- Diendorfer, T.; Seidl, L.; Mitic, M.; Mittmann, G.; Woodcock, K.; Schrank, B. Determinants of social connectedness in children and early adolescents with mental disorder: A systematic literature review. Dev. Rev. 2021, 60, 100960. [Google Scholar] [CrossRef]
- Dick, A.S.; Lopez, D.A.; Watts, A.L.; Heeringa, S.; Reuter, C.; Bartsch, H.; Fan, C.C.; Kennedy, D.N.; Palmer, C.; Marshall, A.; et al. Meaningful associations in the adolescent brain cognitive development study. NeuroImage 2021, 239, 118262. [Google Scholar] [CrossRef]
- Owens, M.M.; Potter, A.; Hyatt, C.S.; Albaugh, M.; Thompson, W.K.; Jernigan, T.; Yuan, D.; Hahn, S.; Allgaier, N.; Garavan, H. Recalibrating expectations about effect size: A multi-method survey of effect sizes in the ABCD study. PLoS ONE 2021, 16, e0257535. [Google Scholar] [CrossRef]


| Total Sample (n = 9767) | |
|---|---|
| Sex, n (%) | |
| Female | 4652 (47.62) |
| Male | 5113 (52.36) |
| Intersex Male | 2 (0.02) |
| Age, months years, M (SD) | 119.01 [9.92] (7.49) |
| Household Income, n (%) | |
| <USD 50K | 2817 (28.84) |
| ≥USD 50 and ≤100K | 2785 (28.51)) |
| ≥USD 100K | 4165 (42.64) |
| Parent Education, M (SD) | 3.66 (1.05) |
| Race, n (%) | |
| White | 5376 (55.04) |
| Black | 1291 (13.22) |
| Asian | 200 (2.05) |
| Hispanic | 1868 (19.13) |
| Other | 1032 (10.57) |
| BAS Subscales M (SD) | |
| Drive | 4.05 (3.02) |
| Fun Seeking | 5.69 (2.63) |
| Reward Responsiveness | 10.98 (2.90) |
| BIS Sum M (SD) | 9.50 (3.75) |
| UPPS-P Subscales, M (SD) | |
| Negative Urgency | 8.49 (2.64) |
| Lack of Premeditation | 7.76 (2.36) |
| Lack of Perseverance | 7.03 (2.24) |
| Sensation Seeking | 9.80 (2.68) |
| Positive Urgency | 7.96 (2.94) |
| COI 2.0, M (SD) | |
| Total COI Summary Score | 61.44 (30.16) |
| ASEBA Subscales, M (SD) | 5.03 (5.44) |
| Internalizing Symptoms | 4.37 (5.74) |
| Externalizing Symptoms | 1.62 (2.17) |
| Thought Problems | 2.95 (3.45) |
| Attention Problems |
| Indicator | Child Education | Socioeconomic Attainment | Neighborhood Enrichment | Poverty Level |
|---|---|---|---|---|
| Education Attainment | 0.10 | 0.87 | 0.07 | −0.08 |
| College Enrollment | 0.09 | 0.47 | 0.08 | 0.33 |
| Third-Grade Math | 1.00 | −0.01 | 0.00 | 0.00 |
| Third-Grade Reading | 0.93 | 0.03 | −0.01 | 0.00 |
| CEC | −0.07 | 0.17 | 0.84 | 0.04 |
| High-Quality Child Education Centers | 0.00 | 0.27 | 0.58 | 0.09 |
| Healthy Food | 0.01 | 0.16 | −0.12 | 0.75 |
| Green Space | −0.03 | −0.19 | 0.85 | −0.04 |
| Health Insurance | −0.01 | 0.60 | −0.23 | −0.11 |
| Housing Vacancy | −0.18 | 0.11 | −0.09 | 0.59 |
| Walkability | 0.04 | −0.02 | 0.81 | 0.00 |
| Poverty Rate | −0.03 | −0.10 | 0.11 | 0.79 |
| Public Assistance | 0.02 | −0.20 | 0.05 | 0.79 |
| High-Skill Employment | 0.06 | 0.88 | 0.00 | −0.09 |
| Household Income | 0.14 | 0.44 | −0.04 | −0.39 |
| Single-Family Households | −0.12 | −0.14 | 0.08 | 0.66 |
| Factor Correlations | ||||
| Child Education | - | - | - | - |
| Socioeconomic Attainment | 0.57 | - | - | - |
| Neighborhood Enrichment | −0.24 | −0.05 | - | - |
| Poverty Level | −0.59 | −0.57 | 0.33 | - |
Disclaimer/Publisher’s Note: The statements, opinions and data contained in all publications are solely those of the individual author(s) and contributor(s) and not of MDPI and/or the editor(s). MDPI and/or the editor(s) disclaim responsibility for any injury to people or property resulting from any ideas, methods, instructions or products referred to in the content. |
© 2025 by the authors. Licensee MDPI, Basel, Switzerland. This article is an open access article distributed under the terms and conditions of the Creative Commons Attribution (CC BY) license (https://creativecommons.org/licenses/by/4.0/).
Share and Cite
Harris, J.C.; Wilson, I.G.; Cardenas-Iniguez, C.; Watts, A.L.; Lisdahl, K.M. The Childhood Opportunity Index 2.0: Factor Structure in 9–10 Year Olds in the Adolescent Brain Cognitive Development Study. Int. J. Environ. Res. Public Health 2025, 22, 228. https://doi.org/10.3390/ijerph22020228
Harris JC, Wilson IG, Cardenas-Iniguez C, Watts AL, Lisdahl KM. The Childhood Opportunity Index 2.0: Factor Structure in 9–10 Year Olds in the Adolescent Brain Cognitive Development Study. International Journal of Environmental Research and Public Health. 2025; 22(2):228. https://doi.org/10.3390/ijerph22020228
Chicago/Turabian StyleHarris, Julia C., Isabelle G. Wilson, Carlos Cardenas-Iniguez, Ashley L. Watts, and Krista M. Lisdahl. 2025. "The Childhood Opportunity Index 2.0: Factor Structure in 9–10 Year Olds in the Adolescent Brain Cognitive Development Study" International Journal of Environmental Research and Public Health 22, no. 2: 228. https://doi.org/10.3390/ijerph22020228
APA StyleHarris, J. C., Wilson, I. G., Cardenas-Iniguez, C., Watts, A. L., & Lisdahl, K. M. (2025). The Childhood Opportunity Index 2.0: Factor Structure in 9–10 Year Olds in the Adolescent Brain Cognitive Development Study. International Journal of Environmental Research and Public Health, 22(2), 228. https://doi.org/10.3390/ijerph22020228