

Prevalence of CVD Among Indian Adult Population: Systematic Review and Meta-Analysis

 , , , and
Abstract
1. Introduction
2. Methodology
2.1. Registration
2.2. Data Sources and Search Strategy
2.3. Inclusion and Exclusion Criteria
2.4. Study Selection
2.5. Data Extraction
2.6. Quality Assessment of Included Studies
2.7. Statistical Analysis
3. Results
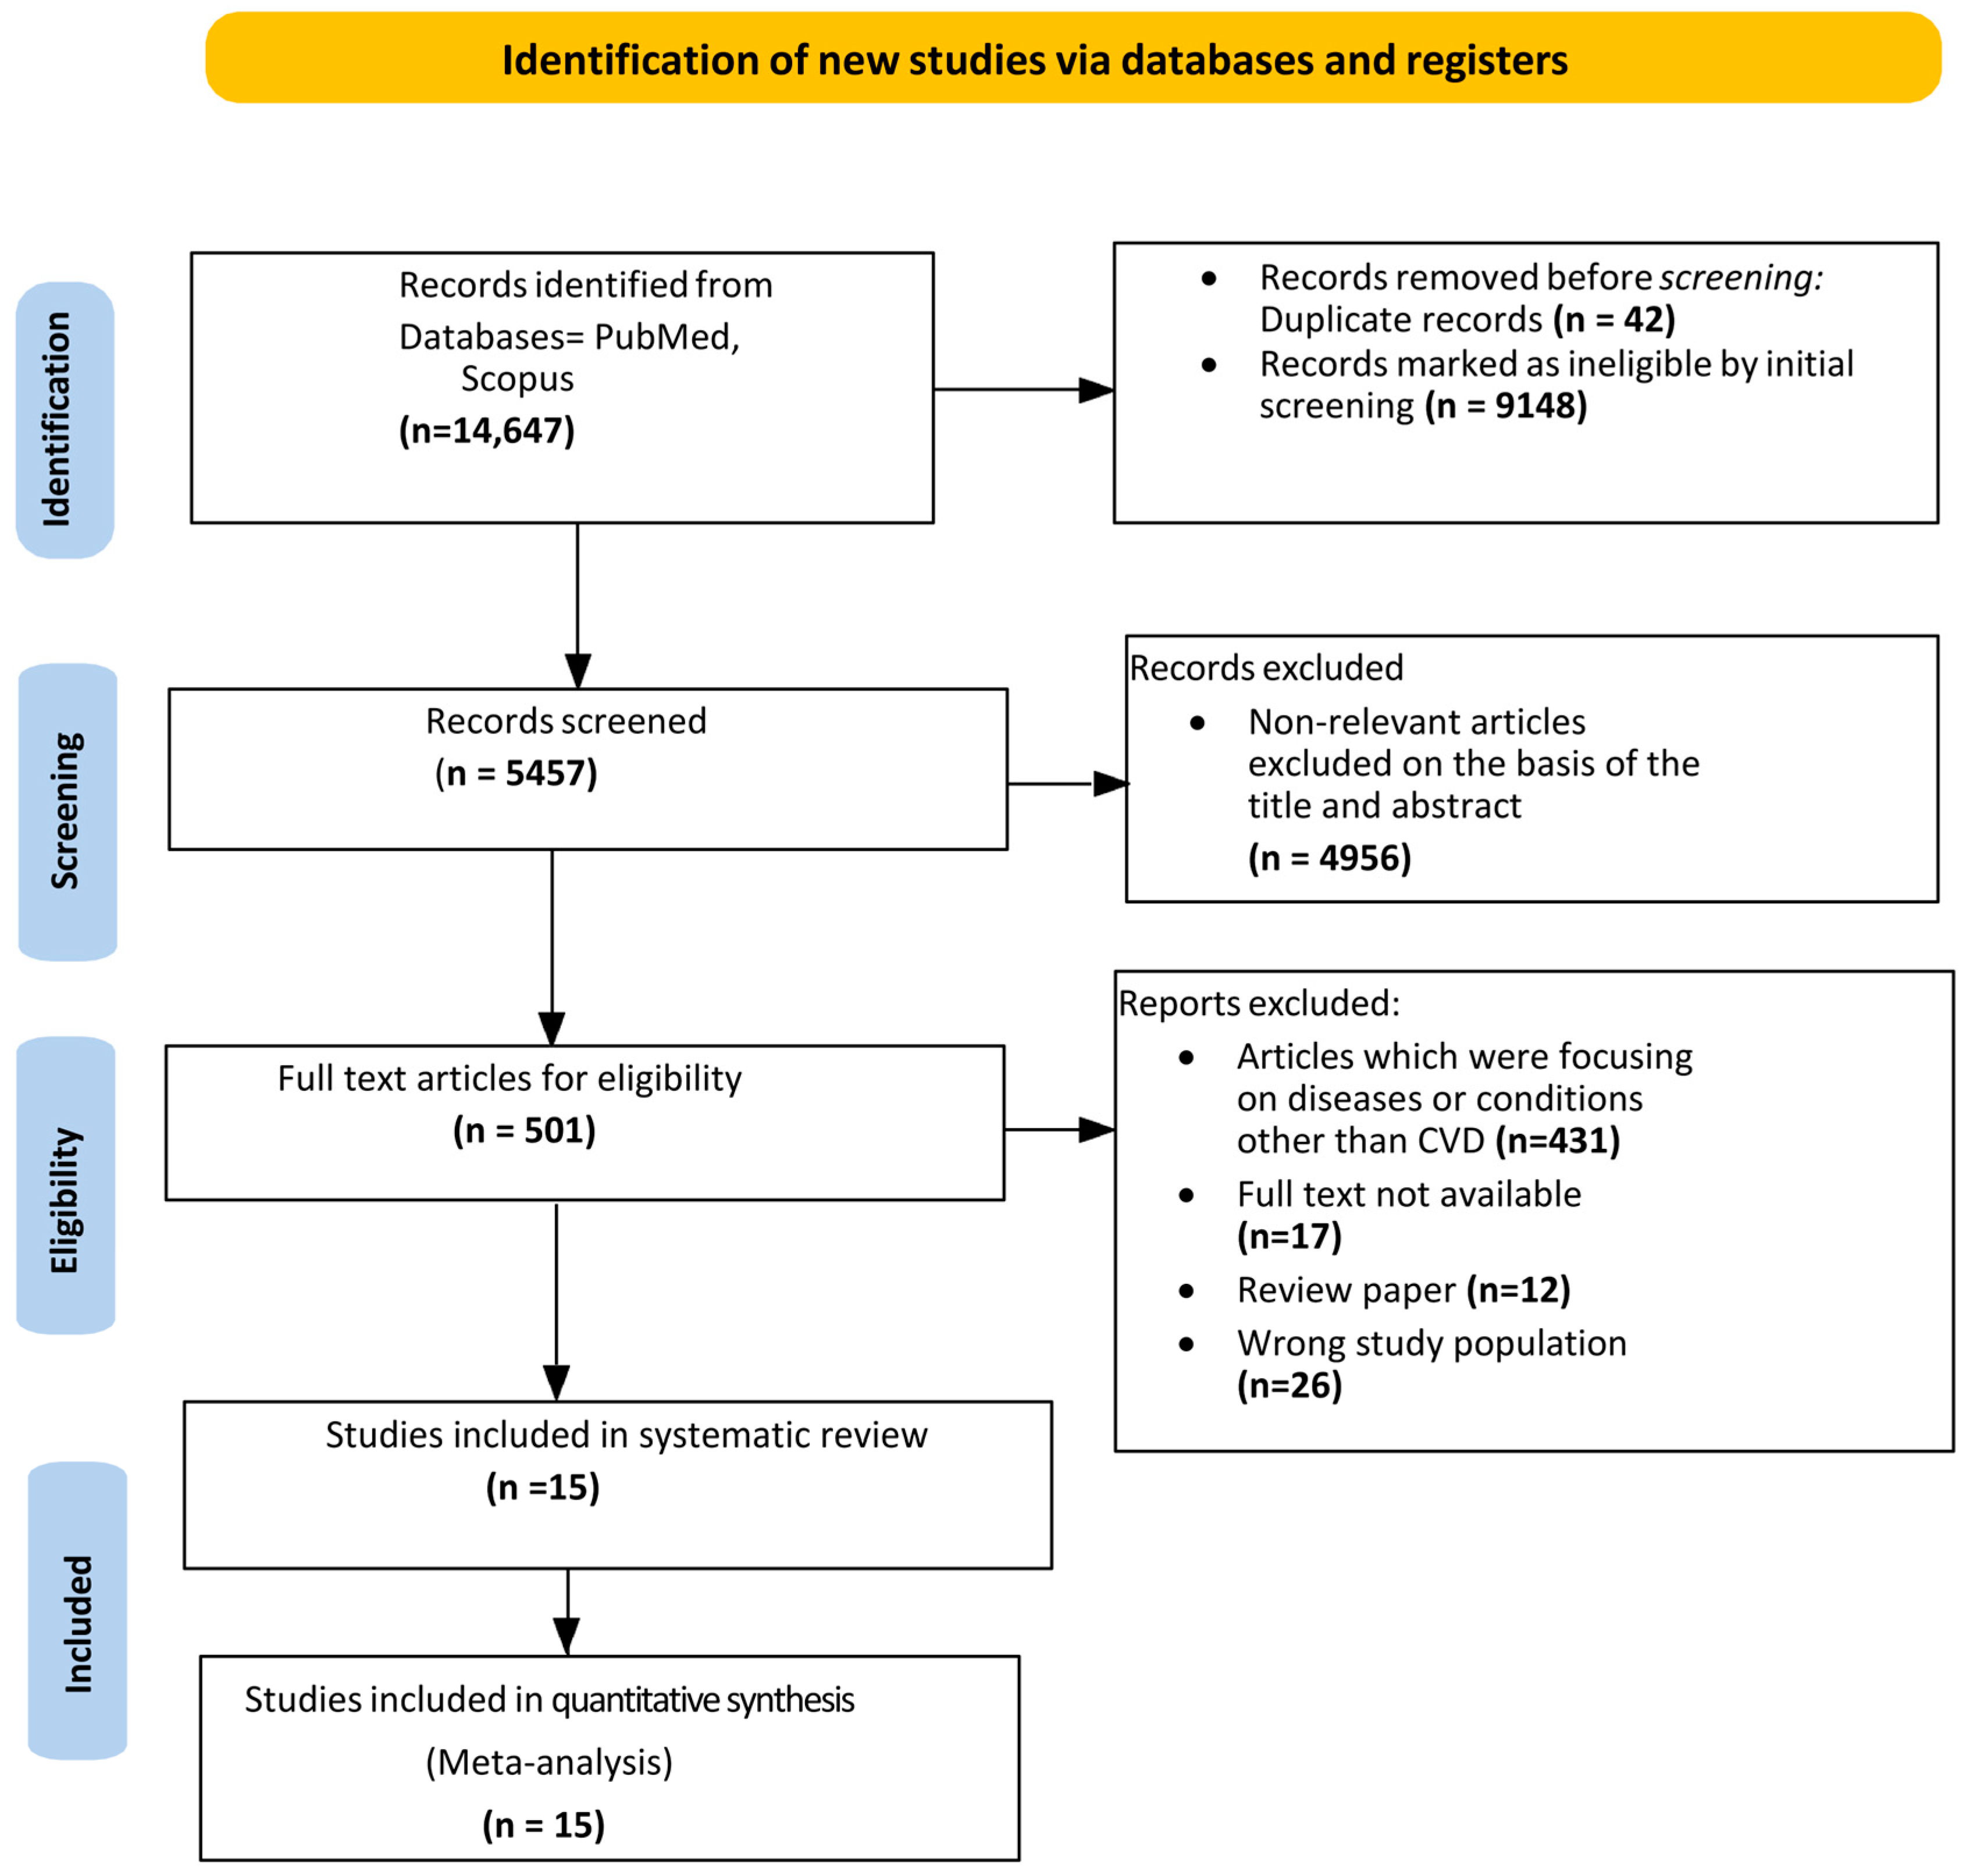
3.1. Study Selection
3.2. Study Characteristics
3.3. Study Quality Assessment
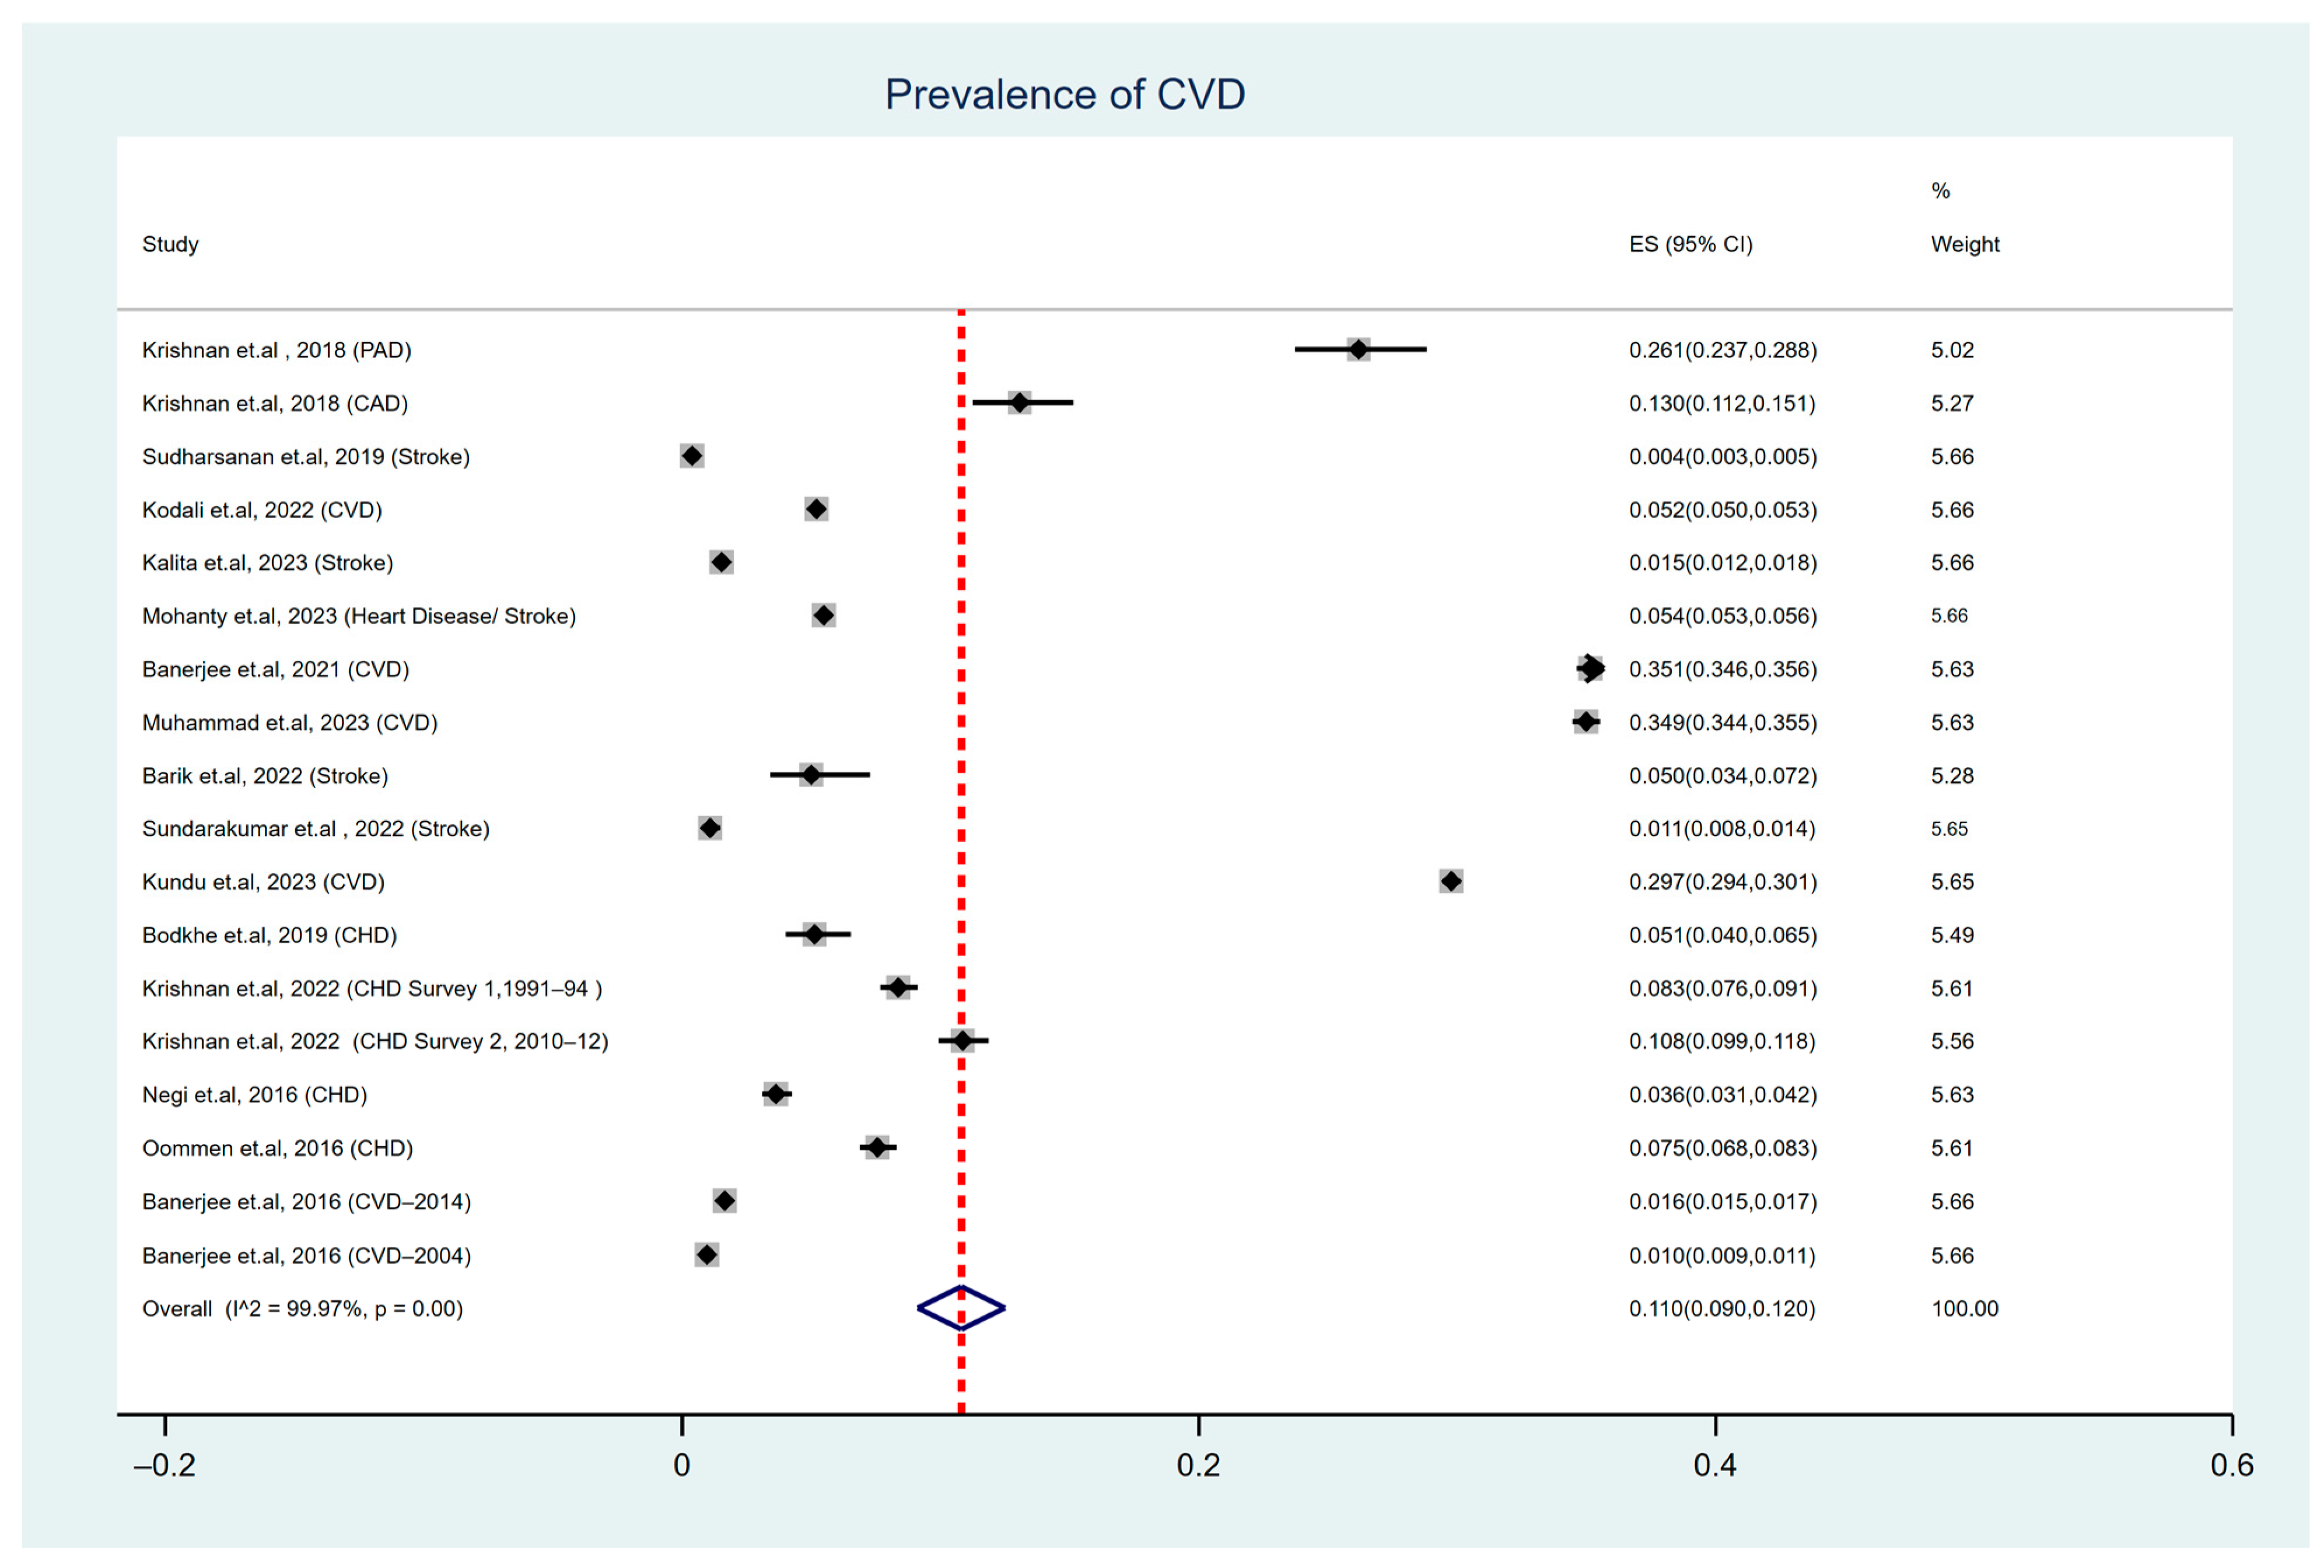
3.4. Pooled Prevalence of Cardiovascular Diseases (CVDs)
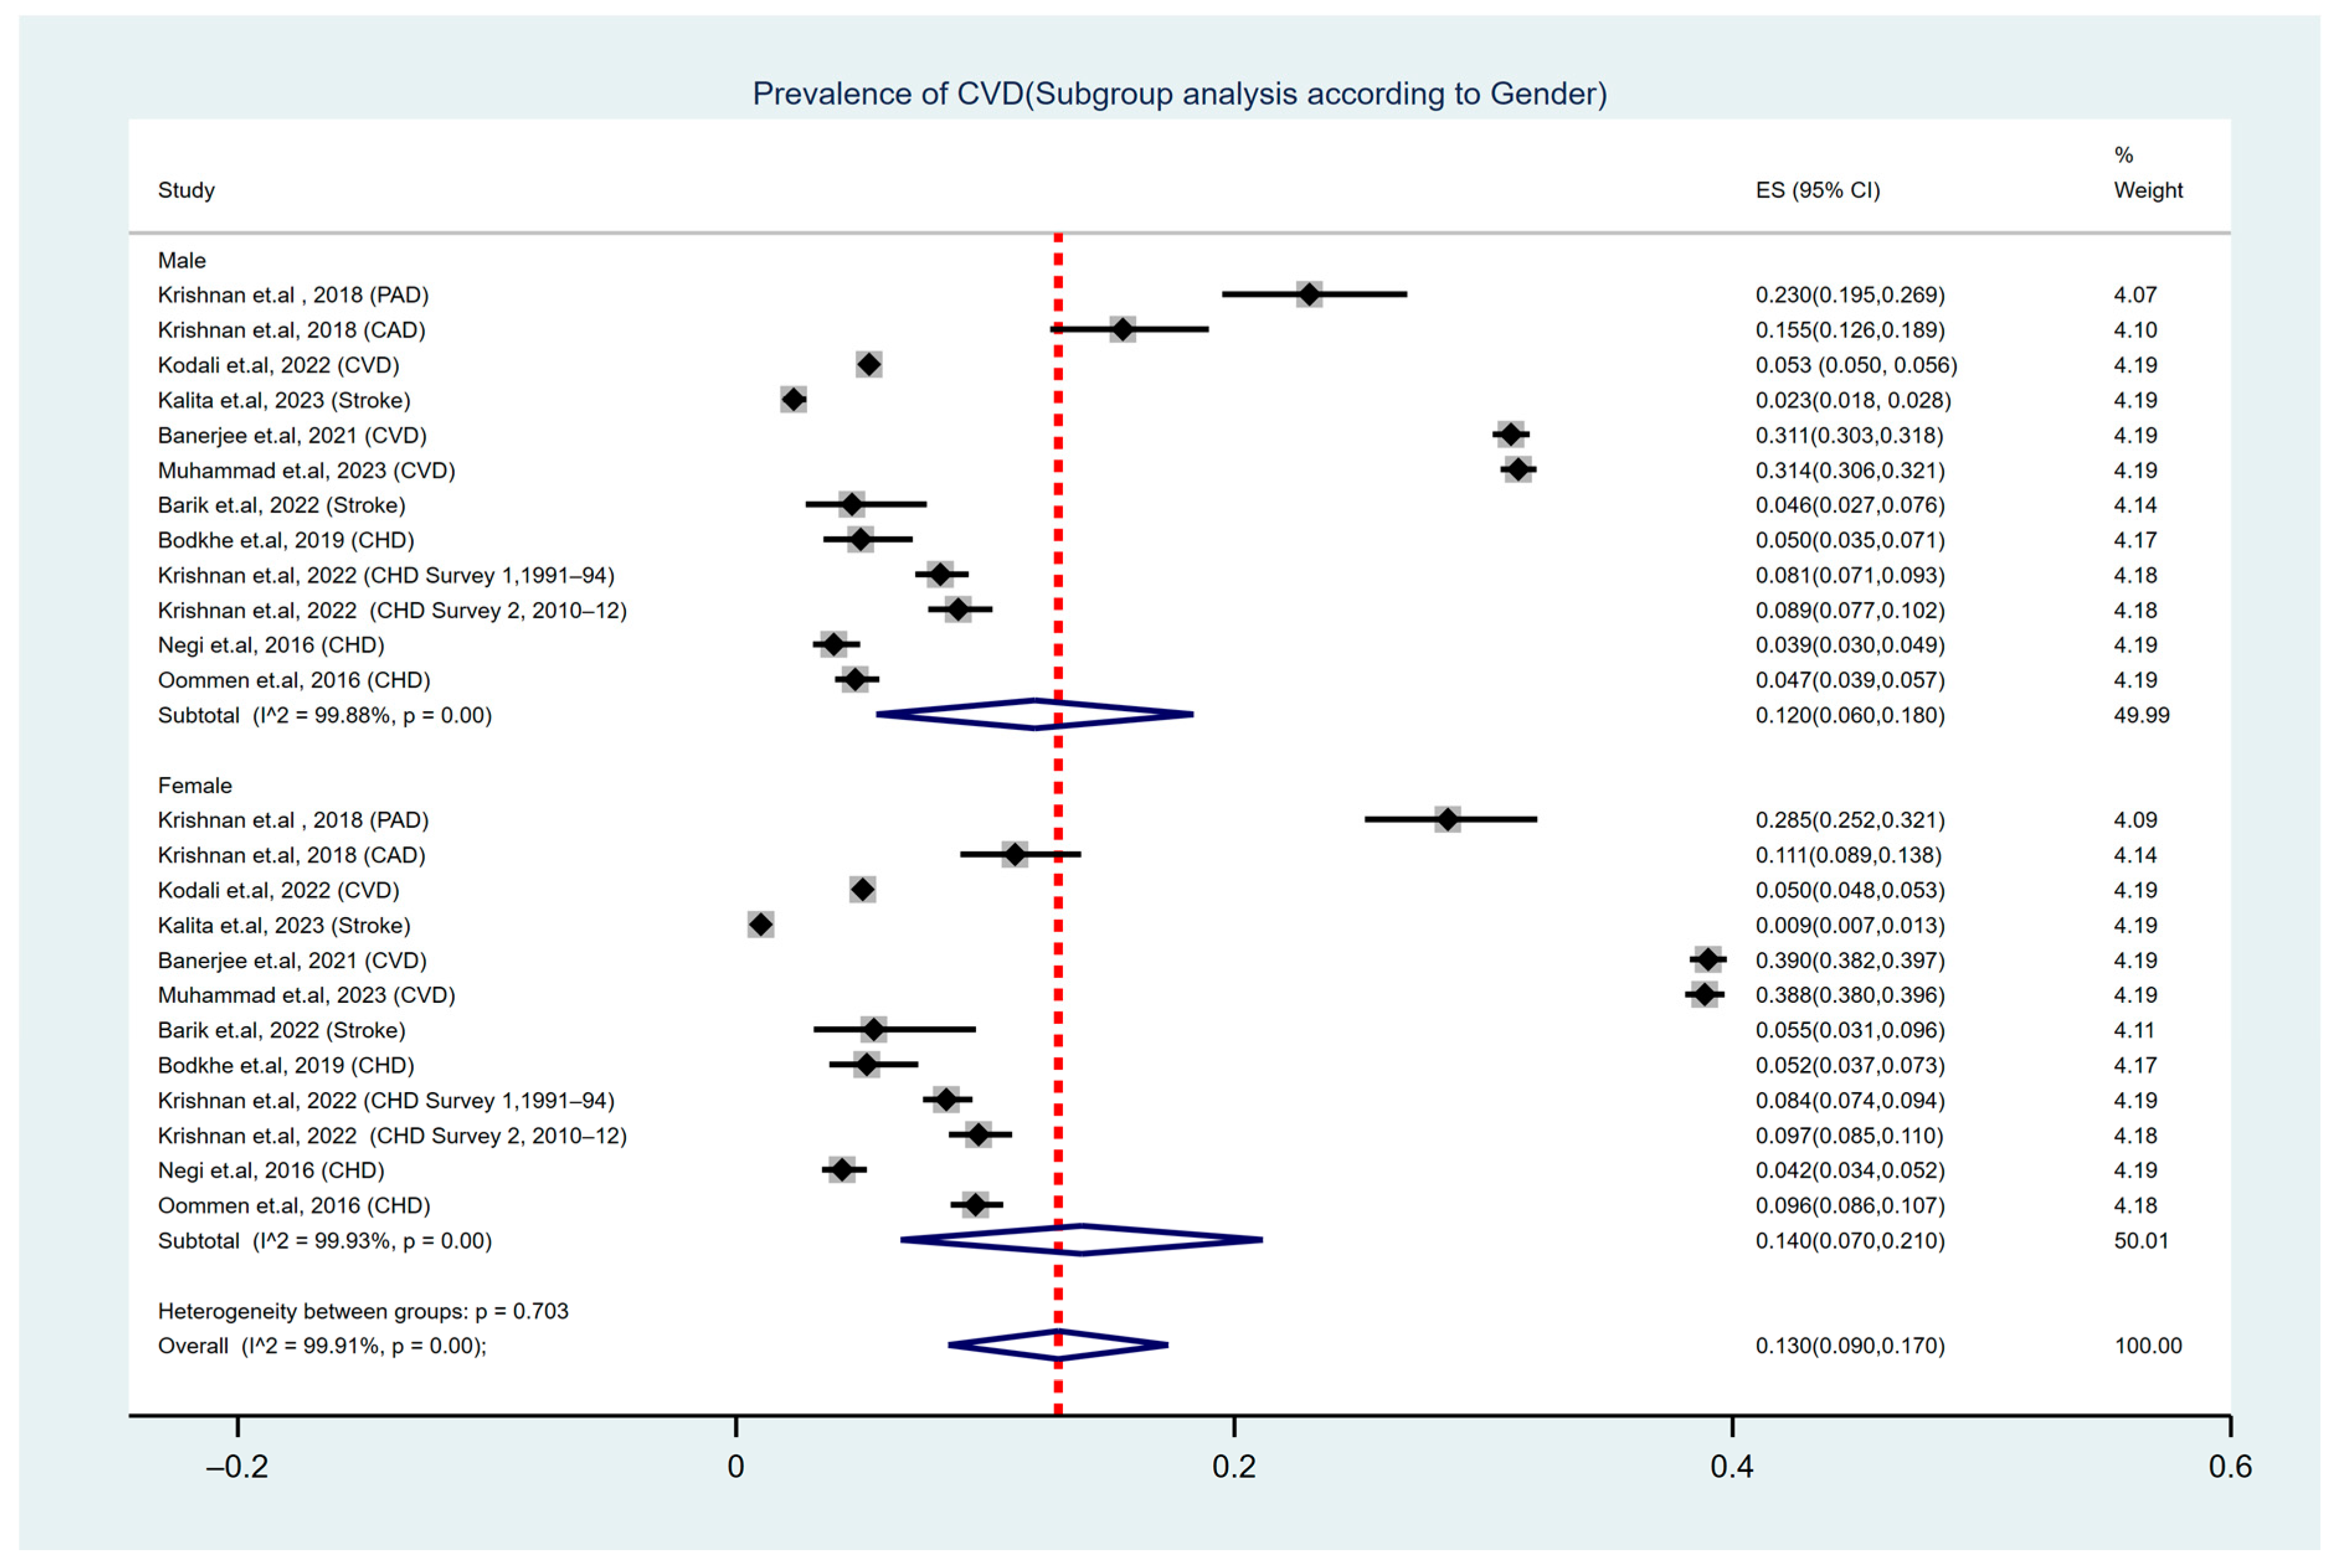
3.5. Subgroup Analysis by Gender of Study Participants
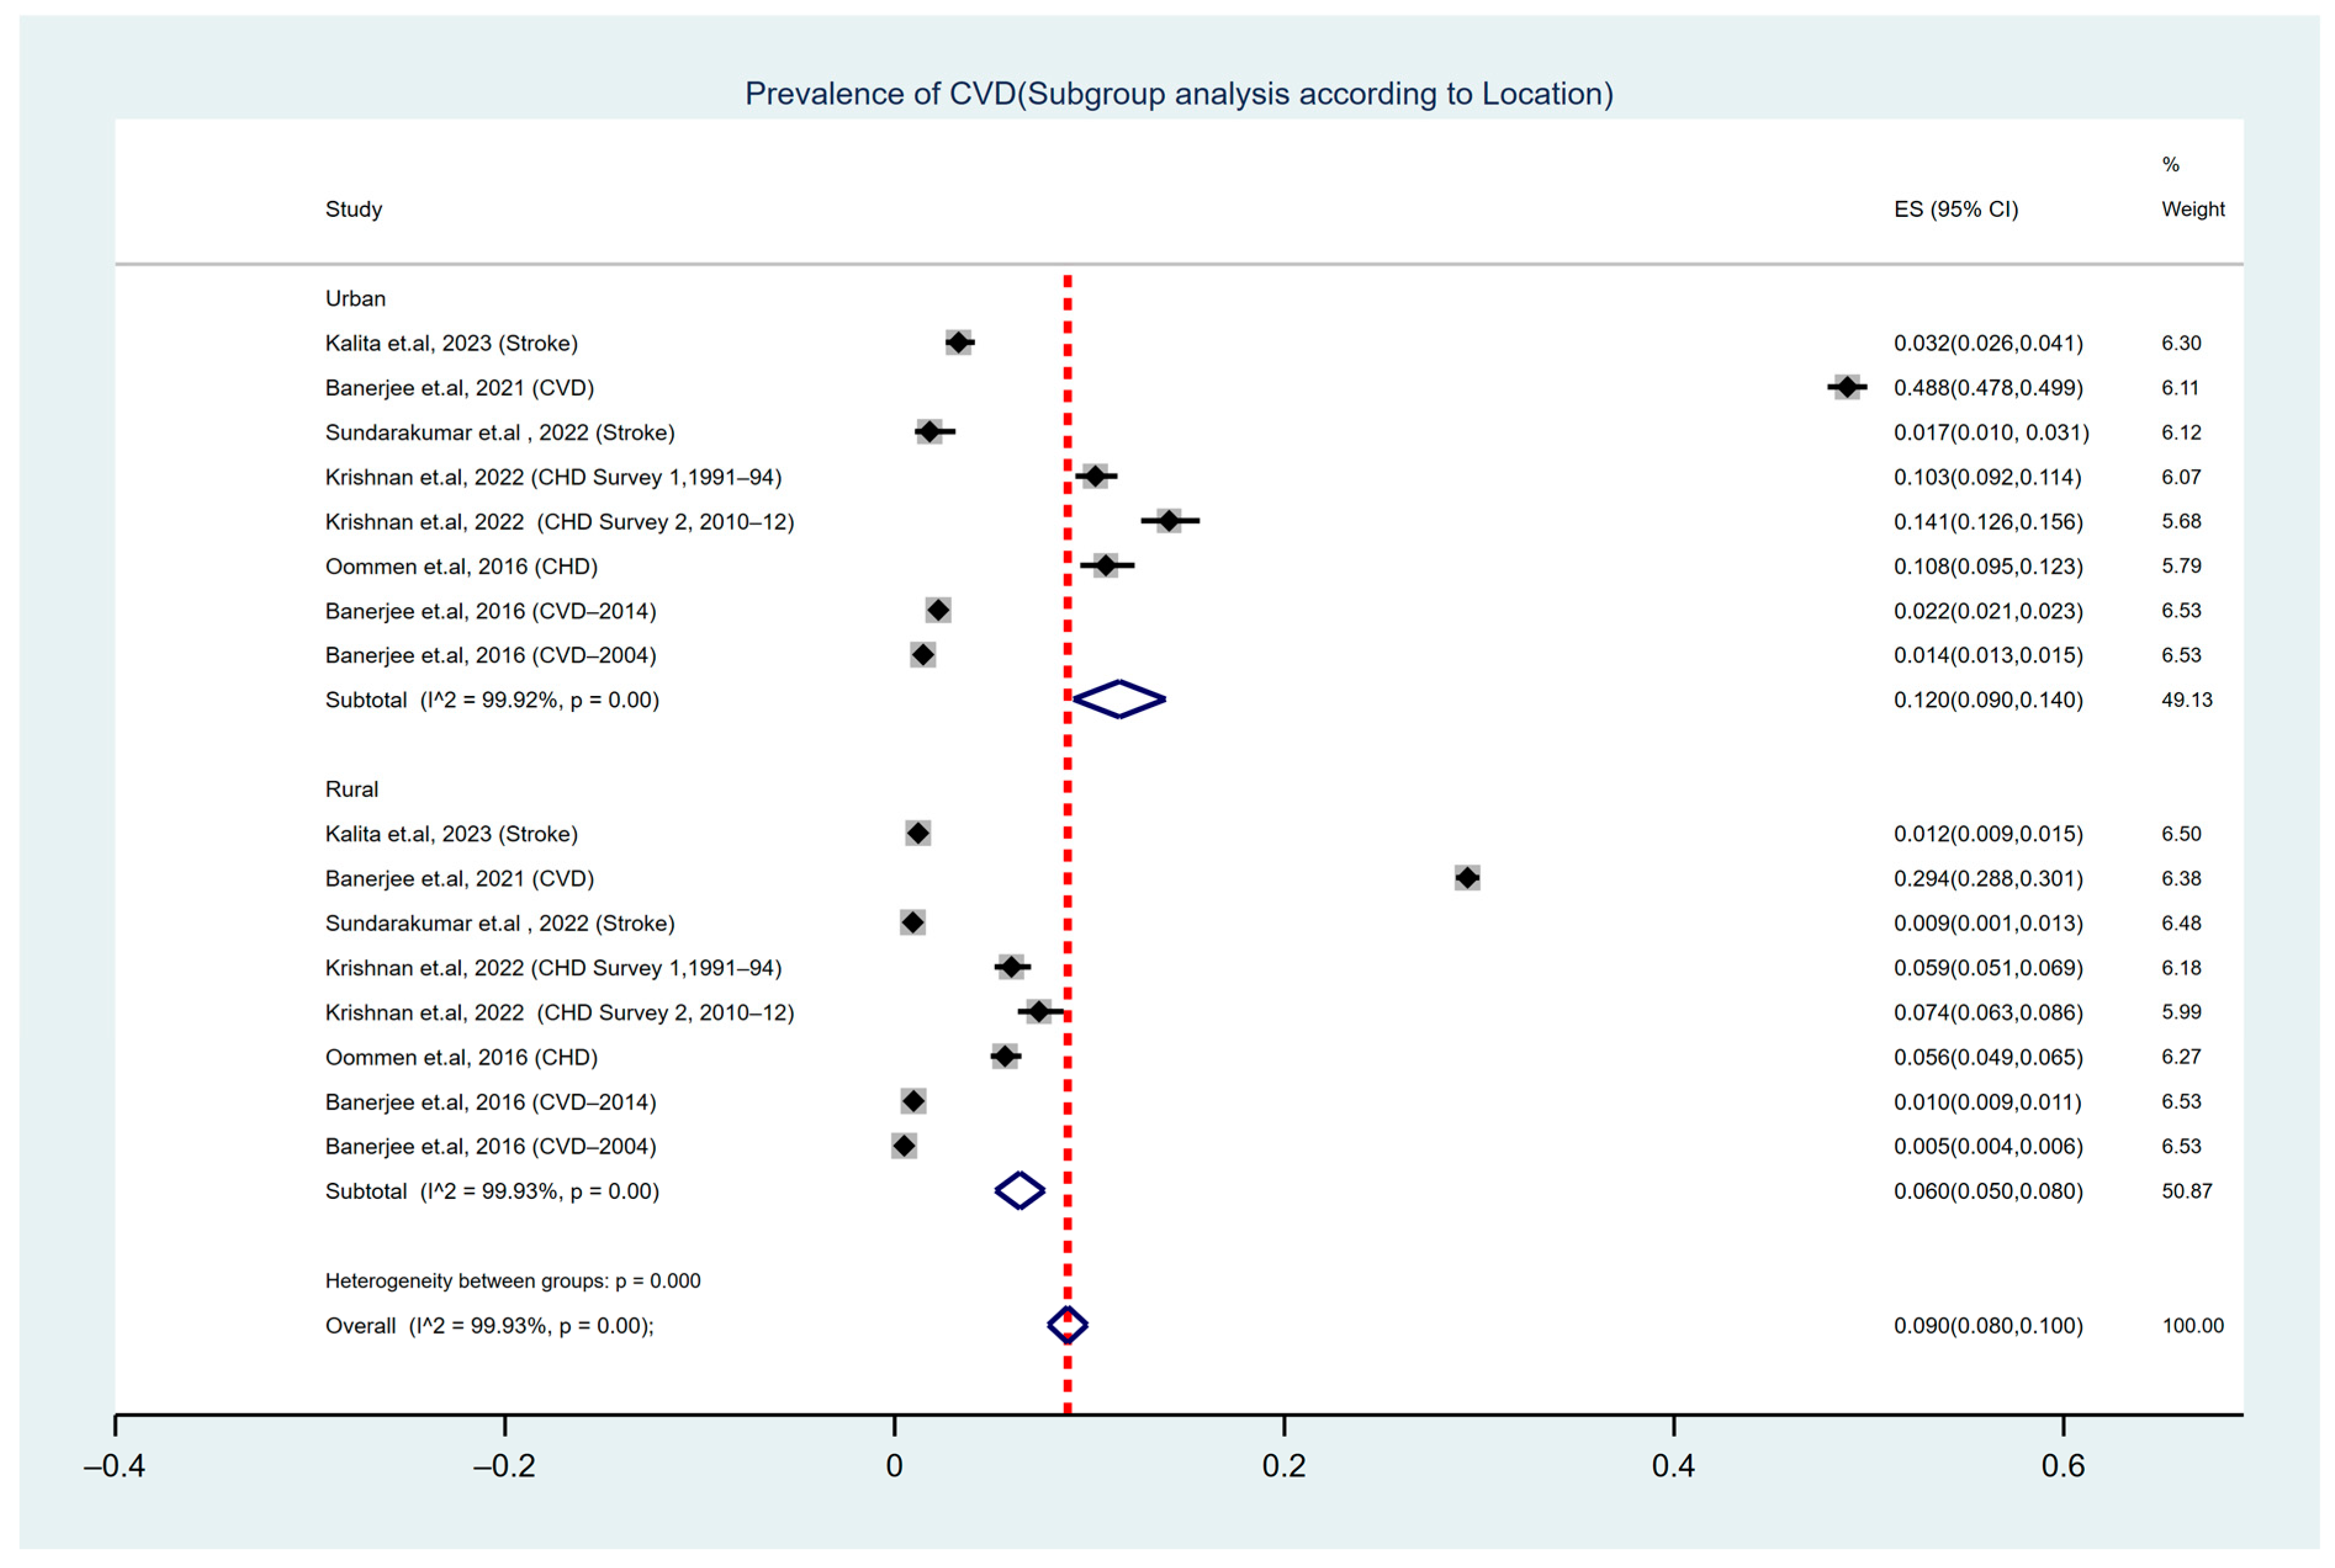
3.6. Subgroup Analysis by Geographical Location of Study Participants
3.7. CVD Prevalence: Assessment of Temporal Variation
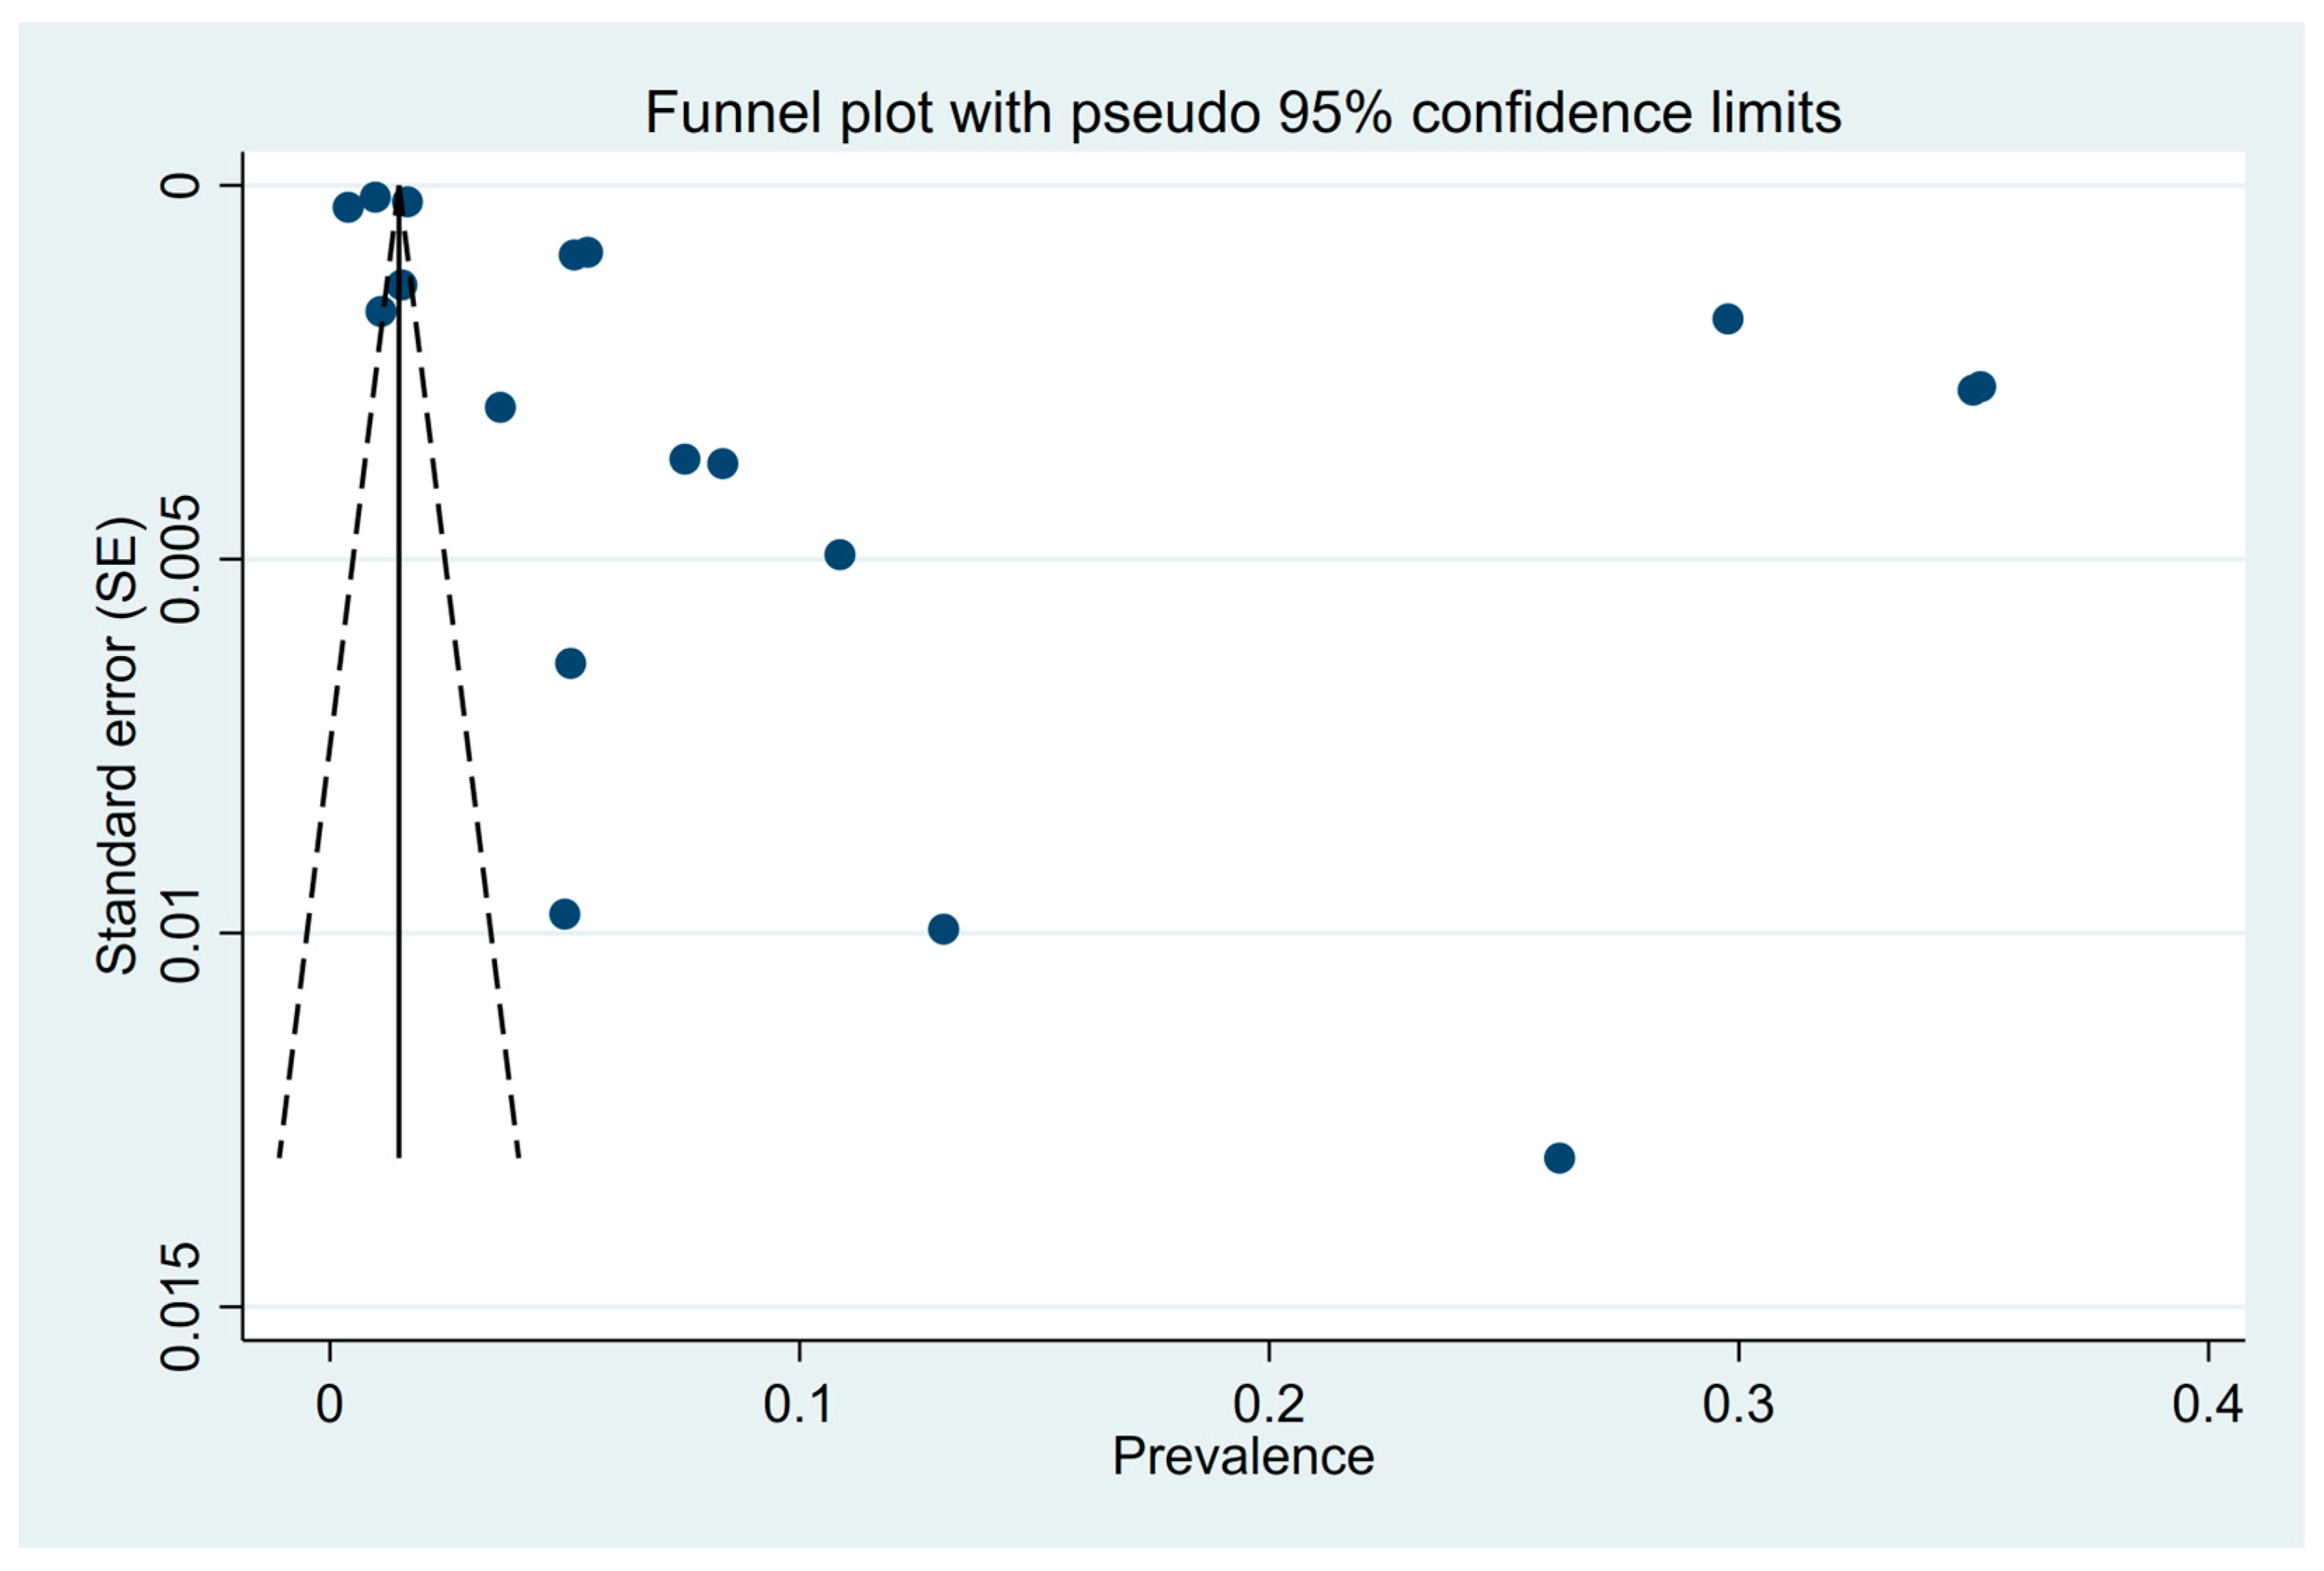
3.8. Assessment of Publication Bias
4. Discussion
5. Strength and Limitations
6. Conclusions
Supplementary Materials
Author Contributions
Funding
Institutional Review Board Statement
Conflicts of Interest
Abbreviations
| CVD | Cardiovascular disease |
| PAD | Peripheral arterial disease |
| CAD | Coronary artery disease |
| CHD | Coronary heart disease |
| ABI | Ankle–brachial systolic blood pressure index |
| ECG | Electrocardiography |
| BMI | Body mass index |
| WHO | World Health Organisation |
| NCDs | Non-communicable diseases |
| PRISMA | Preferred reporting items for systematic reviews and meta-analyses |
| JBI | Joanna Briggs Institute Critical Appraisal Checklist for Studies Reporting Prevalence Data |
References
- World Health Organization. Cardiovascular Diseases (CVDs); World Health Organization: Geneva, Switzerland, 2021. Available online: https://www.who.int/news-room/fact-sheets/detail/cardiovascular-diseases-(cvds) (accessed on 11 January 2025).
- Lindstrom, M.; DeCleene, N.; Dorsey, H.; Fuster, V.; Johnson, C.O.; LeGrand, K.E.; Mensah, G.A.; Razo, C.; Stark, B.; Turco, J.V.; et al. Global Burden of Cardiovascular Diseases and Risks Collaboration, 1990–2021. J. Am. Coll. Cardiol. 2022, 80, 2372–2425. [Google Scholar] [CrossRef]
- World Heart Federation. World Heart Report 2023: Full Report—World Heart Federation; World Heart Federation: Geneva, Switzerland, 2023; Available online: https://world-heart-federation.org/resource/world-heart-report-2023/ (accessed on 11 January 2025).
- Sreeniwas Kumar, A.; Sinha, N. Cardiovascular disease in India: A 360 degree overview. Med. J. Armed Forces India 2020, 76, 1–3. [Google Scholar] [CrossRef] [PubMed]
- World Health Organization. Noncommunicable Diseases Country Profile; World Health Organization: Geneva, Switzerland, 2014. Available online: https://www.who.int/ (accessed on 11 January 2025).
- World Health Organization. Cardiovascular Diseases India. Available online: https://www.who.int/india/health-topics/cardiovascular-diseases (accessed on 11 January 2025).
- Ferri, C.P.; Schoenborn, C.; Kalra, L.; Acosta, D.; Guerra, M.; Huang, Y.; Jacob, K.S.; Llibre Rodriguez, J.J.; Salas, A.; Sosa, A.L.; et al. Prevalence of Stroke and Related Burden among Older People Living in Latin America, India and China. J. Neurol. Neurosurg. Psychiatry 2011, 82, 1074–1082. [Google Scholar] [CrossRef] [PubMed]
- Vlachakis, C.; Dragoumani, K.; Raftopoulou, S.; Mantaiou, M.; Papageorgiou, L.; Tsaniras, S.C.; Megalooikonomou, V.; Vlachakis, D. Human emotions on the onset of cardiovascular and small vessel related diseases. In Vivo 2018, 32, 859–870. [Google Scholar] [CrossRef] [PubMed]
- Carney, R.M.; Freedland, K.E. Depression and coronary heart disease. Nat. Rev. Cardiol. 2016, 14, 145–155. [Google Scholar] [CrossRef] [PubMed]
- Winkleby, M.A.; Jatulis, D.E.; Frank, E.; Fortmann, S.P. Socioeconomic status and health: How education, income, and occupation contribute to risk factors for cardiovascular disease. Am. J. Public Health 1992, 82, 816–820. [Google Scholar] [CrossRef]
- Popkin, B.M.; Horton, S.; Kim, S.; Mahal, A.; Shuigao, J. Trends in diet, nutritional status, and diet-related noncommunicable diseases in China and India: The Economic Costs of the Nutrition transition. Nutr. Rev. 2009, 59, 379–390. [Google Scholar] [CrossRef]
- Arokiasamy, P.; Uttamacharya, N.; Jain, K. Multi-Morbidity, functional limitations, and Self-Rated health among older adults in India. SAGE Open 2015, 5, 2158244015571640. [Google Scholar] [CrossRef]
- Ivanovs, R.; Kivite, A.; Mintale, I.; Vrublevska, J.; Berze, L.; Logins, R.; Rancans, E. Anxiety associated with a reduction of cardiovascular mortality risk in primary care population in Latvia. Eur. Neuropsychopharmacol. 2017, 27, S992–S993. [Google Scholar] [CrossRef]
- Prabhakaran, D.; Jeemon, P.; Sharma, M.; Roth, G.A.; Johnson, C.; Harikrishnan, S.; Gupta, R.; Pandian, J.D.; Naik, N.; Roy, A.; et al. The Changing Patterns of Cardiovascular Diseases and Their Risk Factors in the States of India: The Global Burden of Disease Study 1990–2016. Lancet Glob. Health 2018, 6, e1339–e1351. [Google Scholar] [CrossRef]
- Geldsetzer, P.; Manne-Goehler, J.; Theilmann, M.; Davies, J.I.; Awasthi, A.; Danaei, G.; Gaziano, T.A.; Vollmer, S.; Jaacks, L.M.; Bärnighausen, T.; et al. Geographic and Sociodemographic Variation of Cardiovascular Disease Risk in India: A Cross-Sectional Study of 797,540 Adults. PLoS Med. 2018, 15, e1002581. [Google Scholar] [CrossRef]
- Munn, Z.; Moola, S.; Riitano, D.; Lisy, K. The Development of a Critical Appraisal Tool for Use in Systematic Reviews Addressing Questions of Prevalence. Int. J. Health Policy Manag. 2014, 3, 123–128. [Google Scholar] [CrossRef] [PubMed]
- Munn, Z.; Moola, S.; Lisy, K.; Riitano, D. The Systematic Review of Prevalence and Incidence Data. Joanna Briggs Inst. Rev. Man. 2014, 2014, 1–37. [Google Scholar]
- Cheung, M.W.-L.; Ho, R.C.M.; Lim, Y.; Mak, A. Conducting a Meta-analysis: Basics and Good Practices. Int. J. Rheum. Dis. 2012, 15, 129–135. [Google Scholar] [CrossRef]
- Krishnan, M.N.; Geevar, Z.; Mohanan, P.P.; Venugopal, K.; Devika, S. Prevalence of peripheral artery disease and risk factors in the elderly: A community based cross-sectional study from northern Kerala, India. Indian Heart J. 2017, 70, 808–815. [Google Scholar] [CrossRef] [PubMed]
- Sudharsanan, N.; Deshmukh, M.; Kalkonde, Y. Direct estimates of disability-adjusted life years lost due to stroke: A cross-sectional observational study in a demographic surveillance site in rural Gadchiroli, India. BMJ Open 2019, 9, e028695. [Google Scholar] [CrossRef]
- Kodali, N.K.; Bhat, L.D.; Phillip, N.E.; Koya, S.F. Prevalence and associated factors of cardiovascular diseases among men and women aged 45 years and above: Analysis of the longitudinal ageing study in India, 2017–2019. Indian Heart J. 2022, 75, 31–35. [Google Scholar] [CrossRef] [PubMed]
- Kalita, J.; Bharadwaz, M.P.; Aditi, A. Prevalence, contributing factors, and economic implications of strokes among older adults: A study of North-East India. Sci. Rep. 2023, 13, 16880. [Google Scholar] [CrossRef]
- Mohanty, S.K.; Abhilasha, N.; Mishra, R.S.; Upadhyay, A.K.; O’Donnell, O.; Maurer, J. Sociodemographic and geographic inequalities in diagnosis and treatment of older adults’ chronic conditions in India: A nationally representative population-based study. BMC Health Serv. Res. 2023, 23, 332. [Google Scholar] [CrossRef]
- Banerjee, S.; Kumar, P.; Srivastava, S.; Banerjee, A. Association of Anthropometric Measures of Obesity and Physical Activity with Cardio-Vascular Diseases among Older Adults: Evidence from a Cross-Sectional Survey, 2017–2018. PLoS ONE 2021, 16, e0260148. [Google Scholar] [CrossRef]
- Muhammad, T.; Pai, M.; Ansari, S. Gender differences in the association between cardiovascular diseases and major depressive disorder among older adults in India. Dialogues Health 2023, 2, 100107. [Google Scholar] [CrossRef] [PubMed]
- Barik, B.S.; Dash, S.T.; Barik, M.; Yadav, V.S.; Hussain, T.; Pati, S. Study of the morbidity pattern among geriatric patients attending a secondary care hospital in Bhubaneswar, Odisha. Aging Med. Healthc. 2022, 13, 78–86. [Google Scholar] [CrossRef]
- Sundarakumar, J.S.; Menesgere, A.L.; Jain, S.; Hameed, S.K.S.; Ravindranath, V. Prevalence of neuropsychiatric conditions and cognitive impairment in two parallel, aging study cohorts from rural and urban India. Alzheimer’s Dement. 2022, 19, 2469–2478. [Google Scholar] [CrossRef] [PubMed]
- Kundu, J.; Chakraborty, R. Socio-economic inequalities in burden of communicable and non-communicable diseases among older adults in India: Evidence from Longitudinal Ageing Study in India, 2017–2018. PLoS ONE 2023, 18, e0283385. [Google Scholar] [CrossRef]
- Bodkhe, S.; Jajoo, S.U.; Jajoo, U.N.; Ingle, S.; Gupta, S.S.; Taksande, B.A. Epidemiology of confirmed coronary heart disease among population older than 60 years in rural central India—A community-based cross-sectional study. Indian Heart J. 2019, 71, 39–44. [Google Scholar] [CrossRef]
- Krishnan, A.; Asadullah, M.; Roy, A.; Praveen, P.A.; Singh, K.; Amarchand, R.; Gupta, R.; Ramakrishnan, L.; Kondal, D.; Tandon, N.; et al. Change in prevalence of Coronary Heart Disease and its risk between 1991–94 to 2010–12 among rural and urban population of National Capital Region, Delhi. Indian Heart J. 2020, 72, 403–409. [Google Scholar] [CrossRef]
- Negi, P.C.; Chauhan, R.; Rana, V.; Vidyasagar, N.; Lal, K. Epidemiological study of non-communicable diseases (NCD) risk factors in tribal district of Kinnaur, HP: A cross-sectional study. Indian Heart J. 2016, 68, 655–662. [Google Scholar] [CrossRef] [PubMed]
- Oommen, A.M.; Abraham, V.J.; George, K.; Jose, V.J. Prevalence of coronary heart disease in rural and urban Vellore: A repeat cross-sectional survey. Indian Heart J. 2016, 68, 473–479. [Google Scholar] [CrossRef]
- Banerjee, K.; Dwivedi, L.K. Burden assessment of infectious and cardio-vascular diseases in India for the decade 2004–2014. Epidemiol. Health 2016, 38, e2016057. [Google Scholar] [CrossRef] [PubMed]
- Chadha, S.L.; Gopinath, N.; Shekhawat, S. Urban-Rural Differences in the Prevalence of Coronary Heart Disease and Its Risk Factors in Delhi. Bull. World Health Organ. 1997, 75, 31–38. [Google Scholar] [PubMed]
- Roth, G.A.; Mensah, G.A.; Johnson, C.O.; Addolorato, G.; Ammirati, E.; Baddour, L.M.; Barengo, N.C.; Beaton, A.Z.; Benjamin, E.J.; Benziger, C.P.; et al. Global Burden of Cardiovascular Diseases and Risk Factors, 1990–2019. J. Am. Coll. Cardiol. 2020, 76, 2982–3021. [Google Scholar] [CrossRef]
- Vaduganathan, M.; Mensah, G.A.; Turco, J.V.; Fuster, V.; Roth, G.A. The Global Burden of Cardiovascular Diseases and Risk. J. Am. Coll. Cardiol. 2022, 80, 2361–2371. [Google Scholar] [CrossRef]
- Li, Y.; Cao, G.; Jing, W.; Liu, J.; Liu, M. Global Trends and Regional Differences in Incidence and Mortality of Cardiovascular Disease, 1990−2019: Findings from 2019 Global Burden of Disease Study. Eur. J. Prev. Cardiol. 2023, 30, 276–286. [Google Scholar] [CrossRef] [PubMed]
- Prabhakaran, D.; Jeemon, P.; Roy, A. Cardiovascular Diseases in India: Current Epidemiology and Future Directions. Circulation 2016, 133, 1605–1620. [Google Scholar] [CrossRef]
- Anand, S.S.; Yusuf, S.; Vuksan, V.; Devanesen, S.; Teo, K.K.; Montague, P.A.; Kelemen, L.; Yi, C.; Lonn, E.; Gerstein, H.; et al. Differences in Risk Factors, Atherosclerosis, and Cardiovascular Disease Between Ethnic Groups in Canada: The Study of Health Assessment and Risk in Ethnic Groups (SHARE). Lancet 2000, 356, 279–284. [Google Scholar] [CrossRef] [PubMed]
- Nanda, H.; Shivgotra, V.K. Gender Prevalence of Cardiovascular Diseases in the Geriatric Population of India: A Meta-Analysis Using R. WJMA 2020, 8, 15–26. [Google Scholar] [CrossRef]
- Rethemiotaki, I. Global Prevalence of Cardiovascular Diseases by Gender and Age during 2010–2019. Arch. Med. Sci. Atheroscler. Dis. 2024, 8, 196–205. [Google Scholar] [CrossRef]
- Matthews, K.A.; Meilahn, E.; Kuller, L.H.; Kelsey, S.F.; Caggiula, A.W.; Wing, R.R. Menopause and Risk Factors for Coronary Heart Disease. N. Engl. J. Med. 1989, 321, 641–646. [Google Scholar] [CrossRef]
- Harvard Medical School. Throughout Life, Heart Attacks Are Twice as Common in Men than Women. Harvard Health Publishing. 2016. Available online: https://www.health.harvard.edu/heart-health/throughout-life-heart-attacks-are-twice-as-common-in-men-than-women (accessed on 11 January 2025).
- Mosca, L.; Barrett-Connor, E.; Kass Wenger, N. Sex/Gender Differences in Cardiovascular Disease Prevention: What a Difference a Decade Makes. Circulation 2011, 124, 2145–2154. [Google Scholar] [CrossRef] [PubMed]
- Towfighi, A. Sex-Specific Trends in Midlife Coronary Heart Disease Risk and Prevalence. Arch. Intern. Med. 2009, 169, 1762. [Google Scholar] [CrossRef] [PubMed]
- Mendez, M.A.; Monteiro, C.A.; Popkin, B.M. Overweight Exceeds Underweight among Women in Most Developing Countries. Am. J. Clin. Nutr. 2005, 81, 714–721. [Google Scholar] [CrossRef] [PubMed]
- Dong, Y.; Gao, W.; Nan, H.; Yu, H.; Li, F.; Duan, W.; Wang, Y.; Sun, B.; Qian, R.; Tuomilehto, J.; et al. Prevalence of Type 2 Diabetes in Urban and Rural Chinese Populations in Qingdao, China. Diabet. Med. 2005, 22, 1427–1433. [Google Scholar] [CrossRef] [PubMed]
- Chowdhury, M.; Haque, M.A.; Farhana, Z.; Anik, A.; Chowdhury, A.H.; Haque, S.M.; Marjana, L.-L.-W.; Bristi, P.; Mamun, B.A.A.; Uddin, M.; et al. Prevalence of Cardiovascular Disease among Bangladeshi Adult Population: A Systematic Review and Meta-Analysis of the Studies. VHRM 2018, 14, 165–181. [Google Scholar] [CrossRef]
- Low, W.-Y.; Lee, Y.-K.; Samy, A.L. Non-Communicable Diseases in the Asia-Pacific Region: Prevalence, Risk Factors and Community-Based Prevention. Int. J. Occup. Med. Environ. Health 2014, 28, 20–26. [Google Scholar] [CrossRef] [PubMed]
- Mathenge, W.; Foster, A.; Kuper, H. Urbanization, Ethnicity and Cardiovascular Risk in a Population in Transition in Nakuru, Kenya: A Population-Based Survey. BMC Public Health 2010, 10, 569. [Google Scholar] [CrossRef] [PubMed]
- Christensen, D.L.; Eis, J.; Hansen, A.W.; Larsson, M.W.; Mwaniki, D.L.; Kilonzo, B.; Tetens, I.; Boit, M.K.; Kaduka, L.; Borch-Johnsen, K.; et al. Obesity and Regional Fat Distribution in Kenyan Populations: Impact of Ethnicity and Urbanization. Ann. Hum. Biol. 2008, 35, 232–249. [Google Scholar] [CrossRef] [PubMed]
- Addo, J.; Smeeth, L.; Leon, D.A. Hypertension in Sub-Saharan Africa: A Systematic Review. Hypertension 2007, 50, 1012–1018. [Google Scholar] [CrossRef]
- Attard, S.M.; Herring, A.H.; Zhang, B.; Du, S.; Popkin, B.M.; Gordon-Larsen, P. Associations between Age, Cohort, and Urbanization with SBP and DBP in China: A Population-Based Study across 18 Years. J. Hypertens. 2015, 33, 948–956. [Google Scholar] [CrossRef]
- Lawes, C.M.; Hoorn, S.V.; Rodgers, A. Global Burden of Blood-Pressure-Related Disease, 2001. Lancet 2008, 371, 1513–1518. [Google Scholar] [CrossRef]
- Misra, A.; Khurana, L. The Metabolic Syndrome in South Asians: Epidemiology, Determinants, and Prevention. Metab. Syndr. Relat. Disord. 2009, 7, 497–514. [Google Scholar] [CrossRef]


| Study | Year | Age Range | Gender | Sample Size | Study Area | Sampling Method | Study Design | Main Outcome | Criteria for Diagnosis of CVD | Prevalence (%) |
|---|---|---|---|---|---|---|---|---|---|---|
| Krishnan et al. [19] | 2018 | 60–79 years | Both | 1148 | Northern parts of Kerela | Door to door | Cross-sectional | PAD and CAD | PAD by ABI, CAD by clinical history, and ECG | PAD = 26.7%, male = 23.01%, female = 28.57%; CAD = 13.07%, male = 15.52%, female = 11.20% |
| Sudharsanan et al. [20] | 2019 | 60.9 years (mean age) | Both | 45,053 | Gadchiroli, Maharashtra | House to house | Cross-sectional descriptive study | Stroke | Confirmed by trained physician and neurologist using WHO’s criteria | Stroke = 388.4 per 100,000 person (0.39%), male = 519.4 per 100,000 person (0.51%), female = 255.1 per 100,000 person (0.25%) |
| Kodali et al. [21] | 2022 | ≥45 years | Both | 56,935 | All Indian states and union territories | Multistage cluster sample survey | Cross-sectional | CVD, CHD, heart attack, and stroke | Clinical profile and medical history | CVD = 5.2%, female = 4.6%, male- = 5.9%; CHD/heart attack = 2.8%, female = 2.4%, male = 3.2%; stroke = 1.6%, female = 1.2%, male = 2.0% |
| Kalita et al. [22] | 2023 | ≥45 years | Both | 8496 | Seven north-eastern states of India | Multistage stratified cluster sampling | Cross-sectional | Stroke | Clinical profile and medical history | Stroke = 1.53%, male = 2.3%, female = 1%, urban = 3.26%, rural = 1.21% |
| Mohanty et al. [23] | 2023 | ≥45 years | Both | 64,755 | All Indian states and union territories | Stratified, multistage probability cluster random sampling | Cross-sectional | Heart disease/stroke | Clinical profile and medical history | Stroke = 5.5% |
| Banerjee et al. [24] | 2021 | ≥60 years | Both | 31,464 | All Indian states and union territories | Multistage stratified area probability cluster sampling design | Cross-sectional | CVD | Clinical profile and medical history | CVD = 35.2%, female = 38.8%, male = 31.1%, urban—48.9%, rural—29.4% |
| Muhammad et al. [25] | 2023 | ≥60 years | Both | 30,333 | All Indian states and union territories | Multistage stratified cluster sampling | Cross-sectional | Stroke, heart disease | Clinical profile and medical history | Stroke = 2.78%, male = 3.29%, female = 2.23%; heart disease = 5.25%, male = 5.81%, female = 4.64% |
| Barik et al. [26] | 2022 | 60–100 years | Both | 500 | Bhubaneswar Odisha | Convenience sampling | Cross-sectional exploratory study | CVD | Clinical profile and medical history | CVD = 5%, male = 4.6%, female = 5.52% |
| Sundarakumar et al. [27] | 2022 | ≥45 years | Both | 3777 | Karnataka | Multistage stratified | Cross-sectional | Stroke | Self-reported | Stroke = 1.09%, rural = 0.93%, urban = 1.80% |
| Kundu et al. [28] | 2023 | ≥45 years | Both | 65,562 | All Indian states and union territories | Multistage stratified area probability cluster sampling design | Cross-sectional observational study | CVD | Clinical profile and medical history | CVD = 29.76%, poor = 24.6%, rich = 33.2% |
| Bodkhe et al. [29] | 2019 | ≥60 years | Both | 1190 | Wardha district, Maharashtra | Not reported | Cross-sectional | CHD | Confirmed by health professionals | CHD = 5.31%, male = 5%, female = 5.25% |
| Krishnan et al. [30] | 2020 | 35–64 years | Both | 5535 | Delhi NCR | Multistage cluster sampling (urban), random sampling (rural) | Cross-sectional | CHD | Minnesota-coded ECG | CHD = 8.36%, urban = 10.3%, rural = 6.0%, male = 8.21%, female = 8.44% |
| Krishnan et al. [30] | 2020 | 35–64 years | Both | 3969 | Delhi NCR | Multistage cluster sampling (urban), random sampling (rural) | Cross-sectional | CHD | Minnesota-coded ECG | CHD = 10.86%, urban = 14.1%, rural = 7.4%, male = 8.9%, female = 10.2% |
| Negi et al. [31] | 2016 | 20–70 years | Both | 3968 | Kinnaur, Himachal Pradesh | Simple random | Cross-sectional | CVD | By health supervisors | CVD = 4.4%, male = 3.9%, female = 4.5% |
| Oommen et al. [32] | 2016 | 30–40 years | Both | 6196 | Rural and urban Vellore | Probability proportional to size (PPS) | Repeat cross-sectional | CHD | Previous diagnosis, ECG | CHD = 7.55%, male = 4.78%, female = 9.6%, rural = 5.66%, urban = 5.60% |
| Banerjee et al. [33] | 2016 | ≥30 years | Both | 385,055 (2004) | All Indian states and union territories | Systematic random sampling | Cross-sectional | CVD | Clinical profile and medical history | CVD = 0.734%, urban = 14.3%, rural = 4.86% |
| Banerjee et al. [33] | 2016 | ≥30 years | Both | 335,499 (2014) | All Indian states and union territories | Systematic random sampling | Cross-sectional | CVD | Clinical profile and medical history | CVD = 1.348%, urban = 22.44%, rural = 9.65% |
| Study | Was the Sample Representative of the Target Population? | Were Study Participants Recruited in an Appropriate Way? | Was the Sample Size Adequate? | Were the Study Subjects and Setting Described in Detail? | Was the Data Analysis Conducted with Sufficient Coverage of the Identified Sample? | Were Objective, Standard Criteria Used for Measurement of the Condition? | Was the Condition Measured Reliably? | Was There Appropriate Statistical Analysis? | Are all the Important Confounding Factors/Subgroups/Differences Identified and Accounted for? | Were Subpopulations Identified Using Objective Criteria? | Risk of Bias |
|---|---|---|---|---|---|---|---|---|---|---|---|
| Krishnan et al. (2018) [19] | Yes | Yes | Yes | Yes | Yes | Yes | Yes | Yes | Not clear | Yes |  |
| Sudharsanan et al. (2019) [20] | Yes | Yes | Yes | Yes | Yes | Yes | Yes | Yes | Not clear | Yes | |
| Kodali et al. (2022) [21] | Yes | Yes | Yes | Yes | Yes | Yes | Yes | Yes | Yes | Yes | |
| Kalita et al. (2023) [22] | Yes | Yes | Yes | Yes | Yes | Yes | Yes | Yes | Yes | Yes | |
| Mohanty et al. (2023) [23] | Yes | Yes | Yes | Yes | Yes | Yes | Yes | Yes | Yes | Yes | |
| Banerjee et al. (2021) [24] | Yes | Yes | Yes | Yes | Yes | Yes | Yes | Yes | Yes | Yes | |
| Muhammad et al. (2023) [25] | Yes | Yes | Yes | Yes | Yes | Yes | Yes | Yes | Yes | Yes | |
| Barik et al. (2022) [26] | Yes | Yes | Yes | Yes | Yes | No | No | Yes | No | No |  |
| Sundarakumar et al. (2022) [27] | Yes | Yes | Yes | Yes | Yes | Yes | Yes | Unclear | Unclear | Yes | |
| Kundu et al. (2023) [28] | Yes | Yes | Yes | Yes | Yes | Yes | Yes | Yes | Yes | Yes | |
| Bodkhe et al. (2019) [29] | Yes | Yes | Yes | Yes | Yes | Yes | Yes | Unclear | Unclear | Yes | |
| Krishnan et al. (2022) [30] | Yes | Yes | Yes | Yes | Yes | Yes | Yes | Yes | Yes | Yes | |
| Negi et al. (2016) [31] | Yes | Yes | Yes | Yes | Yes | Not clear | Yes | Yes | Yes | Yes | |
| Oommen et al. (2016) [32] | Yes | Yes | Yes | Yes | Unclear | Yes | Unclear | Unclear | Unclear | Yes | |
| Banerjee et al. (2016) [33] | Yes | Yes | Yes | Yes | Yes | Not clear | Yes | Yes | Yes | Yes | |
Disclaimer/Publisher’s Note: The statements, opinions and data contained in all publications are solely those of the individual author(s) and contributor(s) and not of MDPI and/or the editor(s). MDPI and/or the editor(s) disclaim responsibility for any injury to people or property resulting from any ideas, methods, instructions or products referred to in the content. |
© 2025 by the authors. Licensee MDPI, Basel, Switzerland. This article is an open access article distributed under the terms and conditions of the Creative Commons Attribution (CC BY) license (https://creativecommons.org/licenses/by/4.0/).
Share and Cite
Shannawaz, M.; Rathi, I.; Shah, N.; Saeed, S.; Chandra, A.; Singh, H. Prevalence of CVD Among Indian Adult Population: Systematic Review and Meta-Analysis. Int. J. Environ. Res. Public Health 2025, 22, 539. https://doi.org/10.3390/ijerph22040539
Shannawaz M, Rathi I, Shah N, Saeed S, Chandra A, Singh H. Prevalence of CVD Among Indian Adult Population: Systematic Review and Meta-Analysis. International Journal of Environmental Research and Public Health. 2025; 22(4):539. https://doi.org/10.3390/ijerph22040539
Chicago/Turabian StyleShannawaz, Mohd, Isha Rathi, Nikita Shah, Shazina Saeed, Amrish Chandra, and Harpreet Singh. 2025. "Prevalence of CVD Among Indian Adult Population: Systematic Review and Meta-Analysis" International Journal of Environmental Research and Public Health 22, no. 4: 539. https://doi.org/10.3390/ijerph22040539
APA StyleShannawaz, M., Rathi, I., Shah, N., Saeed, S., Chandra, A., & Singh, H. (2025). Prevalence of CVD Among Indian Adult Population: Systematic Review and Meta-Analysis. International Journal of Environmental Research and Public Health, 22(4), 539. https://doi.org/10.3390/ijerph22040539