1. Introduction
Obesity is a chronic disease whose prevalence has been described as reaching “epidemic” proportions around the world [
1,
2]. Obesity is associated with a high risk of morbidity, mortality as well as reduced life expectancy [
3]. The major health consequences of overweight and obesity are type 2 diabetes mellitus, all cancers except esophageal (female), pancreatic and prostate cancer, all cardiovascular diseases (except congestive heart failure), asthma, gallbladder disease, osteoarthritis and chronic back pain [
4].
Particularly worrisome is the fact that among European school-age children (as an indicator of trends among older children and, eventually, adults in the decades to come), the prevalence rates of overweight are not only rising but also apparently accelerating [
5]. It is most alarming that the current prevalence rate of childhood obesity in Europe and North America is more than 10 times higher than that of the 1970s. By 2010 it is estimated that 26 million children in the EU countries will be overweight, including 6.4 million who will be obese [
6].
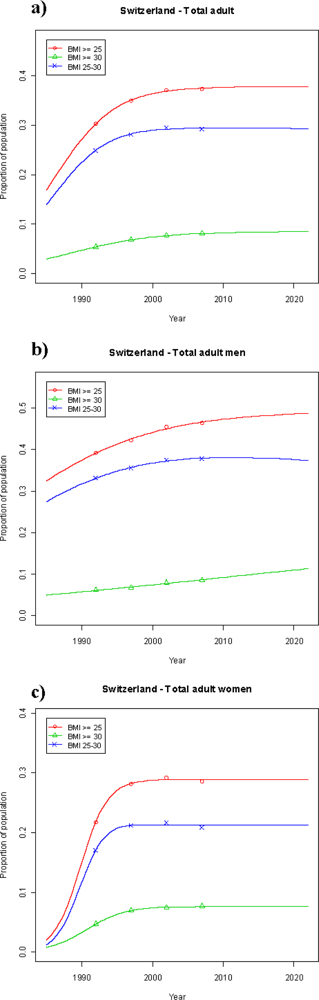
Switzerland is no exception among other European countries. Data from the fourth National Health Survey conducted by the Swiss Federal Institute of Statistics in 2007 showed that the prevalence of obesity in the general adult population, defined as body mass index (BMI) ≥ 30, had increased by 2.7% points to 8.1% since the first National Health Survey from 1992/93 [
7]. For the entire adult Swiss population with BMI ≥ 25, a prevalence of 37.3% was observed in 2007 [
8].
The goal of the present study is to address the question whether the observed alarming trend over the past 15 years may be expected to continue over the upcoming 15 years. Thus, a forecast until 2022 in the development of adult overweight and obesity in Switzerland was conducted through modeling based on the four National Health Surveys. For comparison, this model was also applied to other European countries (France, UK) as well as to the US and Australia.
2. Methods and Procedures
Our trend analyses were based on prevalence data from the Swiss National Health Surveys first instituted in 1992/3 and carried out by the Swiss Ministry of Statistics (Bundesamt für Statistik (BFS)) in 5 years intervals (see
Table 1). The National Health Surveys of Switzerland are a series of phone surveys executed as part of an overall program of surveys commissioned by the Swiss Ministry of Health,
i.e., the
Bundesamt für Gesundheit (BAG) designed to collect information on various health aspects of the adult Swiss population (age > 15 years) from a nationally representative sample by repeated use of the same questionnaire over time.
Target populations: In this study overweight and obesity populations were defined via BMI: overweight from 25–29.9 kg/m2, overweight and obesity as BMI ≥ 25, and obesity as BMI ≥ 30 kg/m2.
Data sources used for trend projections:
Switzerland: Previously published prevalence data on overweight and obesity of the Swiss population (age < 15 years) from the first three National Health Surveys (self-reported data) conducted in 1992/3, 1997 and 2002 were used in our trend analysis [
7]. Furthermore, prevalence data from the fourth Health Surveys conducted in 2007 were available [
8]. An additional data set refers to rates of overweight and obesity separated for young men and women of 15–24 years old.
Other countries: The prevalence data for overweight and obesity for the comparing countries—France, UK, USA (National Health Interview Survey, NIHS) and Australia—were obtained from the recently published OECD (Organization for Economic Co-operation and Development) Health Working Paper No. 45, which reported on the obesity epidemic in selected OECD countries [
9]. All data provided in this report refer to rates of overweight and obesity separated for men and women aged 15–64 years old. With the exception of the UK (health examination survey), all data collections were based on National Health Interview Surveys [
9].The former provides information on measured BMI, while the latter present self-reported figures.
Statistical analysis: The most natural model function for proportions is the logistic function as displayed in
Equation (1)where p is the proportion of population and A, B and C are parameters to be determined.
Equation (1) represents a sigmoid curve starting at 0 or 0% in earlier years and going towards A in the future. The maximum of A is 1, corresponding to 100%. Depending on the number of parameters used, we distinguish between the 2-parametric (with a fixed value for A) and the 3-parametric logistic function (where A is estimated together with parameters B and C). Using A as a fixed parameter we can estimate the parameters B and C by linearizing
Equation (1) to
and use the estimated intercept (B) and slope (C) as start values for the non-linear model of
Equation (1). For the fixed value of A in the linear model, we used the 1.2-fold of the largest proportion p of the data (except for the obesity data of Australia: an A value of 0.3 was used). The assumption behind using an estimate of A below 1 is that never are all people either overweight or obese. These estimated parameters A, B and C are then used in the 3-parametric non-linear regression as start values for the curve fitting process. In case the 3-parametric logistic regression did not converge, we used the 2-parametric logistic regression model using A = 1. In order to assure that the data points were not in the asymptotic part of the S-shaped regression line, the descriptor variable
Year was centralized before its use in the statistical model equation. Obvious outliers, most probably due to a biased population of the surveys, were eliminated as indicated in
Table 2.
Equation (1) with the estimated parameters was then used to predict the proportion p for the year 2022. The uncertainty of this prediction is quite large. It becomes larger with increasing distance from the closest measured point, the smaller the number of actual measurements and the higher the spread around the fitted line. In addition, the predictions are more reliable if the measuring points are located in the upper part of the S-shaped curve. Curves and predictions for the intermediate BMI segment between 25 and 30 are calculated as the difference between the BMI ≥ 25 and BMI ≥ 30 curve values.
The results presented show the expected proportions of the populations of the various countries analyzed that will be overweight or obese in 2022. The obtained prevalence rates were plotted as non-linear curves. The parameters A, B and C of these curves are given in
Table 2. SAS
® statistical software version 9.2 and R version 2.8.1 (R Development Core Team (2008)) were used.
4. Discussion
As reported by the International Association for the Study of Obesity (IASO), the prevalence of obesity as defined by BMI ≥ 30 has surpassed the 20% population mark in many European countries [
12]. As a consequence, overweight and obesity are frequently making media headlines and are amongst the highest priority public health issues in the world [
13]. To make matters worse, current evidence suggests that the prevalence of overweight and obesity is likely to remain on the rise in the US [
14], developing countries [
15] as well as Europe [
16]. Taking this worldwide development in obesity into account, one central question arises: When will this global trend of increasing overweight and obesity come to an end?
The present study aimed at providing a possible answer to this question with respect to the overweight and obesity situation in Switzerland. Between 1992 and 2007 a rapid and significant increase in the prevalence of overweight and obesity (BMI ≥ 25) in the adult Swiss population (age > 15) by 7% to a total of 37.3% was observed, consisting of a predominant increase in the proportion of overweight individuals (BMI 25–30) by 4.3% and a concomitant increase of the obese population by 2.7%.
The projection until 2022 based on the above prevalence data by a logistic regression model offers an estimated minimal increase to 37.7% in the prevalence of the overweight and obese segment of the Swiss population (BMI ≥ 25), indicating stabilization at a plateau below 40%. This interpretation is supported by trend analysis of the youngest segment (age 15–24) of the adult overweight and obese population with BMI ≥ 25, as the projection of the assumed prevalence in 2022 shows only a small increase by 1.1%. Regarding the expected obesity prevalence in 2022, the projected value is 8.4% in the entire Swiss population, a slight increase by 0.3% compared to 2007, again indicating stabilization at a level below 10%. Although the projected value for 2022 in the youngest population segment (age 15–24) increases to 4.3% from 1.8% in 2007, it does not necessarily contradict the trend towards stabilization expected in the entire Swiss population. It has to be kept in mind that the projection in the young obese population segment is based upon a small number of individuals with a corresponding high degree of uncertainty.
Our prediction for the expected development of overweight and obesity in Switzerland is not as grim as a recent projection for the US, which forecasts that, by 2048, all American adults would become overweight or obese, while black women will reach this state by 2034 [
17]. In the context of this gloomy projection for the US population, it has to be mentioned that for this US projections a linear regression model was used to extrapolate future prevalence rates. Obviously, a simple linear model for proportional data is only appropriate in the approximately linear region of the S-shaped curve and does not allow projections in the asymptotic part of the curve. Using a logistic regression model approach with a 3-parameter logistic function, however, not only accounts for the slowdown of the rates at both ends of the curve but also allows the overweight population to reach a limit below 100% (parameter A < 1), while attaining a close match to the data already available. Thus, using the US-NHIS data in our model, the US overweight prevalence rate is projected to level out until 2022 around 63% from 59.3% in 2005. The same levelling of the US obesity trend was found in projections produced in 2006 by the Centers of Disease Control and Prevention [
18]. Furthermore, our findings were recently confirmed in the context of a study projecting the future diabetes population in the US and describing that the overall distribution in the non-diabetic population remains fairly stable with ~65% being overweight or obese [
19]. Interestingly, the curve obtained from the UK prevalence data between 1991 and 2005 is virtually matching the US prevalence curve (
Figure 2a). A similar overlap of obesity prevalence curves, both observed and projected, between the US and the UK results from our model approach indicates that the situation in the past and the future appears to be comparable between these two countries (
Figure 2b). A similar development in overweight and obesity prevalence has also been observed in 1990–2007 between Switzerland and France, but at lower levels than in the US and the UK. The projections predict a levelling out for overweight until 2022 in both countries eventually reaching a level between 38% and 42%, compared to approximately 63% in the US and the UK. While the obesity prevalence in France may increase to about 17%, the situation in Switzerland is expected to remain stable (8.4%), less than a third of the obesity prevalence projected for the US and the UK. The most rapid increase in overweight prevalence over time has been experienced in Australia (
Figure 2a). Trend analysis results in the highest expected overweight prevalence for all five countries evaluated to about 65% in 2022. In support of our findings, similar projected trends regarding France, US, UK and Australia have been described in the recently published OECD working paper [
9].
An interesting finding of the present study refers to the obvious differences in overweight and obesity prevalence rates observed between the evaluated countries, particularly between Switzerland and France on one side and the US, UK and Australia on the other. Unfortunately, there is no simple explanation for the observed, obvious differences between these industrialized countries. It may be speculated that differences in the obesogenic environments (aspects of physical, social and economic environments that favour obesity development) exist between the US, UK and Australia and the two central European countries that could be responsible for the observed differences in overweight and obesity prevalence rates developed over time. It has been argued that obesity represents a life-style situation heavily influenced by genetic heritage [
20]. Genetics alone, however, cannot account for the increase in overweight and obesity encountered in many countries over the past 2–3 decades [
9]. Although socioeconomic difference in obesity prevalence rates are well documented, in countries where the largest socioeconomic disparities exist, overweight and obesity rates are not necessarily the highest [
9]. Overweight and obesity may also be viewed as environmental (social) phenomena promoting physical inactivity and excessive food consumption [
21]. Research showed that the spread of obesity in social networks (family, peer groups) appears to be another important factor in the global obesity epidemic [
22]. In summary, it appears that obesogenic environments that promote physical inactivity and excess (fat) food consumption may have encouraged individuals, particularly when socially and culturally vulnerable, to chose/accept less healthy life styles, and those with a genetic predisposition may have ended up becoming overweight and obese [
9]. Differences in overweight and obesity among individuals with different levels of education are remarkably consistent across countries. In most countries a gradient is observed: the lower the education attainment, the higher the likelihood of being obese or overweight [
9]. Switzerland is no exception as the obesity prevalence also decreases with higher educational level in both genders [
22]. The fact that obesity and overweight are higher among men and women with lower educational attainment does not explain the observed differences in overweight and obesity prevalence rates developed over time between the US, UK and Australia on one hand, and France and Switzerland on the other hand.
Our study has several limitations. The major limitation is the fact that the model used for our projections is based on a number of assumptions. We assume that it is highly unlikely that the entire population of a specific country may turn overweight or obese. Thus, we calculated an upper limit for both cases based on presently available prevalence data, assuming that the upper asymptotic part of the S-shaped curve comes to lie below 100% (parameter A < 1) as a close reflection of the real situation. Future observations may disprove these assumptions. Furthermore, the estimation of the prevalence rates may not be absolutely comparable in the five countries evaluated since the methods of estimation differed among the countries (surveys
vs. actual measurements) [
24,
25]. For example, from the two different surveys undertaken in the US, the National Health and Nutrition Examination Survey (NHANES) and the National Health Interview Survey (NHIS), the former provides information on measured BMI, while the latter presents self-reported figures. Self-reported rates from the NHIS appear to under-estimate obesity compared to actual rates reported in NHANES, but the time trends are the same [
9].
In conclusion, after a rapid increase in the total overweight population (BMI ≥ 25) as well as in the obese population segment (BMI ≥ 30) in Switzerland over the past 15 years, the prevalence rates may be expected to basically stabilize between 2007 and 2022 at about the 2007 level. In all four countries (France, US, UK, Australia) with nationally representative data collections over the past 1–2 decades evaluated for comparative reasons, a rapid increase in the prevalence of overweight and obesity occurred during the last 10–20 years. While the development in France, compared to Switzerland, showed a similar increase in overweight and obesity over a comparable time period, the other countries (US, UK, Australia) reached considerably higher proportions in the overweight and obese segments of the adult population. The projection based on the presently available overweight and obesity prevalence data using logistic regression analysis yielded a levelling off with respect to the expected overweight prevalence rates in Switzerland, France, the US and the UK until 2022, whereas a continuous increase in overweight is expected to occur in Australia. Based on this projection it appears that the unprecedented increase in overweight prevalence in some industrialized countries may come to an end in the next decade. With the exception of Switzerland, obesity prevalence rates are still expected to rise until 2022 albeit at a slower pace. Countries with a historically “low” obesity level, such as Switzerland and France, may not catch up to the countries with much higher obesity prevalence rates (US, UK, Australia) within the upcoming decades for reasons unknown at the present time.


