Text and Structural Data Mining of Influenza Mentions in Web and Social Media


Abstract
:
1. Introduction
Using Web and Social Media for Biosurveillance
2. Data and Methods
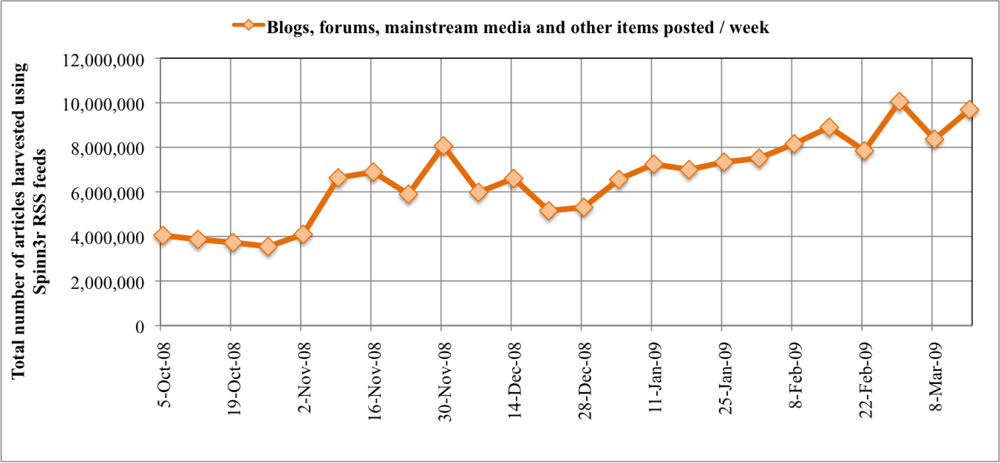
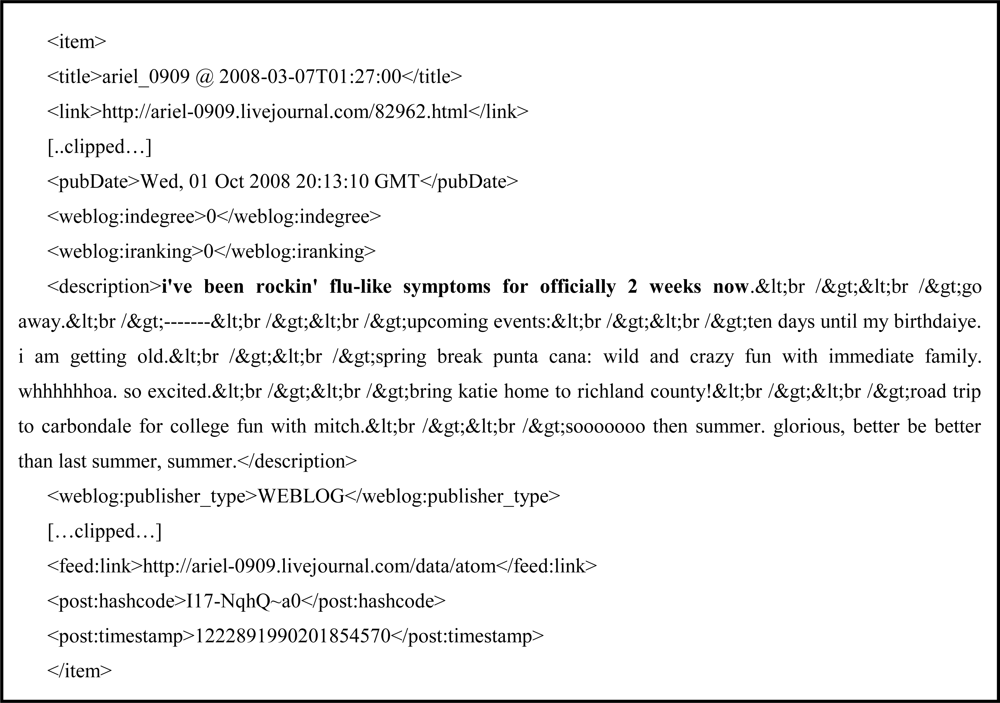
2.1. Data
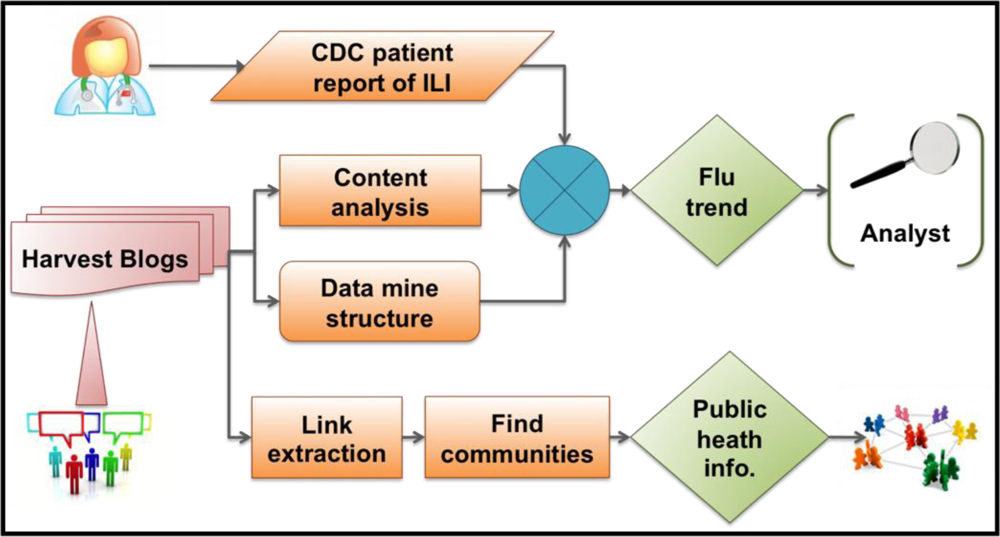
2.2. Analysis
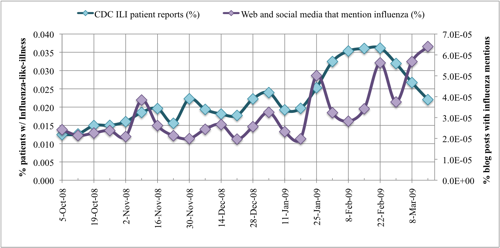
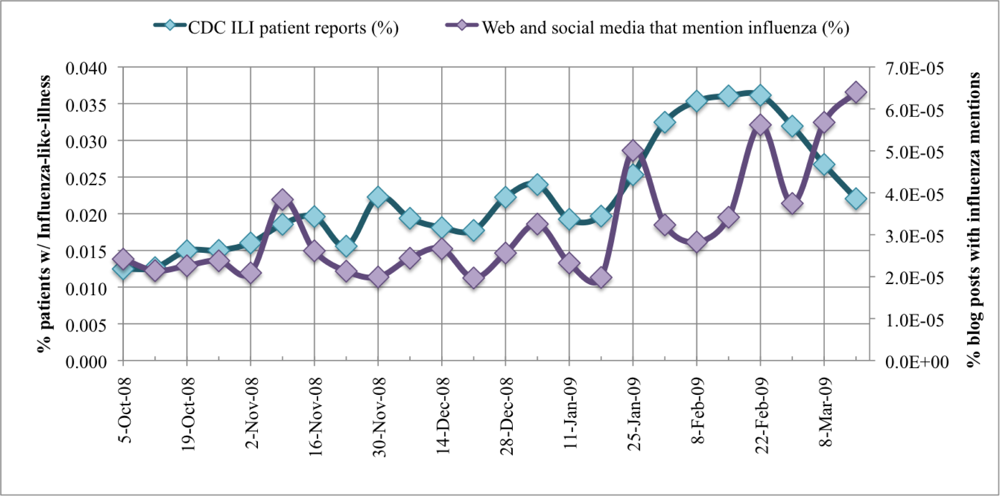
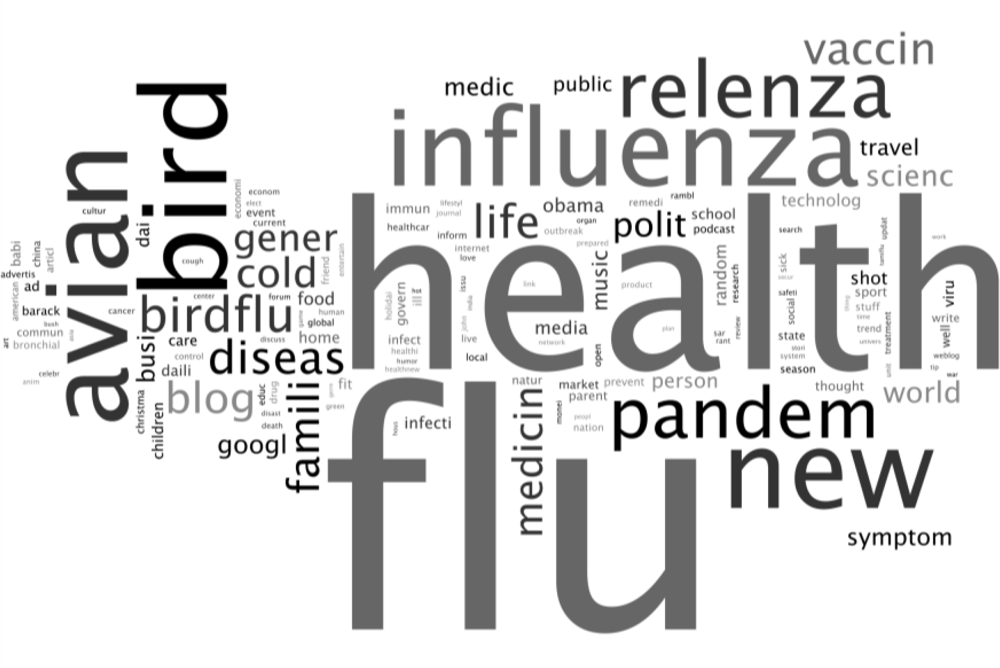
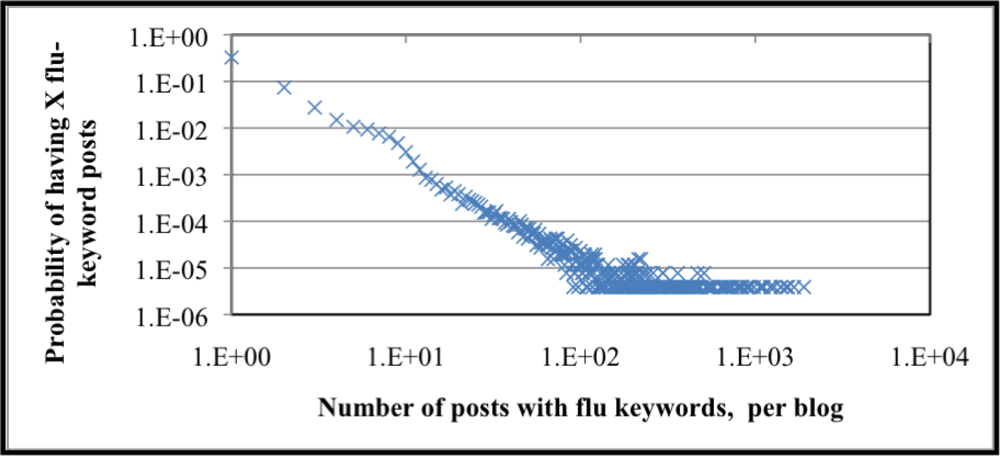
2.2.1. Text mining to monitor influenza trends
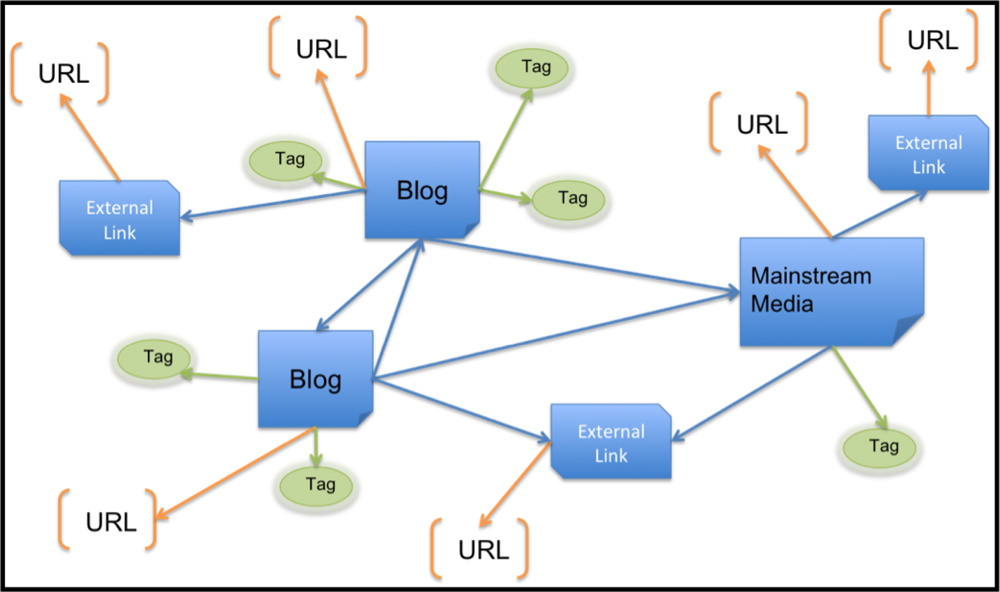
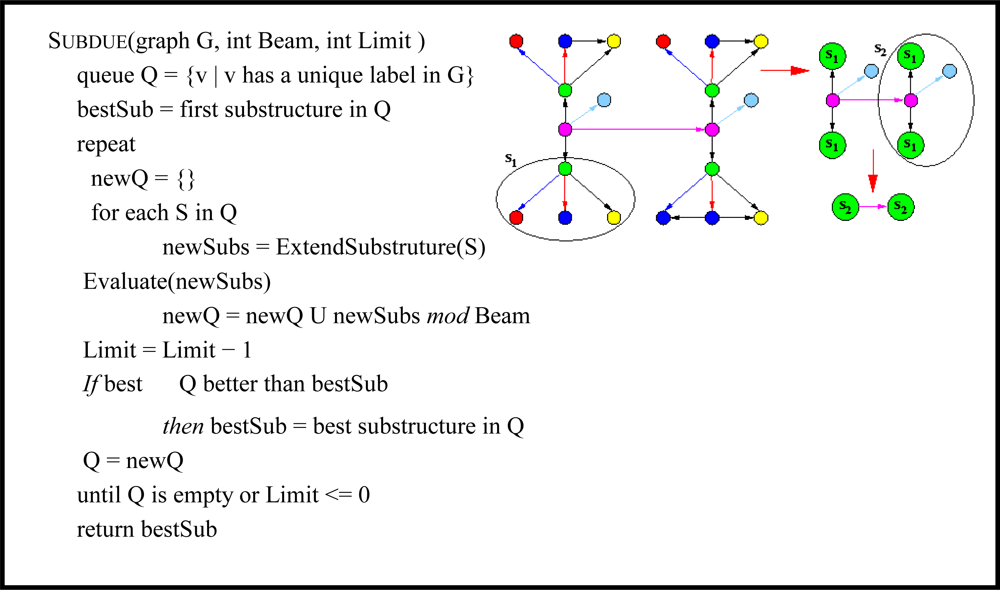
2.2.2. Graph-based structure mining to discover blog flu communities and anomaly detection
2.2.3. Potential problems and associated risks
3. Results and Discussion
4. Methods and Materials
- Calculate betweenness scores for all edges in the network.
- Find the edge with the highest score and remove it from the network. If two or more edges tie for highest score, choose one of them at random and remove that edge.
- Recalculate betweenness for all remaining edges.
- Repeat from step 2 until the desired number (if known a priori) of communities is reached, otherwise repeat from step 2 until no edges remain.
5. Future Work
6. Conclusions
Acknowledgments
References and Notes
- Corley, C; Mikler, A; Cook, D; Singh, K. Monitoring Influenza Trends through Mining Social Media. Proceedings of the 2009 International Conference on Bioinformatics and Bioengineering (BIOCOMP09), Las Vegas, NV, USA, July 2009.
- Ginsberg, J; Mohebbi, M; Patel, R; Brammer, L; Smolinski, M; Brilliant, L. Detecting influenza epidemics using search engine query data. Nature 2009, 457, 1012–1014. [Google Scholar]
- Eysenbach, G. Proceedings of the AMIA Annual Symposium, Washington, DC, USA; 2005; pp. 244–248.
- Polgreen, P; Chen, Y; Pennock, D; Nelson, F. Using internet searches for influenza surveillance. Clin. Infect. Dis 2008, 47, 1443–1448. [Google Scholar]
- Hulth, A; Rydevik, G; Linde, A; Montgomery, J. Web Queries as a Source for Syndromic Surveillance. PLoS ONE 2009, 4, e4378. [Google Scholar]
- Johnson, H; Wagner, M; Hogan, W; Chapman, W; Olszewski, R; Dowling, J; Barnas, G. Analysis of web access logs for surveillance of influenza. St. Heal. T 2003, 107, 1202–1206. [Google Scholar]
- Yih, W; Teates, K; Abrams, A; Kleinman, K; Kulldorff, M; Pinner, R; Harmon, R; Wang, S; Platt, R; Montgomery, J. Telephone triage service data for detection of influenza-like illness. PLoS ONE 2009, 4, e5260. [Google Scholar]
- Spinn3r Weblog Crawling provided by Spinn3r.
- van Rossum, G. Python Language Reference Manual; Drake, FL, Jr, Ed.; Network Theory Ltd.: UK, 2002. [Google Scholar]
- Miller, P.
- Mihalcea, R. The Text Mining Handbook: Advanced Approaches to Analyzing Unstructured Data Ronen Feldman and James Sanger (Bar-Ilan University and ABS Ventures) Cambridge, England: Cambridge University Press, 2007, xii+410. Comput. Linguist 2008, 34, 125–127. [Google Scholar]
- Feldman, R; Sanger, J. The Text Mining Handbook; Cambridge University Press: Cambridge, UK, 2007. [Google Scholar]
- .
- Cook, DJ; Holder, LB. Substructure discovery using minimum description length and background knowledge. J. Artif. Int. Res 1993, 1, 231–255. [Google Scholar]
- The Current Population Survey (CPS). U.S. Census Bureau, 2008.
- Summary Health Statistics for the US Population: National Health Interview Survey (NHIS), 2007 report DHHS Publication No.(PHS) 2009—1564; Series 10, Number 238.
- Porter, M. An algorithm for suffix stripping. Program 1980, 14, 130–137. [Google Scholar]
- Liljeros, F; Edling, C; Amaral, L; Stanley, H; Aberg, Y. The web of human sexual contacts. Nature 2001, 411, 907–908. [Google Scholar]
- Flake, G; Lawrence, S; Giles, C. Efficient identification of Web communities. Proceedings of the Sixth ACM SIGKDD International Conference on Knowledge Discovery and Data Mining, Boston, MA, USA, 20–23 August, 2000.
- Flake, G; Lawrence, S; Giles, C; Coetzee, F. Self-organization and identification of Web communities. Computer 2001, 35, 66–71. [Google Scholar]
- Eberle, W; Holder, L. Anomaly detection in data represented as graphs. Intell. Data Anal 2007, 11, 663–689. [Google Scholar]
- Wasserman, S; Faust, K. Social Network Analysis: Methods and Applications; Cambridge University Press: Cambridge, UK, 1994. [Google Scholar]
- Brin, S; Page, L. The anatomy of a large-scale hypertextual Web search engine. Comput. Networks ISDN Syst 1998, 30, 107–117. [Google Scholar]
- Girvan, M; Newman, M. Community structure in social and biological networks. Proc. Natl. Acad. Sci. USA 2002, 99, 7821–7826. [Google Scholar]


| Flu | 5605 | medicin | 697 | shot | 306 |
| health | 3946 | gener | 652 | dai | 297 |
| bird | 2030 | polit | 591 | food | 293 |
| avian | 1968 | scienc | 512 | technolog | 290 |
| new | 1903 | world | 502 | random | 290 |
| influenza | 1849 | googl | 442 | infecti | 277 |
| relenza | 1357 | medic | 422 | home | 265 |
| pandem | 1209 | busi | 418 | viru | 259 |
| birdflu | 851 | symptom | 409 | daili | 257 |
| diseas | 792 | travel | 385 | children | 250 |
| life | 789 | music | 373 | care | 250 |
| vaccin | 774 | public | 350 | school | 245 |
| famili | 739 | person | 349 | govern | 232 |
| blog | 739 | obama | 324 | immun | 230 |
| cold | 700 | media | 316 | sport | 223 |
| Count | Blogger URL | Degree | ||
|---|---|---|---|---|
| In | Out | All | ||
| 1,897 | crofsblogs.typepad.com/h5n1/ | 64 | 581 | 645 |
| 1,230 | birdcauseflu.com | 1 | 1 | 2 |
| 929 | medblogs.org | 0 | 6 | 6 |
| 912 | afludiary.blogspot.com | 30 | 659 | 689 |
| 359 | healthinform3.livejournal.com | 0 | 4 | 4 |
| 330 | fluwikie2.com | 35 | 839 | 874 |
| 204 | birdflumonitor.com | 0 | 1,012 | 1,012 |
| Blogger URL | Centrality measures | ||||
|---|---|---|---|---|---|
| Closeness | Betweenness | Eigenvector Pagerank | |||
| In | Out | All | |||
| crofsblogs.typepad.com/h5n1 | 0.0001103 | 0.00100130 | 0.00055580 | 0.00003249 | 0.00000373 |
| birdcauseflu.com | 0.0000017 | 0.00000172 | 0.00000172 | 0.00000000 | 0.00000042 |
| medblogs.org | 0.0000000 | 0.00001034 | 0.00000517 | 0.00000000 | 0.00000042 |
| afludiary.blogspot.com | 0.0000517 | 0.00113572 | 0.00059371 | 0.00005374 | 0.00000149 |
| healthinform3.livejournal.com | 0.0000000 | 0.00000689 | 0.00000345 | 0.00000000 | 0.00000042 |
| fluwikie2.com | 0.0000603 | 0.00144593 | 0.00075313 | 0.00004468 | 0.00000042 |
| birdflumonitor.com | 0.0000000 | 0.00174408 | 0.00087204 | 0.00000000 | 0.00000042 |
| Community Size | Closeness | Betweenness | Eigenvector Page Rank | |||
|---|---|---|---|---|---|---|
| URL | IN | OUT | ALL | |||
| Personal blogs (google feeds and feedburner) & general-reporting newspapers | ||||||
| 781 | feeds.feedburner.com | 0.4532 | 0.3802 | 0.2661 | 0.0533 | 0.0347 |
| www.google.org | 0.4446 | 0.4098 | 0.2102 | 0.0127 | 0.0261 | |
| www.nytimes.com | 0.5614 | 0.4954 | 0.3207 | 0.0931 | 0.0116 | |
| feedproxy.google.com | 0.4751 | 0.3857 | 0.2852 | 0.0281 | 0.0089 | |
| www.washingtonpost.com | 0.5346 | 0.4749 | 0.3093 | 0.0321 | 0.0074 | |
| Mainstream network news, local news outlets | ||||||
| 599 | www.reuters.com | 0.5606 | 0.4887 | 0.3252 | 0.0767 | 0.0113 |
| news.xinhuanet.com | 0.5136 | 0.4589 | 0.3103 | 0.0292 | 0.0087 | |
| online.wsj.com | 0.5315 | 0.4766 | 0.3105 | 0.0306 | 0.0076 | |
| www.bloomberg.com | 0.5278 | 0.4676 | 0.3151 | 0.0310 | 0.0070 | |
| www.foxnews.com | 0.4952 | 0.4566 | 0.2894 | 0.0121 | 0.0061 | |
| Primary audience outside United States | ||||||
| 397 | news.bbc.co.uk | 0.5440 | 0.4855 | 0.3064 | 0.0480 | 0.0122 |
| www.guardian.co.uk | 0.5255 | 0.4683 | 0.3034 | 0.0758 | 0.0082 | |
| www.telegraph.co.uk | 0.5045 | 0.4571 | 0.2934 | 0.0159 | 0.0070 | |
| news.google.co.uk | 0.4629 | 0.4072 | 0.2887 | 0.0079 | 0.0052 | |
| www.timesonline.co.uk | 0.4906 | 0.4487 | 0.2855 | 0.0065 | 0.0051 | |
| Livejournal community and Entertainment industry (Viacom, Reed) | ||||||
| 145 | latimesblogs.latimes.com | 0.4836 | 0.4213 | 0.2775 | 0.0046 | 0.0025 |
| community.livejournal.com | 0.4875 | 0.2454 | 0.3224 | 0.0415 | 0.0017 | |
| www.people.com | 0.4170 | 0.3381 | 0.2542 | 0.0045 | 0.0010 | |
| www.mtv.com | 0.4491 | 0.3612 | 0.2784 | 0.0034 | 0.0006 | |
| www.variety.com | 0.3528 | 0.2954 | 0.2103 | 0.0006 | 0.0005 | |
| Large news conglomerates (News corp and Disney) | ||||||
| 144 | www.youtube.com | 0.5704 | 0.5463 | 0.1737 | 0.0096 | 0.0220 |
| www.bloggingstocks.com | 0.4023 | 0.3506 | 0.2619 | 0.0028 | 0.0005 | |
| news.aol.com | 0.3379 | 0.2731 | 0.2410 | 0.0034 | 0.0005 | |
| sports.espn.go.com | 0.4270 | 0.3558 | 0.2610 | 0.0024 | 0.0004 | |
| www.dailyfinance.com | 0.3996 | 0.2959 | 0.2652 | 0.0005 | 0.0004 | |
| Commentary, opinion, editorial | ||||||
| 127 | whatreallyhappened.com | 0.4505 | 0.4257 | 0.2348 | 0.0374 | 0.0159 |
| www.prisonplanet.com | 0.4837 | 0.3750 | 0.3068 | 0.0622 | 0.0142 | |
| www.torontosun.com | 0.4081 | 0.3617 | 0.2336 | 0.0001 | 0.0012 | |
| www.legitgov.org | 0.4287 | 0.3857 | 0.2540 | 0.0008 | 0.0010 | |
| www.presstv.ir | 0.4186 | 0.3813 | 0.1902 | 0.0004 | 0.0007 | |
| Week of: | Anomaly Found? | Unusual frequent substructures of publisher types, categories, or URLs. |
|---|---|---|
| 5-Oct-2008 | NA | |
| 12-Oct-2008 | MySpace (URL), Mainstream Media (publisher type), Public Health (category) | |
| 19-Oct-2008 | Mainstream Media (publisher type), Flickr (URL), prisonplanet (URL) | |
| 26-Oct-2008 | MySpace (URL), Mainstream News (publisher type) | |
| 2-Nov-2008 | MySpace (URL), Barack Obama (category) | |
| 9-Nov-2008 | Mainstream Media (publisher type), Google FluTrends (URL) | |
| 16-Nov-2008 | Mainstream Media (publisher type), Amazon (URL), Google FluTrends (URL) | |
| 23-Nov-2008 | NA | |
| 30-Nov-2008 | NA | |
| 7-Dec-2008 | Yes | Yahoo Answers UK (URL), MySpace (URL), Fox News (URL) |
| 14-Dec-2008 | NA | |
| 21-Dec-2008 | Fox News (URL), MySpace (URL), BirdFluMonitor (URL) | |
| 28-Dec-2008 | N/A | |
| 4-Jan-2009 | Yes | Strong presence of personal blog to blog substructures. |
| 11-Jan-2009 | Yes | Strong presence of personal blog to blog substructures. |
| 18-Jan-2009 | NA | |
| 25-Jan-2009 | Yes | Forums (publisher type) |
| 1-Feb-2009 | NA | |
| 8-Feb-2009 | Yes | Strong presence of personal blog to blog substructures. |
| 15-Feb-2009 | Yes | High presence of personal blog to blog substructures. |
| 22-Feb-2009 | Yes | High presence of personal blog to blog substructures. |
| 1-Mar-2009 | Yes | MySpace (URL) > 1500 substructures, Mainstream Media (publisher type) |
| 8-Mar-2009 | Yes | MySpace (URL) > 330 substructures, Mainstream Media (publisher type) |
| 15-Mar-2009 | Yes | Very high presence of personal blog to blog substructures. |
| Week in 2009 | 17th | 18th | 19th | 20th | 21st | 22nd | 23rd | 24th |
|---|---|---|---|---|---|---|---|---|
| # of Articles | 5,591 | 108,038 | 61,341 | 26,256 | 19,224 | 37,938 | 14,393 | 27,502 |
© 2010 by the authors; licensee Molecular Diversity Preservation International, Basel, Switzerland. This article is an open-access article distributed under the terms and conditions of the Creative Commons Attribution license (http://creativecommons.org/licenses/by/3.0/).
Share and Cite
Corley, C.D.; Cook, D.J.; Mikler, A.R.; Singh, K.P. Text and Structural Data Mining of Influenza Mentions in Web and Social Media. Int. J. Environ. Res. Public Health 2010, 7, 596-615. https://doi.org/10.3390/ijerph7020596
Corley CD, Cook DJ, Mikler AR, Singh KP. Text and Structural Data Mining of Influenza Mentions in Web and Social Media. International Journal of Environmental Research and Public Health. 2010; 7(2):596-615. https://doi.org/10.3390/ijerph7020596
Chicago/Turabian StyleCorley, Courtney D., Diane J. Cook, Armin R. Mikler, and Karan P. Singh. 2010. "Text and Structural Data Mining of Influenza Mentions in Web and Social Media" International Journal of Environmental Research and Public Health 7, no. 2: 596-615. https://doi.org/10.3390/ijerph7020596
APA StyleCorley, C. D., Cook, D. J., Mikler, A. R., & Singh, K. P. (2010). Text and Structural Data Mining of Influenza Mentions in Web and Social Media. International Journal of Environmental Research and Public Health, 7(2), 596-615. https://doi.org/10.3390/ijerph7020596