3.1. Characteristics of Cooking Emissions
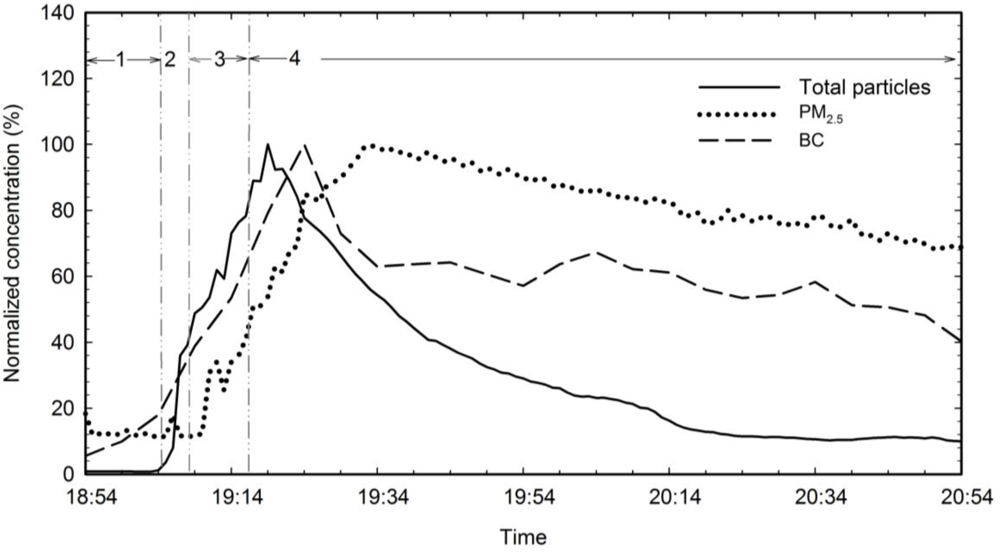
Figure 1 shows typical time series of total particle number, PM
2.5 mass and BC mass concentrations emitted during high-temperature cooking using an electric stove with the exhaust fan turned off. The cooking episode was divided into 4 periods: (1) background testing, (2) heating of the pan and the oil, (3) frying the chicken and (4) post-cooking decay of emitted particles. The average background number concentration of all particles was 3.72 × 10
3 particles/cm
3. It increased rapidly when heating the oil and up to 3.64 × 10
5 particles/cm
3 after frying the chicken. The total particle number concentrations continued to increase for 5 min after the stove was turned off. Similar trends were observed for PM
2.5 and BC mass concentrations. The PM
2.5 mass concentration increased from a background concentration of 5.0 μg/m
3 to a maximum of 42.2 μg/m
3 measured 15 min after the stove was turned off. BC mass concentrations reached 0.6 μg/m
3 7 min after the stove was turned off.
Table 1 summarizes the operational conditions and the average concentrations of air pollutants for each cooking episode, which was from when the stove was turned on to 30 min after the stove was turned off. UFP concentration was defined as the sum of the number concentrations of particles with size between 7.6 and 289 nm, as measured by the SMPS. The average concentrations ranged from 1.34 × 10
4 particles/cm
3 to 6.04 × 10
5 particles/cm
3 for UFP, 10.0 μg/m
3 to 230.9 μg/m
3 for PM
2.5 and 0.1 μg/m
3 to 0.8 μg/m
3 for BC. Large variations in all three parameters were observed for different cooking styles. The lowest average UFP concentrations were found when pasta and salad were prepared, while the highest were measured while frying chicken. Boiling pasta and stirring salad were water-based cooking methods and frying chicken was oil-based. Water-based cooking requires much less oil than oil-based one. The observed difference on UFP concentrations may be attributed to the different usage of oil. Buonanno
et al. [
20] reported significant higher emission factors when cooking foods containing a high percentage of fat than low fat vegetables.
Based on SMPS reported UFP number based size distribution data, surface area and mass concentration were calculated and averaged over all 14 cooking activities. The average number-based UFP distribution exhibited a mode around 70 (GSD = 10) nm. This value is in agreement with that measured in a previous study that found frying produced peak number concentrations of UFPs at about 60 nm, with a secondary peak at 10 nm [
15]. The average surface area- and mass-based modes were 120 nm (GSD = 22 nm) and 160 nm (GSD = 31 nm), respectively.
3.2. Factors Affecting Cooking Emissions and Pollutant Decay
Stove type and cooking temperature affected cooking emissions and exhaust fan setting affected pollutant decay.
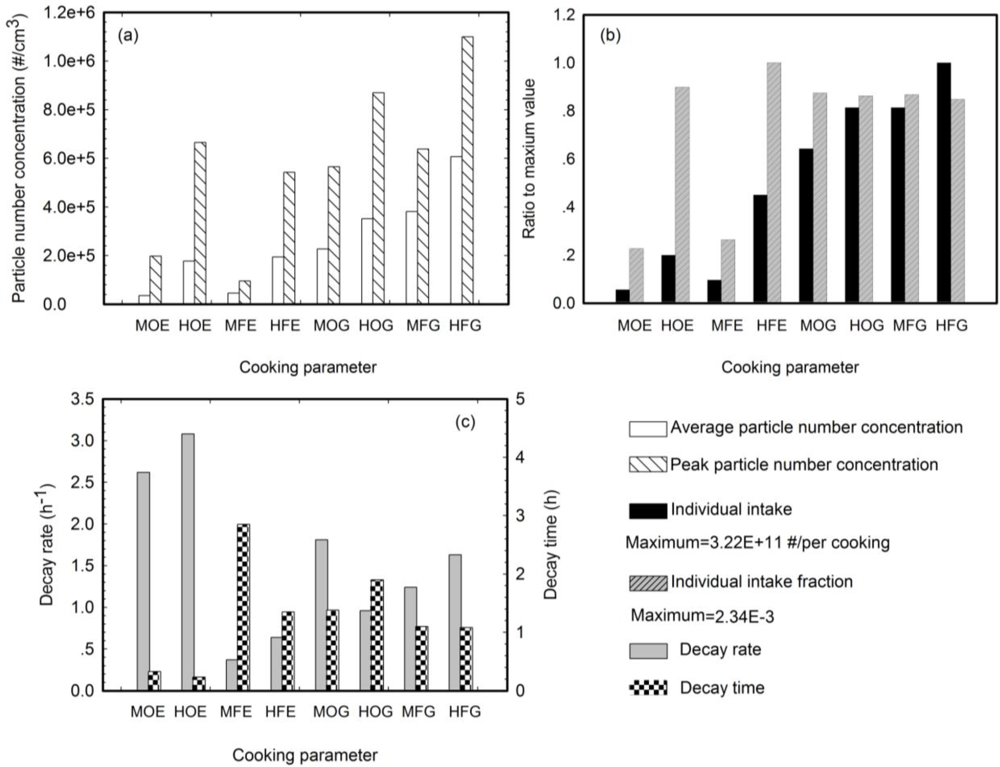
Figure 2 demonstrates the effect of these factors on UFP emissions, expected pollutant intake by an individual and the decay rate of total particle number concentrations. In this figure, the abscissa gives the operational conditions: “E” or “G” denotes electric or gas stove; “M” or “H” denotes medium or high temperature; and “O” or “F” denotes on or off for the ventilation.
Figure 2(a) shows that the gas stove generated more particles than the electric stove, regardless of the cooking temperature and the exhaust fan setting. The kitchen ventilation system removed 41% of the total particles when using the gas stove and 16% when using the electric stove. High temperatures generated between 55% and 400% more particles than medium temperatures. The maximum particle number concentration was most strongly influenced by temperature. Even though the average total particle number concentrations measured for “EHO” and “EHF” conditions were much lower than those observed for “GHO” and “GHF” conditions, the peak particle number concentrations were comparable for the two types of stoves.
Measurements of air pollutant concentrations in a microenvironment alone are sometimes insufficient for assessing the associated adverse health risk. A more useful epidemiological parameter is the human intake of air pollutants from a given source. Individual intake is defined as the pollutant inhaled by an individual [
22]. For cooking activities, individual intake of particles can be calculated as:
where C(t) is the total particle number concentration in the kitchen at the time
t (particles/cm
3),
R is the breath rate for an adult (cm
3/min) and
Te is the exposure time (min). We used an average respiratory rate of 0.5 m
3/h as given by Adams
et al. [
23]. Exposure time was defined as the period from when the stove was turned on to 30 min after the stove was turned off, including both cooking and meal time. To more directly link a given emission source to its corresponding human intake, the intake fraction can be defined. Individual intake fraction is the ratio of the individual intake (
Equation 1) to the total emissions from the source [
22,
24]. It is calculated as:
where
E is the emission factor (EF) of each cooking activity (particles/min) and
Tc is the cooking time (min). EF was calculated using a simplified equation reported by He
et al. [
17]. In our study, the EFs ranged from 1.23 × 10
12 to 1.31 × 10
13 particles/min, at the same order as the EFs in He
et al. [
17] and Buonanno
et al. [
20]. The health risk associated with cooking can thus be estimated by multiplying the total cooking emissions by the intake fraction and then by a health risk factor [
25]. The result is a simplified measure that can be used for environmental health risk assessment.
Human exposure to cooking emissions is shown in
Figure 2(b). Individual UFP intake ranged from 1.80 × 10
10 to 3.22 × 10
11 UFPs per cooking episode. The greatest individual intake was observed over the gas stove when cooking at high temperature with the exhaust fan turned off, and the lowest was measured over the electric stove at medium temperature with the exhaust fan on. The individual intake fractions ranged from 5.47 × 10
−4 to 2.34 × 10
−3 and were consistent in magnitude with the individual environmental tobacco smoke fraction (1.40 × 10
−3) reported by Klepeis [
26]. For the gas stove, the individual intake fractions were at similar level under different conditions. However a great difference was observed for the electric stove due to cooking temperature. At high temperature, the individual intake fraction for the electric stove was close to that for the gas stove, while at medium temperature it decreased by 75%.
Figure 2(c) shows the rate of total particle number concentration decay and the time it took for the concentration to decrease to background level. The time series of total particle number concentration after the stove was turned off was fitted into a natural exponential decay curve (
Equation 3),
where
C0 and
C(t) are the number concentrations of total particle when the stove was turn off and at
t h after it was off. The decay rate was determined by the coefficient part (
k) of the exponent. The correlation coefficient
r2 was usually higher than 0.90. For the electric stove, the exhaust fan greatly accelerated the particle decay. At both temperatures, the ventilation-on condition achieved a decay rate that was 5 times faster than that found when ventilation was off. For the gas stove, the impact of the exhaust fan setting was not as notable. The extremely high concentration of particles from the gas stove limited the efficiency with which the exhaust fan could remove particles by filtration. Temperature had a smaller effect than ventilation on the decay rate. The decay rate was between 18% and 73% higher for high temperature cooking than for medium temperature cooking. This difference can be explained by the occurrence of coagulation and deposition when the total particle number concentration was high.
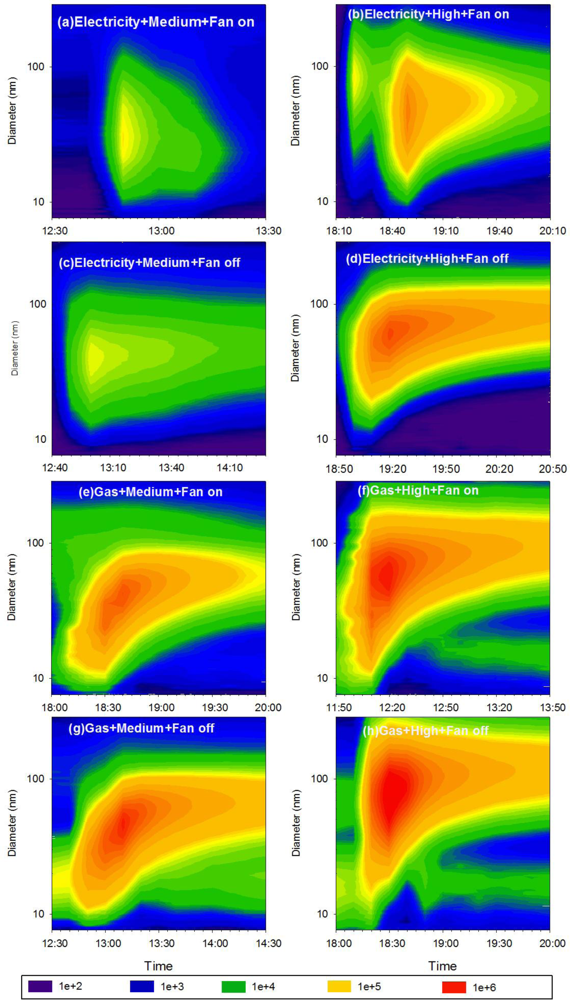
Contour plots of number-based UFP size distribution for each cooking activity are shown in
Figure 3. The abscissa denotes the time when the data were collected, and the ordinate gives the particle size on a logarithmic scale. The color intensity indicates the normalized particle number concentration (dN/dLogDp) for a given particle size at a given time. The gas stove emitted higher UFP concentrations than the electric stove, and UFP number concentrations were higher at high temperature than at medium temperature. Emitted UFPs were characterized by a unimodal distribution. The mode size of UFPs at medium temperature ranged from 30 to 50 nm, smaller than the high temperature mode size of 60 to 90 nm. A shift in intensity (orange and red area) from small size to large size with time is evident in
Figure 3 for all scenarios except the electric stove at medium temperature, which had a relatively low concentration of UFPs. This shift indicates that coagulation occurred when emitted particles reached high concentrations.
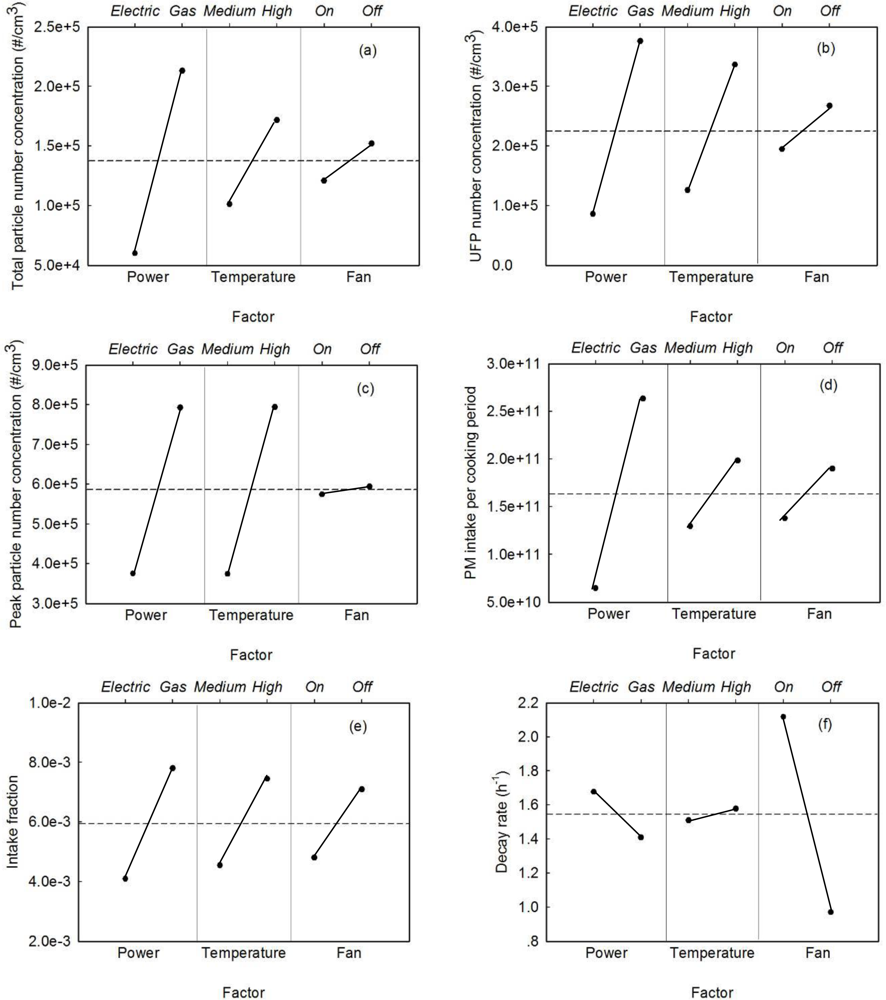
A three-factor two-level factorial analysis was applied to quantify the effect of the analyzed variables (stove type, cooking temperature and exhaust fan) on the output parameters (average total particle number concentration, UFP number concentration, peak total particle number concentration, PM intake, intake fraction and decay rate). The main impacts of the three variables are shown in
Figure 4. The lower abscissa gives the variables, the upper abscissa gives the two options for each variable, and the ordinate denotes the output parameters. The dashed line indicates the mean value of each parameter and the solid black dots give the value of the outputs for each setting of each variable. The slope of the line between the two dots was used to analyze the significance of the factor, with a larger slope corresponding to a more significant factor.
The type of stove had the most significant effect on all output parameters analyzed here except decay rate. The decay rate was largely determined by the exhaust fan setting. As shown in
Figure 4(f), turning on the fan increased the decay rate by a factor of 2. The exhaust fan had a moderate impact on all other parameters except peak particle number concentration. The decay rate reflects the removal rate of particles and was enhanced by ventilation, which is one mechanism for particle removal. The other parameters, such as average particle number concentration, reflect competition between particle generation and particle removal, explaining the smaller impact of ventilation on these parameters. The peak particle number concentration was primarily determined by factors related to particle generation such as stove type and temperature (see
Figure 4(c)). Temperature did not affect the decay rate but had a remarkable impact on particle emissions.
3.3. Spatial Dispersion of Cooking Emissions
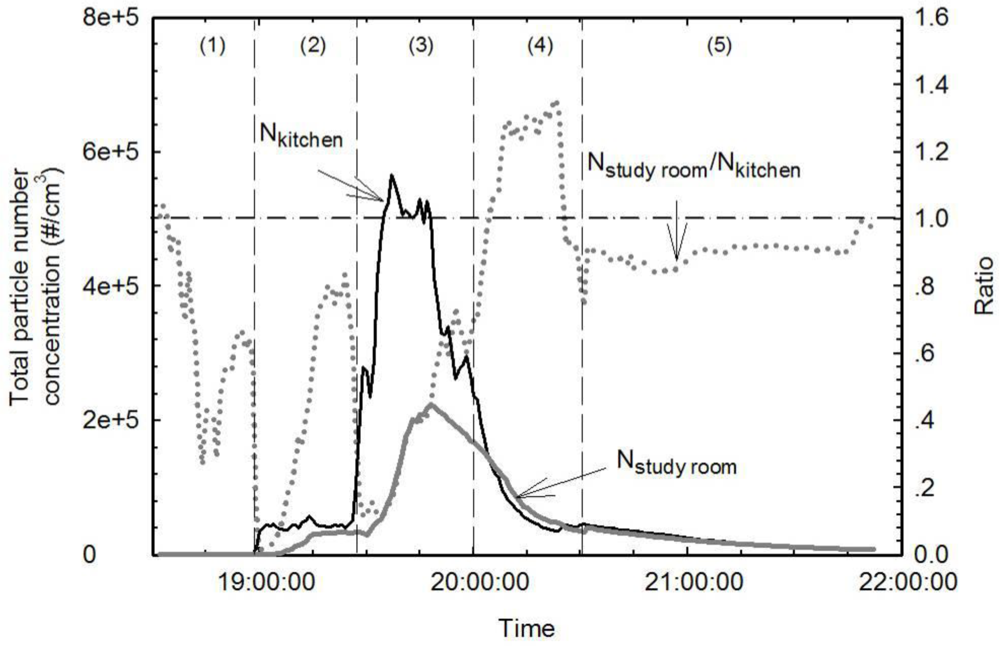
Figure 5 shows the time series of total particle number concentration resulting from Indian-style cooking of onions, green peppers and chicken. Results are shown for the kitchen (K) as a black solid line and for the study room (S) as a gray solid line. The S/K ratio is shown as a dotted gray line. The kitchen was not isolated from the rest of the house. Air pollutants emitted from cooking activities could be dispersed to other rooms in the same residence where some susceptible population might stay such as children and senior citizens. Therefore the health risk from cooking emissions may be underestimated if human exposure is only considered in the kitchen. The S/K ratio provides important information on the spatial distribution of air pollutants from cooking activities and may facilitate future health risk assessment on cooking emissions. The cooking activity was divided into 5 steps: (1) background testing, (2) turning on the ventilation, heating the pan and stir-frying the onion with oil at medium temperature, (3) stir-frying the peppers and chicken at high temperature, (4) turning off the stove while keeping the ventilation on and (5) turning off the ventilation.
At the beginning of Step 1, the S/K ratio was around 1 and showed a steady decrease before cooking began. The total particle number concentration in the kitchen was slightly higher than that in the study room during Step 2 due to preparatory activities such as washing, cutting and walking in the kitchen. Once the stove was turned on, the total particle number concentration in the kitchen increased rapidly from 1.02 × 10³ particles/cm3 to 4.28 × 10⁴ particles/cm3. Such a rapid increase was not observed in the study room. About 5 min later, the total particle number concentration in the study room began to increase slowly and reached 3.59 × 10⁴ particles/cm3. The total particle number concentration kept increasing while the peppers and chicken were cooked. Total concentration eventually reached a peak of 5.66 × 10⁵ particles/cm3 in the kitchen, 550 times higher than background concentrations. The highest total particle number concentration in the study room was 2.24 × 10⁵ particles/cm3, and it was measured 12 min after the peak was reached in the kitchen. The S/K ratio varied between 0.59 and 0.65 during the last 10 min of Step 3. When the stove was turned off, ventilation from the exhaust fan enhanced the decay rate in the kitchen, where concentration decayed 46% faster than in the study room. As a result, the S/K ratio increased to 1.3. When the exhaust fan was turned off, the decay rates in the kitchen and in the study were both converged to 1.3 h−1.
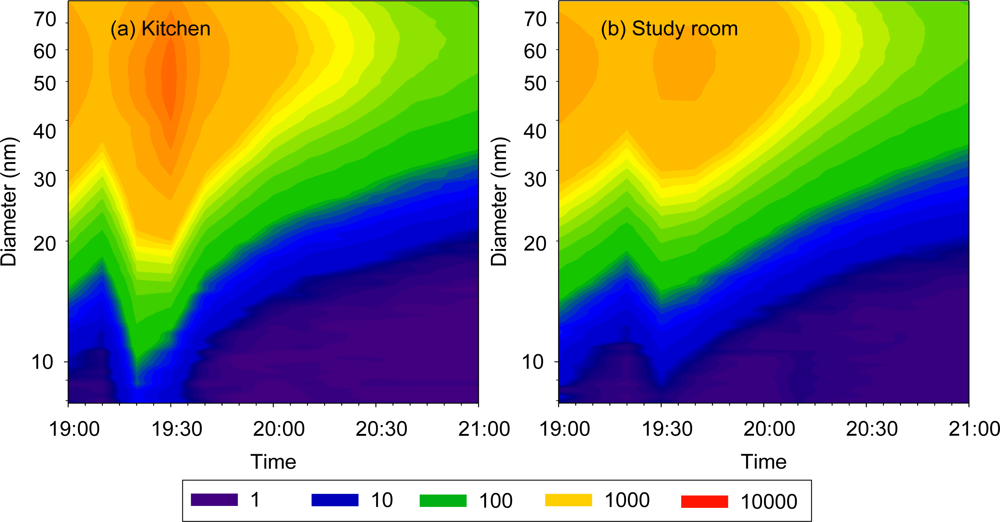
The UFP size distributions in the kitchen and the study room are compared in
Figure 6. The size distributions in both rooms were unimodal with a primary mode of 60 to 70 nm. The UFP concentrations were lower in the study room than in the kitchen with a lag time of about 10 min.
3.4. Health Risk Implication and Limitation
Results from this study showed people were exposed to high levels of UFPs, up to 550 times more than background during cooking time. UFPs are of serious health concerns because of their small size, large surface area, and toxic pollutants such as PAHs absorbed on these particles. Significant percentage of Asian non-smoking women were found with lung cancer [
27,
28], which may attribute to long term exposure to cooking fume. The human health risk assessment on UFPs emitted by cooking was reported by See
et al. [
29]. The levels of non-carcinogenic and carcinogenic risk were 50% and 111 times higher than the acceptable levels, respectively.
The exposure to UFPs from cooking activities was not confined to kitchen. The measurement in the study room revealed that with an open kitchen, UFPs were easily dispersed to other rooms in the occupied residence. Even thought the concentration was lower than that in the kitchen, it was still up to 270 times higher than non-cooking time. Since susceptible population such as children and elderly may stay in these rooms during cooking time, risk assessment on cooking emissions need to include all residences. Studies on the spatial distribution of cooking emissions in an occupied residence may provide useful information for future epidemiological study design.
This study also showed great variability on air pollutant concentrations emitted from cooking of different styles and under different conditions. This indicates health risk of cooking emissions should be evaluated on a case-by-case basis. The factors, such as diet habit and energy supply, should be taken into consideration. Moreover, the public should be informed that some simple methods can be taken to significantly reduce exposure to UFPs from cooking. These methods include using electric stoves instead of gas stoves, avoiding to cook at high temperature, keeping exhaust fan on during cooking, and if possible, separating the kitchen from other rooms by closing doors or installing a high efficient ventilation device in the kitchen.
It is noted only 4 cooking styles were studied and the measurements were conducted at four sites. The styles employed in our study did not cover all dishes, thus the results are only applicable to the population using these studied styles. Since our study was done in real residences which seldom had both gas and electric stoves, the sampling sites might have potential influence on UFP transport and transformation due to building geometry, ventilation system and building material. Further studies with additional repeated measurements may advance the knowledge on cooking emissions and achieve statistically solid conclusions.


