
The Role of Peroxisome Proliferator-Activated Receptors in PGF2α-Induced Luteolysis in the Bovine Corpus Luteum

 , , and
Abstract
:Simple Summary
Abstract
1. Introduction
2. Materials and Methods
2.1. Animal and Material Collection
2.2. Experimental Procedures
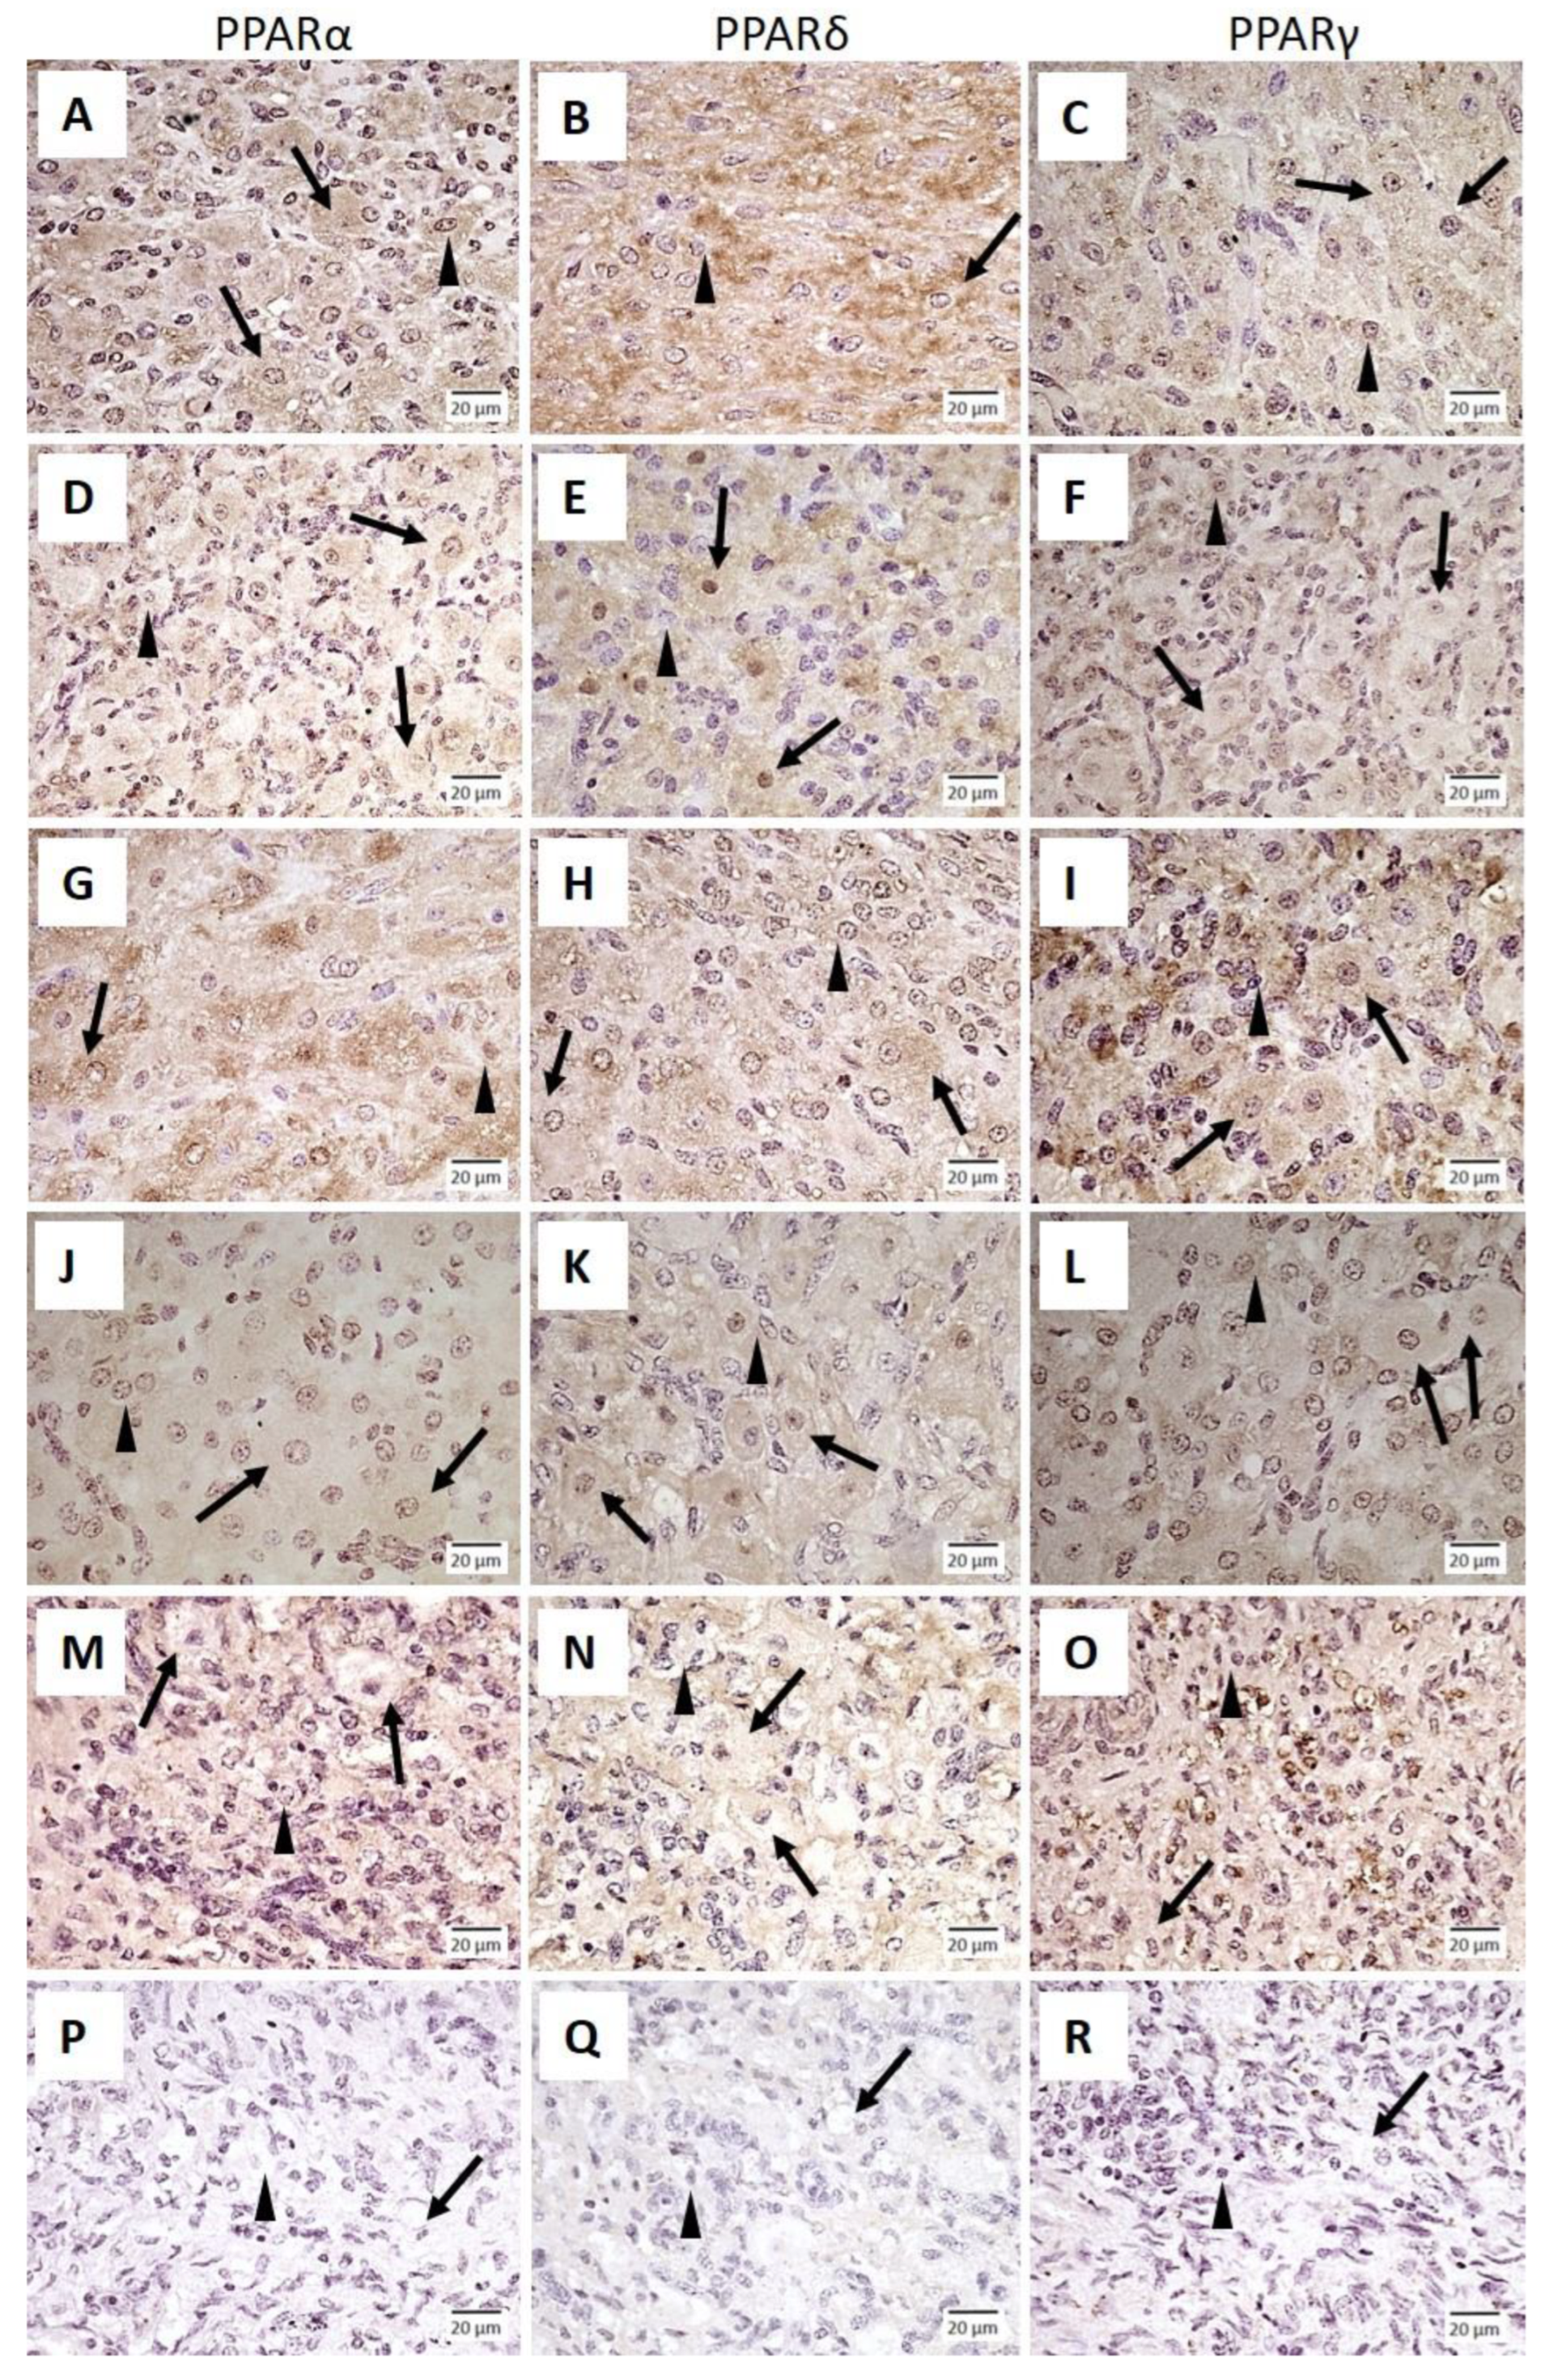
2.2.1. Experiment 1: Immunolocalization of PPARα, PPARδ and PPARγ in the Bovine Corpus Luteum
2.2.2. Experiment 2: mRNA Expression and Tissue Concentration of PPARα, PPARδ and PPARγ in the Bovine Corpus Luteum throughout the Estrous Cycle
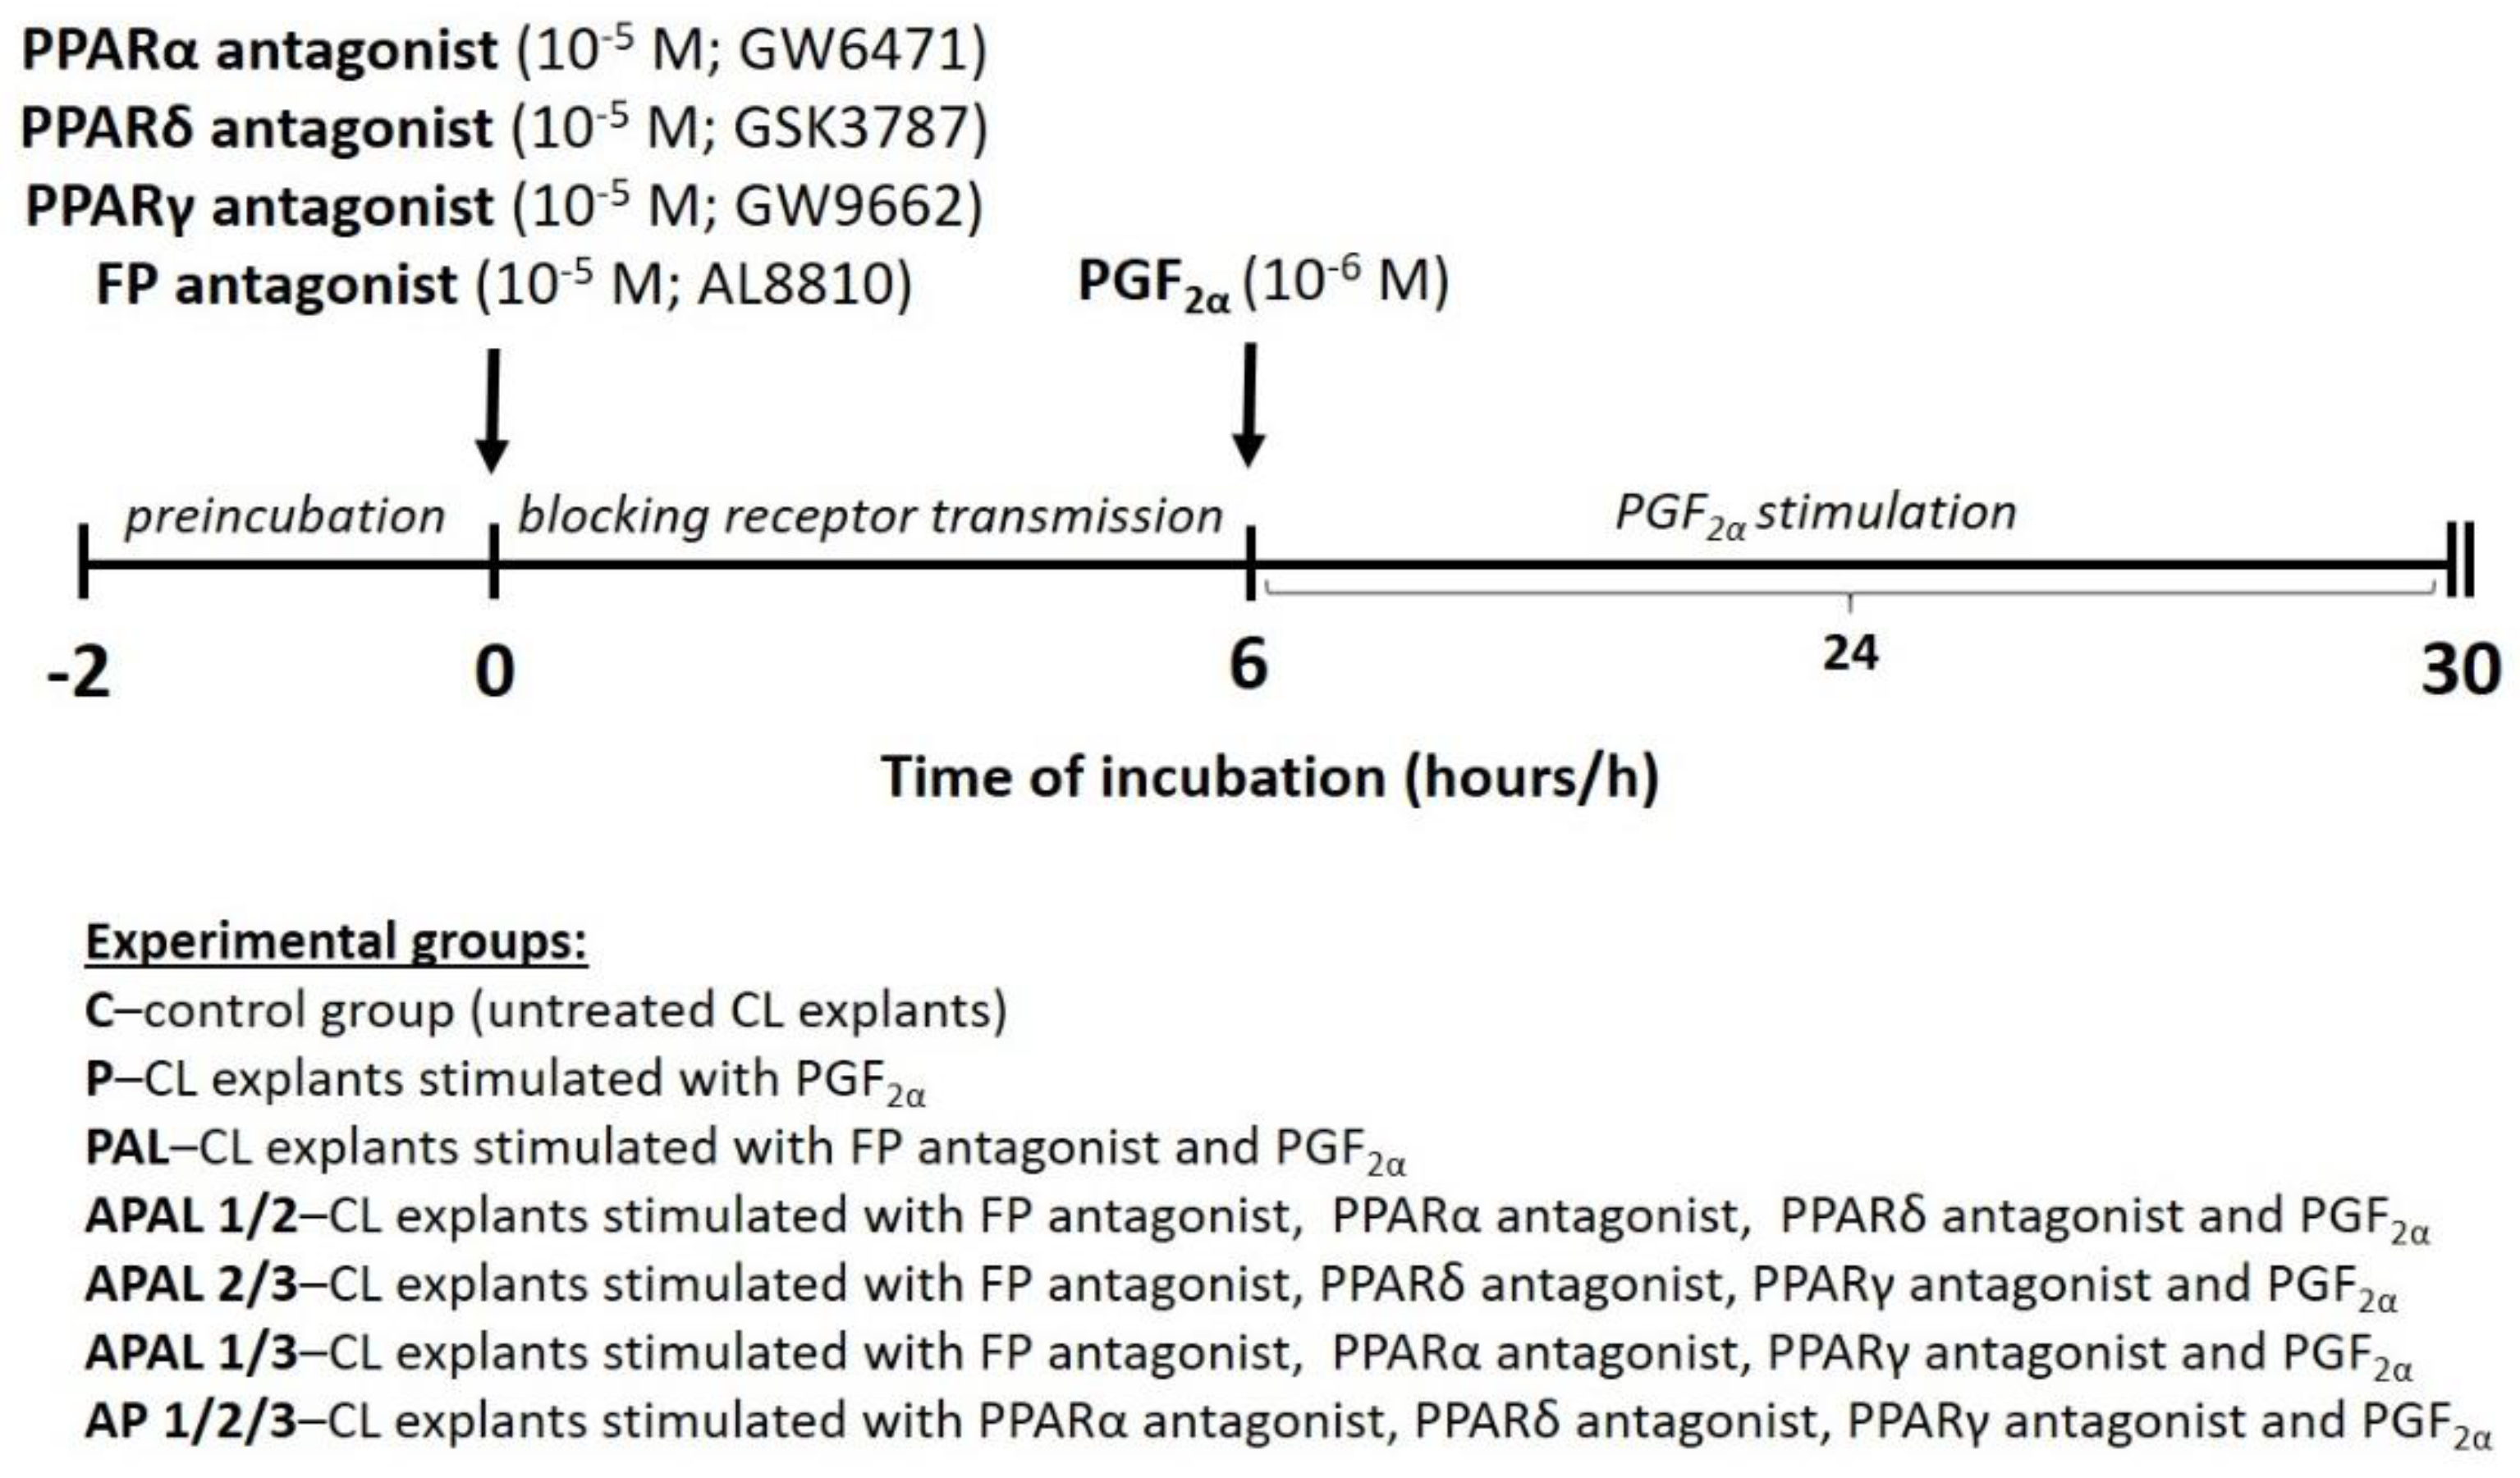
2.2.3. Experiment 3: The Involvement of PPARα, PPARδ and PPARγ in PGF2α-Induced Processes Related to Luteolysis in the Bovine Corpus Luteum—In Vitro Study
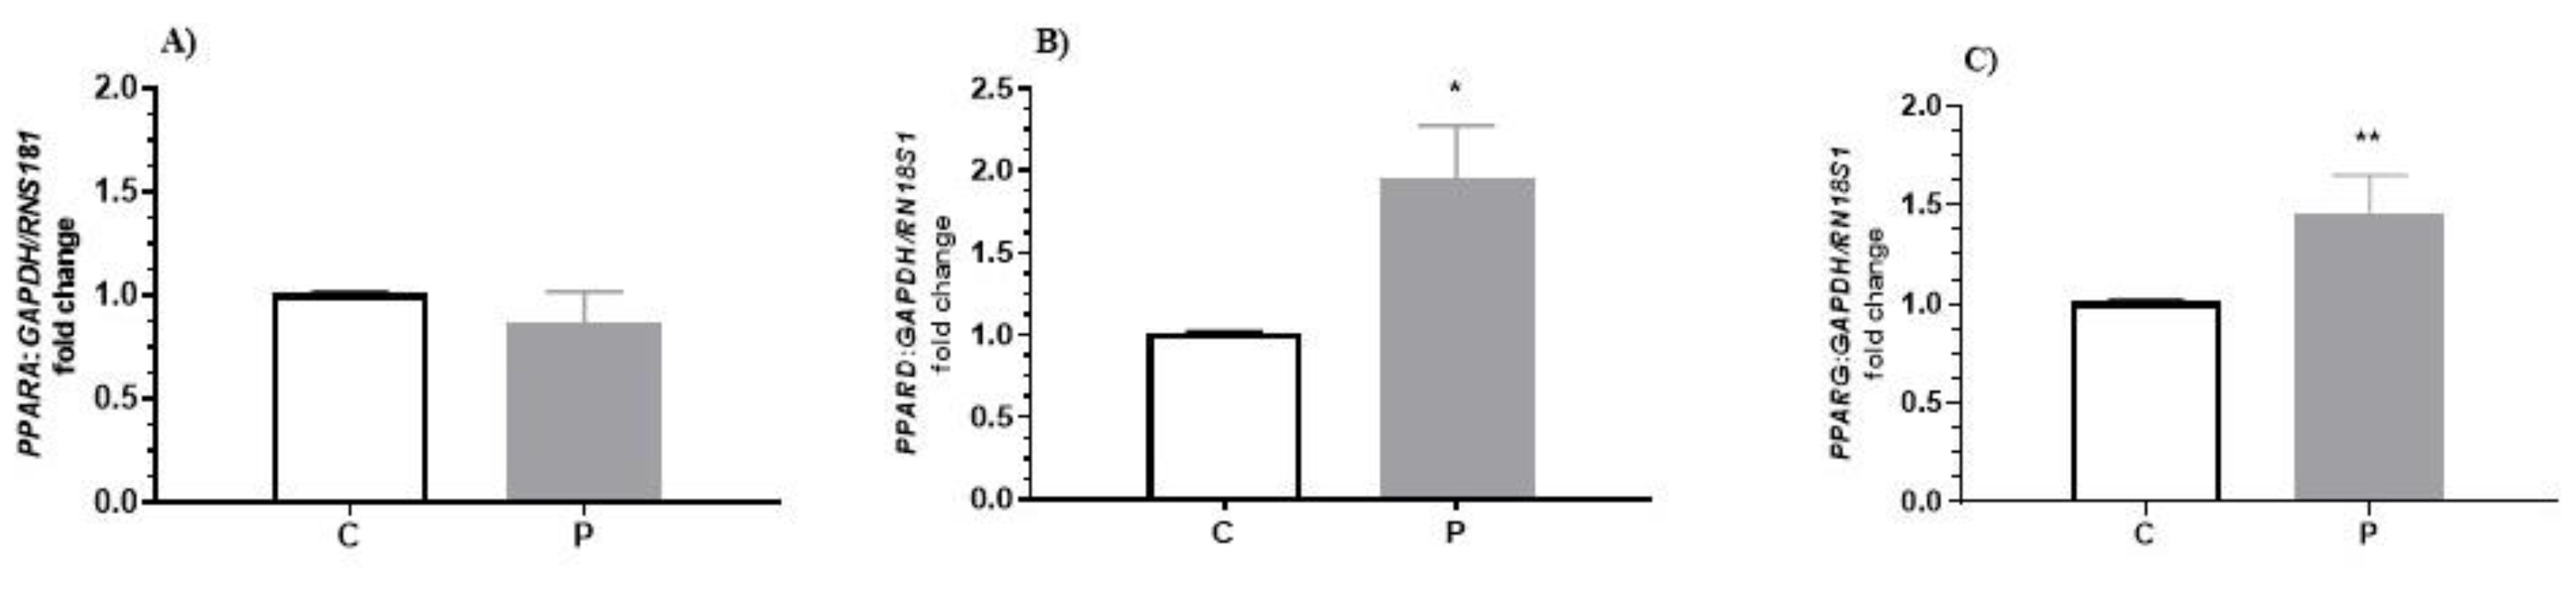
Experiment 3.1: The Effect of PGF2α on PPARα, PPARδ and PPARγ mRNA Expression in the Bovine Corpus Luteum
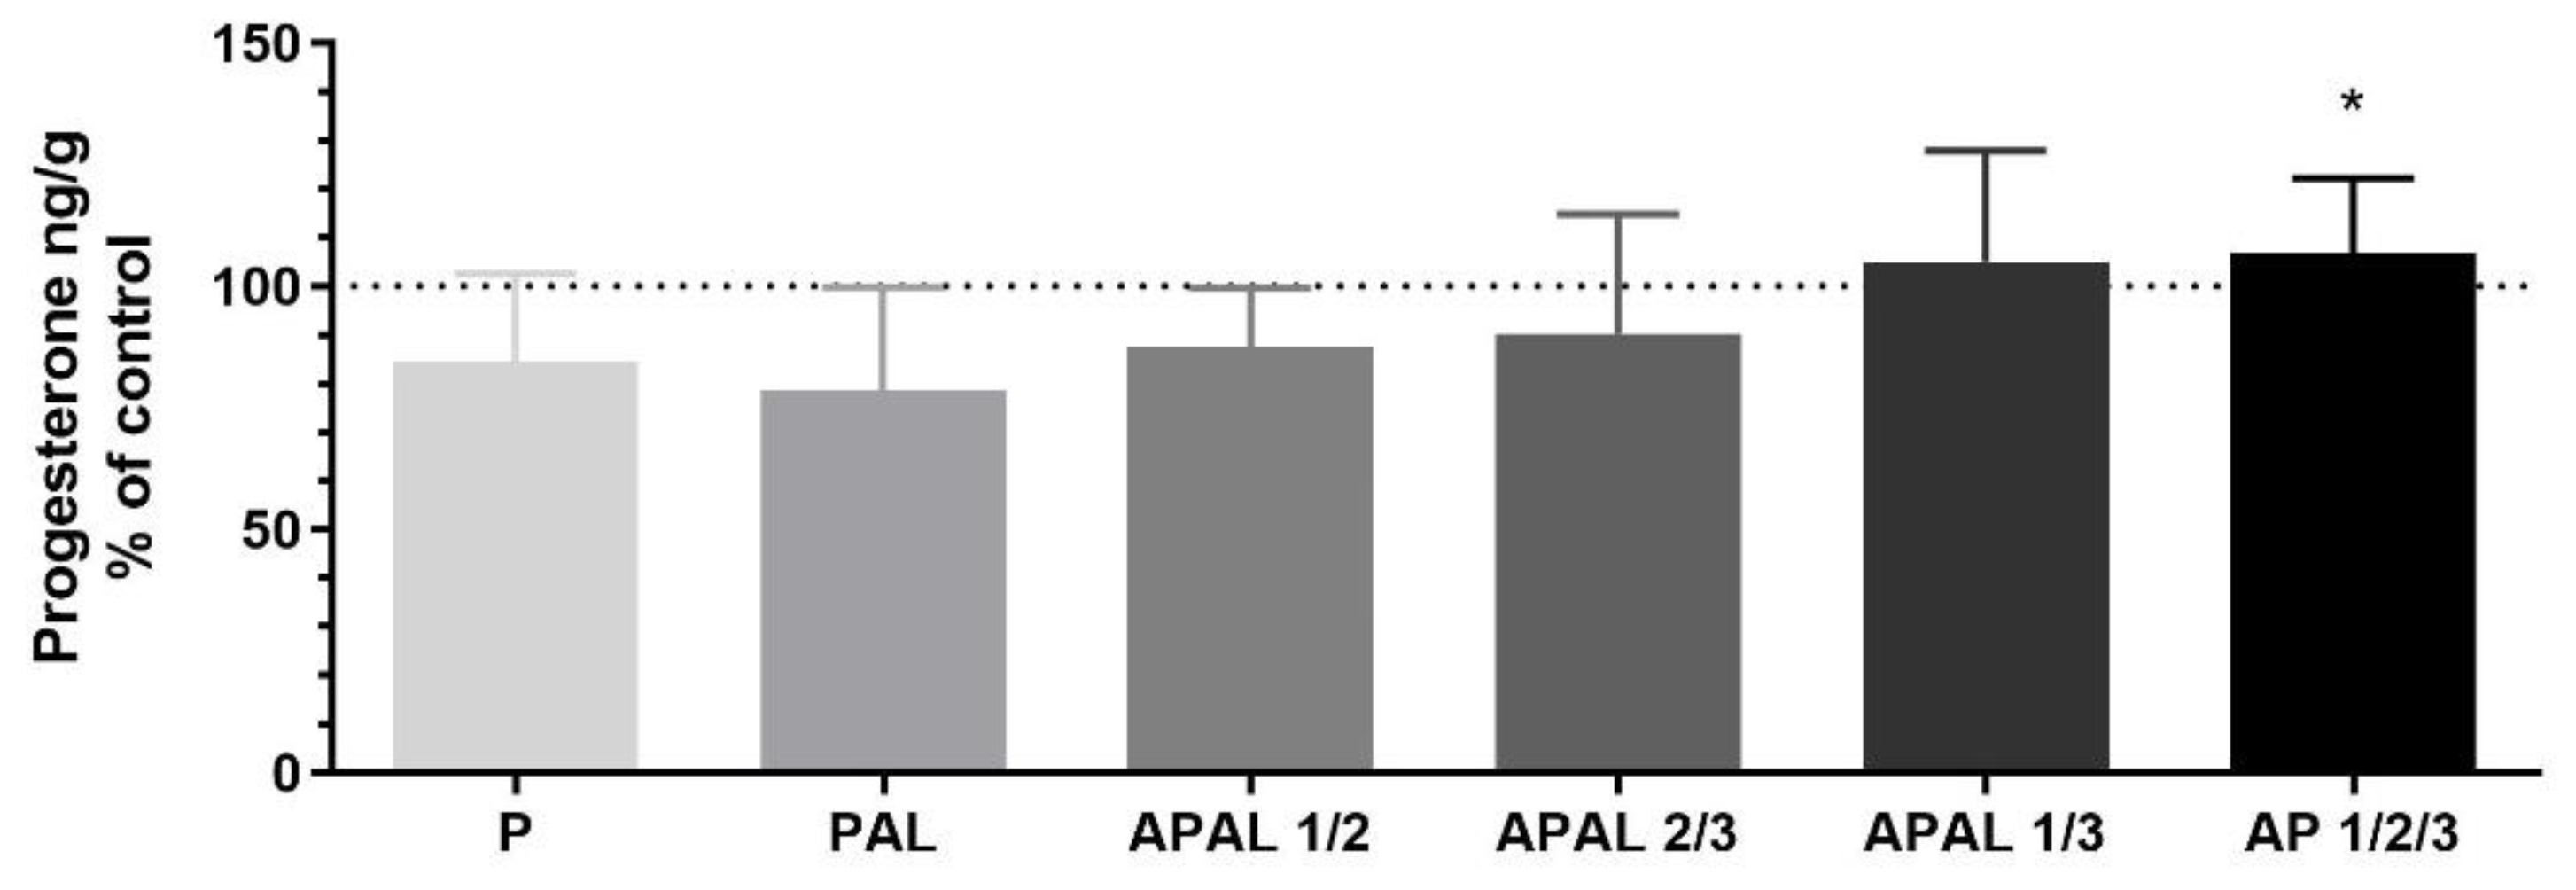
Experiment 3.2: The Effect of PGF2α on PPAR-Mediated P4 Release and mRNA Expression of Steroidogenic Enzymes and Those Responsible for AA Metabolism, and Selected Factors Mediating Luteolysis in the Bovine Corpus Luteum
2.3. Total RNA Isolation and cDNA Synthesis
2.4. qPCR Quantification
2.5. Immunohistochemistry
2.6. PPARα, PPARβ/δ and PPARγ Determinations
2.7. Progesterone Determination
2.8. Statistical Analysis
3. Results
3.1. Immunolocalization of PPARα, PPARδ and PPARγ in the Bovine Corpus Luteum
3.2. mRNA Expression and Tissue Concentration of PPARα, PPARδ and PPARγ in the Bovine Corpus Luteum throughout the Estrous Cycle
3.3. The Involvement of PPARα, PPARδ and PPARγ in PGF2α-Induced Processes Related to Luteolysis in the Bovine Corpus Luteum—In Vitro Study
3.3.1. The Effect of PGF2α on PPARα, PPARδ and PPARγ mRNA Expression in the Bovine Corpus Luteum
3.3.2. The Effect of PGF2α on PPAR-Mediated P4 Release and mRNA Expression of Steroidogenic Enzymes and Those Responsible for AA Metabolism, and Selected Factors Mediating Luteolysis in the Bovine Corpus Luteum
4. Discussion
5. Conclusions
Supplementary Materials
Author Contributions
Funding
Institutional Review Board Statement
Informed Consent Statement
Data Availability Statement
Acknowledgments
Conflicts of Interest
References
- Issemann, I.; Green, S. Activation of a member of the steroid hormone receptor superfamily by peroxisome proliferators. Nature 1990, 347, 645–650. [Google Scholar] [CrossRef] [PubMed]
- Pestka, A.; Fitzgerald, J.S.; Toth, B.; Markert, U.R.; Jeschke, U. Nuclear Hormone Receptors and Female Reproduction. Curr. Mol. Med. 2013, 13, 1066–1078. [Google Scholar] [CrossRef]
- Cui, X.; Kawashima, H.; Barclay, T.B.; Peters, J.M.; Gonzalez, F.J.; Morgan, E.T.; Strobel, H.W. Molecular cloning and regulation of expression of two novel mouse CYP4F genes: Expression in peroxisome proliferator-activated receptor alpha-deficient mice upon lipopolysaccharide and clofibrate challenges. J. Pharmacol. Exp. Ther. 2001, 296, 542–550. [Google Scholar] [PubMed]
- Komar, C.M.; Braissant, O.; Wahli, W.; Curry, T.E., Jr. Expression and localization of PPARs in the rat ovary during follicular development and the periovulatory period. Endocrinology 2001, 142, 4831–4838. [Google Scholar] [CrossRef] [PubMed]
- Kurzyńska, A.; Bogacki, M.; Chojnowska, K.; Bogacka, I. Peroxisome proliferator activated receptor ligands affect progesterone and 17β-estradiol secretion by porcine corpus luteum during early pregnancy. J. Physiol. Pharmacol. 2014, 65, 709–717. [Google Scholar] [PubMed]
- Froment, P.; Fabre, S.; Dupont, J.; Pisselet, C.; Chesneau, D.; Staels, B.; Monget, P. Expression and functional role of peroxisome proliferator-activated receptor-gamma in ovarian folliculogenesis in the sheep. Biol. Reprod. 2003, 69, 1665–1674. [Google Scholar] [CrossRef] [Green Version]
- Lambe, K.G.; Tugwood, J.D. A human peroxisome-proliferator-activated receptor-gamma is activated by inducers of adipogenesis, including thiazolidinedione drugs. Eur. J. Biochem. 1996, 239, 1–7. [Google Scholar] [CrossRef] [PubMed]
- Komar, C.M. Peroxisome proliferator-activated receptors (PPARs) and ovarian function—implications for regulating steroidogenesis, differentiation, and tissue remodeling. Reprod. Biol. Endocrinol. 2005, 3, 41. [Google Scholar] [CrossRef] [PubMed] [Green Version]
- Froment, P.; Gizard, F.; Defever, D.; Staels, B.; Dupont, J.; Monget, P. Peroxisome proliferator-activated receptors in reproductive tissues: From gametogenesis to parturition. J. Endocrinol. 2006, 189, 199–209. [Google Scholar] [CrossRef] [Green Version]
- Bogacka, I.; Kurzyńska, A.; Bogacki, M.; Chojnowska, K. Peroxisome proliferator-activated receptors in the regulation of female reproductive functions. Folia Hystochem. Cytobiol. 2015, 53, 189–200. [Google Scholar] [CrossRef]
- Vitti, M.; Di Emidio, G.; Di Carlo, M.; Carta, G.; Antonosante, A.; Artini, P.G.; Cimini, A.; Tatone, C.; Benedetti, E. Peroxisome Proliferator-Activated Receptors in Female Reproduction and Fertility. PPAR Res. 2016, 2016, 4612306. [Google Scholar] [CrossRef]
- Viswakarma, N.; Jia, Y.; Bai, L.; Vluggens, A.; Borensztajn, J.; Xu, J.; Reddy, J.K. Coactivators in PPAR-Regulated Gene Expression. PPAR Res. 2010, 2010, 250126. [Google Scholar] [CrossRef] [PubMed] [Green Version]
- Meade, E.A.; McIntyre, T.M.; Zimmerman, G.A.; Prescott, S.M. Peroxisome proliferators enhance cyclooxygenase-2 expression in epithelial cells. J. Biol. Chem. 1999, 274, 8328–8334. [Google Scholar] [CrossRef] [Green Version]
- Szczepańska, A.A.; Łupicka, M.; Socha, B.M.; Korzekwa, A.J. The influence of arachidonic acid metabolites on PPAR and RXR expression in bovine uterine cells. Gen. Comp. Endocrinol. 2018, 262, 27–35. [Google Scholar] [CrossRef]
- McCracken, J.A.; Custer, E.E.; Lamsa, J.C. Luteolysis: A neuroendocrine-mediated event. Physiol. Rev. 1999, 79, 263–323. [Google Scholar] [CrossRef] [PubMed]
- McCracken, J.A.; Glew, M.E.; Scaramuzzi, R.J. Corpus luteum regression induced by prostagland in F2-alpha. J. Clin. Endocrinol. Metab. 1970, 30, 544–546. [Google Scholar] [CrossRef] [PubMed]
- Shirasuna, K.; Sasahara, K.; Matsui, M.; Shimizu, T.; Miyamoto, A. Prostaglandin F2alpha differentially affects mRNA expression relating to angiogenesis, vasoactivation and prostaglandins in the early and mid corpus luteum in the cow. J. Reprod. Dev. 2010, 56, 428–436. [Google Scholar] [CrossRef] [PubMed] [Green Version]
- Atli, M.O.; Bender, R.W.; Mehta, V.; Bastos, M.R.; Luo, W.; Vezina, C.M.; Wiltbank, M.C. Patterns of gene expression in the bovine corpus luteum following repeated intrauterine infusions of low doses of prostaglandin F2alpha. Biol. Reprod. 2012, 86, 130. [Google Scholar] [CrossRef]
- Rovani, M.T.; Ilha, G.F.; Gasperin, B.G.; Nóbrega, J.E., Jr.; Siddappa, D.; Glanzner, W.G.; Antoniazzi, A.Q.; Bordignon, V.; Duggavathi, R.; Gonçalves, P.B.D. Prostaglandin F2alpha-induced luteolysis involves activation of Signal transducer and activator of transcription 3 and inhibition of AKT signaling in cattle. Mol. Reprod. Dev. 2017, 84, 486–494. [Google Scholar] [CrossRef]
- Jończyk, A.W.; Piotrowska-Tomala, K.K.; Kordowitzki, P.; Skarżyński, D.J. Effects of prostaglandin F2α on angiogenic and steroidogenic pathways in the bovine corpus luteum may depend on its route of administration. J. Dairy Sci. 2019, 102, 10573–10586. [Google Scholar] [CrossRef]
- Jończyk, A.W.; Piotrowska-Tomala, K.K.; Skarżyński, D.J. Effects of prostaglandin F2α (PGF2α) on cell-death pathways in the bovine corpus luteum. BMC Vet. Res. 2019, 15, 416. [Google Scholar] [CrossRef] [PubMed] [Green Version]
- Juengel, J.L.; Garverick, H.A.; Johnson, A.L.; Youngquist, R.S.; Smith, M.F. Apoptosis during luteal regression in cattle. Endocrinology 1993, 132, 249–254. [Google Scholar] [CrossRef] [PubMed]
- Yadav, V.K.; Lakshmi, G.; Medhamurthy, R. Prostaglandin F2alpha-mediated activation of apoptotic signaling cascades in the corpus luteum during apoptosis: Involvement of caspase-activated DNase. J. Biol. Chem. 2005, 280, 10357–10367. [Google Scholar] [CrossRef] [PubMed] [Green Version]
- Skarżyński, D.J.; Kobayashi, S.; Okuda, K. Influence of nitric oxide and noradrenaline on prostaglandin F2α-induced oxytocin secretion and intracellular calcium mobilization in cultured bovine luteal cells. Biol. Reprod. 2000, 63, 1000–1005. [Google Scholar] [CrossRef] [PubMed]
- Skarżyński, D.J.; Jaroszewski, J.J.; Bah, M.M.; Deptula, K.M.; Barszczewska, B.; Gawrońska, B.; Hansel, W. Administration of a nitric oxide synthase inhibitor counteracts prostaglandin F2α-induced luteolysis in cattle. Biol. Reprod. 2003, 68, 1674–1681. [Google Scholar] [CrossRef]
- Skarżyński, D.J.; Bah, M.M.; Deptula, K.M.; Wocławek-Potocka, I.; Korzekwa, A.; Shibaya, M.; Pilawski, W.; Okuda, K. Roles of tumor necrosis factor-alpha of the estrous cycle in cattle: An in vivo study. Biol. Reprod. 2003, 69, 1907–1913. [Google Scholar] [CrossRef] [Green Version]
- Jaroszewski, J.J.; Skarżyński, D.J.; Blair, R.M.; Hansel, W. Influence of nitric oxide on the secretory function of the bovine corpus luteum: Dependence on cell composition and cell-to-cell communication. Exp. Biol. Med. 2003, 228, 741–748. [Google Scholar] [CrossRef]
- Korzekwa, A.; Jaroszewski, J.J.; Bogacki, M.; Deptuła, K.M.; Maślanka, T.S.; Acosta, T.J.; Okuda, K.; Skarżyński, D.J. Effects of prostaglandin F2α and nitric oxide on the secretory function of bovine luteal cells. J. Reprod. Dev. 2004, 50, 411–417. [Google Scholar] [CrossRef] [Green Version]
- Skarżyński, D.J.; Jaroszewski, J.J.; Okuda, K. Role of tumor necrosis factor-a and nitric oxide in luteolysis in cattle. Domest. Anim. Endocrinol. 2005, 29, 340–346. [Google Scholar] [CrossRef]
- Acosta, T.J.; Hayashi, K.G.; Matsui, M.; Miyamoto, A. Changes in follicular vascularity during the first follicular wave in lactating cows. J. Reprod. Dev. 2005, 5, 273–280. [Google Scholar] [CrossRef] [Green Version]
- Alila, H.W.; Dowd, J.P.; Corradino, R.A.; Harris, W.V.; Hansel, W. Control of progesterone production in small and large bovine luteal cells separated by flow cytometry. J. Reprod. Fertil. 1988, 82, 645–655. [Google Scholar] [CrossRef] [PubMed] [Green Version]
- Okuda, K.; Uenoyama, Y.; Lee, K.W.; Sakumoto, R.; Skarzynski, D.J. Progesterone stimulation by prostaglandin F2α involves the protein kinase C pathway in cultured bovine luteal cells. J. Reprod. Dev. 1998, 44, 79–84. [Google Scholar] [CrossRef] [Green Version]
- Piotrowska, K.K.; Woclawek-Potocka, I.; Bah, M.M.; Piskula, M.K.; Pilawski, W.; Bober, A.; Skarżyński, D.J. Phytoestrogens and their metabolites inhibit the sensitivity of the bovine corpus luteum to luteotropic factors. J. Reprod. Dev. 2006, 52, 33–41. [Google Scholar] [CrossRef] [Green Version]
- Pate, J.L.; Condon, W.A. Regulation of steroidogenesis and cholesterol synthesis by prostaglandin F-2 alpha and lipoproteins in bovine luteal cells. J. Reprod. Fertil. 1989, 87, 439–446. [Google Scholar] [CrossRef] [PubMed] [Green Version]
- Skarżyński, D.J.; Okuda, K. Sensitivity of bovine corpora lutea to prostaglandin F2α is dependent on progesterone, oxytocin and prostaglandins. Biol. Reprod. 1999, 60, 1292–1298. [Google Scholar] [CrossRef] [PubMed] [Green Version]
- Lőhrke, B.; Viergutz, T.; Shahi, S.K.; Pohland, R.; Wollenhaupt, K.; Goldammer, T.; Walzel, H.; Kanitz, W. Detection and functional characterisation of the transcription factor peroxisome proliferator-activated receptor gamma in lutein cells. J. Endocrinol. 1998, 159, 429–439. [Google Scholar] [CrossRef] [PubMed]
- Viergutz, T.; Lőhrke, B.; Pohland, R.; Becker, F.; Kanitz, W. Relationship between different stages of the corpus luteum and the expression of the peroxisome proliferator-activated receptor gamma protein in bovine large lutein cells. J. Reprod. Fertil. 2000, 118, 153–161. [Google Scholar] [CrossRef] [PubMed]
- Socha, B.M.; Łupicka, M.; Szczepańska, A.A.; Korzekwa, A.J. PPAR expression throughout the oestrous cycle in the bovine endometrium. Theriogenology 2017, 100, 88–94. [Google Scholar] [CrossRef]
- Miyamoto, Y.; Skarżyński, D.J.; Okuda, K. Is tumor necrosis factor alpha a trigger for the initiation of endometrial prostaglandin F(2alpha) release at luteolysis in cattle? Biol. Reprod. 2000, 62, 1109–1115. [Google Scholar] [CrossRef]
- Korzekwa, A.J.; Łukasik, K.; Pilawski, W.; Piotrowska-Tomala, K.K.; Jaroszewski, J.J.; Yoshioka, S.; Okuda, K.; Skarżyński, D.J. Influence of prostaglandin F2α analogues on the secretory function of bovine luteal cells and ovarian arterial contractility in vitro. Vet. J. 2014, 199, 131–137. [Google Scholar] [CrossRef]
- Kurzyńska, A.; Chojnowska, K.; Bogacki, M.; Bogacka, I. PPAR ligand association with prostaglandin F2alpha and E2 synthesis in the pig corpus luteum-An in vitro study. Anim. Reprod. Sci. 2016, 172, 157–163. [Google Scholar] [CrossRef] [PubMed]
- Bustin, S.A.; Benes, V.; Garson, J.A.; Hellemans, J.; Huggett, J.; Kubista, M.; Mueller, R.; Nolan, T.; Pfaffl, M.W.; Shipley, G.L.; et al. The MIQE guidelines: Minimum information for publication of quantitative real-time PCR experiments. Clin. Chem. 2009, 55, 611–622. [Google Scholar] [CrossRef] [PubMed] [Green Version]
- Socha, B.M.; Łada, P.; Szczepańska, A.A.; Łupicka, M.; Korzekwa, A.J. The influence of experimentally induced endometritis on the PPAR expression profile in the bovine endometrium. Theriogenology 2018, 122, 74–83. [Google Scholar] [CrossRef] [PubMed]
- Janowski, T.; Barański, W.; Łukasik, K.; Skarżyński, D.; Zduńczyk, S.; Malinowska, K. Endometrial mRNA expression of prostaglandin synthase enzymes PTGS 2, PTGFS and mPTGES 1 in repeat-breeding cows with cytologically determined endometritis. Acta. Vet. Hung. 2017, 65, 96–104. [Google Scholar] [CrossRef] [PubMed] [Green Version]
- Samir, M.; Glister, C.; Mattar, D.; Laird, M.; Knight, P.G. Follicular expression of pro-inflammatory cytokines tumour necrosis factor-alpha (TNFalpha), interleukin 6 (IL6) and their receptors in cattle: TNFalpha, IL6 and macrophages suppress thecal androgen production in vitro. Reproduction 2017, 154, 35–49. [Google Scholar] [CrossRef] [PubMed]
- Andersen, C.L.; Jensen, J.L.; Ørntoft, T.F. Normalization of real-time quantitative reverse transcription-PCR data: A model-based variance estimation approach to identify genes suited for normalization, applied to bladder and colon cancer data sets. Cancer Res. 2004, 64, 5245–5250. [Google Scholar] [CrossRef] [Green Version]
- Livak, K.J.; Schmittgen, T.D. Analysis of relative gene expression data using real-time quantitative PCR and the 2(-Delta Delta C(T)) Method. Methods 2001, 25, 402–408. [Google Scholar] [CrossRef]
- Zerani, M.; Maranesi, M.; Brecchia, G.; Gobbetti, A.; Boiti, C.; Parillo, F. Evidence for a luteotropic role of peroxisome proliferator-activated receptor gamma: Expression and in vitro effects on enzymatic and hormonal activities in corpora lutea of pseudopregnant rabbits. Biol. Reprod. 2013, 88, 62. [Google Scholar] [CrossRef]
- De Sousa Abreu, R.; Penalva, L.O.; Marcotte, E.M.; Vogel, C. Global signatures of protein and mRNA expression levels. Mol. BioSyst. 2009, 5, 1512–1526. [Google Scholar] [CrossRef] [Green Version]
- Maier, T.; Güell, M.; Serrano, L. Correlation of mRNA and protein in complex biological samples. FEBS Lett. 2009, 583, 3966–3973. [Google Scholar] [CrossRef] [Green Version]
- Vogel, C.; Marcotte, E.M. Insights into the regulation of protein abundance from proteomic and transcriptomic analyses. Nat. Rev. Genet. 2012, 13, 227–232. [Google Scholar] [CrossRef]
- Weems, C.W.; Weems, Y.S.; Randel, R.D. Prostaglandins and reproduction in female farm animals. Vet. J. 2006, 171, 206–228. [Google Scholar] [CrossRef] [PubMed]
- Arosh, J.A.; Banu, S.K.; Chapdelaine, P.; Madore, E.; Sirois, J.; Fortier, M.A. Prostaglandin biosynthesis, transport, and signaling in corpus luteum: A basis for autoregulation of luteal function. Endocrinology 2004, 145, 2551–2560. [Google Scholar] [CrossRef] [PubMed]
- Hayashi, K.; Acosta, T.J.; Berisha, B.; Kobayashi, S.; Ohtani, M.; Schams, D.; Miyamoto, A. Changes in prostaglandin secretion by the regressing bovine corpus luteum. Prostaglandins Other Lipid Mediat. 2003, 70, 339–349. [Google Scholar] [CrossRef]
- Shirasuna, K.; Asaoka, H.; Acosta, T.J.; Wijayagunawardane, M.P.; Ohtani, M.; Hayashi, M.; Matsui, M.; Miyamoto, A. Real-time relationships in intraluteal release among Prostaglandin F2alpha, endothelin-1, and angiotensin II during spontaneous luteolysis in the cow. Biol. Reprod. 2004, 71, 1706–1711. [Google Scholar] [CrossRef] [Green Version]
- Shirasuna, K.; Akabane, Y.; Beindorff, N.; Nagai, K.; Sasaki, M.; Shimizu, T.; Bollwein, H.; Meidan, R.; Miyamoto, A. Expression of prostaglandin F2α (PGF2α) receptor and its isoforms in the bovine corpus luteum during the estrous cycle and PGF2α-induced luteolysis. Domest. Anim. Endocrinol. 2012, 43, 227–238. [Google Scholar] [CrossRef]
- Kumagai, A.; Yoshioka, S.; Sakumoto, R.; Okuda, K. Auto-amplification system for prostaglandin F2α in bovine corpus luteum. Mol. Reprod. Dev. 2014, 81, 646–654. [Google Scholar] [CrossRef]
- Korzekwa, A.J.; Jaroszewski, J.J.; Woclawek-Potocka, I.; Bah, M.M.; Skarżyński, D.J. Luteolytic effect of prostaglandin F 2 alpha on bovine corpus luteum depends on cell composition and contact. Reprod. Domest. Anim. 2008, 43, 464–472. [Google Scholar] [CrossRef]
- Hryciuk, M.M.; Jewgenow, K.; Braun, B.C. Cloprostenol, a synthetic analog of prostaglandin F2α induces functional regression in cultured luteal cells of felids. Biol. Reprod. 2021, 105, 137–147. [Google Scholar] [CrossRef]
- Hasegawa, H.; Nishimura, R.; Yamashita, M.; Yamaguchi, T.; Hishinuma, M.; Okuda, K. Effect of hypoxia on progesterone production by cultured bovine early and mid luteal cells. J. Reprod. Dev. 2019, 65, 67–72. [Google Scholar] [CrossRef] [Green Version]
- Pate, J.L.; Keyes, P. Immune cells in the corpus luteum: Friends or foes? Reproduction 2001, 122, 665–676. [Google Scholar] [CrossRef] [PubMed] [Green Version]
- Skarżyński, D.J.; Piotrowska-Tomala, K.K.; Lukasik, K.; Galvão, A.; Farberov, S.; Zalman, Y.; Meidan, R. Growth and regression in bovine corpora lutea: Regulation by local survival and death pathways. Reprod. Domest. Anim. 2013, 48, 25–37. [Google Scholar] [CrossRef] [PubMed]
- Korzekwa, A.; Murakami, S.; Wocławek-Potocka, I.; Bah, M.M.; Okuda, K.; Skarżyński, D.J. The influence of tumor necrosis factor alpha (TNF) on the secretory function of bovine corpus luteum: TNF and its receptors expression during the estrous cycle. Reprod. Biol. 2008, 8, 245–262. [Google Scholar] [CrossRef]
- Minge, C.E.; Ryan, N.K.; Van Der Hoek, K.H.; Robker, R.L.; Norman, R.J. Troglitazone regulates peroxisome proliferator-activated receptors and inducible nitric oxide synthase in murine ovarian macrophages. Biol. Reprod. 2006, 74, 153–160. [Google Scholar] [CrossRef] [Green Version]


| Gene Name | Primer Sequence (5′–3′) | Amplicon Length (bp) | Accession Number (GenBank) |
|---|---|---|---|
| GAPDH | F: CACCCTCAAGATTGTCAGCA | 103 | BC102589 |
| R: GGTCATAAGTCCCTCCACGA | - | ||
| ACTB | F: CCAAGGCCAACCGTGAGAAAAT | 256 | K00622 |
| R: CCACATTCCGTGAGGATCTTCA | |||
| RN18S1 | F: AAGTCTTTGGGTTCCGGG | 365 | AF176811 |
| R: GGACATCTAAGGGCATCACA | |||
| PPARα (PPARA) | F: GTGGAGAGTTTGGCAGAACCAGA | 163 | NM_001034036.1 |
| R: TCCCACTGCCCAGCTCCGATC | |||
| PPARδ (PPARD) | F: TCCGAAAGCCCTTCAGTGA | 124 | NM_001083636.1 |
| R: GGATGGCCTCCACCTGAGACA | |||
| PPARγ (PPARG) | F: AGGACATTCCGTTCCCAAG | 101 | NM_181024.2 |
| R: GCCATGAGGGAGTTGGAAG | |||
| StAR | F: GGTGGTGGCACGTTTTCAAT | 79 | Y17259.1 |
| R: CCTTGTCCGCATTCTCTTGG | |||
| P450scc | F: CAGCATATCGGTGACGTGGA | 139 | K02130.1 |
| R: GGCCACCAGAACCATGAAAA | |||
| HSD3B1 | F: CTAATGGGTGGGGCTCTGAAA | 473 | NM_174343 |
| R: CACGCTGTTGGAAAGAGTCA | |||
| PTGS2 | F: TGTTTGCATTCTTTGCCCAG | 158 | NM_174445 |
| R: CATCCTTGAAAAGGCGCAG | |||
| PTGFS | F: TGTGGTGCACGTATCACGACA | 160 | S54973 |
| R: AATCACGTTGCCGTCCTCATC | |||
| TNFα | F: ATGAGGTAAAGCCCGTCAGC | 132 | NM_173966.3 |
| R: CCACGTTGTAGCCGACATCA | |||
| TNFRSF1A | F: CTGGTGATTGTCTTCGGGCT | 104 | NM_174674.2 |
| R: TGCCCGCAAATGATGGAGTA | |||
| TNFRSF1B | F: GTAGCTCAGAGGCGTCTTCC | 74 | NM_001040490.2 |
| R: GCCGCTGCAAACATTGACA | |||
| iNOS | F: AAGCCGTGTTCTTCGCCTCG | 135 | DQ676956.1 |
| R: AGGCACAGCTGAACAAAGCCCC |
Publisher’s Note: MDPI stays neutral with regard to jurisdictional claims in published maps and institutional affiliations. |
© 2022 by the authors. Licensee MDPI, Basel, Switzerland. This article is an open access article distributed under the terms and conditions of the Creative Commons Attribution (CC BY) license (https://creativecommons.org/licenses/by/4.0/).
Share and Cite
Socha, B.M.; Łada, P.; Jończyk, A.W.; Korzekwa, A.J.; Skarżyński, D.J. The Role of Peroxisome Proliferator-Activated Receptors in PGF2α-Induced Luteolysis in the Bovine Corpus Luteum. Animals 2022, 12, 1542. https://doi.org/10.3390/ani12121542
Socha BM, Łada P, Jończyk AW, Korzekwa AJ, Skarżyński DJ. The Role of Peroxisome Proliferator-Activated Receptors in PGF2α-Induced Luteolysis in the Bovine Corpus Luteum. Animals. 2022; 12(12):1542. https://doi.org/10.3390/ani12121542
Chicago/Turabian StyleSocha, Barbara Maria, Piotr Łada, Agnieszka Walentyna Jończyk, Anna Justyna Korzekwa, and Dariusz Jan Skarżyński. 2022. "The Role of Peroxisome Proliferator-Activated Receptors in PGF2α-Induced Luteolysis in the Bovine Corpus Luteum" Animals 12, no. 12: 1542. https://doi.org/10.3390/ani12121542