Review

Advancing Academic Cancer Clinical Trials Recruitment in Canada

1
Canadian Cancer Clinical Trials Network, Toronto, ON M5G 0A3, Canada
2
Department of Oncology, McMaster University, Hamilton, ON L8S 4L8, Canada
3
Canadian Cancer Trials Group, Queen’s University, Kingston, ON K7L 3N6, Canada
*
Author to whom correspondence should be addressed.
Curr. Oncol. 2021, 28(4), 2830-2839; https://doi.org/10.3390/curroncol28040248
Submission received: 19 May 2021 / Revised: 16 July 2021 / Accepted: 23 July 2021 / Published: 28 July 2021

Abstract

:
The Canadian Cancer Clinical Trials Network (3CTN) was established in 2014 to address the decline in academic cancer clinical trials (ACCT) activity. Funding was provided to cancer centres to conduct a Portfolio of ACCTs. Larger centres received core funding and were paired with smaller centres to enable support and sharing of resources. All centres were eligible for incentive-based funding for recruitment above pre-3CTN baseline. Established performance measures were collected and tracked. The overall recruitment target was 50% above pre-3CTN baseline by Year 4. An analysis was completed to identify predictive success factors and descriptive statistics were used to summarize site characteristics and outcomes. From 2014–2018, a total of 11,275 patients were recruited to 559 Portfolio trials, an overall increase of 59.6% above pre-3CTN baseline was observed in Year 4. Twenty-five (51%) adult centres met the Year 4 recruitment target and the overall recruitment target was met within three years. Three factors that correlated with sites’ achieving recruitment targets were: time period, region and number of baseline trials. 3CTN was successful in meeting its objectives and will continue to support ACCTs and member cancer centres, monitor performance over time and seek continued funding to ensure success, better trial access and outcomes for patients.

1. Background

Clinical trials are essential for advancing scientific knowledge and identifying better treatment for patients. Canadians have long benefited from access to and results from practice-changing cancer clinical trials sponsored by the academic investigator community [1,2,3]. However, that access is threatened by increased complexity of ethical and regulatory processes, rising costs, and limited supports available for the conduct of academic trials [4]. Limited capacity to participate in academic sponsored trials has resulted in greater prevalence of industry sponsored clinical trials that are designed to lead to the approval of new drugs [5]. Trials to address other important practice-changing questions are delayed or unable to be addressed.
To address the impediments to academic clinical trial activities, the Canadian Cancer Research Alliance (CCRA) 2011 report on the status of clinical trials in Canada recommended the establishment of a pan-Canadian network that would provide funding and infrastructure to support the conduct of academic clinical trials [
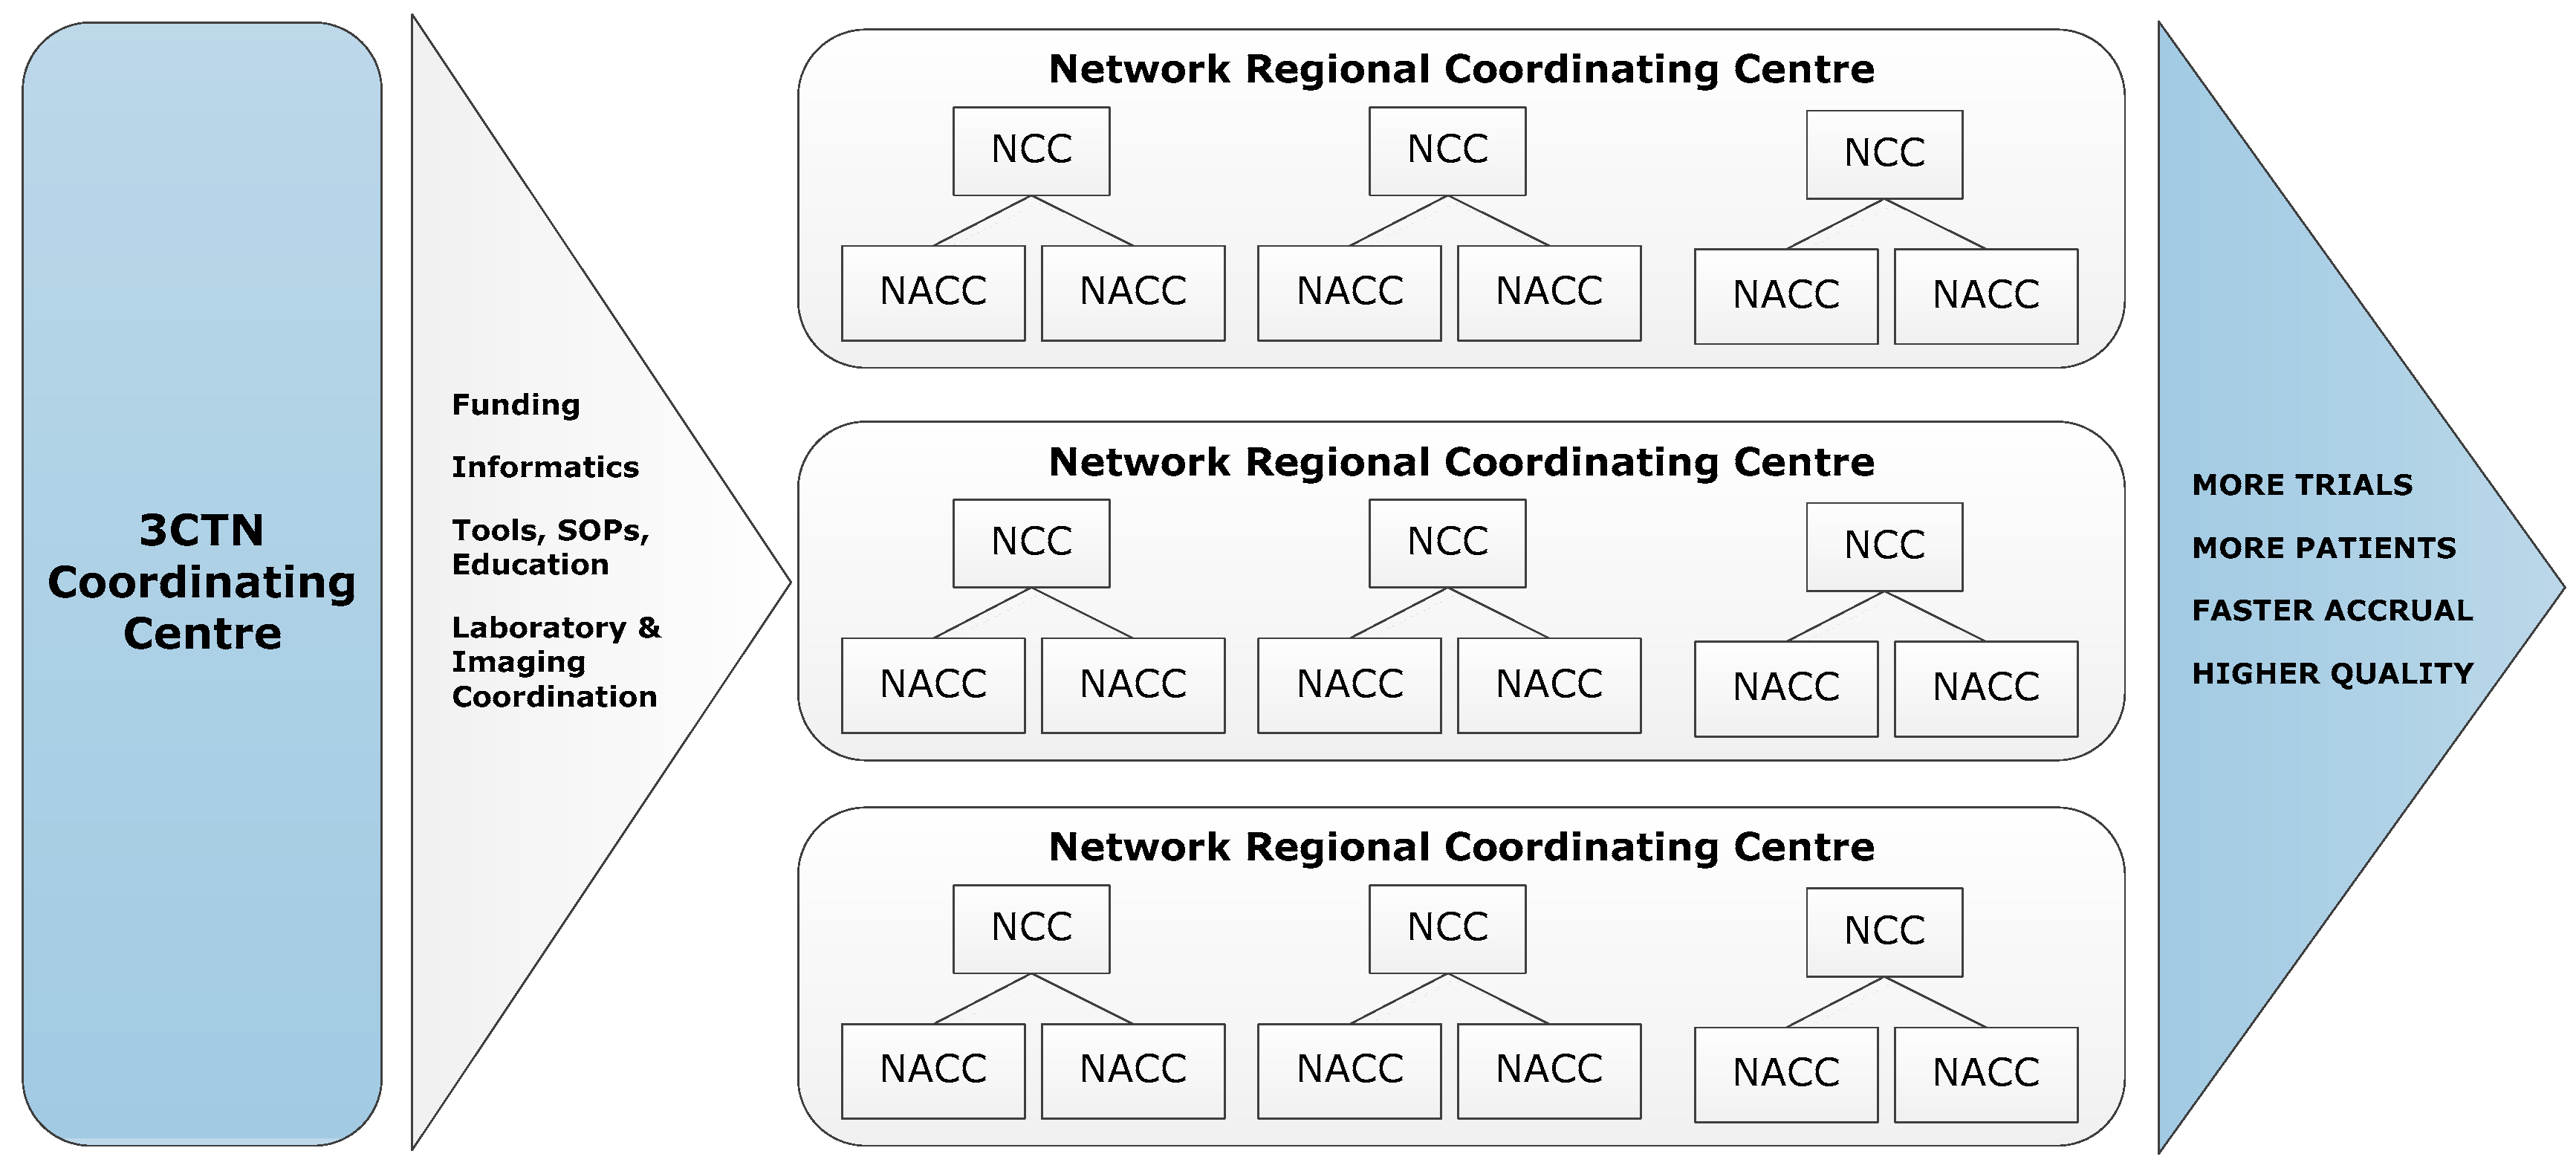
1]. In 2014, the Canadian Cancer Clinical Trials Network (3CTN; ‘the Network’) was established in collaboration with the Ontario Institute for Cancer Research (OICR), Canadian Cancer Trials Group (CCTG) and Network of Networks (N2). A total funding envelope of CAN 22 M raised was provided from 13 national and provincial charities, and public agencies. The Network has four components: (a) Coordinating Centre in Toronto serving as the administrative hub; (b) Network Regional Coordinating Centres (NRCC) that cover Canadian provinces and regions; (c) larger Network Cancer Centres (NCC); (d) smaller Network Affiliated Cancer Centres (NACC) that are linked to NCCs (Figure 1). The Network is comprised of 66 member institutions committed to the following goals and objectives for its initial four-year strategic plan:
  • To improve patient access to academic clinical trials;
  • To improve site performance of academic trials;
  • To improve the trial environment for the conduct of academic clinical trials through collaboration and facilitation of important national trial initiatives;
  • To demonstrate impact of the Network and academic trials on the Canadian Health System.
The majority of adjusted funds were allocated to core staffing at Cancer Centres’ clinical trial units, to support costs of additional resources necessary for conducting academic trials [6,7]. Funding was provided to NRCCs for regional coordination to realize Network goals and objectives. NCCs received core funding from provincial funders to support academic cancer clinical trial (ACCT) recruitment based on population served. The smaller NACCs were paired with NCCs to form local-regional nodes to enable better support and sharing of resources and NCCs were encouraged to share a portion of their core funds with affiliated centres. In addition, both NCCs and NACCs were each eligible to receive incentive-based funding for recruitment to ACCTs above their defined, pre-3CTN baseline. Further to providing funding for trial recruitment, 3CTN provided a coordinated focus on improving ACCT trial activities, supported trial best practices, the development and implementation of patient involvement strategy for the Network and its centres, as well as the development of communication and knowledge transfer activities to meet its four-year strategic goals [8,9,10]. This paper aims to describe the impact of the Network to ACCT recruitment and identify predictive success factors for adult Network sites after 3CTN’s first four-year term.

2. Methods

2.1. Development of Portfolio Trials and Pre-3CTN Baseline

3CTN aims to support the ‘right’ trials as well as doing trials right to ensure that its limited resources are directed to support research priorities and ensure that these trials are conducted efficiently [11]. A cornerstone of 3CTN’s strategy has been the creation and continuous development of a portfolio of ACCTs that meet the following eligibility criteria: (a) interventional oncology; (b) academically sponsored; (c) open to multiple Canadian sites; (d) funded independently of 3CTN; (e) peer reviewed by external reviewers. The Portfolio contains a robust mix of trial types, design characteristics and potential impacts across cancer types. Established performance measures, such as patient accrual and trial activation timelines are routinely tracked and regularly reported to show trends in the ACCT environment and cancer centre trial participation to support evaluation of 3CTN impact.

2.2. Accrual

To show an increase in recruitment to ACCT, establishing an accurate baseline from Network sites was required. Accrual data for trials that met the defined Portfolio eligibility criteria were obtained from each site for 2011 to 2013. Pre-3CTN baselines for each site were derived from the average annual totals, with the aggregate total for all sites forming the pre-3CTN baseline for Canada. Incremental annual targets were then created to support achievement of a 50% increase in overall recruitment above pre-3CTN baseline for adult Network sites by the end of the four-year period.

2.3. Portfolio and Recruitment Data Collection and Analyses

Key data abstracted for each trial entered into the Portfolio were sample size, phase, and trial design features such as randomization, treatment line and categories of interest (e.g., immunotherapy, precision medicine etc.). In addition, 3CTN developed a trial complexity rating system and potential impact categories that were applied to all incoming Portfolio trials [11,12]. To analyse the changes in the ACCT environment, trends and changes in Portfolio trial composition were compared to pre-3CTN baseline (2011–2013).
Portfolio trial and recruitment data were collected on a quarterly basis from Network sites between 1 October 2014–31 March 2018. Progress to annual recruitment targets and percentage growth above pre-3CTN baseline were tracked and sites meeting Year 4 recruitment target (≥50% increase) identified. Further data analysis was conducted to identify contributing success factors such as site type (NCC, NACC), size (large, medium, small) and access to core funding from 3CTN. The initial time point of 1 October 2014 included data from 36 adult sites with an additional 11 sites included on 1 October 2015 and one site on 1 March 2016.
Descriptive statistics were used to summarize site characteristics and outcomes. The percent increase in accrual over baseline was calculated as the (number of patients accrued in a given quarter/baseline accrual (by quarter) − 1) × 100%. Logistic regression analysis was used to examine factors potentially prognostic of attaining the year 4 accrual target. Repeated measured methods (generalized estimating equations—GEEs) were used to examine factors potentially prognostic of percent increase in accrual by quarter over baseline. These analyses accounted for time (i.e., quarter) in the analysis. Given the limited statistical power available, factors included in the multivariable models were selected based on clinical expertise and to avoid the potential of collinearity. Analyses were two-sided and statistical significance was defined at the α = 0.05 level.

3. Results

3.1. Comparison of Portfolio Trials and Pre-3CTN Baseline Trial Activity

During the review period, 3CTN supported a mean of 224 Portfolio trials per year. From 2014–2018, a total of 11,275 patients were recruited to 559 Portfolio trials, an overall increase of 59.6% above pre-3CTN baseline was observed in Year 4 (Figure 2). A total of 41 (84%) adult Network sites earned incentive-based funding for accruals above pre-3CTN baseline. Despite the challenging trial environment, 3CTN member institutions contributed to an overall increase in recruitment to ACCTs and met the overall Network recruitment target within three years.

3.2. Recruitment Data Analysis of Site Characteristics and Outcomes

Table 1 provides the breakdown of Network site characteristics and outcomes and Table 2 is a comparison of accrual site performance and Portfolio trial composition between pre-3CTN baseline and Year 4. Table 3 provides recruitment performance by quarter. From 1 October 2014–31 March 2016, the mean accrual was between 12–15 patients per site per quarter, however, from 1 April 2016–31 March 2018 the mean accrual was higher, between 17–24. Similarly, a third or less sites met their accrual in the first two years, com-pared with over half of sites in the last two years.
Results of the GEE analysis for the percentage change in accrual per quarter are presented. No interaction between region and time (p = 0.80) was observed. In the multivariable analysis (Table 4), time period, region and number of baseline trials were statistically significant (p-value < 0.05) prognostic factors. Larger increases in accrual were observed over time, in Western Canada and Ontario, and among institutions with fewer baseline trials.
No interaction between core funding and time throughout the period was observed (p = 0.38). This indicates that the slope of accrual was similar between those sites that received core funding and those that did not. However, there was a relationship between core funding and region; notably, no site in Quebec received core funding during this time period. A supportive analysis performed excluding the Quebec sites gave similar results (analysis not included below, see Figure 3). Despite not being statistically significant, Western Canada and Ontario sites that received core funding had a marked increase in mean accrual starting in Year 3, which was not observed in the non-core funded sites. A further subgroup analysis was performed including only those 36 sites which reported data for the entire study period, with results similar to the overall data (see Appendix A Table A1 and Table A2).
Table 5 shows the analysis of factors potentially prognostic for meeting their accrual targets in Year 4. No factor was significant in univariable or multivariable models.

4. Discussion

Since the formation of 3CTN as a pan-Canadian cancer network, there has been an increase in academic cancer clinical trial recruitment. From 2014 to 2018, a total of 11,275 patients were enrolled in Portfolio trials, with 3907 patients recruited in the last fiscal year, which was an increase of 59.6% above pre-3CTN baseline yearly totals, exceeding the recruitment target for the period. This was accomplished despite challenges due to declining numbers of Portfolio Phase III and other large study population randomized clinical trials during the same period.
There were three factors that correlated with successful recruitment: time period, region and number of baseline trials. Centres with lower numbers of baseline trials had greater increases in accrual, whereas centres with larger numbers of trials had less of an increase. 3CTN support may have had less of an impact on those centres that had larger numbers of existing trial staff and infrastructure compared to smaller centres. However, the number of trials and trial personnel could not continue to expand capacity limits. Further investigation into this ceiling effect is required.
The lack of association between funding and achieving accrual targets was surprising. It is possible that sites may have secured new funding for their trial units outside of 3CTN. In addition, it is possible that the limited envelope of core and incentive funding was not sufficient to independently improve recruitment to ACCTs. The CAN 22 M total budget was substantial and unprecedented, but less than the CAN 36 M original budget developed based on adaption of the UK model.
Improved communication, best practices implementation and other 3CTN activities to improve trial performance may have also contributed to recruitment success across the Network. Improved connections and collaborative problem solving among Network centres are among advancements reported by sites and observed during Network-wide meetings. Smaller centres with more limited resources to conduct trials were linked to supports from larger centres to increase clinical trial activity. Some NCCs allocated core funding to NACCs to hire staff, while others provided educational opportunities, shared resources and coordinated activities, such as research ethics board submissions. These changes allowed smaller centres to increase their accrual by a larger percentage compared to larger centres, although total numbers were greater for larger centres with established clinical trial programs and patient catchment areas. Whether to prioritize support for smaller centres to increase their trial activity and accrual, which may allow patients more access to clinical trials, or larger centres which can accrue more patients in absolute terms, is an ongoing debate.
3CTN provided Network sites with access to clinical research professionals to share best practices, tools, and templates. In addition, 3CTN worked with stakeholders to develop and implement initiatives to address challenges in the clinical trial environment. These initiatives included supporting the roll out of clinical trials management systems, development of a recruitment best practices repository and a clinical trial education and awareness campaign. Although it will require more time to quantify the impact, these ACCT-focused improvements are expected to contribute to a more efficient and high-quality research environment for all clinical trials.
There was regional variation in attaining accrual targets. Most regions saw increased clinical trial activity above pre-3CTN baseline; however, some were unable to meet recruitment targets, while others did not sustain baseline trial activity. Twelve sites were delayed in joining the Network and may benefit from additional r time to improve trial recruitment activities. Certain regions had smaller populations and trial opportunities and capacities to participate in more trials. Core funding amounts were variable for each centre, determined by the size of the population served and availability of funds. Access to 3CTN core funding varied across provinces, partly due to available funding from the provincial funder, and partly due to the funding model based on patient population. For example, Network cancer centres located in Quebec did not receive core funding directly; instead, centralized roles were created to support sites. A more targeted approach to improving and sustaining capacity for trial conduct at centres is needed.
There are several limitations to our analysis. Unfortunately, pre-3CTN baseline recruitment data from 2011–2013 were not collected on a trial-by-trial basis, and this has limited the ability to carry out more in-depth analysis of changes in individual trials and trial portfolios over time. The reliance on trial information from trial registries and other public sources to review and supplement data provided by member cancer centres limits understanding of trial complexity. Although 3CTN membership reflects the majority of sites conducting cancer trials in Canada, the total number of sites is relatively small, and the evaluation timeframe is relatively short, resulting in somewhat limited statistical sample size and power. Furthermore, the focus was on academic multicentre trials, which may not represent the broader conduct of clinical trials, which would include single centre studies and industry-sponsored trials.
The UK experience has shown that when adequately funded, a coordinated and managed approach to clinical research is highly successful and can be sustained in the long term [13]. 3CTN is the only Canadian network that provides direct support to clinical trial units to conduct ACCTs, and met its key objectives to increase trial recruitment and performance, and achieved greater integration across clinical trial centres through its activities. Although 3CTN met its overall objectives and its initial success is encouraging, support for ACCT conduct needs to be sustained. Insufficient support for clinical trial units remains a challenge and the resulting focus on industry sponsored studies continues to be concerning [14]. 3CTN has developed the structure, platforms and linkages needed to deliver on its objectives and with time will adapt and evolve into a more sustainable network. 3CTN will continue to support ACCT and Network sites, monitor performance over time, assess for factors that contribute to successful ACCT and seek continued funding to ensure the success of the Network, resulting in better trial access and outcomes for patients.

Author Contributions

Conceptualization, R.Y.X., D.K., S.S. and J.E.D.; methodology, R.Y.X., D.K., G.R.P. and J.E.D.; formal analysis, R.Y.X. and G.R.P.; data curation, R.Y.X., D.K., G.R.P., J.S., S.L. and J.E.D.; writing—original draft preparation, R.Y.X., D.K. and G.R.P.; writing—review and editing, R.Y.X., D.K., G.R.P., J.S., S.L. and J.E.D. All authors have read and agreed to the published version of the manuscript.

Funding

Support for 3CTN and production of this publication has been made possible through collaboration and financial support from the Canadian Partnership Against Cancer Corporation and Health Canada, Canadian Breast Cancer Foundation and the Ontario Institute for Cancer Research. The 3CTN Cancer Centres received financial support for trial unit operations from the following provincial funders: Alberta Cancer Foundation, BC Cancer Agency, CancerCare Manitoba, Eastern Regional Health Authority, New Brunswick Health Research Foundation, Nova Scotia Health Research Foundation, Ontario Institute for Cancer Research, QEII Foundation, and Quebec Clinical Research Organization in Cancer.

Institutional Review Board Statement

Not applicable.

Informed Consent Statement

Not applicable.

Data Availability Statement

The data presented in this study are contained within this article.

Acknowledgments

3CTN would like to acknowledge the support and contribution of its Funders, partners and member sites.

Conflicts of Interest

The authors declare no conflict of interest. The funders had no role in the design of the study; in the collection, analyses, or interpretation of data; in the writing of the manuscript, or in the decision to publish the results.

Appendix A

Table A1. Quarterly accrual at Network sites—subgroup of those N = 36 followed for entire time period.
Time periodNMedian (IQR)MeanSum Accrual Across SitesMedian (IQR) % Change from Pre-3CTNN (%) ≥TargetMean (sd) Change from Pre-3CTNMedian (IQR) % Change from Pre-3CTN
AccrualAccrual
Y1Q3364 (0.5–17.5)12.2440−29.3 (−94.9, 7.9)4 (11.1)−0.6 (5.1)−0.3 (2.5, 0.5)
Y1Q4363 (1–20)11.9430−28.2 (−63.6, 20.5)7 (19.4)−0.9 (8.3)−1.1 (−3.4, 1.4)
Y2Q1364 (1–14.5)15.65617.3 (−82.3, 69.3)12 (33.3)2.8 (10.8)0.5 (−1.9, 4.0)
Y2Q2364 (0.5–14.5)13.8498−16.7 (−92.6, 46.5)9 (25.0)1.0 (7.8)−0.3 (−2.3, 2.9)
Y2Q3363.5 (0.5–16.5)14.6524−23.6 (−92.3, 28.0)7 (19.4)1.7 (8.2)−0.3 (−2.3, 3.1)
Y2Q4365.5 (0.5–21.5)15.65614.0 (−92.3, 84.5)13 (36.1)2.8 (8.6)0.6 (−1.3, 4.9)
Y3Q13612.5 (2–30)24.889266.1 (−19.2, 271.4)21 (58.3)12.0 (19.9)6.3 (−0.3, 12.0)
Y3Q23611 (2–33.5)24.989892.5 (−12.4, 300.0)23 (63.9)12.1 (19.8)3.6 (−0.6, 19.3)
Y3Q3369.5 (3–26)22.279835.9 (−19.2, 213.0)15 (41.7)9.3 (19.5)2.5 (−0.3, 10.3)
Y3Q4367.5 (1–23)23.183242.3 (−28.4, 221.5)17 (47.2)10.3 (23.1)0.9 (−0.6, 11.4)
Y4Q1368 (2–24.5)24.889372.9 (−20.5, 235.6)21 (58.3)12.0 (25.3)3.1 (−0.4, 11.1)
Y4Q2365.5 (2–19.5)21.376632.4 (−55.5, 156.7)16 (44.4)8.5 (20.6)1.8 (−1.9, 8.0)
Y4Q3365 (1–16.5)19.369327.3 (−52.8, 106.4)16 (44.4)6.4 (17.4)0.6 (−2.3, 5.6)
Y4Q4364 (2–23.5)20.87487.1 (−52.8, 110.1)13 (36.1)8.0 (29.1)0.5 (−1.9, 3.6)
absolute change from pre-3CTN quarterly estimate.
Table A2. Prognostic factors of change in accrual (repeated measures) % change—subgroup of sites completed all time points. No interaction between region and time (p = 0.54) in multivariable model.
Factor Estimate (SE)p-Value
Region Western Canada36.6 (73.2)0.067
Ontario130.8 (62.5)
QuebecNA
Atlantic CanadaReference
Core FundingYes vs. No−5.2 (49.4)0.92
Site Type *NACC vs. NCC122.7 (50.4)0.021
SizeLarge−148.2 (53.7)0.006
Medium−168.2 (62.4)
SmallReference
Number of Baseline Trials/Trial−3.4 (1.0)0.001
Number of Trials Staff/Person−0.9 (0.5)0.1
Multivariable Analysis
Time Period/quarter20.1 (5.8)<0.001
Region Western Canada23.8 (112.8)0.13
Ontario136.3 (88.3)
QuebecNA
Atlantic CanadaReference
Core FundingYes vs. No10.6 (67.5)0.88
Site TypeNACC vs. NCC−338.9 (183.1)0.076
SizeLarge78.6 (204.8)0.93
Medium21.6 (87.8)
SmallReference
Number of Baseline Trials/Trial−14.3 (4.0)0.001
Number of Trials Staff/Person2.4 (1.0)0.018
Region, Western Canada includes British Columbia, Alberta and Manitoba; Atlantic Canada includes Nova Scotia, New Brunswick, Newfoundland and Labrador, and Prince Edward Island. * Site type, Network Cancer Centre (NCC); Network Affiliated Cancer Centre (NACC).

References

  1. Canadian Cancer Research Alliance. Report on the State of Cancer Clinical Trials in Canada; Canadian Cancer Research Alliance: Toronto, ON, Canada, 2011. [Google Scholar]
  2. Institute of Medicine. A National Cancer Clinical Trials System for the 21st Century: Reinvigorating the NCI Cooperative Group Program; The National Academies Press: Washington, DC, USA, 2010; p. 316. [Google Scholar] [CrossRef]
  3. Sharma, S.; Wells, J.C.; Hopman, W.M.; Del Paggio, J.C.; Gyawali, B.; Hammad, N.; Hay, A.E.; Booth, C.M. Cancer, Clinical Trials, and Canada: Our Contribution to Worldwide Randomized Controlled Trials. Curr. Oncol. 2021, 28, 1518–1527. [Google Scholar] [CrossRef] [PubMed]
  4. Yusuf, S.; Cairns, J. The perilous state of independent randomized clinical trials and related applied research in Canada. Can. Med. Assoc. J. 2012, 184, 1997–2002. [Google Scholar] [CrossRef] [Green Version]
  5. DeMets, D.L.; Califf, R.M. A historical perspective on clinical trials innovation and leadership: Where have the academics gone? JAMA 2011, 305, 713–714. [Google Scholar] [CrossRef]
  6. Schilsky, R.L. Wither the Cooperative Groups? J. Clin. Oncol. 2014, 32, 251–254. [Google Scholar] [CrossRef]
  7. Emanuel, E.J.; Schnipper, L.E.; Kamin, D.Y.; Levinson, J.; Lichter, A.S. The costs of conducting clinical research. J. Clin. Oncol. 2003, 21, 4145–4150. [Google Scholar] [CrossRef] [PubMed]
  8. Arts, K.; Lalani, S.; Kato, D.; Cannell, A.; Xu, R.; Pho, L.; Dancey, J.E. Canadian Cancer Clinical Trials Network (3CTN): Implementation of a pan-Canadian network to increase capacity and capability of academic clinical trials [Poster Presentation]. In Proceedings of the 2015 Canadian Cancer Research Conference, Montreal, QC, Canada, 8–10 November 2015. [Google Scholar]
  9. Lalani, S.; Cannell, A.; Xu, R.; Kato, D.; Arts, K.; Dancey, J.E. Trends in Academic Cancer Clinical Trials within the Canadian Cancer Clinical Trials Network (3CTN) National Trial Portfolio [Poster Presentation]. In Proceedings of the Society of Clinical Research Associates (SOCRA) 26th Annual Conference, Orlando, FL, USA, 6–8 October 2017. [Google Scholar]
  10. Kato, D.; Xu, R.; Sundquist, S.; Kovacevic, S.; Lalani, S.; Schoales, J.; Dancey, J.E. Canadian Cancer Clinical Trials Network (3CTN): Building Capacity in a Changing Academic Cancer Clinical Trials Landscape in Canada [Poster Presentation]. In Proceedings of the 2019 Canadian Cancer Research Conference, Ottawa, ON, Canada, 3–5 November 2019. [Google Scholar]
  11. Dilts, D.M.; Cheng, S.K. The importance of doing trials right while doing the right trials. Clin. Cancer Res. 2012, 18, 3–5. [Google Scholar] [CrossRef] [PubMed] [Green Version]
  12. Schoales, J.; Xu, R.; Kato, D.; Sundquist, S.; Pater, J.L.; Dancey, J.E. A novel and comprehensive framework for categorizing and evaluating the potential impact of academic cancer clinical trials [Poster Presentation]. In Proceedings of the 2019 Canadian Cancer Research Conference, Ottawa, ON, Canada, 2–3 November 2019. [Google Scholar]
  13. Stead, M.; Cameron, D.; Lester, N.; Parmar, M.; Haward, R.; Kaplan, R.; Maughan, T.; Wilson, R.; Campbell, H.; Hamilton, R.; et al. Strengthening clinical cancer research in the United Kingdom. Br. J. Cancer 2011, 104, 1529–1534. [Google Scholar] [CrossRef] [PubMed] [Green Version]
  14. Bentley, C.; Sundquist, S.; Dancey, J.E.; Peacock, S. Barriers to conducting cancer trials in Canada: An analysis of key informant interviews. Curr. Oncol. 2020, 27, e307–e312. [Google Scholar] [CrossRef] [PubMed]
Figure 1. 3CTN organizational framework.
Curroncol 28 00248 g001
Figure 2. Number of active Portfolio trials and patients recruited at adult member institutions. * Member institutions reported recruitment data as of 1 October 2014.
Curroncol 28 00248 g002
Figure 3. Interaction between core funding and time.
Curroncol 28 00248 g003
Table 1. Network site characteristics.
ParameterAnalysisResult
Sites by ProvinceN (% of total)
Alberta2 (4.1)
British Columbia5 (10.2)
Manitoba1 (2.0)
New Brunswick3 (6.1)
Newfoundland and Labrador1 (2.0)
Nova Scotia2 (4.1)
Ontario24 (49.0)
Prince Edward Island1 (2.0)
Quebec10 (20.4)
FundingN (%) Core Funded27 (55.1)
Site TypeN (%) NACC *35 (71.4)
SizeN (%) Large12 (24.5)
Medium8 (16.3)
Small29 (59.2)
Number of Clinical Trial StaffMedian (IQR) range5 (2.5–28.3), 0.4–280
* Network Affiliated Cancer Centres (NACC).
Table 2. Network site data and Portfolio trial composition analysis outcomes.
ParameterAnalysisPre-3CTN Baseline Year 4
Annual AccrualMedian (IQR), range21 (8–60), 1–39622 (9–85), 0–511
Accrual as % of BaselineMedian (IQR), rangeNA160 (−18.2, 175), 0–1200
Number of Academic Trials per SiteMedian (IQR), range7 (3–27), 0–9810 (5–30), 1–112
Accrual as % of TargetMedian (IQR), rangeNA106 (−45.5, 175), 0–611
Number of Sites that Met TargetN (%) YesNA25 (51.0)
Portfolio Trial Composition
Sample size per trialMedian (IQR), range154 (58–520), 5–5872150 (61–448), 9–164,946
Trials with sample size 500+N (%)2622
Number of Phase III trialsN (%)38.929.5
Number of Patients Recruited/TrialMedian (IQR), rangeNA42 (0–20), 0–265
pre-3CTN baseline is for the period of 1 April 2013–31 March 2014.
Table 3. Quarterly accrual at Network sites.
Time PeriodNMedian (IQR) AccrualMean AccrualSum Accrual across SitesMedian (IQR) % Change from Pre-3CTNN (%) ≥TargetMean (sd) Change from Pre-3CTNMedian (IQR) % Change from Pre-3CTN
Y1Q3364 (0.5–17.5)12.2440−29.3 (−94.9, 7.9)4 (11.1)−0.6 (5.1)−0.3 (2.5, 0.5)
Y1Q4363 (1–20)11.9430−28.2 (−63.6, 20.5)7 (19.4)−0.9 (8.3)−1.1 (−3.4, 1.4)
Y2Q1364 (1–14.5)15.65617.3 (−82.3, 69.3)12 (33.3)2.8 (10.8)0.5 (−1.9, 4.0)
Y2Q2364 (0.5–14.5)13.8498−16.7 (−92.6, 46.5)9 (25.0)1.0 (7.8)−0.3 (−2.3, 2.9)
Y2Q3474 (0–16)13.1618−34.6 (−100, 14.3)8 (17.0)0.3 (8.9)−0.3 (−2.8, 2.5)
Y2Q4486 (0–21.5)14.6701−5.6 (−100, 78.4)15 (31.3)1.9 (10.5)−0.3 (−2.0, 3.6)
Y3Q14910 (2–30)22.1108350.0 (−33.3, 180.7)25 (51.0)9.6 (17.8)3.5 (−0.3, 11.0)
Y3Q24911 (2–32)21.9107569.2 (−15.6, 200.0)29 (59.2)9.4 (17.8)1.5 (−0.8, 16.3)
Y3Q3499 (3–26)19.997633.3 (−16.3, 185.7)21 (42.9)7.4 (17.5)2.5 (−0.5, 8.5)
Y3Q4497 (1–22)20.198650.0 (−20.0, 204.8)25 (51.0)7.6 (21.2)1.0 (−0.3, 10.8)
Y4Q1498 (2–22)23.6115773.3 (−7.7, 234.8)28 (57.1)11.1 (22.8)3.5 (−0.5, 11.8)
Y4Q2496 (2–23)20.198635.5 (−45.9, 156.4)23 (46.9)7.6 (18.2)1.8 (−1.8, 8.5)
Y4Q3494 (1–15)17.284415.6 (−50.0, 100.0)20 (40.8)4.7 (15.4)0.5 (−2.8, 5.0)
Y4Q4494 (2–22)18.892014.3 (−40.0, 114.6)19 (38.8)6.3 (25.2)1.0 (−1.8, 3.5)
absolute change from pre-3CTN quarterly estimate.
Table 4. Prognostic factors of change in accrual (repeated measures) % change. No interaction between region and time (p = 0.80) in multivariable model.
FactorValueEstimate (SE)p-Value
Region Western Canada48.8 (65.8)0.023
Ontario136.7 (55.2)
Quebec5.6 (68.0)
Atlantic CanadaReference
Core FundingYes vs. No20.3 (38.2)0.6
Site Type *NACC vs. NCC120.9 (41.4)0.005
SizeLarge−138.1 (44.4)0.001
Medium−158.0 (51.7)
SmallReference
Number of Baseline Trials/Trial−3.2 (0.9)<0.001
Number of Trials Staff/Person−0.9 (0.5)0.052
Multivariable Analysis
Time Period/quarter17.2 (4.8)<0.001
Region Western Canada114.2 (67.9)0.029
Ontario160.2 (54.8)
Quebec49.5 (75.8)
Atlantic CanadaReference
Core FundingYes vs. No43.2 (48.5)0.38
Number of Baseline Trials/Trial−3.8 (0.9)<0.001
Region, Western Canada includes British Columbia, Alberta and Manitoba; Atlantic Canada includes Nova Scotia, New Brunswick, Newfoundland and Labrador, and Prince Edward Island. * Site type, Network Cancer Centre (NCC); Network Affiliated Cancer Centre (NACC).
Table 5. Prognostic factors of meeting Year 4 (1 April 2017–31 March 2018) accrual target.
FactorValueOdds Ratio (95% CI)p-Value
Region Western Canada1.5 (0.2, 13.2)0.44
Ontario3.5 (0.6, 21.8)
Quebec3.8 (0.5, 29.8)
Atlantic CanadaReference
Core FundingYes vs. No0.6 (0.2, 1.7)0.31
Site Type *NACC vs. NCC2.4 (0.7, 8.6)0.18
SizeLarge0.4 (0.1, 1.7)0.15
Medium0.2 (0.1, 1.2)
SmallReference
Number of Baseline Trials/Trial0.97 (0.94, 1.00)0.073
Number of Trials Staff/Person0.97 (0.93, 1.00)0.081
Multivariable Model
Region Western Canada2.2 (0.2, 23.6)0.44
Ontario4.4 (0.7, 29.3)
Quebec3.7 (0.3, 42.6)
Atlantic CanadaReference
Core FundingYes vs. No0.8 (0.2, 4.1)0.78
Number of Baseline Trials/Trial0.97 (0.94, 1.01)0.11
Region, Western Canada includes British Columbia, Alberta and Manitoba; Atlantic Canada includes Nova Scotia, New Brunswick, Newfoundland and Labrador, and Prince Edward Island. * Site type: Network Cancer Centre (NCC); Network Affiliated Cancer Centre (NACC).
Publisher’s Note: MDPI stays neutral with regard to jurisdictional claims in published maps and institutional affiliations.

